 Zhao Cai1
 Huang Chen2
 Jingqiao Bai1Yang Zheng1Jianhui Ma3
 Xiongwei Cai1Yu Liu1
 Kaitai Zhang1*Jianzhong Shou3*Yanning Gao1*
- 1State Key Laboratory of Molecular Oncology, Department of Etiology and Carcinogenesis, National Cancer Center/National Clinical Research Center for Cancer/Cancer Hospital, Chinese Academy of Medical Sciences and Peking Union Medical College, Beijing, China
- 2Department of Pathology, China-Japan Friendship Hospital, Beijing, China
- 3Department of Urology, National Cancer Center/National Clinical Research Center for Cancer/Cancer Hospital, Chinese Academy of Medical Sciences and Peking Union Medical College, Beijing, China
Background: Finding effective prognostic signatures is of great urgency due to the high risk of recurrence and progression of bladder cancer (BC). Although a lot of genetic alterations are involved in the carcinogenesis, none of them were referred in the current risk group stratifications. In this study, we aimed to find significant copy number variations (CNVs) to predict prognosis for BC patients.
Methods: CNVs with high aberration frequencies in BC were explored by array-based comparative genomic hybridization in 65 tumor samples. Candidates were validated in independent groups of BC tumor samples (n=219) and urine samples (n=123). 3D digital PCR was applied for detecting accurate gene copy numbers in BC urine. In order to explore the prognostic value of candidate CNVs, all enrolled patients were followed up for the disease-free survival (DFS). Cox proportional hazards regression analysis was performed to find the independent prognostic factors for DFS.
Results: CNVs of CEP63, FOSL2 and PAQR6 with high aberration frequencies (67.7%, 56.9% and 60.0%, respectively) were found in BC tumors. Copy numbers of CEP63, FOSL2 and PAQR6 were gained in 219 tumor samples. CNVs of CEP63 and FOSL2 were correlated with advanced tumor stage and high grade. Retrospective analysis (median follow-up time: 69 months) revealed that CNVs of CEP63 and FOSL2 were independent prognostic factors for DFS of non-muscle-invasive bladder cancer (NMIBC) patients, while CNVs of FOSL2 and PAQR6 were independent prognostic factors for DFS of muscle-invasive bladder cancer (MIBC) patients. Models for predicting DFS were constructed based on CNVs of three genes. Patients with high prognostic indexes tended to have poor DFS. Prognostic index can also help to identify those with worse outcomes among high risk NMIBC patients. Copy number gains of CEP63 and FOSL2 in urine were found to be significantly correlated with poor DFS of NMIBC patients.
Conclusions: CNVs of CEP63, FOSL2 and PAQR6 were capable of predicting DFS and may serve as promising signatures for prognosis of BC.
Introduction
Bladder cancer (BC) is the most common malignancy of the urinary tract, with approximately 550,000 newly diagnosed cases per year worldwide (1). Most BCs are urothelial carcinomas (2). Urothelial bladder cancer is classified into muscle-invasive bladder cancer (MIBC) and non-muscle-invasive bladder cancer (NMIBC) depending on whether the tumor invaded muscularis propria (3). Nearly 75% of BCs are NMIBCs (3). The standard treatment for NMIBC is transurethral resection of bladder tumor (TURBT), along with intravesical instillation of chemotherapy or vaccine-based therapy, followed by regular cystoscopy (4). The 5 year rates of tumor recurrence ranged from 50% to 70%, while the 5 year rates of progression ranged from 10% to 30% in NMIBC patients (3). It is reported (5) that high risk NMIBC patients (high grade Ta tumors, T1 tumors, carcinoma in situ or multiple, recurrent, and large (>3 cm) low grade Ta tumors) had a risk of 78% in recurrence and a risk of 45% in progression over 5 years. Those patients at high risk required correct treatment decision and should be paid more attention to on their surveillance. However, therapy strategies for high risk BC patients were still in debate. The prognosis prediction can be of great help for clinical decision making on treatment and surveillance practices. Approximately 25% of BCs are MIBCs (6), including those with distant metastasis, regularly treated by radical cystectomy, chemotherapy or radiotherapy (7). Approximately 50% of MIBC patients develop distant metastases, despite having received the standard therapy of radical cystectomy with pelvic lymph node dissection (PLND) (8).
The high recurrence nature of bladder cancer has urged researchers to pursue an efficient prognostic predictor for evaluating the risk. Despite the fact that current histopathologic classification has given rise to improvement in clinical management, evaluating the risk of recurrence still remains a challenge. Although various urinary markers based on different kinds of technologies have been recently developed, such as nuclear matrix protein-22 (NMP-22), bladder tumor antigen (BTA)-Stat, BTA-TRAK, and DD23 (9–11), none of these have been accepted as prognostic indicators in clinical guidelines, as their utility in predicting the prognosis of individual patients is not clear yet (4). However, evaluating recurrence or progression risk and assessing prognosis is critical since a delay in therapy can be life-threatening, especially for high-grade NMIBC and MIBC patients (12). Therefore, novel prognostic signatures, which are both effective for prognosis prediction and convenient for detection, are in urgent need.
Variations in gene copy number are commonly regarded as a source of difference in the genome sequences across individuals (13). As an initiative factor of genetic evolution and phenotypic variation, copy number variations (CNVs) present at the rate of 4.8%-9.5% (13) of the variability in the human genome. Other than benign polymorphic variants, CNVs are known to be associated with malignancies. Extra or missing copies of protein-coding genes or regulatory regions alter gene dosage and are related to various types of cancers (14).
BC, known for its high recurrence and metastasis rate, is characterized by a large number of genetic alterations involved in tumor development (15). However, the current risk group stratifications were still depending on clinical parameters such as recurrence history, tumor size, tumor number, histologic type, grade and stage (4, 7, 9), without any cancer related genetic alterations included.
In this study, we explored the CNVs with high aberration frequencies (>50%) from array-based comparative genomic hybridization (array CGH) data and validated in an independent group of 342 BC samples (including 219 tumor samples and 123 urine samples) by real-time polymerase chain reaction (PCR). 5 CNVs with high aberration frequencies were selected to explore their prognostic value in BC (Figure 1). The retrospective analysis of disease-free survival (DFS) was performed on all enrolled patients. Since there is a small amount of tumor cell DNA in urine, we adopted the highly sensitive 3D digital PCR to detect candidate CNVs in urine samples, to provide a simple and fast method for detection in clinical practice.
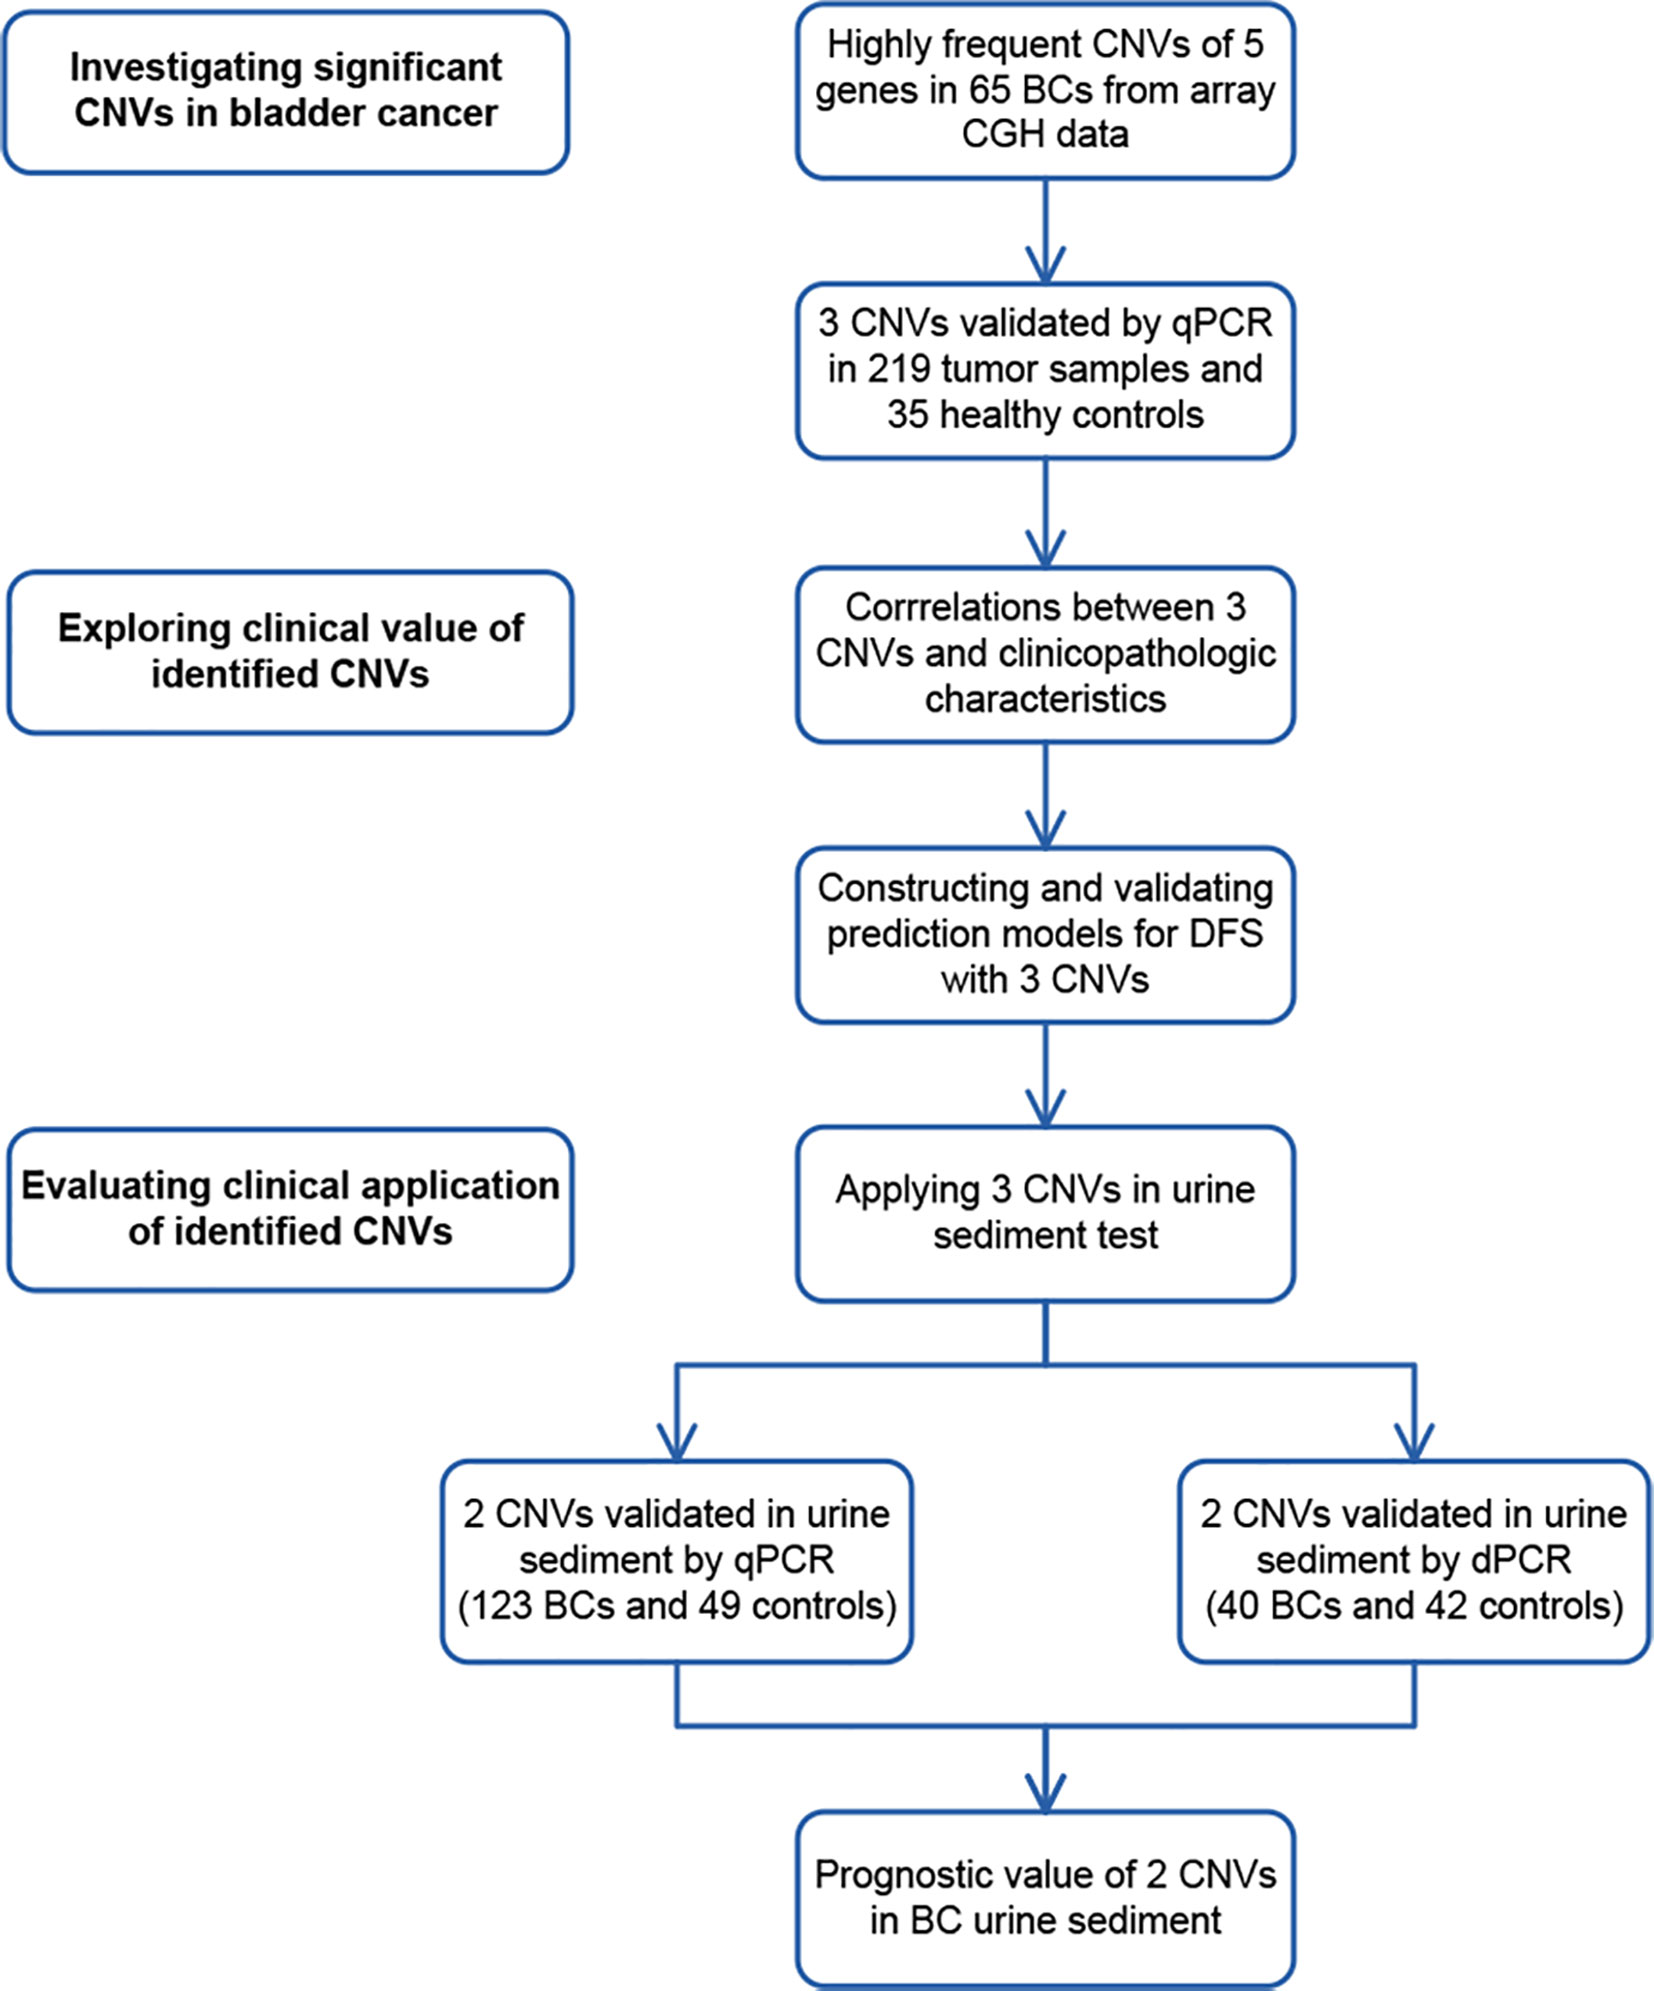
Figure 1 Study design. To discover significant copy number variations (CNVs), CNVs of 5 genes with high aberration frequencies were selected from array comparative genomic hybridization (CGH) data. Copy number gains of 3 genes were found in tumor samples by real-time PCR (qPCR). To explore their clinical value, correlations between the CNVs of 3 genes and clinicopathological characteristics were analyzed. CNVs of 3 genes were later applied in constructing and validating prediction models in 219 bladder cancer (BC) cases. To evaluate their potential clinical application, CNVs of 2 genes were validated by real-time PCR in 123 BC urine sediment samples and 49 healthy control samples. They were also validated by digital PCR (dPCR) in 40 BC urine and 42 healthy control samples. The prognostic value of 2 CNVs was further assessed in 123 urine samples.
Materials and Methods
Patients and Samples
This study (CH-BMS-013) was approved by the Cancer Hospital, Chinese Academy of Medical Sciences Clinical Research Ethics Committee. Informed consent was obtained from all participants.
320 BC patients who were admitted to Cancer Hospital, Chinese Academy of Medical Sciences from July 1998 to March 2012 were enrolled in this study.
The inclusion criteria were as follows. (1) Patients were newly diagnosed and received treatment in Cancer Hospital, Chinese Academy of Medical Sciences. (2) The histopathological diagnoses of tumor were urothelial carcinoma of the bladder. The exclusion criteria were as follows. (1) Patients who received any neoadjuvant treatment before surgery were excluded. (2) Patients who had upper tract urothelial carcinoma or a history of upper tract urothelial carcinoma were excluded. (3) Patients who had a known history of other malignancy were excluded.
Tumor samples were staged and graded by a urological pathologist referring to the International Union Against Cancer (UICC) 2002 TNM staging system (16) and the World Health Organization (WHO) 2004 classification system (17), according to which carcinoma in situ and Ta–T1 stage was non-muscle-invasive cancer and T2–T4 stage was muscle-invasive cancer.
The tumor group included 219 cases with fresh-frozen tumor tissue samples. The urine group included 123 cases with preoperative urine sediment samples, among which 22 cases had both tissue and urine sediment samples. These 123 urine sediment samples were tested by real-time PCR. 40 of the 123 samples with DNA left after real-time PCR were further tested by 3D digital PCR. The clinicopathological characteristics of patients are outlined in Table 1.
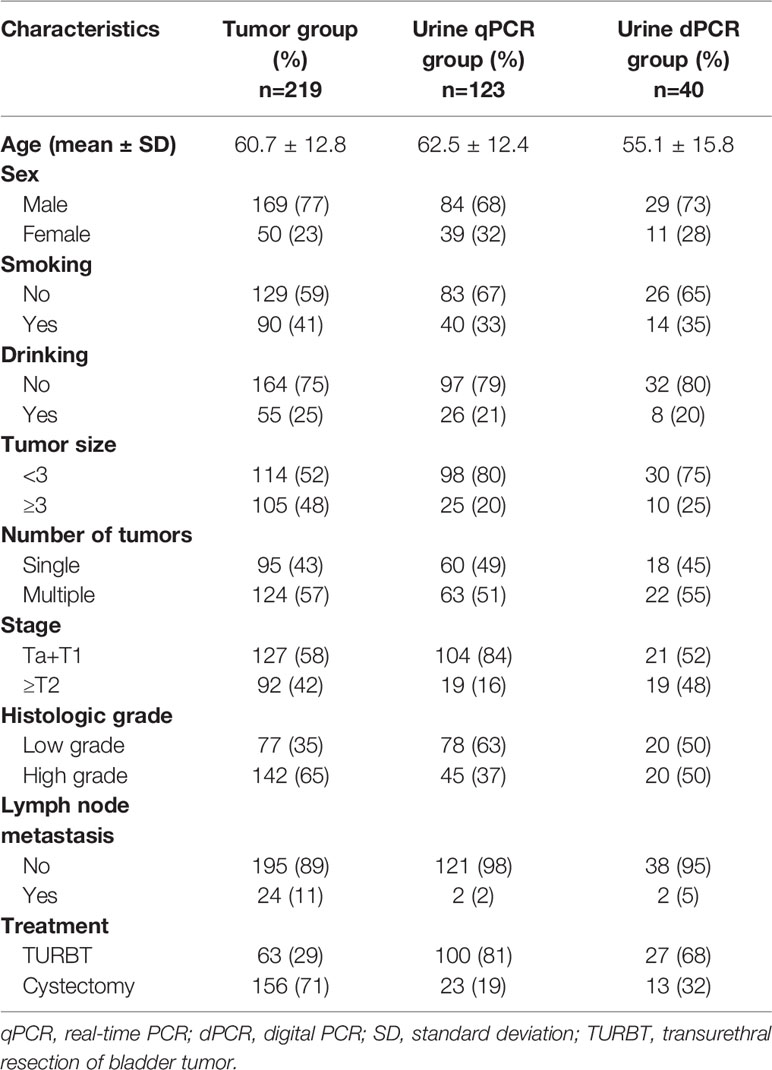
Table 1 Clinicopathological characteristics of bladder cancer patients.
All 320 newly diagnosed patients were followed up for disease-free survival (DFS). The disease-free survival (DFS) in our study was defined as the period after a successful treatment during which there were no signs and symptoms of the recurrence or metastasis for NMIBC patients. For MIBC patients, the DFS was defined as the period after a successful treatment during which there were no signs and symptoms of the metastasis of tumor. For patients who had tumor recurrence or metastasis for many times, the DFS refers to the period before the first recurrence or metastasis.
35 blood samples from Chinese healthy donors were used as the control group for detecting CNVs of the 5 candidate genes in BC tissue. 91 urine sediment samples from donors without urinary tumors served as the control group for detecting CNVs in the urine.
Fresh-frozen tissue surgically resected from primary bladder tumors were obtained from patients who underwent standard treatment (4) including TURBT or cystectomy. The tissue was cleaned with saline and stored within 1 hour after removal at −80°C until use.
First morning urine samples of 200–500 ml were collected from BC patients on the date of surgery. The urine samples were centrifuged at 3000 × g for 20 minutes at 4°C and the sediments were stored at −80°C for DNA extraction. Blood samples of healthy donors were centrifuged to separate the plasma and blood cells within 1 hour after collection. Peripheral blood leukocytes were isolated using Erythrocyte Lysis Buffer (Qiagen, Germany) and frozen at –80°C until use.
DNA Extraction
Fresh-frozen tissue and urine sediment DNA was extracted using QIAamp DNA Micro Kit #56304 (Qiagen, Germany). Blood sample DNA was extracted using DNeasy Blood & Tissue Kit #69506 (Qiagen, Germany). All procedures were performed according to the manufacturer’s protocol.
Array-Based Comparative Genomic Hybridization
We performed array CGH on fresh-frozen tumor samples of 65 bladder cancer cases using human Genome CGH Microarray Kits, 4x44K #G4413A (Agilent Technologies, Santa Clara, CA, USA). All procedures were performed by the manufacturer’s instructions.
The chips were scanned on an Agilent G2565BA DNA Microarray Scanner. Image analysis was carried out by Feature-Extraction v.10.5.1.1 software (Agilent Technologies, Santa Clara, CA, USA). The array CGH data (GSE164743) had been uploaded on Gene Expression Omnibus (GEO).
Real-Time Polymerase Chain Reaction (PCR)
Primers for real-time PCR were designed using Primer Premier 5.0 (Premier Biosoft International, Palo Alto, CA, USA). Primer sequences are shown in Table 2. Real-time PCR was performed using Mx3005p™ real-time PCR system (Agilent Technologies, Santa Clara, CA, USA). Each sample was tested in triplicate.
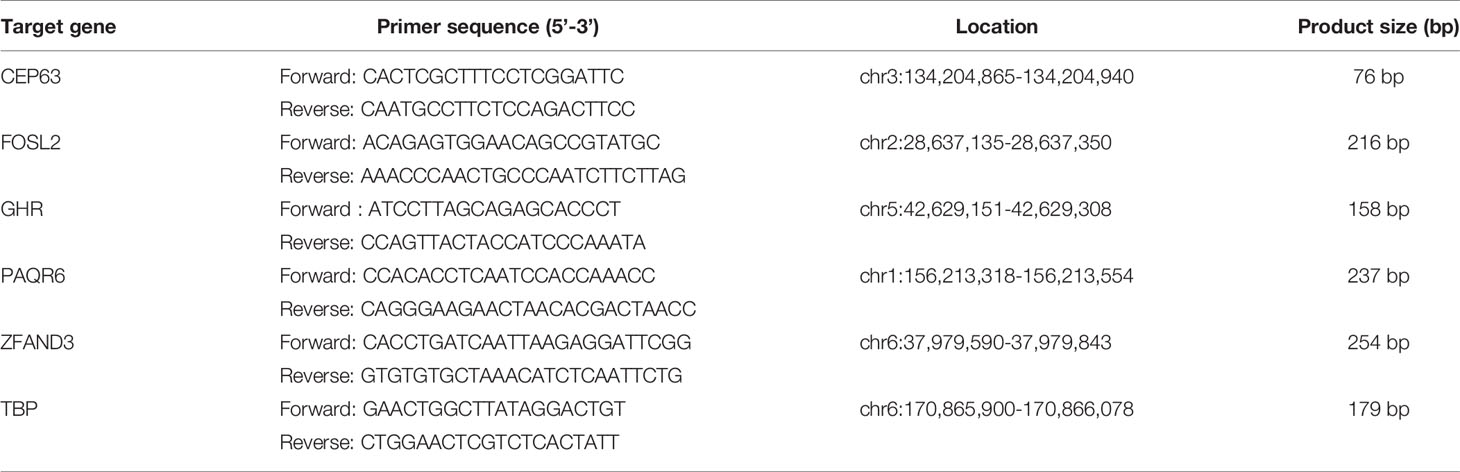
Table 2 Sequence of primers for real-time fluorescence quantitative PCR to detect the CNVs of candidate genes.
Each reaction contained 20ng genomic DNA, 10μM paired primers, 0.5μl ROX Reference Dye II (50×) and 12.5μl SYBR® Premix ExTaq™ (2×) (Takara Bio, Japan). After an initial denaturation step at 95°C for 10 sec, the amplifications were carried out with 45 cycles at a melting temperature of 95°C for 5 sec and an annealing temperature of 60°C for 20 sec. The specificity of the real-time PCR products was evaluated by melting curve analysis. TBP showed no variation in array CGH data and was therefore selected as the reference gene.
3D Digital PCR
3D digital PCR was performed using the QuantStudio™ 3D Digital PCR System (Applied Biosystems, Foster City, CA, USA). Copy numbers of target genes were detected using TaqMan® Copy Number Assay and TaqMan® Copy Number Reference Assay (Thermo Fisher Scientific, USA). Both assays were run simultaneously in a duplex PCR reaction.
14.5μl of reaction mixtures containing the 10ng DNA, 2×Mastermix, 20×Copy Number and 20×Reference Assay was loaded on the 3D Digital PCR Chip v2 and was performed PCR using the ProFlex™ 2x Flat PCR System. After an initial denaturation step at 96°C for 10min, the amplifications were carried out with 40 two-step cycles at 60°C for 2 min and 98°C for 30s and then an annealing step at 60°C for 2 min.
After PCR amplification, the chip was read by QuantStudio™ 3D Digital PCR Instrument. The fluorescent signals were further analyzed by QuantStudio™ 3D AnalysisSuite™ software.
Data Analysis
Agilent Genomic Workbench 7.0 (Agilent, Santa Clara, CA, USA) was used for analyzing array CGH data. The Aberration Detection Method 1 (ADM-1) algorithm was adopted to identify DNA CNVs. The ADM-1 algorithm can identify the aberrant intervals with consistently high or low log-ratios based on the statistical score. A threshold of 6.0 was used according to the instruction manual. An aberration filtering option of a minimum of 3 probes in each region and the absolute average log2 ratio>0.25 was applied. Diploid centralization and the GC correction algorithm were used for data normalization. The University of California Santa Cruz (UCSC) human genome assembly hg19 was used as a reference. The genes with high aberration frequencies (>50%) were validated by subsequent real-time PCR. The copy number ratios relative to TBP of the candidate genes detected by real-time PCR were calculated using the comparative cycle threshold (Ct) 2−ΔΔCt method.
Raw fluorescence data of 3D Digital PCR Chip v2 was read by the 3D Digital PCR Instrument. The ratio of FAM : VIC (ratioFAM/VIC) representing the adjusted copy number of target genes was calculated using the Poisson distribution by the QuantStudio™ 3D AnalysisSuite™ software (Supplementary Figure 1). To maximize the detection of copy number imbalance, ratios of candidate gene/TBP (ratiocandidate/TBP) were calculated indirectly by dividing candidate gene ratioFAM/VIC by TBP ratioFAM/VIC.
Statistical analysis was conducted using SPSS Statistics 25.0 (IBM Corp., Armonk, NY, USA). A p-value <0.05 on a two-sided test was considered significant. The Kolmogorov-Smirnov test was used to assess the normality of the data distribution. The group differences of continuous variables were assessed using the non-parametric Mann–Whitney U test (for non-normal distributions) and Student’s t-test (for normal distributions). Pearson’s χ2-test was used for categorical values. Bar graphs were drawn by GraphPad Prism 5 (San Diego, USA).
The cumulative incidence of copy number ratios and DFS, stratified by tumor stage, was plotted using Kaplan–Meier curves on “R” computing environment version 3. 6. 0 (18) (R Foundation for Statistical Computing, Vienna, Austria). The R package “survminer” was used to determine the optimal cutoff point for copy number ratios of identified genes in the survival analysis. The log-rank test was applied to assess the differences in DFS. Hazard ratios (HRs) for tumor recurrence or progression were calculated using univariate and multivariate Cox proportional hazards regression analysis with the forward logistic regression method. The proportional hazards assumption was satisfied (p>0.05) for variables in the Cox regression analysis for NMIBC and MIBC.
Results
Discovering Significant CNVs in BC
Investigating CNVs With High Frequencies From Array CGH Profiling
The array CGH data of 65 BC tumor samples (GSE164743) were used to explore CNVs with high aberration frequencies. A total of 108 gained fragments (length>1kb) and 279 lost fragments (length>1kb) were found in tumor samples (log2 ratio>0.25, Supplementary Tables 1, 2). 5 genes located on 5 fragments with high aberration frequencies (>50%) were selected as candidate genes for validation. The 5 genes were CEP63, FOSL2, GHR, PAQR6 and ZFAND3 (Table 3). Gains of copy numbers was found in 4 genes (CEP63, GHR, PAQR6 and FOSL2). Deletion of copy numbers was found in 1 gene (ZFAND3). TBP, with no copy number change in the array CGH data, was selected as an internal reference gene for subsequent real-time PCR validation.
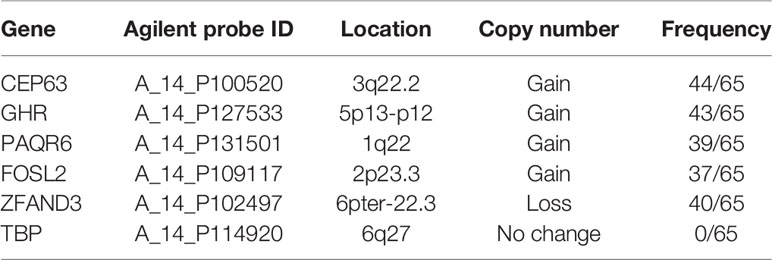
Table 3 Candidate genes selected from array CGH profiling for validation.
Real-Time PCR Validation for CNVs of Candidate Genes
We performed real-time PCR on 219 fresh-frozen tumor tissue samples to validate CNVs of 5 candidate genes selected from the array CGH data. Peripheral blood samples from 35 healthy donors were used as the control. Results showed that compared with the control group, copy numbers of 3 genes, CEP63 (p<0.01), FOSL2 (p<0.01) and PAQR6 (p<0.01) were significantly gained in tumor tissues (Figure 2).
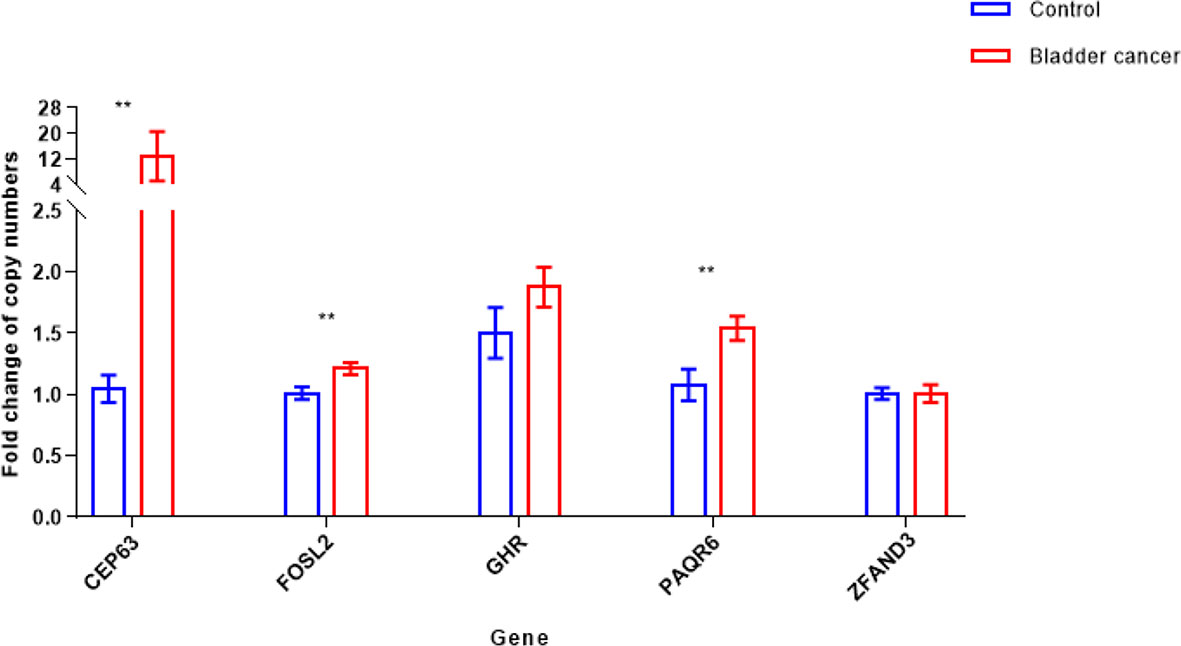
Figure 2 Copy number variations [mean with 95% confidence interval (CI)] of 5 candidate genes in bladder cancer tumor and control samples (**p < 0.01). Copy numbers of CEP63, FOSL2 and PAQR6 were significantly gained in 219 tumor tissue samples, determined by Mann-Whitney U test.
Analyzing the Clinical Value of Identified Candidate Gene CNVs
Correlations Between Identified CNVs and Clinicopathological Characteristics
To evaluate the clinical significance of CEP63, FOSL2 and PAQR6 CNVs, we analyzed the correlations between CNVs of 3 genes and the clinicopathological characteristics of the 219 BC patients (Table 4). Among the 219 cases, there were 127 NMIBC cases and 92 MIBC cases. The copy numbers of CEP63 and FOSL2 were significantly different (p<0.01 and p<0.01, respectively) between the NMIBC and MIBC groups. Copy number gains of CEP63 and FOSL2 were correlated with advanced tumor stage and high tumor grade (p<0.01 and p=0.047, respectively). Copy number gains of CEP63 were also associated with positive lymph node metastasis (p<0.01). Copy numbers of PAQR6 were gained in BC but had no significant correlations with clinicopathological characteristics. No significant correlations between the CNVs of 3 genes and age, sex were found.
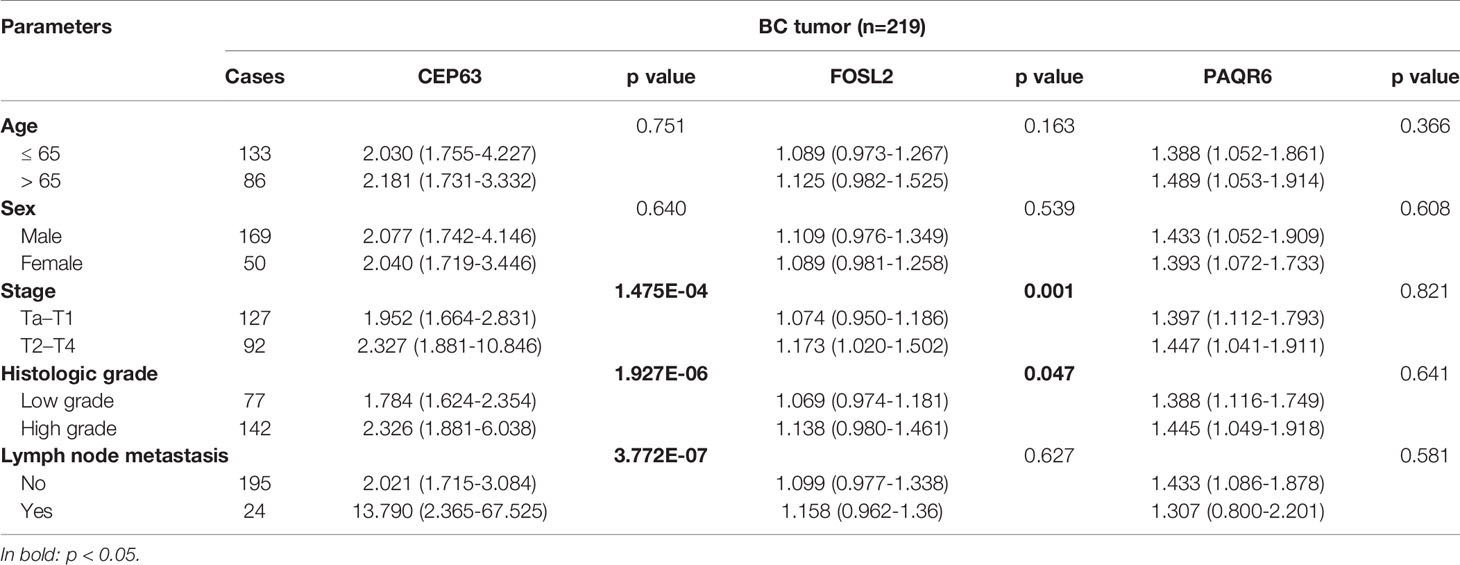
Table 4 Correlation between 3 CNVs and clinicopathological characteristics of 219 BC patients [median (interquartile range)].
Correlations Between Identified CNVs and Disease-Free Survival (DFS)
To explore the prognostic value of 3 identified genes, CEP63, FOSL2 and PAQR6, all enrolled 320 patients were retrospectively analyzed for their DFS. The overall median follow-up time for 320 patients was 61 months, ranging from 3 to 188 months. The overall DFS for 320 patients at 5 and 10 years was 48.3% and 22.7%, respectively.
The median follow-up time for 219 patients with tumor samples was 69 months. 16 NMIBC patients and 16 MIBC patients were censored. The following survival analysis was stratified by NMIBC and MIBC. The median follow-up time for 111 NMIBC patients was 53 months, while the median follow-up time for 76 MIBC patients was 102 months.
Kaplan–Meier tests were performed to analyze the correlations between the CNVs and DFS in 111 NMIBC and 76 MIBC patients. Results showed that NMIBC patients with copy number gains of CEP63 (copy number ratio>2.82) and FOSL2 (copy number ratio>0.95) had a significantly poorer DFS (p=0.00052 and p=0.0011, respectively, Figure 3). MIBC patients with copy number gains of FOSL2 (copy number ratio>0.99) and PAQR6 (copy number ratio>0.78) had a significantly poorer DFS (p<0.0001 and p<0.0001, respectively, Figure 3).
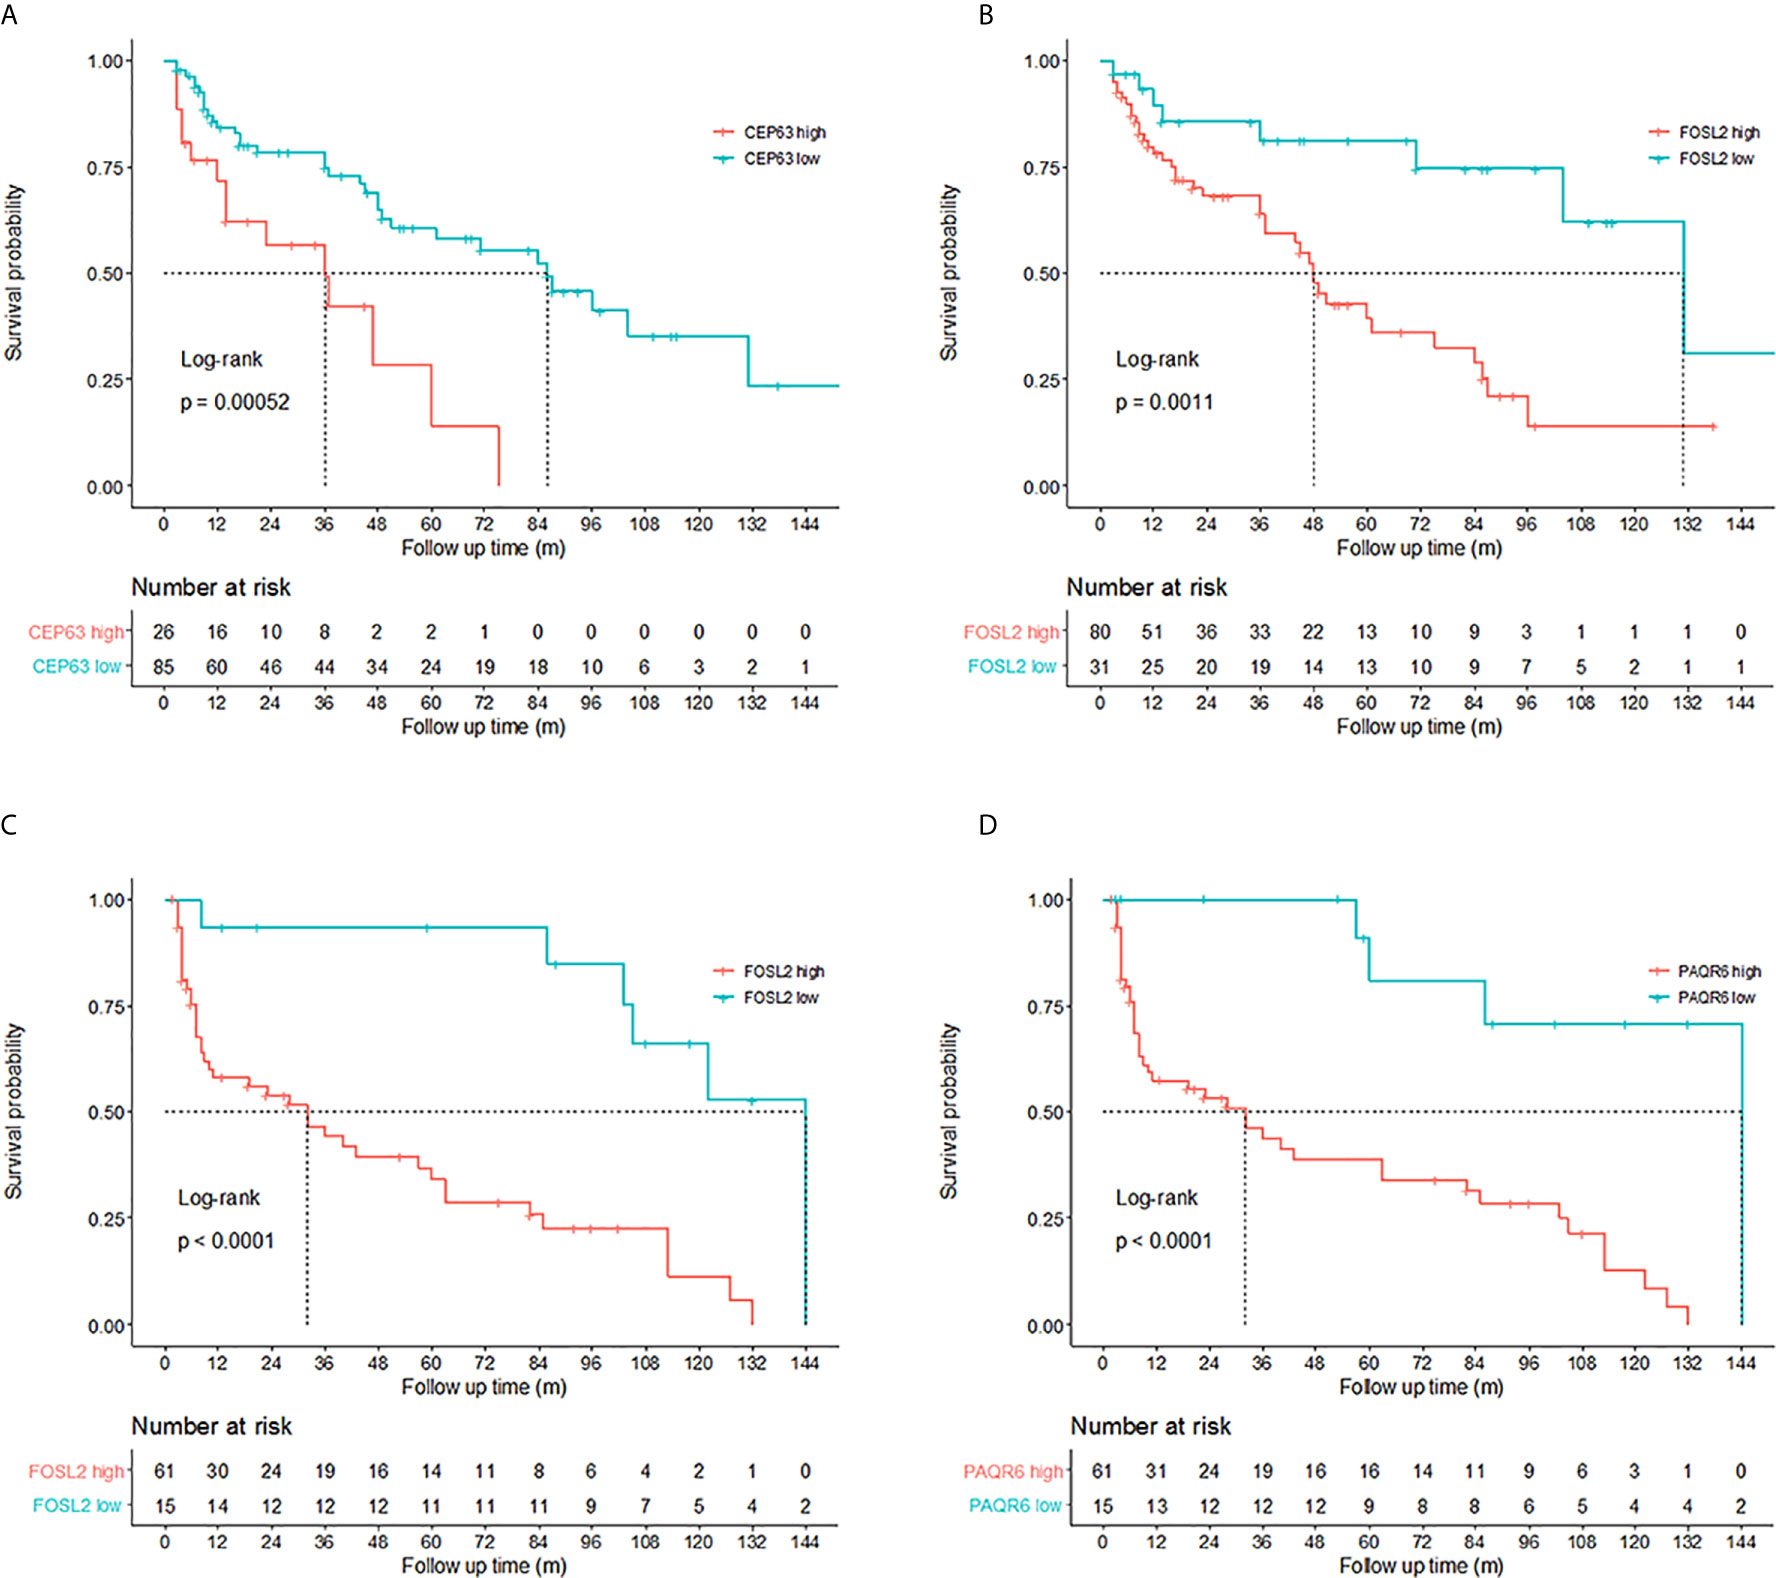
Figure 3 Prognosis prediction by 3 identified genes. Kaplan–Meier curves revealed that copy number gains of (A) CEP63 and (B) FOSL2 were related to poor disease-free survival (DFS) in non-muscle-invasive bladder cancer (NMIBC) patients (log-rank test, p<0.01). Cutoff points of copy number ratios relative to TATA-box binding protein (TBP) gene were 2.82 and 0.95 for CEP63 and FOSL2, respectively. Copy number gains of (C) FOSL2 and (D) PAQR6 were related to poor DFS in muscle-invasive bladder cancer (MIBC) patients (log-rank test, p<0.01). Cutoff points of copy number ratios of FOSL2 and PAQR6 were 0.99 and 0.78, respectively.
Univariate Cox proportional hazards regression analysis revealed the significant correlations between the DFS of NMIBC patients and CNVs of CEP63 (p=0.001) and FOSL2 (p=0.003). Multivariate analysis showed that CNVs of CEP63 (p=0.002) and FOSL2 (p=0.004) were independent prognostic factors for the DFS of NMIBC patients (Table 5). Significant correlations were found between the DFS of MIBC patients and CNVs of FOSL2 (p=0.0002) and PAQR6 (p=0.001) by univariate analysis. Multivariate analysis revealed that CNVs of FOSL2 (p=0.022) and PAQR6 (p=0.024) were independent prognostic factors for DFS of MIBC patients (Table 5).
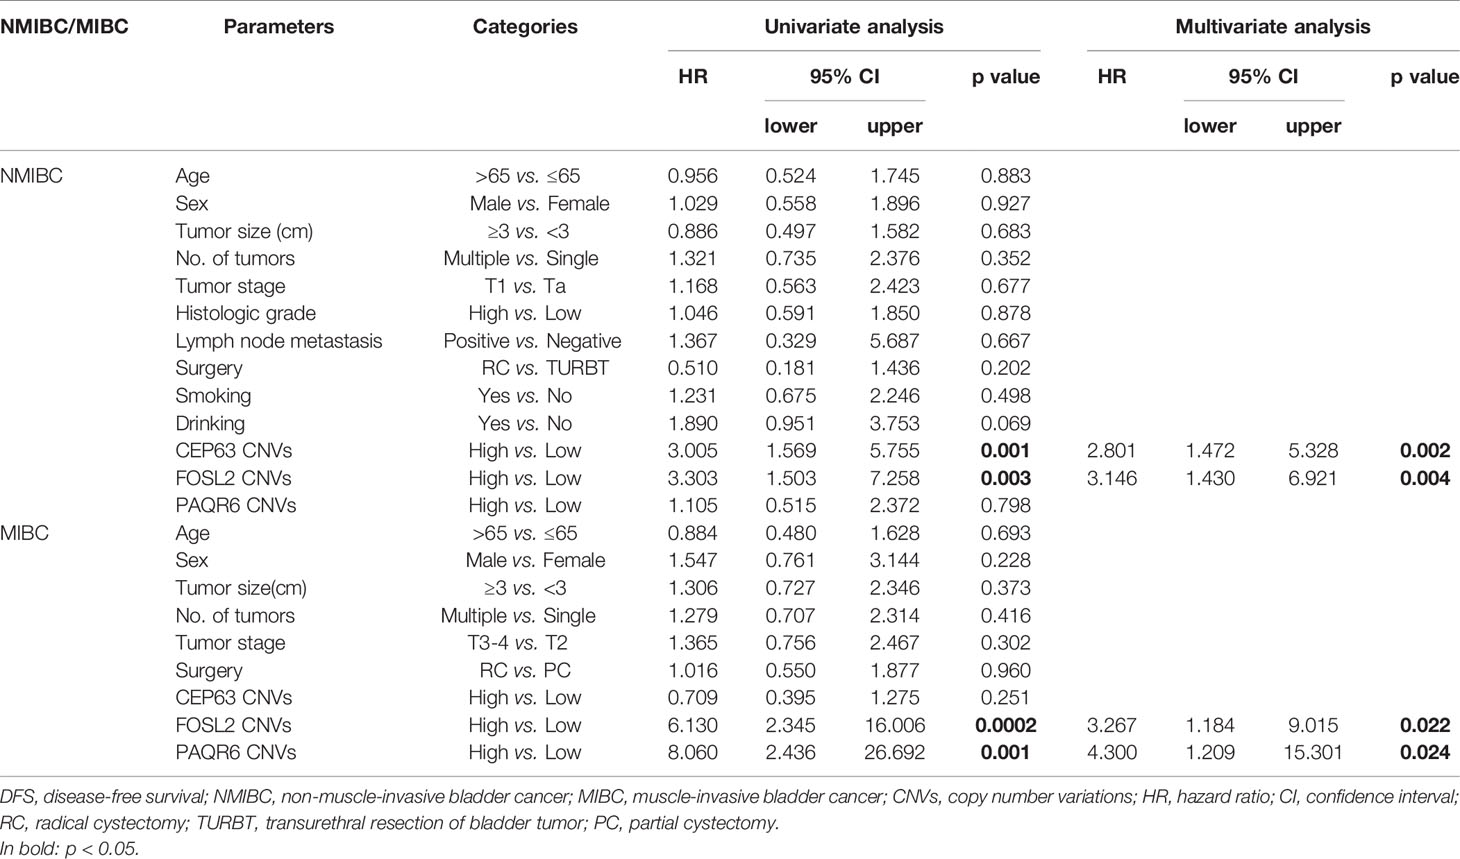
Table 5 Univariate and multivariate Cox proportional hazard regression analysis for DFS prediction in NMIBC and MIBC patients.
Prediction Models for the DFS of NMIBC and MIBC Patients
In order to construct prediction models for DFS, we randomly divided NMIBC and MIBC patients into training sets and test sets (Table 6). No differences were found between the training set and test set in terms of clinical parameters including age, sex, smoking, drinking, tumor size, tumor number, histologic grade and lymph node metastasis. Independent prognostic factors from multiple Cox regression analysis were used to construct prediction model equations in the NMIBC training set (n=56) and the MIBC training set (n=45). The prognostic index (PI) was applied for assessing the risk of recurrence for NMIBC and the risk of progression for MIBC. NMIBC and MIBC patients with high PIs had poorer DFS (p<0.05 and p<0.01, respectively) compared with those with low PIs (Figure 4).
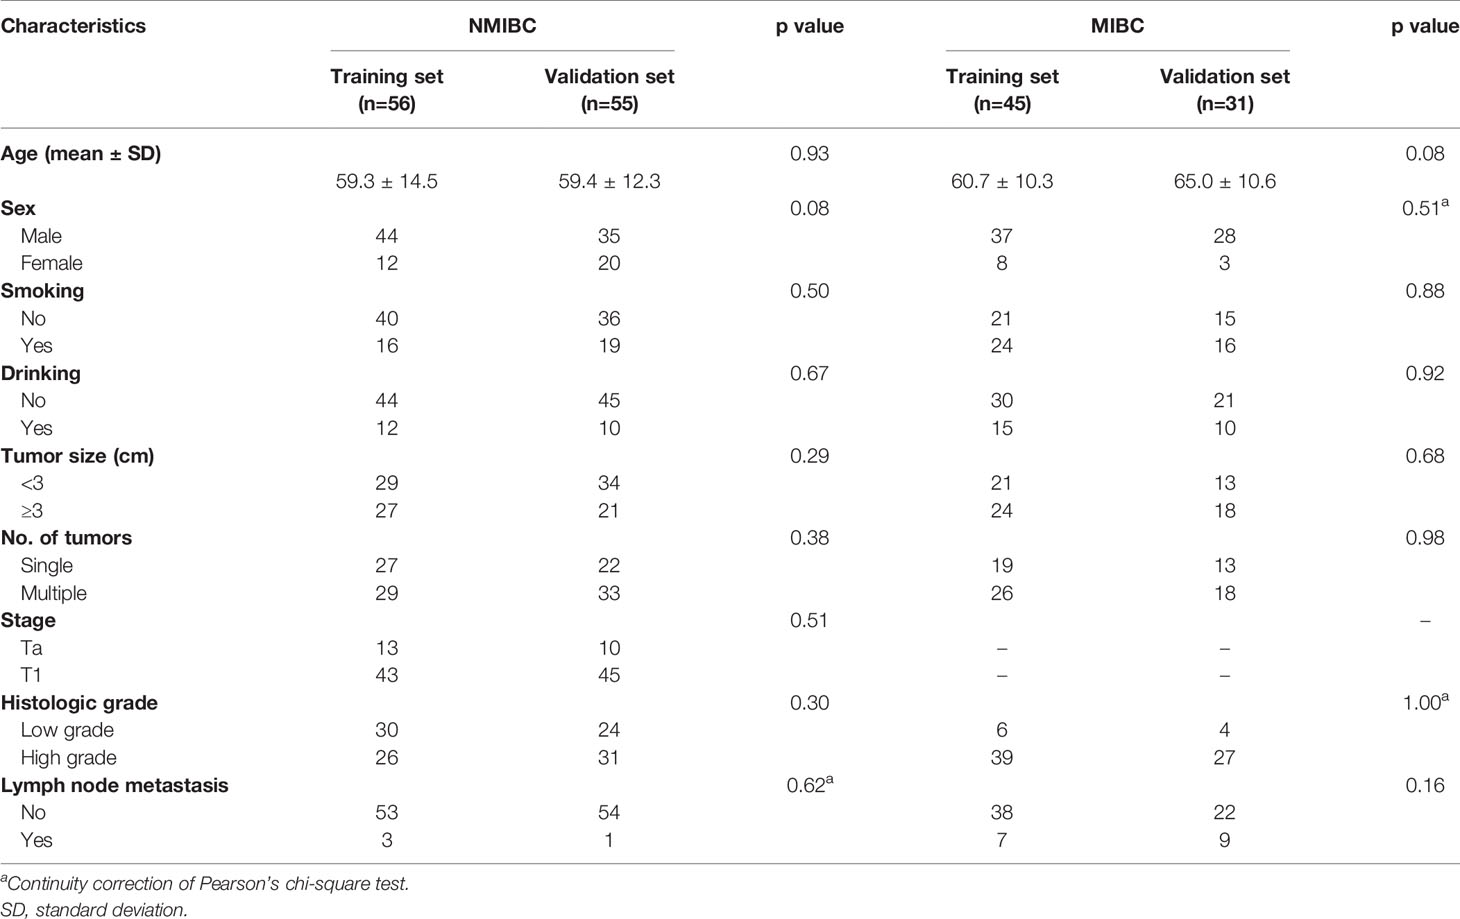
Table 6 Clinicopathological characteristics of BC patients in the prediction model.
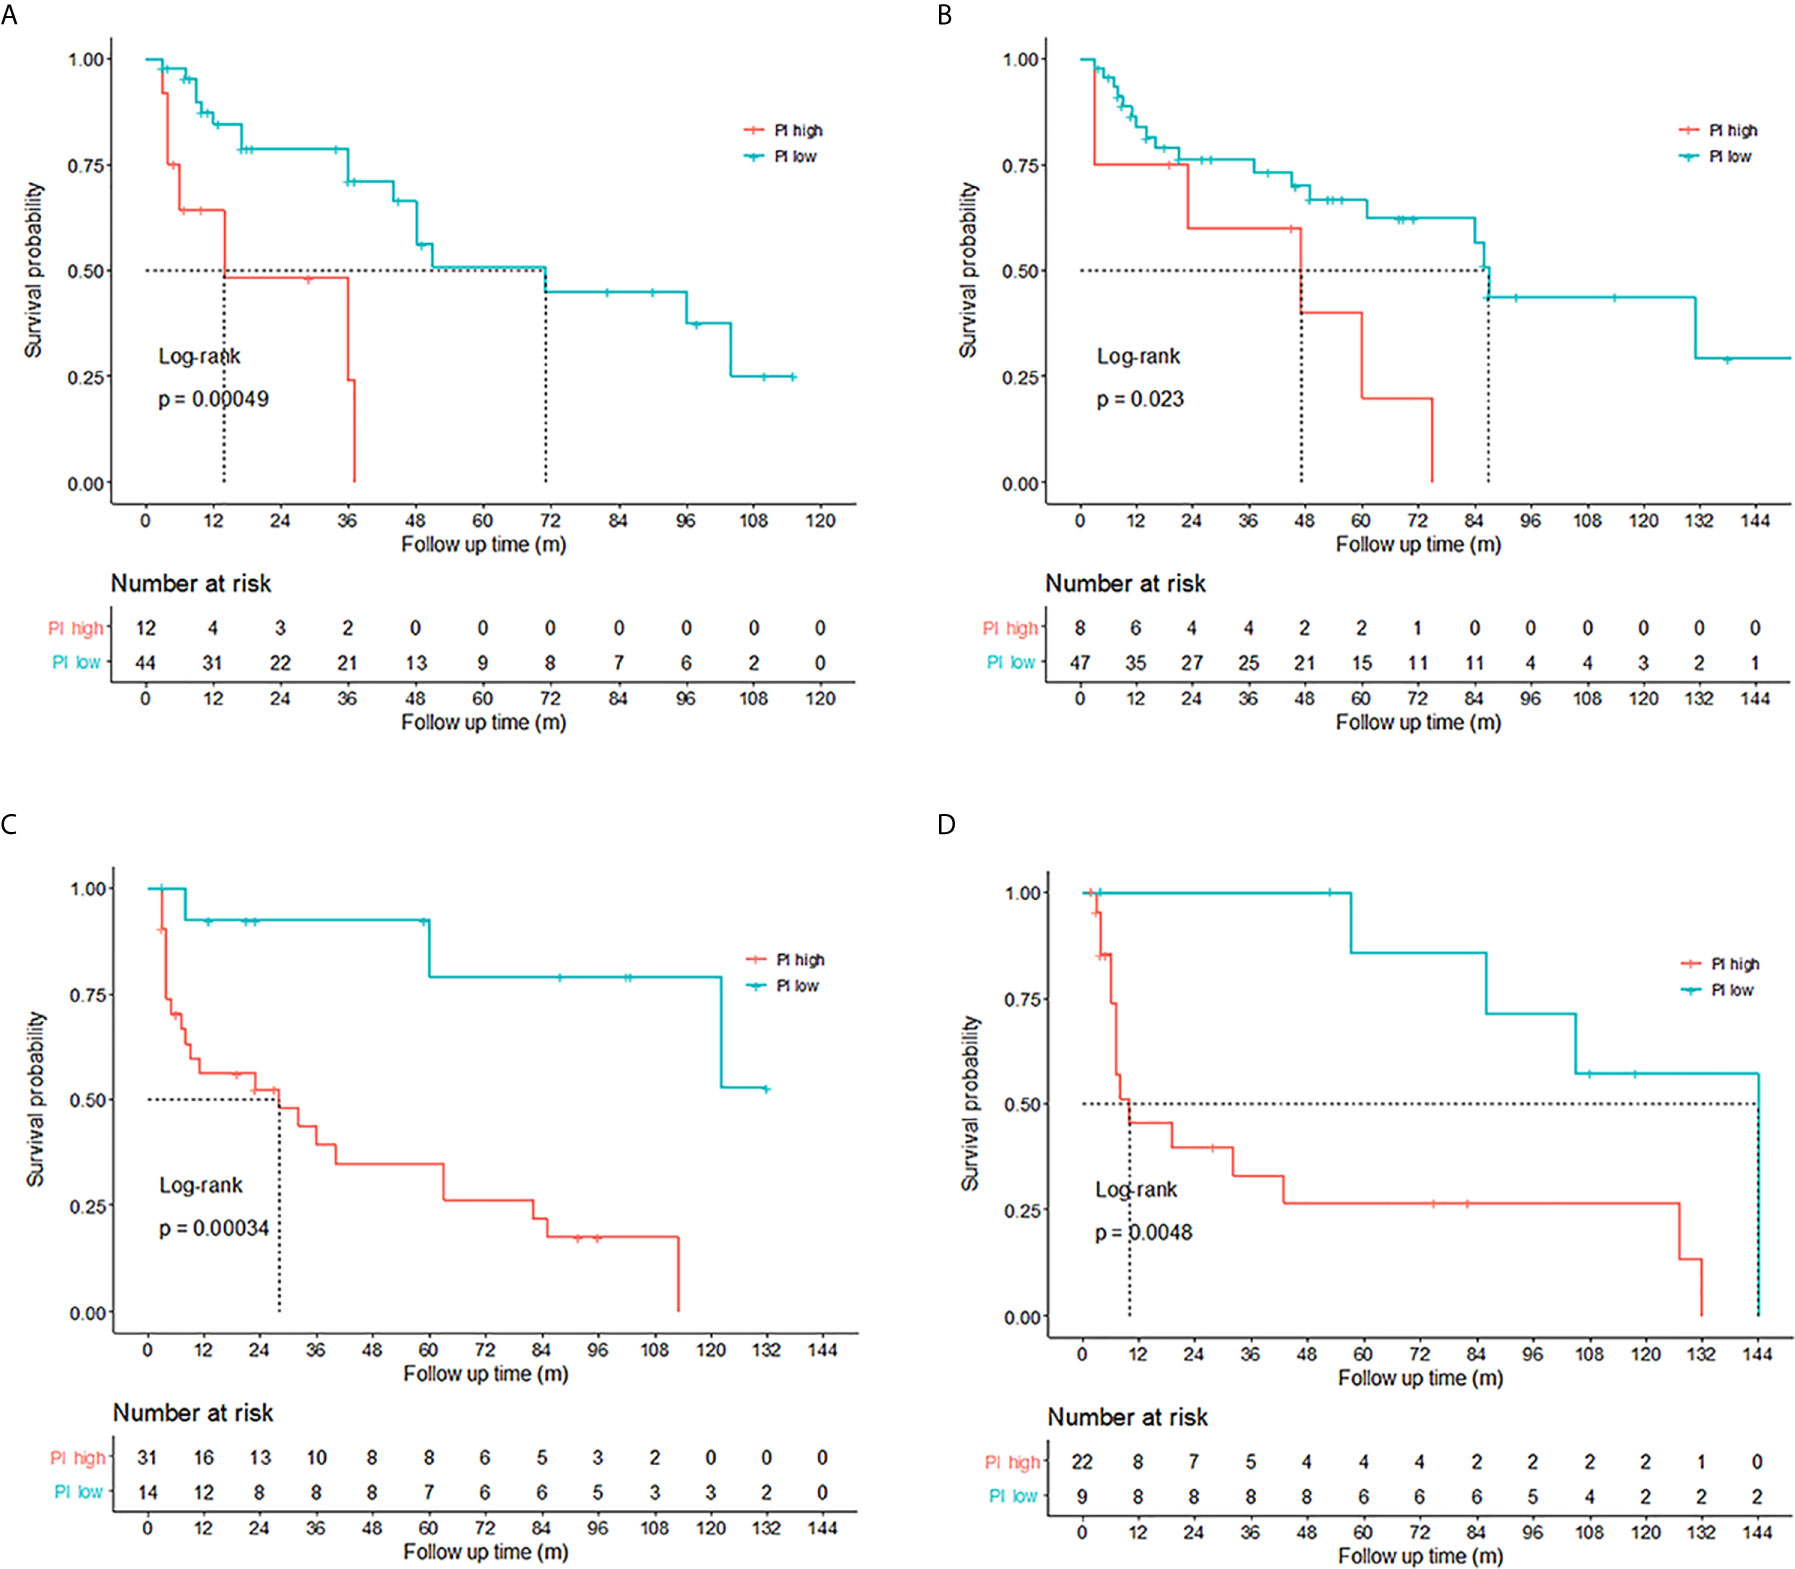
Figure 4 Validation of the prediction models for non-muscle-invasive bladder cancer (NMIBC) and muscle-invasive bladder cancer (MIBC). High prognostic index (PI) (PI>1.5095) indicated poor disease-free survival (DFS) (p<0.05) for NMIBC patients in the (A) training set (n=56) and (B) validation set (n=55). MIBC patients with PIs higher than 2.2079 tended to have poorer DFS (p<0.01) in the (C) training set (n=45) and (D) validation set (n=31). The differences between the high PI group and the low PI group were assessed by the log-rank test.
The prediction model equation for NMIBC was as follows: copy number ratios of CEP63 were categorized as 1 if higher than the cutoff point of 2.82; otherwise, they were categorized as 0. Copy number ratios of FOSL2 were categorized as 1 or 0, using a cutoff point of 0.95. The p value of the likelihood ratio was 0.002.
The prediction model equation for MIBC was as follows: copy number ratios of FOSL2 were categorized as 1 or 0, using a cutoff point of 0.99. Copy number ratios of PAQR6 were categorized as 1 or 0, using a cutoff point of 0.78. The p value of the likelihood ratio was 0.0001.
The cutoff point of the PI was 1.5095 for NMIBC and 2.2079 for MIBC, which meant when the copy numbers of the 2 genes in the equation were both gained (copy number ratios higher than the cutoff points), the patient tended to have a poorer DFS. The prediction models were subsequently validated in the NMIBC validation set (n=55) and MIBC validation set (n=31). It was shown that NMIBC and MIBC patients with high PIs tended to have poor prognosis (p<0.01 and p<0.01, respectively, Figure 4).
Prognosis Prediction for High Risk NMIBC Patients
According to the risk group stratification in European Association of Urology Guidelines on NMIBC (19), patients with any of the following were at high risk: T1 tumor; G3 (high grade) tumor; carcinoma in situ, multiple, recurrent and large (>3 cm) Ta G1G2/low grade tumors (all features must be present). Among the 111 newly diagnosed NMIBC patients in our study, there were 98 patients at high risk and 13 patients at low or intermediate risk. Kaplan–Meier tests were performed to analyze the correlation between the PIs and DFS of 98 patients at high risk. The results showed that among the high risk NMIBC patients, those with high PIs had shorter DFS (p=0.00056), indicating that the PIs calculated by the prediction model can also be of help on predicting prognosis for high risk NMIBC patients (Figure 5).
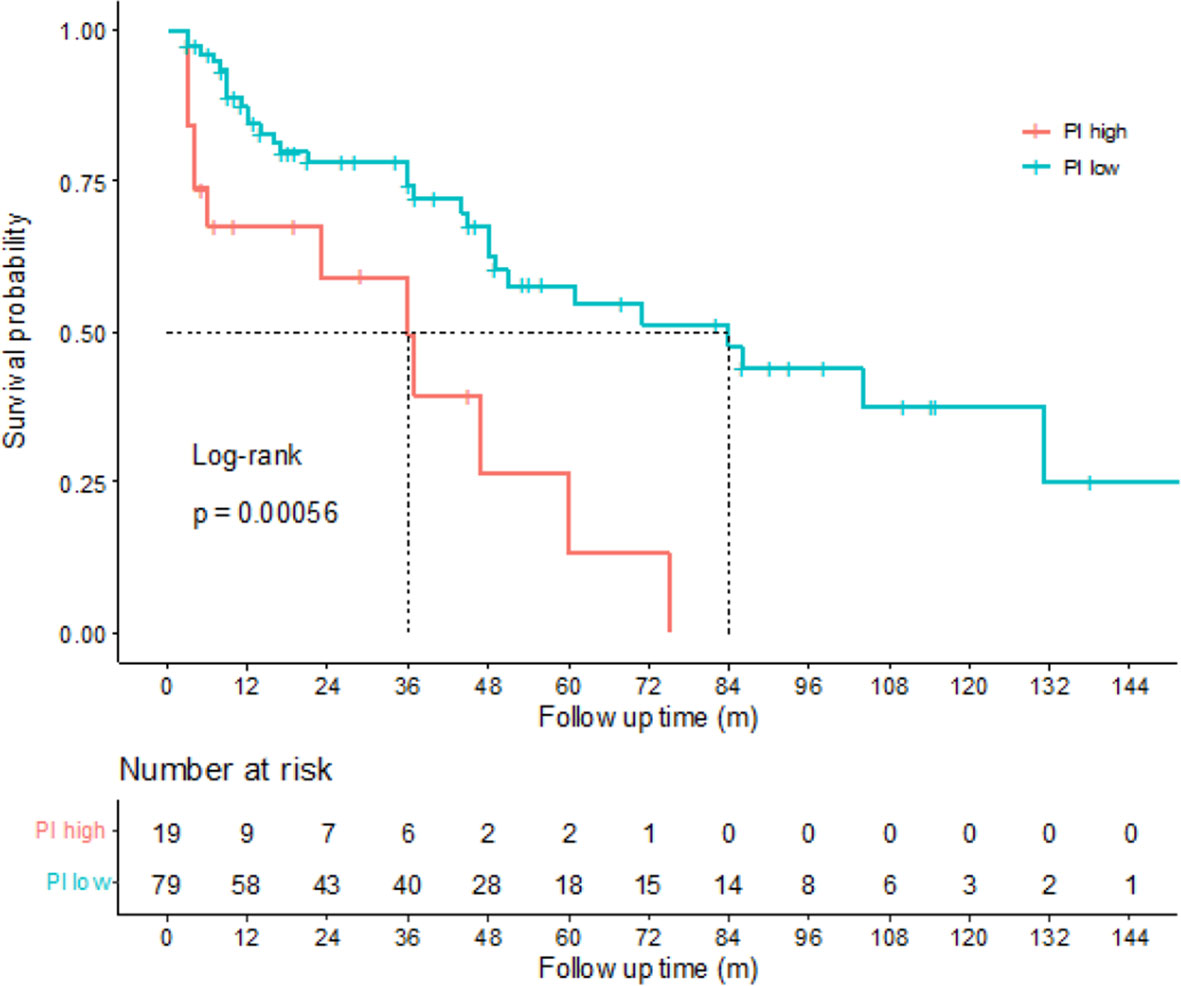
Figure 5 Correlations between disease-free survival (DFS) and prognostic index (PI) of high risk non-muscle-invasive bladder cancer (NMIBC) patients. Kaplan-Meier curves revealed that the high risk NMIBC patients with high PIs tended to have poorer DFS than the high risk NMIBC patients with low PIs (log-rank test, p=0.00056).
Among the 111 NMIBC patients, DFS of 19 patients were less than 1 year, while DFS of 26 patients were more than 5 years. We analyzed the CNVs of CEP63 and FOSL2 in those patients and found that copy numbers of CEP63 (p=0.037) and FOSL2 (p=0.021) were significantly gained in NMIBC patients with DFS of less than 1 year compared with patients with DFS of more than 5 years (Supplementary Figure 2).
Applying Identified CNVs to Clinical Practice
Detecting Identified CNVs in Urine Sediment Samples by Real-Time PCR
Currently, urinary tests are widely applied in clinical practice. Therefore, we tested the identified CNVs in 123 BC urine sediment samples to evaluate their clinical value for prognosis.
Real-time PCR results showed that compared with the 49 healthy control urine sediment samples, copy numbers of CEP63 (p=0.036) and FOSL2 (p<0.01) were significantly gained in BC urine sediment samples, which was consistent with the results in tumor samples (Supplementary Figure 3).
The correlations between the CNVs of 3 genes in urine and the clinicopathological characteristics of 123 BC patients were analyzed to assess the clinical significance of identified CNVs. However, no significant correlations were found between the identified CNVs in urine and clinicopathological characteristics (Supplementary Table 3).
Detecting Identified CNVs in Urine Sediment Samples Using 3D Digital PCR
The amount of tumor cell DNA in urine was much less than that in tumor tissues, thus making it difficult to obtain accurate gene copy numbers by real-time PCR. 3D digital PCR, a novel technique with high sensitivity, was therefore adopted for CNV detection in urine sediment samples to explore a promising method of urinary test.
3D digital PCR was conducted in 40 BC urine sediment samples with DNA left after tested by real-time PCR. Results showed that copy numbers of CEP63 (p<0.01) and FOSL2 (p<0.01) were significantly gained in 40 BC urine sediment samples compared with 42 control urine sediment samples (Supplementary Figure 4), which was consistent with the real-time PCR results of tumor samples and 123 urine sediment samples. Copy number gains of CEP63 (p<0.01) and FOSL2 (p=0.046) were found to be correlated with advanced tumor stage. CEP63 copy number gains (p=0.042) was also associated with high tumor grade (Supplementary Table 4). Those new findings may result from the improvement of sensitivity on detecting gene copy numbers by 3D digital PCR.
Prognostic Value of Identified CNVs in BC Urine Samples
In order to explore the prognostic value of the identified CNVs in urine sediment samples, we have retrospectively evaluated the 123 patients for DFS. 7 NMIBC patients were censored. The median follow-up time was 44 months.
Kaplan–Meier tests were performed to analyze the correlations between the CNVs in urine and DFS of 97 NMIBC patients. Results showed that copy number gains of CEP63 (copy number ratio>1.02) and FOSL2 (copy number ratio>0.97) detected by real-time PCR were found to be significantly correlated (p<0.01 and p=0.018, respectively) with poor DFS of NMIBC patients (Figure 6), suggesting that CNVs of CEP63 and FOSL2 in urine can be the prognosis predictor for NMIBC patients.
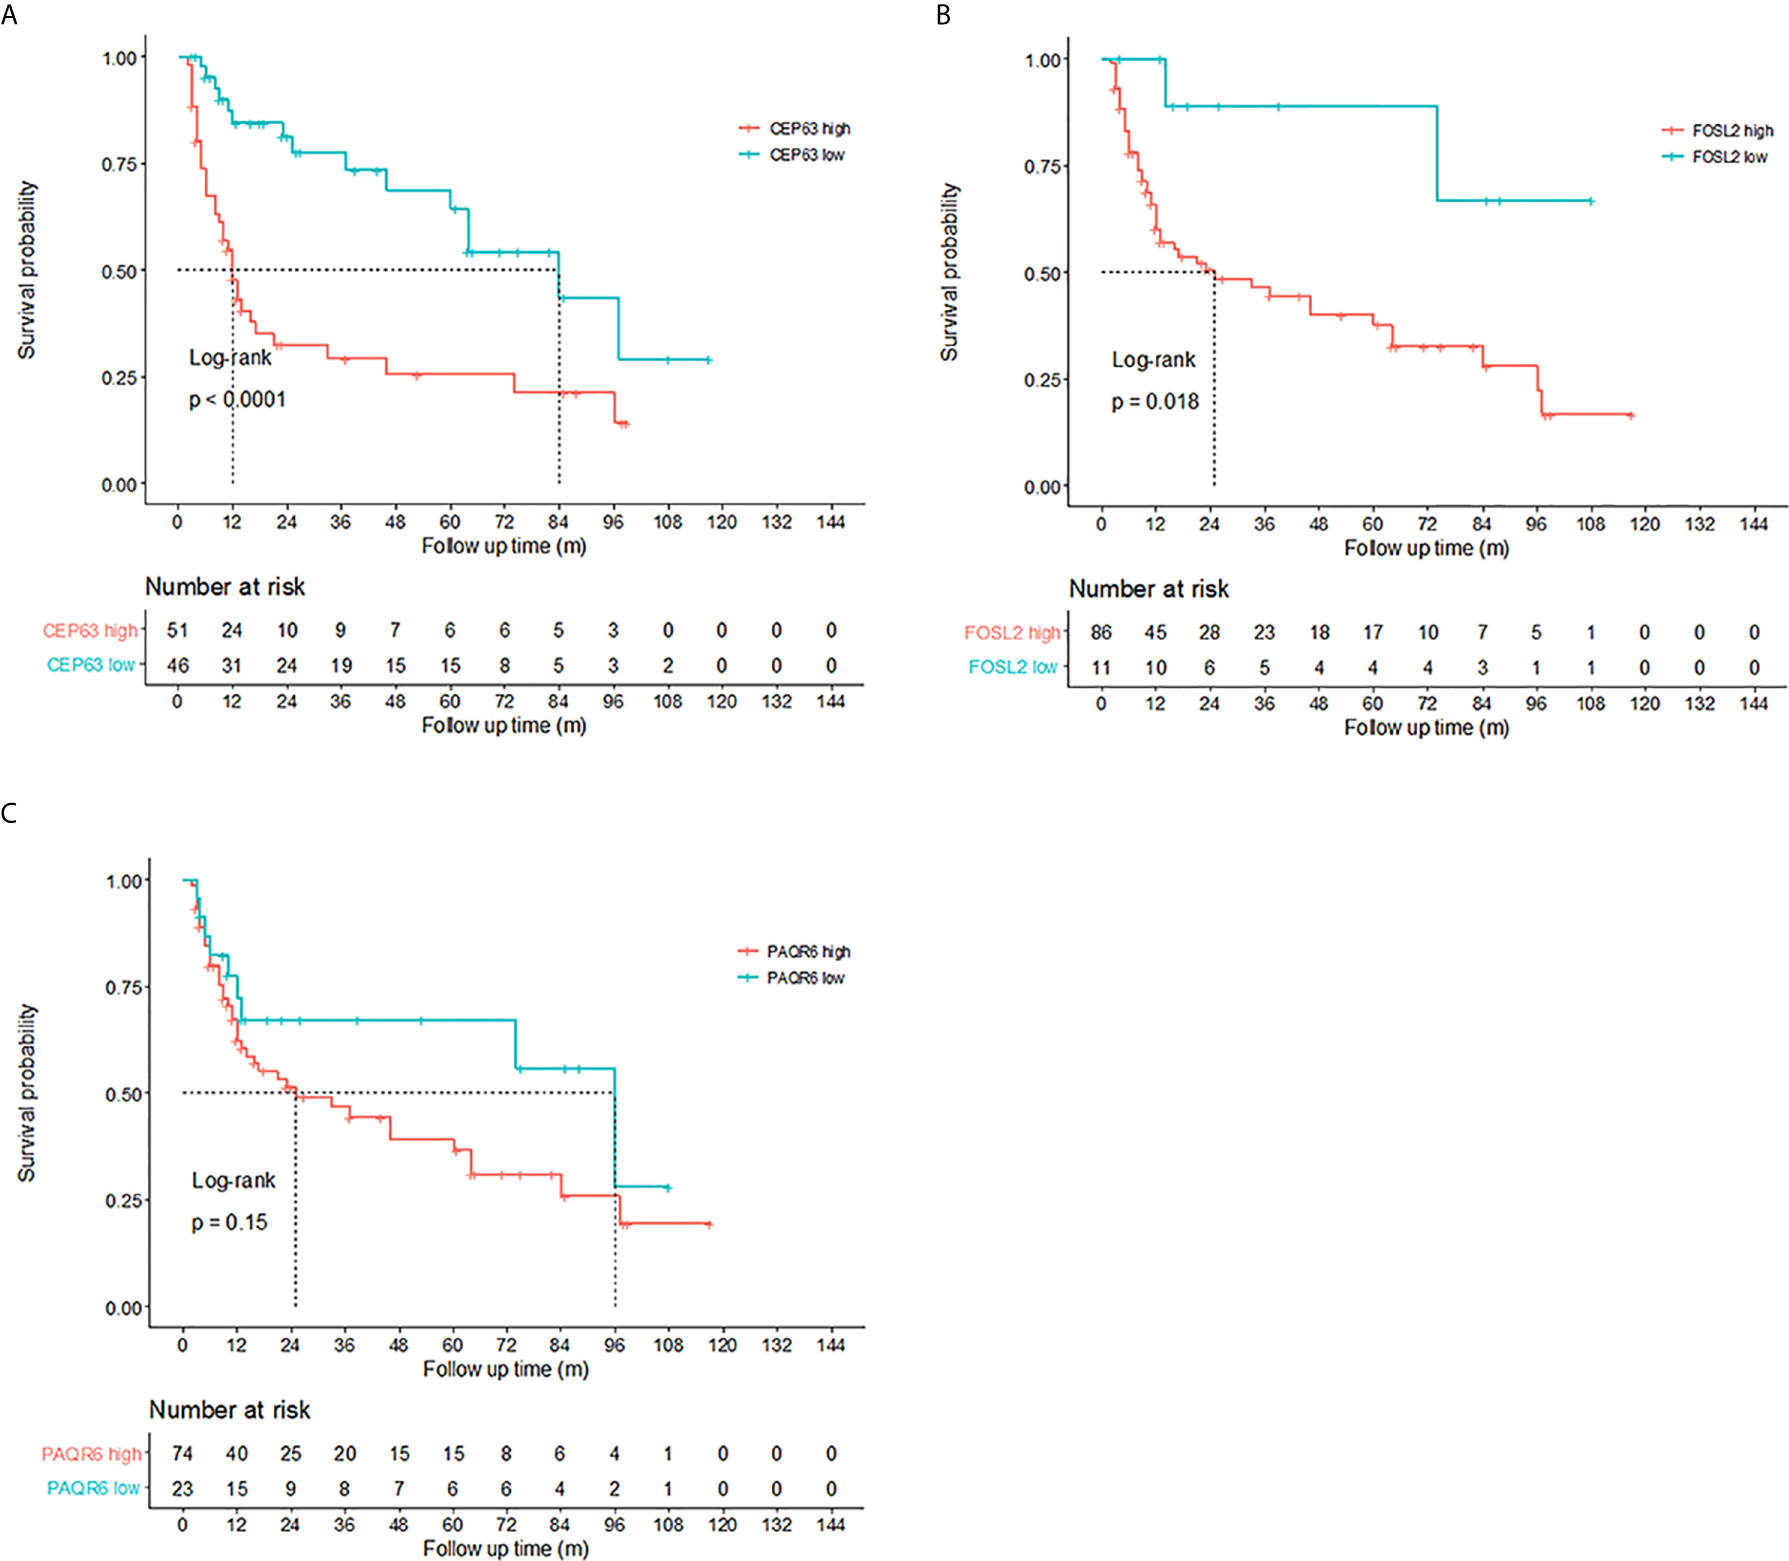
Figure 6 Prognosis prediction by 3 identified genes in urine sediment samples detected by real-time polymerase chain reaction (PCR). Kaplan-Meier curves showed that copy numbers gains of (A) CEP63 and (B) FOSL2 were associated with poor disease-free survival (DFS) in non-muscle-invasive bladder cancer (NMIBC) patients (p<0.0001 and p=0.018, respectively). The cutoff point of the copy number ratio relative to the TATA-box binding protein (TBP) gene for CEP63 and FOSL2 was 1.02 and 0.97, respectively. No correlations were found between DFS and CNVs of (C) PAQR6.
Discussion
In this study, we found that copy numbers of CEP63, FOSL2 and PAQR6 were significantly gained in BC. The array CGH data used for exploring candidate CNVs with high aberration frequencies were based on the patient cohort of the previous research. CNVs of CEP63 and FOSL2 were correlated with tumor stage and histologic grade. Copy number gains of CEP63 were also associated with lymph node metastasis. Survival analysis revealed a significant correlation between the CNVs of 3 identified genes and DFS. Copy number gains of CEP63 and FOSL2 were independent factors for DFS in NMIBC patients while copy number gains of FOSL2 and PAQR6 were independent factors for DFS in MIBC patients. The prediction models based on tumor samples were used for calculating PIs to predict the risk of recurrence for NMIBC and the risk of progression for MIBC patients. Among the high risk NMIBC patients, those who had high PIs tended to have poorer DFS than those with low PIs.
Since the role of 3 identified genes on prognosis prediction have been validated in tumor sample, they were further tested in urine samples for the convenience of application in clinical practice. Copy numbers of CEP63 and FOSL2 in urine showed significant correlations with poor DFS of NMIBC patients and were the significant predictors for prognosis. A highly sensitive and accurate technique, 3D digital PCR, was adopted to detect the exact gene copy numbers in urine. The consistency of the results with those in tumor samples suggested that this novel method may be helpful for urinary test in the future.
We have focused on identifying cancer related CNVs in this study, since unlike single-nucleotide polymorphisms, CNVs affect wider regions in the human genome and thus can cause imbalances in gene dosage with or without phenotypic consequences. A genome-wide CNV analysis of multiple cancer types have found that an average of 17% of the genome per tumor sample was amplified while 16% of it was deleted, indicating a much higher frequency of CNVs in malignant cells (20). Bioinformatics analysis of the GEO and TCGA public databases revealed some CNVs correlated with BC patient survival including 22 CNVs located on chr3p25 and chr11p11 (21) in MIBC and CCNE1 (22) in NMIBC. In a large population study, CNVs of GSTM1 and GSTT1 in blood samples were found to be related to survival in BC patients (23). However, these studies have not reported the correlations between BC and CNVs of the 3 identified genes in our study. Besides, there has not been any study on CNVs in BC combining mining from tumor tissues and applying in urine sediment for clinical use, which was assumed to produce more stable and reliable results. Furthermore, the sensitive 3D digital PCR method has not yet been adopted for detecting CNVs in BC urine samples.
The 3 identified genes we reported in this study have been reported in carcinogenesis in other cancers.
The CEP63-encoded centrosomal protein acts as a recruitment factor for cyclin-dependent kinase 1 (CDK1), which is essential for mitotic entry (24). Overexpression of CEP63 leads to de novo centrosome amplification and has been associated with poor prognosis in neuroblastoma patients (24). Elevated expression of CEP63 was also correlated with poor DFS of BC patients in TCGA Bladder Cancer (BLCA) data set (Supplementary Figure 4), which indicated the prognostic value of CEP63 on RNA levels. FOSL2 (FOS like 2, AP-1 transcription factor subunit) is a member of the Fos gene family. The FOS proteins have been implicated in a wide range of biological processes, including the regulation of cell proliferation, differentiation and transformation. Elevated expression of FOSL2 plays a key role in regulating the transforming growth factor beta (TGF-β) pathway (25). Abnormal expression of FOSL2 was also found in osteosarcoma (26), colon cancer (27) and ovarian carcinomas (28). According to our study, FOSL2 CNVs were independent prognostic factors for both NMIBC and MIBC, indicating their important role in tumor progression. Survival analysis of FOSL2 expression in the BLCA data set indicated a significant association between DFS and high expression of FOSL2, suggesting its prognostic value in BC (Supplementary Figure 2). PAQR6 is a member of the progestin and adipoQ receptor (PAQR) family (29). PAQR6 is coupled to G proteins and is a potential intermediary of the nonclassical antiapoptotic actions of neurosteroids in the central nervous system (30). Correlations were found between PAQR6 and tumor progression in endometrial cancer (31).
In this retrospective study, we have focused on the prognostic value of CEP63, FOSL2 and PAQR6 in bladder cancer. Carcinoma in situ was risk factor for tumor recurrence and progression. However, since it was much less common in NMIBC patients, there were not any CIS samples included in tumor group. We have verified the prognostic value of 2 CNVs in urine samples by 3D digital PCR. However, the sample size is a little small and only a few cases have both urine samples and tumor samples. Besides, an independent group of urine samples were needed for further validation. Apart from that, the reason why the CNVs of 3 genes were correlated with prognosis of BC patients needed to be illustrated by further research.
Conclusions
In conclusion, we found that the cancer-related CNVs of CEP63, FOSL2 and PAQR6 were competent in evaluating recurrence or progression risk for BC patients and may be used for the risk group stratifications in the future. Copy number gains of CEP63 and FOSL2 in urine had the capability to be the novel urinary biomarkers for predicting recurrence risk. The innovative 3D digital PCR, applied in detecting CNVs in BC urine samples for the first time, may provide a new approach for urine-based surveillance of BC patients.
Data Availability Statement
The original contributions presented in the study are included in the article/Supplementary Material. Further inquiries can be directed to the corresponding authors.
Ethics Statement
The studies involving human participants were reviewed and approved by the Cancer Hospital, Chinese Academy of Medical Sciences Clinical Research Ethics Committee under the study protocol number CH-BMS-013. The patients/participants provided their written informed consent to participate in this study.
Author Contributions
Conceptualization, ZC, HC, JB and YZ. Methodology, JM, XC, and YL. Software, YL and XC. Formal analysis, ZC. Data curation, HC. Writing-original draft preparation, ZC. Writing-review and editing, ZC and HC. Supervision, KZ, JS and YG. Project administration, KZ, JS and YG. All authors contributed to the article and approved the submitted version.
Funding
This work was supported by the Open Project of the State Key Laboratory of Molecular Oncology (SKL-KF-2013-02); Beijing Hope Run Special Fund of Cancer Foundation of China (LC2013A02); the Capital Characteristic Clinical Project (Z131107002213006).
Conflict of Interest
The authors declare that the research was conducted in the absence of any commercial or financial relationships that could be construed as a potential conflict of interest.
Acknowledgments
We thank all members of the State Key Laboratory of Molecular Oncology for their advice and assistance.
Supplementary Material
The Supplementary Material for this article can be found online at: https://www.frontiersin.org/articles/10.3389/fonc.2021.674933/full#supplementary-material
Supplementary Figure 1 | 3D digital PCR results of 5 candidate genes and 1 reference gene in BC and healthy control urine sediment. Gene copy numbers of 5 candidate genes (CEP63, FOSL2, GHR and PAQR6) and 1 reference gene (TBP) in (A) BC urine sediment and (B) healthy control urine sediment were analyzed by the QuantStudio™ 3D AnalysisSuite™ Software. Blue points near Y-axis of the plot indicated the sequences with only FAM reporter dye signal detected. Red points near X-axis of the plot indicated the sequences with only VIC reporter dye signal detected. Green points located midway between the FAM and VIC data point clusters in the plot suggested sequences with both FAM and VIC reporter dye signal. Yellow points located near the origin of the plot suggested sequences with no signal detected. A digital PCR Chip with more than 85% data point above threshold was applied for subsequent copy number analysis.
Supplementary Figure 2 | Correlations between copy number variations (mean with 95% confidence interval [CI]) and disease-free survival (DFS) in non-muscle-invasive bladder cancer (NMIBC) patients (*p<0.05). Copy number variations of CEP63 (p=0.037) and FOSL2 (p=0.021) were significantly gained in NMIBC patients with DFS of less than 1 year, in comparison with patients with DFS of more than 5 years, determined by Mann-Whitney U test.
Supplementary Figure 3 | Copy number variations (mean with 95% confidence interval [CI]) of 5 candidate genes in urine sediment detected by real-time PCR. Copy number variations of 5 candidate genes were tested in 123 bladder cancer urine and 49 healthy controls (*p<0.05, **p<0.01). Comparing with healthy controls, copy numbers of CEP63 (p=0.012) and FOSL2 (p=0.0001) were significantly gained in bladder cancer urine sediment, determined by Mann-Whitney U test.
Supplementary Figure 4 | Copy number variations (mean with 95% confidence interval [CI]) of 5 candidate genes in urine sediment detected by digital PCR. Copy number variations of 5 candidate genes in 40 bladder cancer urine sediment and 42 healthy controls (**p<0.01) were detected by digital PCR. In comparison with control group, copy numbers of 2 genes (CEP63 and FOSL2) were significantly gained in BC urine sediment, assessed by Mann-Whitney U test.
Supplementary Figure 5 | Recurrence prediction of CEP63 and FOSL2 expression in BLCA data set. Normalized BLCA gene expression RNAseq data (n=299) and clinical matrix were downloaded from UCSC Xena (https://xenabrowser.net). Kaplan-Meier curve revealed that high expression of (A) CEP63 and (B) FOSL2 were related to poor recurrence-free survival in 299 bladder cancer patients. Cutoff points of gene expression were 9.13 and 11.90 for CEP63 and FOSL2, respectively.
Abbreviations
BC, bladder cancer; CNV, copy number variation; DFS, disease-free survival; MIBC, muscle-invasive bladder cancer; NMIBC, non-muscle-invasive bladder cancer; PCR, polymerase chain reaction.
References
1. Ferlay J, Colombet M, Soerjomataram I, Mathers C, Parkin DM, Pineros M, et al. Estimating the Global Cancer Incidence and Mortality in 2018: GLOBOCAN Sources and Methods. Int J Cancer (2019) 144(8):1941–53. doi: 10.1002/ijc.31937
2. Willis D, Kamat AM. Nonurothelial Bladder Cancer and Rare Variant Histologies. Hematol Oncol Clinics North Am (2015) 29(2):237–52, viii. doi: 10.1016/j.hoc.2014.10.011
3. Kamat AM, Hahn NM, Efstathiou JA, Lerner SP, Malmstrom PU, Choi W, et al. Bladder Cancer. Lancet (2016) 388(10061):2796–810. doi: 10.1016/S0140-6736(16)30512-8
4. National Institute for Health and Care Excellence (NICE) guidance by The Guideline Development Group, National Collaborating Centre and NICE project team. Bladder Cancer: Diagnosis and Management of Bladder Cancer: (C) NICE (2015) Bladder Cancer: Diagnosis and Management of Bladder Cancer. BJU Int 120(6):755–65. doi: 10.1111/bju.14045
5. Sylvester RJ, van der Meijden AP, Oosterlinck W, Witjes JA, Bouffioux C, Denis L, et al. Predicting Recurrence and Progression in Individual Patients With Stage Ta T1 Bladder Cancer Using EORTC Risk Tables: A Combined Analysis of 2596 Patients From Seven EORTC Trials. Eur Urol (2006) 49(3):466–5; discussion 75-7. doi: 10.1016/j.eururo.2005.12.031
6. Smith AB, Deal AM, Woods ME, Wallen EM, Pruthi RS, Chen RC, et al. Muscle-Invasive Bladder Cancer: Evaluating Treatment and Survival in the National Cancer Data Base. BJU Int (2014) 114(5):719–26. doi: 10.1111/bju.12601
7. Alfred Witjes J, Lebret T, Comperat EM, Cowan NC, De Santis M, Bruins HM, et al. Updated 2016 EAU Guidelines on Muscle-Invasive and Metastatic Bladder Cancer. Eur Urol (2017) 71(3):462–75. doi: 10.1016/j.eururo.2016.06.020
8. Stenzl A, Cowan NC, De Santis M, Kuczyk MA, Merseburger AS, Ribal MJ, et al. [Treatment of Muscle-Invasive and Metastatic Bladder Cancer: Update of the EAU Guidelines]. Actas Urol Espanolas (2012) 36(8):449–60. doi: 10.1016/j.acuroe.2011.11.007
9. Lokeshwar VB, Habuchi T, Grossman HB, Murphy WM, Hautmann SH, Hemstreet GP,3, et al. Bladder Tumor Markers Beyond Cytology: International Consensus Panel on Bladder Tumor Markers. Urology (2005) 66(6 Suppl 1):35–63. doi: 10.1016/j.urology.2005.08.064
10. Hajdinjak T. Urovysion FISH Test for Detecting Urothelial Cancers: Meta-Analysis of Diagnostic Accuracy and Comparison With Urinary Cytology Testing. Urol Oncol (2008) 26(6):646–51. doi: 10.1016/j.urolonc.2007.06.002
11. van der Aa MN, Steyerberg EW, Bangma C, van Rhijn BW, Zwarthoff EC, van der Kwast TH. Cystoscopy Revisited as the Gold Standard for Detecting Bladder Cancer Recurrence: Diagnostic Review Bias in the Randomized, Prospective CEFUB Trial. J Urol (2010) 183(1):76–80. doi: 10.1016/j.juro.2009.08.150
12. Babjuk M, Bohle A, Burger M, Capoun O, Cohen D, Comperat EM, et al. EAU Guidelines on Non-Muscle-Invasive Urothelial Carcinoma of the Bladder: Update 2016. Eur Urol (2017) 71(3):447–61. doi: 10.1016/j.eururo.2016.05.041
13. Mishra S, Whetstine JR. Different Facets of Copy Number Changes: Permanent, Transient, and Adaptive. Mol Cell Biol (2016) 36(7):1050–63. doi: 10.1128/MCB.00652-15
14. Krepischi AC, Pearson PL, Rosenberg C. Germline Copy Number Variations and Cancer Predisposition. Future Oncol (2012) 8(4):441–50. doi: 10.2217/fon.12.34
15. Florl AR, Schulz WA. Chromosomal Instability in Bladder Cancer. Arch Toxicol (2008) 82(3):173–82. doi: 10.1007/s00204-008-0280-3
16. Sobin DH, aW. TNM Classification of Malignant Tumours. 6th Vol. pp. Wiittenkind CH, editor. New York: Wiley-Liss (2002). p. 199–202.
17. Eble GS JN, Epstein JI, Sesterhenn IA. World Health Organization Classification of Tumours. In: Pathology and Genetics of Tumours of the Urinary System and Male Genital Organs. France: IARC Press, Lyon (2004).
18. Ihaka R, Gentleman R. R: A Language for Data Analysis and Graphics Vol. 5. and Graphical Statistics: Journal of Computational (1996) p. 299–314.
19. Babjuk M, Burger M, Comperat EM, Gontero P, Mostafid AH, Palou J, et al. European Association of Urology Guidelines on Non-Muscle-Invasive Bladder Cancer (Tat1 and Carcinoma in Situ) - 2019 Update. Eur Urol (2019) 76(5):639–57. doi: 10.1016/j.eururo.2019.08.016
20. Beroukhim R, Mermel CH, Porter D, Wei G, Raychaudhuri S, Donovan J, et al. The Landscape of Somatic Copy-Number Alteration Across Human Cancers. Nature (2010) 463(7283):899–905. doi: 10.1038/nature08822
21. Lindquist KJ, Sanford T, Friedlander TW, Paris PL, Porten SP. Copy Number Gains At Chr3p25 and Chr11p11 are Associated With Lymph Node Involvement and Survival in Muscle-Invasive Bladder Tumors. PloS One (2017) 12(11):e0187975. doi: 10.1371/journal.pone.0187975
22. Song BN, Kim SK, Chu IS. Bioinformatic Identification of Prognostic Signature Defined by Copy Number Alteration and Expression of CCNE1 in Non-Muscle Invasive Bladder Cancer. Exp Mol Med (2017) 49(1):e282. doi: 10.1038/emm.2016.120
23. Norskov MS, Frikke-Schmidt R, Bojesen SE, Nordestgaard BG, Loft S, Tybjaerg-Hansen A. Copy Number Variation in Glutathione-S-Transferase T1 and M1 Predicts Incidence and 5-Year Survival From Prostate and Bladder Cancer, and Incidence of Corpus Uteri Cancer in the General Population. Pharmacogenomics J (2011) 11(4):292–9. doi: 10.1038/tpj.2010.38
24. Loffler H, Fechter A, Matuszewska M, Saffrich R, Mistrik M, Marhold J, et al. Cep63 Recruits Cdk1 to the Centrosome: Implications for Regulation of Mitotic Entry, Centrosome Amplification, and Genome Maintenance. Cancer Res (2011) 71(6):2129–39. doi: 10.1158/0008-5472.CAN-10-2684
25. Roy S, Khanna S, Azad A, Schnitt R, He G, Weigert C, et al. Fra-2 Mediates Oxygen-Sensitive Induction of Transforming Growth Factor Beta in Cardiac Fibroblasts. Cardiovasc Res (2010) 87(4):647–55. doi: 10.1093/cvr/cvq123
26. Sun X, Dai G, Yu L, Hu Q, Chen J, Guo W. Mir-143-3p Inhibits the Proliferation, Migration and Invasion in Osteosarcoma by Targeting FOSL2. Sci Rep (2018) 8(1):606. doi: 10.1038/s41598-017-18739-3
27. Li S, Fang XD, Wang XY, Fei BY. Fos-Like Antigen 2 (FOSL2) Promotes Metastasis in Colon Cancer. Exp Cell Res (2018) 373(1–2):57–61. doi: 10.1016/j.yexcr.2018.08.016
28. Zhou L, Graves M, MacDonald G, Cipollone J, Mueller CR, Roskelley CD. Microenvironmental Regulation of BRCA1 Gene Expression by C-Jun and Fra2 in Premalignant Human Ovarian Surface Epithelial Cells. Mol Cancer Res MCR (2013) 11(3):272–81. doi: 10.1158/1541-7786.MCR-12-0395
29. Zhao X, Mo D, Li A, Gong W, Zhang Y, Qian W, et al. Characterization and Transcriptional Regulation Analysis of the Porcine PAQR6 Gene. DNA Cell Biol (2011) 30(11):947–54. doi: 10.1089/dna.2011.1262
30. Pang Y, Dong J, Thomas P. Characterization, Neurosteroid Binding and Brain Distribution of Human Membrane Progesterone Receptors Delta and {Epsilon} (Mprdelta and Mpr{Epsilon}) and Mprdelta Involvement in Neurosteroid Inhibition of Apoptosis. Endocrinology (2013) 154(1):283–95. doi: 10.1210/en.2012-1772
Keywords: copy number variation, bladder cancer, prognosis, CEP63, FOSL2, PAQR6
Citation: Cai Z, Chen H, Bai J, Zheng Y, Ma J, Cai X, Liu Y, Zhang K, Shou J and Gao Y (2021) Copy Number Variations of CEP63, FOSL2 and PAQR6 Serve as Novel Signatures for the Prognosis of Bladder Cancer. Front. Oncol. 11:674933. doi: 10.3389/fonc.2021.674933
Received: 02 March 2021; Accepted: 19 April 2021;
Published: 10 May 2021.
Edited by:
Daniela Terracciano, University of Naples Federico II, ItalyReviewed by:
Gian Maria Busetto, University of Foggia, ItalyRodolfo Hurle, Humanitas Research Hospital, Italy
Copyright © 2021 Cai, Chen, Bai, Zheng, Ma, Cai, Liu, Zhang, Shou and Gao. This is an open-access article distributed under the terms of the Creative Commons Attribution License (CC BY). The use, distribution or reproduction in other forums is permitted, provided the original author(s) and the copyright owner(s) are credited and that the original publication in this journal is cited, in accordance with accepted academic practice. No use, distribution or reproduction is permitted which does not comply with these terms.
*Correspondence: Kaitai Zhang, zhangkt@cicams.ac.cn; Jianzhong Shou, shoujzh@126.com; Yanning Gao, yngao@cicams.ac.cn