 Yuling Tong1Hongguang Wang2Yi Zhao1Xueqiang He3Hongwei Xu4Hong Li5Ping Shuai6Lirong Gong6Hongbo Wu7Hongzhi Xu8Yinhu Luo9Dong Wang10Shizhu Liu2
 Zhenya Song1*
- 1Department of General Practice/Health Management Center, The Second Affiliated Hospital of Zhejiang University, School of Medicine, Hangzhou, China
- 2Department of Gastroenterology, Jilin City People’s Hospital, Jilin, China
- 3Department of Gastroenterology, No. 924 Hospital of the People’s Liberation Army of China, Guilin, China
- 4Department of Gastroenterology, Kunshan Hospital of Traditional Chinese Medicine, Kunshan, China
- 5Department of Health Medicine, Chinese People’s Liberation Army (PLA) General Hospital, Beijing, China
- 6Health Management Center, Sichuan Provincial People’s Hospital, University of Electronic Science and Technology of China, Chengdu, China
- 7Department of Gastroenterology, The First Hospital Affiliated to AMU (Southwest Hospital), Chongqing, China
- 8Department of Gastroenterology, Zhongshan Hospital Affiliated to Xiamen University, Xiamen, China
- 9Department of Gastroenterology, Jingzhou Hospital of Traditional Chinese Medicine, Jingzhou, China
- 10Department of Gastroenterology, Shanghai Changhai Hospital, Shanghai, China
Background: Pepsinogens (PGs) can be used for gastric cancer (GC) screening, but the cutoff levels vary among studies, and PG levels are influenced by numerous factors. The aim of this article is to examine the diagnostic value of PG levels and Helicobacter pylori (Hp) status for GC and atrophic gastritis screening in asymptomatic individuals undergoing health checkup in China.
Patients and Methods: This was a multicenter cross-sectional study of subjects who underwent health checkup from 10/2016 to 10/2018 at nine International Healthcare Centers in China. All participants underwent gastroscopy and pathological examination, serum PG, 13C-urea breath test, and/or Hp serological current infection marker rapid test, all on the same day. PG-related parameters were analyzed in different Hp subgroups and regions.
Results: The patients were grouped as non-atrophic (NAG, n = 1,590), mild to moderate atrophic (MAG, n = 273), severe atrophic (SAG, n = 49), and GC (n = 10). The serum PG levels in these groups decreased with increasing pathological severity. In the same pathological groups, PGI and PGII levels were higher in the Hp-positive subgroup, while PGR (PGI/PGII ratio) was lower (P < 0.05). The best cutoff values for atrophy diagnosis were PGI ≤73.1 ng/ml and PGR ≤9.8, for severe atrophy were PGI ≤63.9 ng/ml and PGR ≤9.09, and for GC was PGR ≤4.7 (all P < 0.05 and area under the curve >0.7). The cutoff points varied with Hp status and China regions.
Conclusion: Serum PG levels might be used for the screening of gastric atrophic gastritis lesions. The results suggest that different cutoff values should possibly be used in different Hp status groups and geographical regions, but it will have to be validated in future studies. Future studies should also examine the value of PG levels for GC detection.
Introduction
Gastric cancers (GCs) are tumors of the stomach, including non-cardia and subcardia carcinomas (Siewert type III), with the center starting 2–5 cm below the esophagogastric junction (1, 2). GC affected approximately 1,033,701 individuals globally in 2018 (3), and its incidence is highest in Eastern Asia, Eastern Europe, and South America (2, 4). Men are twice as likely to be affected as women (2). The direct cause of GC is unclear, but Helicobacter pylori (Hp) infection and hereditary cancer predisposition syndromes may play a role (5, 6). Patients often present with non-specific symptoms, which may include anorexia, weight loss, abdominal pain, dyspepsia, vomiting, and early satiety (2, 4). In China, the 5-year survival rate of patients with GC is 27.4% (7, 8).
The progression from chronic non-atrophic gastritis, via atrophic gastritis (AG) and intestinal metaplasia (IM), to dysplasia, termed Correa’s cascade (9), is widely considered a common evolution path of the intestinal type of non-cardia GC. AG is the turning point and represents a precancerous lesion. The annual incidence rates of gastric cancer were found to be 0.1, 0.25, 0.6, and 6% in patients with AG, IM, mild-to-moderate dysplasia, and severe dysplasia within 5 years after diagnosis (10). Effective screening and managing of this patient group could reduce the incidence of GC and improve the early detection rate. Gastroscopy followed by pathology is the gold standard for the diagnoses of GC and precancerous lesions, but the large target population of GC endoscopic screening and the lack of high-quality medical resources are major impediments to its implementation (11, 12). In addition, patients with early GC and pre-gastric cancer usually have no specific symptoms (11, 12).
Pepsinogen (PG) is a zymogen abundantly secreted by gastric mucosal cells that is converted into pepsin by the acidic pH in the gastric lumen (13). There are five different groups of PGs, grouped according to their primary structure: PGI, PGII, PGB, prochymosin, and PGF (13). Serum PG amounts can reflect the morphology and function of the gastric mucosa. Indeed, PGI is produced by the adenosine cells of the gastric fundus, and low PGI levels correlate with gastric precancerous lesions and GC (14–16). PGII is more correlated with gastric mucosal lesions compared with those of the gastric antrum mucosa; in addition, PGII is related to gastric duct atrophy, intestinal metaplasia or pseudopyloric gland metaplasia, and dysplasia (17, 18). Interestingly, dysregulated PG expression and a progressive decrease of the PGI/PGII ratio (PGR) are associated with the progression from normal gastric mucosa to precancerous lesions to GC (15, 19). Additionally, PGR plays a critical role in the detection of AG cases (20). Hp has been identified as a carcinogen by the World Health Organization (WHO) (21, 22). The incidence of non-cardiac GC in Hp-positive individuals is 2.97 times that of negative ones (23). A study in Taiwan found that compared with Hp-positive patients, Hp-negative individuals are more likely to develop proximal GC and tend to be younger with more diffuse lesions and worse prognosis (24).
The combination of Hp and PG has been used to evaluate the risk factors for GC, which is probably more suitable for large-scale screening than endoscopy (21). Nevertheless, its efficacy remains unsure, and its cutoff value varies among studies; meanwhile, serum PG levels are affected by race, region, age, gender, height, weight, body surface area, smoking, and alcohol, among others (25). Previous studies showed that serum PG levels and its relationship with GC in China are significantly different from those found in Japan and South Korea (20, 26, 27). There is a high incidence of Hp infection in China, and many studies have shown that PGI and PGII levels increase and PGR decreases after Hp infection. A previous single-center study by our group (20) discussed the classification of PG cutoff values according to Hp infection.
Therefore, the aim of this multicenter cross-sectional study was to examine PG levels and Hp status in asymptomatic individuals undergoing health checkup in order to assess the diagnostic value of serum PG levels for GC and AG.
Materials and Methods
Participants
This was a multicenter cross-sectional study of consecutive subjects who underwent regular health checkup from October 2016 to October 2018 at nine International Healthcare Centers in different regions of China, including Southern China (No. 924 Hospital of the People’s Liberation Army of China), Eastern China (the Second Affiliated Hospital of Zhejiang University, College of Medicine, Zhongshan Hospital affiliated to Xiamen University, and Traditional Chinese Medicine Hospital of Kunshan), Southwest China [Sichuan Provincial People’s Hospital and the First Hospital affiliated to AMU (Southwest Hospital)], Northeast China (Jinlin People’s Hospital), and Central/Northern China (Chinese PLA General Hospital and Jingzhou Hospital of Traditional Chinese Medicine). All procedures were performed in accordance with the ethical standards of the responsible committee on human experimentation (institutional and national) and the Helsinki Declaration of 1964 and later versions. Informed consent was obtained from all patients prior to enrolment. The study was approved and authorized by the ethics committees of various participating hospitals (approval #2015-082 at the Second Affiliated Hospital of Zhejiang University College of Medicine, the leading site).
Inclusion criteria were as follows (1): intention to undergo gastroscopy during health checkup examination and (2) 25–75 years of age. Exclusion criteria were the following: (1) a history of gastric ulcer, gastric polyp, or GC; (2) a history of gastrectomy; (3) treatment with a proton pump inhibitor in the last month; (4) contraindications to gastroscopy; (5) a history of Hp eradication; (6) a history of abdominal pain, abdominal distention, belching, acid reflux, nausea, and other digestive tract symptoms within 1 month; or (7) incomplete data.
Questionnaire Survey
A self-reported questionnaire was used in the present study. It included baseline information (age, sex, and nationality), living style [smoking (>1 cigarette daily for more than 1 year; the number of cigarettes and duration of smoking were asked for smokers), alcohol consumption (any type of alcohol more than once weekly for more than 1 year; alcohol types and consumption frequency were asked for drinkers)], eating habits [high-salt diet (salt >10 g/day), green vegetables and fresh fruits [>three times per week)], and family history of GC among first-degree relatives (online Supplementary File 1).
Tests
The participants underwent gastroscopy and pathological examination of the biopsies, serum PG test, 13C-urea breath test (Shenzhen Zhonghe Headway Bio-Sci & Tech Co., Ltd., China), and/or Hp serological current infection marker rapid test (MP Biomedicals, Santa Ana, CA, USA), all on the same day. All tests were performed according to the manufacturers’ instructions.
Hp infection was determined based on the 13C-urea breath test, Hp serological current infection marker rapid test (28), and pathological screening. Patients showing positive results for any of these three tests were considered to be Hp-positive. If all tests were negative, the patient was considered to be Hp-negative.
Fasting blood (5 ml) was collected from each subject and centrifuged for 10 min at ≥10,000 g. Serum PG levels were assayed by the chemiluminescent microparticle immunoassay method with the Abbott ARCHITECT Pepsinogen I and II Reagent Kit (Abbott Laboratories Inc., Chicago, IL, USA).
Gastroscopy was performed by the double-blind method. Two biopsies were performed at the small curvatures of the gastric antrum and body, respectively. Additional biopsies were taken from the mucosal abnormalities. The biopsies were scored semiquantitatively by two pathologists with >10 years of experience, according to the updated Sydney classification system (29) and the OLGA (Operative Link on Gastritis Assessment) method, which combine the degree and range of gastric mucosa atrophy/intestinal metaplasia, which are internationally accepted and applied in the screening of GC and AG (30). The OLGA-0 group was defined as normal (NAG), the combined OLGA-I and OLGA-II groups as mild-to-moderate atrophy (MAG), and the combined OLGA-III and OLGA-IV groups as severe atrophy (SAG). Therefore, based on pathological data, the patients were divided into four groups, including the non-atrophy (NAG), mild-to-moderate atrophy (MAG), severe atrophy (SAG), and GC groups. The last three groups were further combined into the AG and GC (AG/GC) group. In case of disagreement, the two pathologists discussed the data until consensus was reached.
Quality Control
In the initial stage of the study, all participants underwent a unified training, including how to complete the questionnaire, how to perform the endoscopy, the training of the endoscopists, and the training of the pathologists. All pathological examinations were performed by two experts. Any inconsistencies were solved by discussion. The final conclusion was used in the database; therefore, no coefficients of variation could be calculated.
Statistical Analysis
Statistical analysis was performed with SPSS 20 (IBM Corp., Armonk, NY, USA). Continuous data were tested for normal distribution by the Kolmogorov-Smirnov test. Those with normal distribution were expressed as mean ± standard deviation (SD) and compared by ANOVA with post hoc Scheffe’s test; data with skewed distribution were presented as median (interquartile ranges) (IQR). Categorical data were presented as frequency and percentage and analyzed by the chi-square test and Bonferroni post hoc test. A binary logistic regression model was used to determine odds ratios of potential risk factors for GC and AG. The receiver operating characteristics (ROC) curve method was used to estimate the cutoff points for PGs, according to the following steps. First, the original concentrations in the NAG population (derivation cohort) were logarithmically transformed and divided equally into 20 parts to obtain 20 cutoff values. Then, the prevalence of AG/GC for each of the 20 cutoffs was calculated, and cutoff categories with similar prevalence rates were combined for two final PG categories. Finally, the antilog values of the cutoffs of the combined categories were calculated and considered the cutoff values for PGs. An area under the curve (AUC) >0.7 was considered valuable. P < 0.05 was considered statistically significant.
Results
Basic Information
A total of 2,256 subjects were included in the study. Totally, 15 cancers were found, including 14 GCs (including six cases of early GC) and one pharyngeal cancer. There were 37 intraepithelial neoplasia (1.6%), 172 gastric polyp (7.6%), 87 gastric ulcer (3.9%), 58 duodenal ulcer (2.6%), 17 submucosal gastric tumor (0.8%), 326 AG (14.5%), and 391 intestinal metaplasia (17.3%) cases. In addition, one esophageal ulcer and one esophageal polyp cases were found.
Totally. 316 patients were excluded due to incomplete data, four due to a history of gastrectomy, five due to proton pump inhibitor use in the recent 1 month, and nine due to a history of gastric ulcer or gastric polyp. Finally, 1,922 patients were included in the final analysis. The participants were 52.3 ± 9.8 years old. The male to female ratio was 1.2:1 (1,065/857). There were 1,590 participants in the NAG group and 332 in the AG/GC group, including 273 in the MAG group, 49 in the SAG group, and 10 in the GC group. Compared with the NAG group, mean age, fruit intake, vegetable intake, smoking rate, and the infection rate of Hp in the AG/GC group were significantly different (P < 0.05) (Table 1).
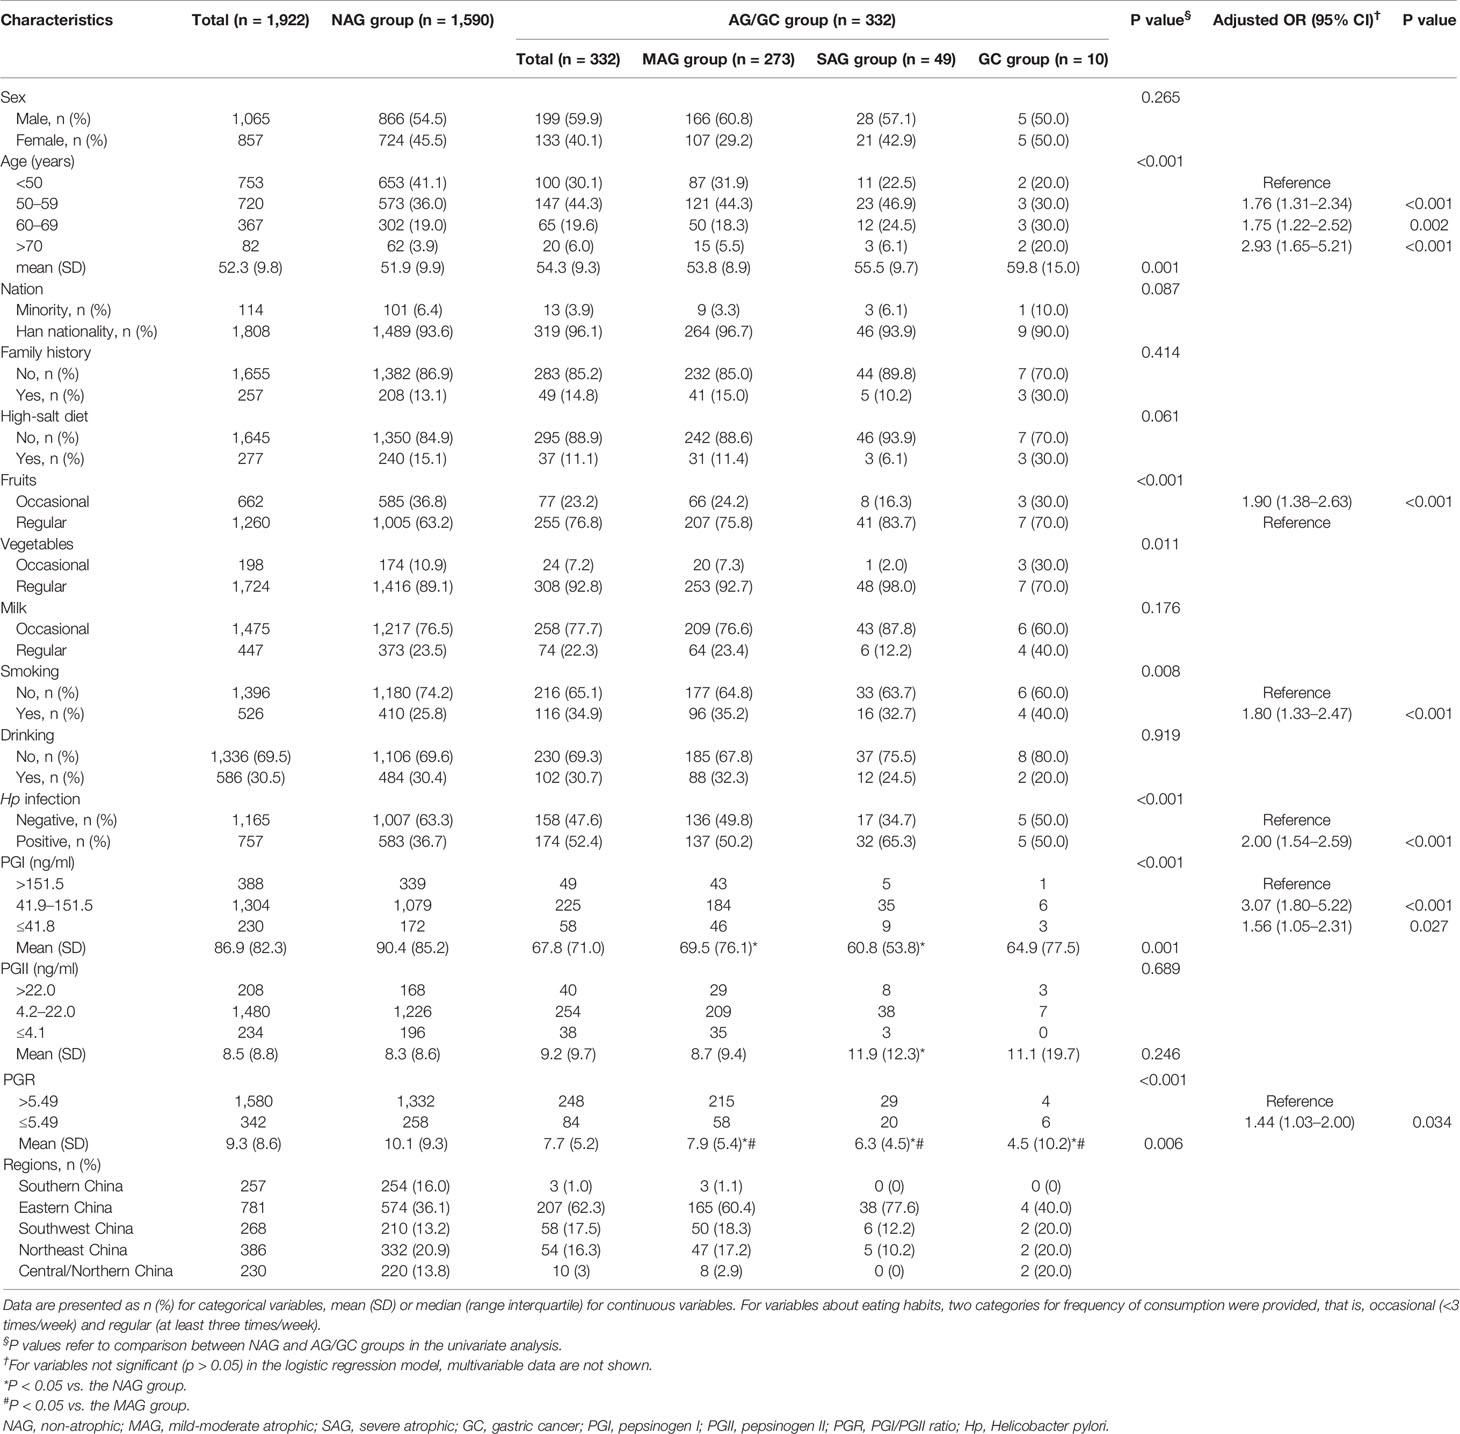
Table 1 The baseline characteristics of 1,922 subjects involved in the study, with univariate and multivariable analyses.
Risk Factors for AG/GC
According to the logistic regression model, age was one of the risk factors for AG/GC, especially individuals older than 70 (OR = 2.93). Other risk factors included occasional fruit intake (OR = 1.9), smoking (OR = 1.8), Hp infection (OR = 2.0), and PGR levels (OR = 1.44) (Table 1).
Serum PG Differences Among the Pathological Groups
Serum PG levels were compared among the NAG, MAG, SAG, and GC groups. PGR values gradually decreased with increasing lesion grade. Compared with the NAG group, PGI levels and PGRs in the MAG and SAG groups were significantly lower (P < 0.05). Compared with the MAG group, the SAG group had significantly lower PGRs (P < 0.05). PGR levels in the GC group were significantly lower than those of the NAG and MAG groups (P < 0.05) (Table 1).
Serum PG Differences According to the Hp Status
The groups were subdivided according to the Hp status. In the NAG group, PGI and PGII levels in the Hp-positive subgroup were higher than those of Hp-negative patients (P < 0.001 and P < 0.001), while PGRs were lower (P < 0.001). Similar changes were observed in the MAG group (P < 0.001, P < 0.001, and P = 0.009). In the SAG group, PGII levels in the Hp-positive subgroup were higher than those of the Hp-negative subgroup (P = 0.005), while PGRs were lower (P < 0.001) (Table 2).
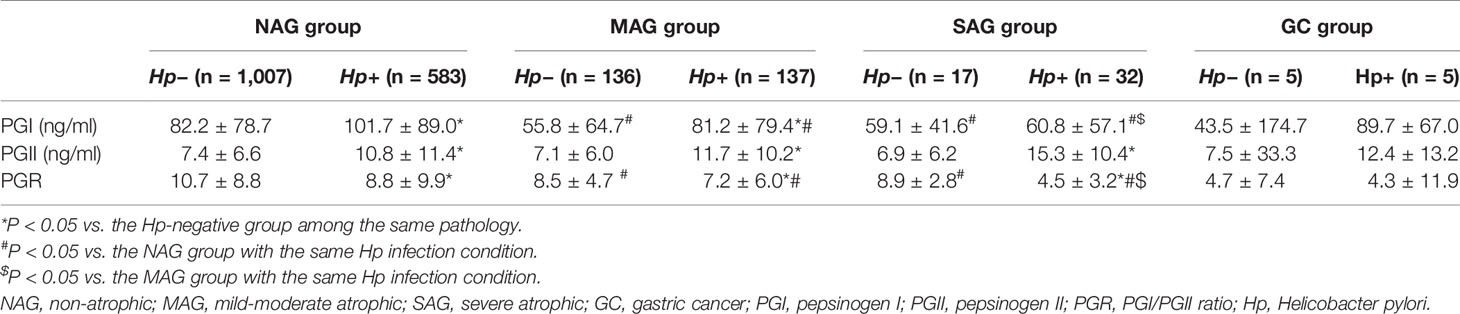
Table 2 Differences in serum PG levels among the NAG, MAG, SAG, and GC group in subgroup analysis based on Hp infection.
In the Hp-positive population, PGI and PGR levels in the MAG and SAG groups were lower than those of the NAG group (P = 0.007 and P = 0.002; P < 0.001 and P < 0.001). Meanwhile, PGI and PGR levels in the SAG group were significantly lower than those of the MAG group (P = 0.026 and P < 0.001). In Hp-negative subjects, PGI and PGR levels in the MAG and SAG groups were lower than those of the NAG group (all P < 0.001) (Table 2).
Serum PG Differences in Various Regions
The participants were subgrouped according to regions. In the NAG group, there were significant differences in PGI levels among the five Chinese regions assessed. There were also significant differences in PGII levels among the five regions, except for Central/Northern vs. Southern China. PGR levels in Southern China were higher than those of the other regions. Meanwhile, there were differences in baseline data among the five regions, including mean age, nationality, diet habit, smoking, and Hp infection rate, among others (Table 3).
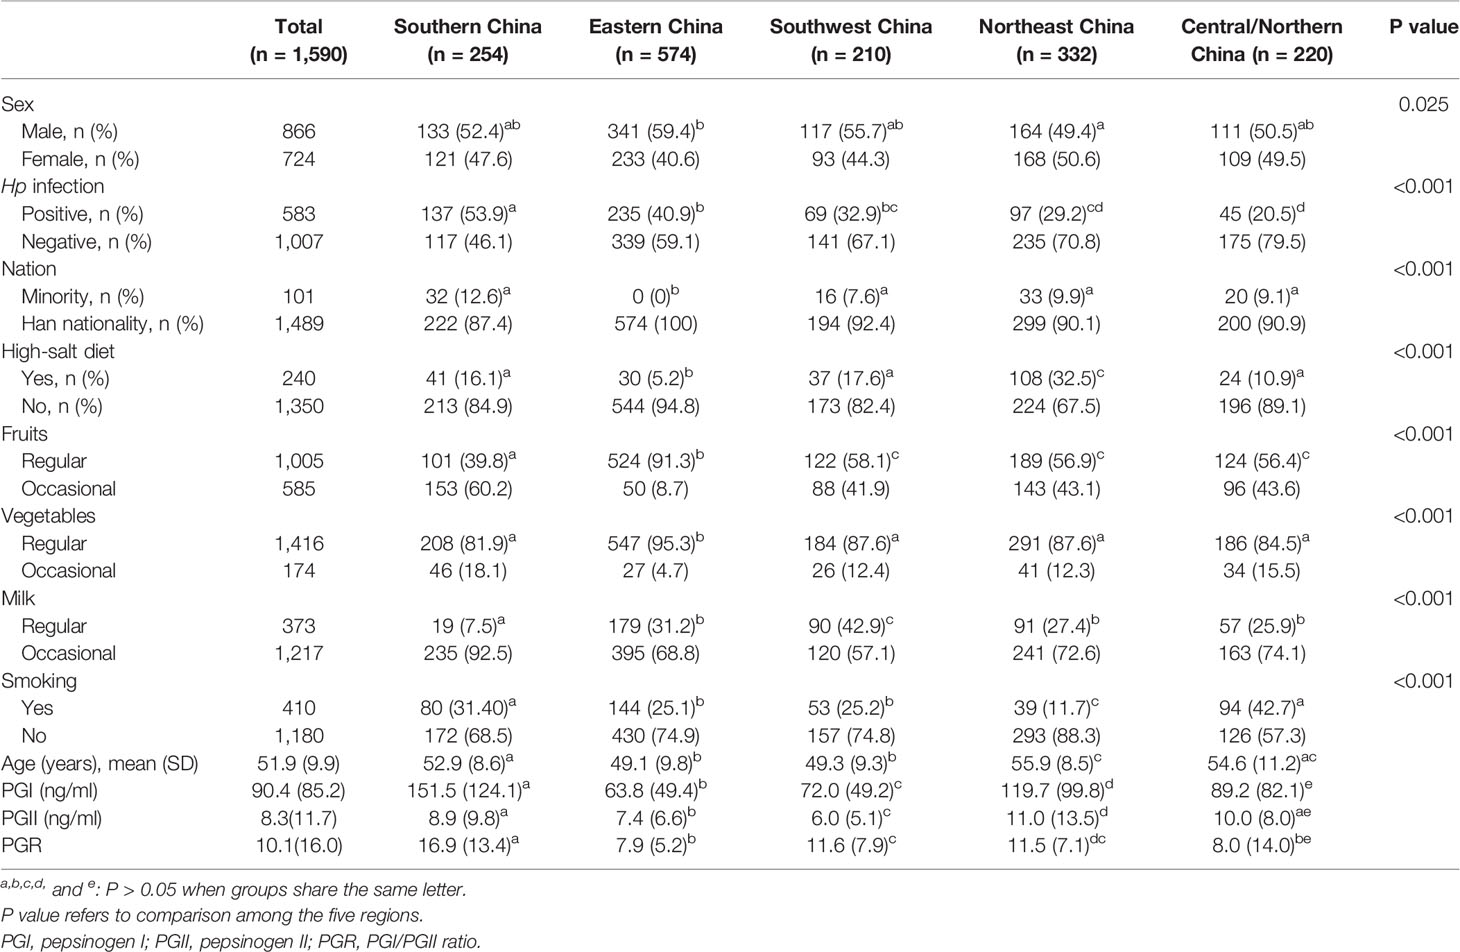
Table 3 Differences of PG baseline levels among the different regions in the NAG group.
Diagnostic Value of PG for Atrophy
The MAG and SAG groups were combined into the atrophy group, which was compared with the NAG group. The best cutoff for atrophy was estimated at PGI ≤73.1 ng/ml (AUC = 0.596) and PGR ≤9.8 (AUC = 0.636). When the Hp status was taken into consideration, the best cutoffs among the Hp-negative subgroup for atrophy were PGI ≤62.5 ng/ml (AUC = 0.623) and PGR ≤11.5 (AUC = 0.621). In the Hp-positive subgroup, the best cutoffs were PGI ≤90.2 ng/ml (AUC = 0.598) and PGR ≤8.8 (AUC = 0.627) (Table 4). The best cutoff values for atrophy in different regions were different (Supplementary Table 1).
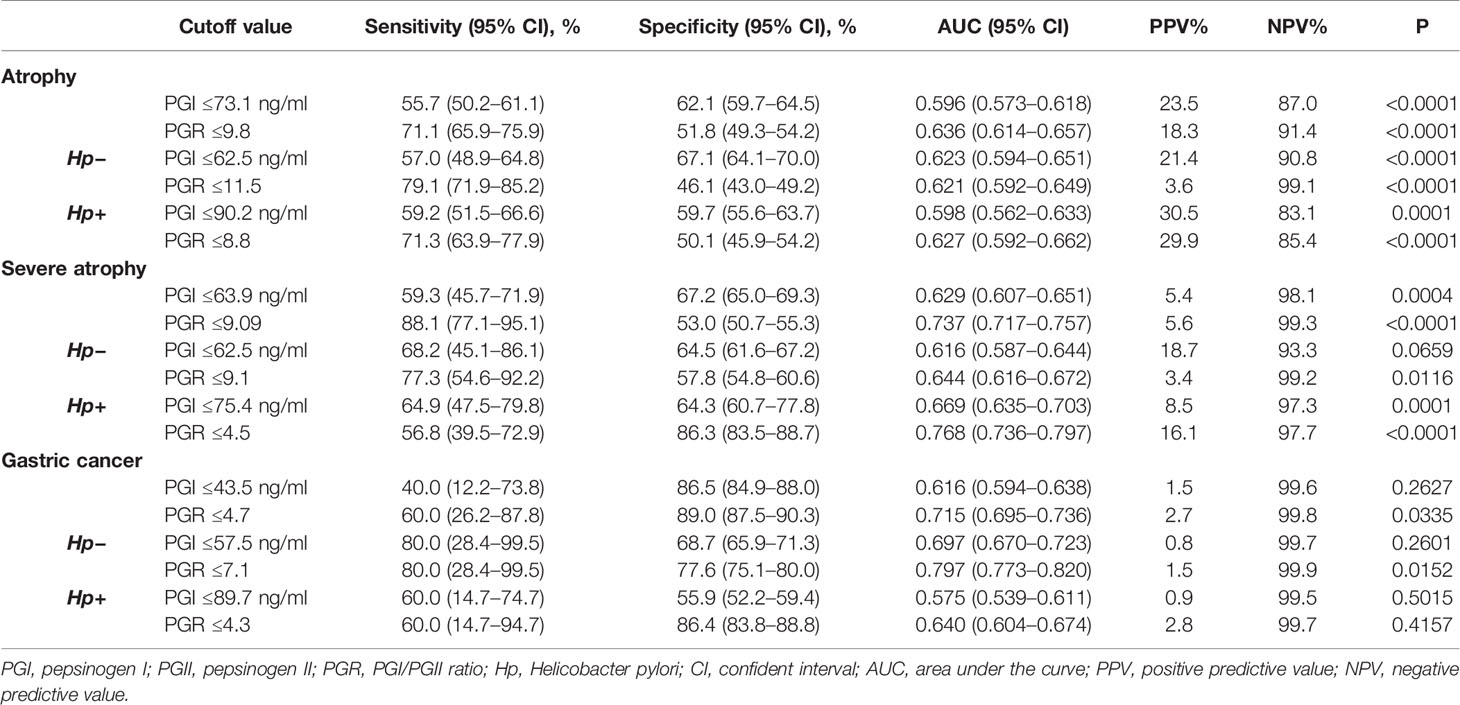
Table 4 Diagnostic value of PG for atrophy, severe atrophy, and gastric cancer.
Diagnostic Value of PG for Severe Atrophy
The NAG and MAG groups were combined into one group, which was compared with the SAG group. The best cutoff value for severe atrophy was PGR ≤9.09 (AUC = 0.737). In the Hp-positive subgroup, the best cutoff value was PGR ≤4.5 (AUC = 0.768) (Table 4). Because of the limited numbers of SAG cases in Central/Northern China and Southern China, those subgroups were not included in the analysis. The best cutoff for severe atrophy in Eastern China was PGR ≤4.5 (AUC = 0.680). The cutoff in Southwest China was PGR ≤7.4 (AUC = 0.813). The cutoff in Northeast China was PGR ≤8.9 (AUC = 0.781) (Supplementary Table 1).
Diagnostic Value of PG for GC
The best cutoff for GC was PGR ≤4.7 (AUC = 0.715). When the Hp status was taken into consideration, the best cutoff in the Hp-negative subgroup for GC was PGR ≤7.1 (AUC = 0.797). There was no best cutoff in the Hp-positive subgroup (P > 0.05) (Table 4).
Discussion
PGs can be used for GC screening, but the cutoffs vary among studies, and PG levels are influenced by numerous factors. The aim of the present study was to examine the diagnostic value of PG levels and Helicobacter pylori (Hp) status for screening GC and AG in asymptomatic individuals undergoing health checkup in China. This multicenter cross-sectional study suggested that serum PG levels can be used for screening GC and AG. The results suggest that different cutoff values should possibly be used in different Hp status groups and geographical regions, but it will have to be validated in the future using large-sample studies.
AG is an important turning point in the Correa theory (9). Here, in asymptomatic individuals undergoing health checkup, 14.5 and 17.3% participants showed AG and intestinal metaplasia, respectively, while 2.5% had severe AG (OLGA grades III and IV). Such patients have a high risk of developing GC within 5 years. Effective monitoring and intervention in this group are important measures to reduce the incidence of GC and improve the detection rate of early GC. Many factors were independently associated with AG in this work, among which high intake of fruits and vegetables may have a protective effect. Such benefit may be related to vitamin C levels, which are thought to reduce the formation of carcinogenic N-nitroso compounds in the stomach (31, 32). Meanwhile, previous studies have found a strong correlation between citrus fruits and gastric cancer (33). Therefore, the types of vegetables and fruits that could help prevent GC should be assessed in follow-up studies.
A meta-analysis of 31 studies involving a total of 1,520 patients with GC and 2,265 with AG found that serum PG levels have great potential as a non-invasive, population-based screening tool for GC and AG (17). The present study also confirmed that PGI levels and PGRs significantly decreased with the aggravation of atrophy, and PGR was even more significant. Impeding its wide application, PG levels are affected by race, region, age, gender, height, weight, body surface area, smoking, and alcohol consumption, among others (25). The cutoff values of PG for the diagnosis of atrophy vary among studies. Serum PGI ≤70 ng/ml and PGR ≤3 have been the most widely accepted values for detecting AG, with a sensitivity of 66.7–84.6% and a specificity of 73.5–87.1% (34–36). According to a European report, the cutoff values for fundus atrophy are PGI ≤56 ng/ml (sensitivity of 61.9% and specificity of 94.8%) and PGR ≤5 (sensitivity of 75.0% and specificity of 91.0%) (19). A study in Korea suggested that PGI ≤70 ng/ml has a good sensitivity (72.4%) for AG, but a low specificity (20.2%). The sensitivity and specificity of PGR ≤3 were found to be 59.2–61.7% and 61.0%, respectively (18). In the present study, the cutoff values for severe atrophy were significantly different from the above data in the Hp-positive subgroup (PGR ≤9.1 and PGR ≤4.5). In terms of the diagnostic value for GC, the cutoff value was PGR ≤4.7, but in the Hp-negative subgroup, the cutoff was PGR ≤7.1. Still, the number of patients with GC was small in the present study since the study population was made of healthy individuals receiving routine physical examination, and the PG cutoff values for GC were purely exploratory.
Hp infection has a significant effect on serum PG levels. In the present study PGI and PGII levels in the Hp-positive subgroup were higher than those of the Hp-negative subgroup, with PGII being higher and PGR being lower. In addition, Hp infection has been shown to participate significantly in the progression of gastric mucosal inflammation and the development of IM and AG (37, 38). As shown above, Hp prevalence was predominantly elevated in the MAG (49.8%) and SAG (65.3%) groups. China is a country with a high incidence of Hp infection, whose rate in the Chinese population is around 40–55% (20, 39–41). The overall Hp infection rate in the present study was 41.7%, similar to the literature (20). Therefore, using different cutoff values of PG for the Hp-negative and Hp-positive subgroups for detecting GC and AG could be considered, as well as in various regions with distinct Hp infection prevalence rates. Additional studies are required to determine the exact cutoff points of PG in different populations.
In the present study, PG levels in the NAG group showed significant differences among different regions of China. From the perspective of PGR, there were no significant differences between Eastern and Central/Northern China, but these levels were significantly different in Northeast and Southwest China. However, as shown in Table 3, there were differences in baseline data among regions, especially in Hp infection rate. Thus, differences in PG baseline levels among various regions may be related to these baseline data. Interestingly, there were significant differences in gender, nation, age, diet habit, smoking, and Hp infection rate between Eastern and Central/Northern China, but there was no difference in PGR levels. However, there was a significant difference in PGR levels between Eastern and Southwest China, with no differences in gender, smoking, age, and Hp infection rate, except for diet habit and nation. This suggests that in the subsequent studies assessing PG cutoff in China, it may be necessary to further consider the influence of ethnic groups (Southern China, Northeast China, and Southwest China are the places where ethnic minorities are gathered), dietary habits, Hp infection, and other factors.
This study had limitations. The numbers of patients with lesions and GC were small, requiring further sample size expansion to confirm the above results, especially in asymptomatic individuals. In addition, selection bias might exist since the included patients were individuals intending to undergo gastroscopy, suggesting good socioeconomic status. Large-scale and well-designed prospective studies are warranted for further validation of the cutoff values of PG in different regions in the Hp-negative and Hp-positive subgroups, combining lifestyle indexes such as diet habit and smoking in order to accurately determine the low-risk and high-risk groups for the screening of GC and AG.
In conclusion, dietary habits, smoking, age, and Hp infection are risk factors for GC and AG. Serum PG levels might be used for the screening of AG and GC. The results suggest that different cutoff values should possibly be used in different Hp status groups and geographical regions, but it will have to be validated in future studies with a large sample size. Future studies should also examine the value of PG levels for GC detection.
Data Availability Statement
The datasets presented in this study can be found in online repositories. The names of the repository/repositories and accession number(s) can be found in the article/Supplementary Material.
Ethics Statement
The studies involving human participants were reviewed and approved by the ethics committees of various participating hospitals. The patients/participants provided their written informed consent to participate in this study.
Author Contributions
YT, YZ, and ZYS carried out the studies, performed the statistical analysis, and drafted the manuscript. HGW, XQH, HWX, HL, PS, LRG, HBW, HZX, YHL, DW, and SZL participated in acquisition, analysis, or interpretation of data. All authors contributed to the article and approved the submitted version.
Funding
The work of YT was supported by the National Natural Science Foundation of China (#71804161) and the Zhejiang Province Major Disease Diagnosis and Treatment Technology Research Center (#17-2018-%s-0077). The work of ZS was supported by the China Foundation for Health Promotion (#CHPF-2015-WASC-001).
Conflict of Interest
The authors declare that the research was conducted in the absence of any commercial or financial relationships that could be construed as a potential conflict of interest.
Publisher’s Note
All claims expressed in this article are solely those of the authors and do not necessarily represent those of their affiliated organizations, or those of the publisher, the editors and the reviewers. Any product that may be evaluated in this article, or claim that may be made by its manufacturer, is not guaranteed or endorsed by the publisher.
Acknowledgments
This research was supported by the Healthcare Center, the Endoscopy Center, and the Institute for Cancer Research at the Second Affiliated Hospital of Zhejiang University. We express our gratitude to all study participants for their support.
Supplementary Material
The Supplementary Material for this article can be found online at: https://www.frontiersin.org/articles/10.3389/fonc.2021.652574/full#supplementary-material
References
1. NCCN Clinical Practice Guidelines in Oncology (NCCN Guidelines). Gastric Cancer. Version 1.2020. Fort Washington: National Comprehensive Cancer Network (2020).
2. Van Cutsem E, Sagaert X, Topal B, Haustermans K, Prenen H. Gastric Cancer. Lancet (2016) 388(10060):2654–64. doi: 10.1016/S0140-6736(16)30354-3
3. Bray F, Ferlay J, Soerjomataram I, Siegel RL, Torre LA, Jemal A. Global Cancer Statistics 2018: GLOBOCAN Estimates of Incidence and Mortality Worldwide for 36 Cancers in 185 Countries. CA: Cancer J Clin (2018) 68(6):394–424. doi: 10.3322/caac.21492
4. Smyth EC, Verheij M, Allum W, Cunningham D, Cervantes A, Arnold D, et al. Gastric Cancer: ESMO Clinical Practice Guidelines for Diagnosis, Treatment and Follow-Up. Ann Oncol (2016) 27(suppl 5):v38–49. doi: 10.1093/annonc/mdw350
5. Yamagata H, Kiyohara Y, Aoyagi K, Kato I, Iwamoto H, Nakayama K, et al. Impact of Helicobacter Pylori Infection on Gastric Cancer Incidence in a General Japanese Population: The Hisayama Study. Arch Internal Med (2000) 160(13):1962–8. doi: 10.1001/archinte.160.13.1962
6. Hsu PI, Lai KH, Hsu PN, Lo GH, Yu HC, Chen WC, et al. Helicobacter Pylori Infection and the Risk of Gastric Malignancy. Am J Gastroenterol (2007) 102(4):725–30. doi: 10.1111/j.1572-0241.2006.01109.x
7. Chen W, Zheng R, Baade PD, Zhang S, Zeng H, Bray F, et al. Cancer Statistics in China, 2015. CA: Cancer J Clin (2016) 66(2):115–32. doi: 10.3322/caac.21338
8. Zeng H, Zheng R, Guo Y, Zhang S, Zou X, Wang N, et al. Cancer Survival in China, 2003-2005: A Population-Based Study. Int J Cancer (2015) 136(8):1921–30. doi: 10.1002/ijc.29227
9. Namekata T, Miki K, Kimmey M, Fritsche T, Hughes D, Moore D, et al. Chronic Atrophic Gastritis and Helicobacter Pylori Infection Among Japanese Americans in Seattle. Am J Epidemiol (2000) 151(8):820–30. doi: 10.1093/oxfordjournals.aje.a010282
10. de Vries AC, van Grieken NC, Looman CW, Casparie MK, de Vries E, Meijer GA, et al. Gastric Cancer Risk in Patients With Premalignant Gastric Lesions: A Nationwide Cohort Study in the Netherlands. Gastroenterology (2008) 134(4):945–52. doi: 10.1053/j.gastro.2008.01.071
11. Hamashima C. Benefits and Harms of Endoscopic Screening for Gastric Cancer. World J Gastroenterol (2016) 22(28):6385–92. doi: 10.3748/wjg.v22.i28.6385
12. Pasechnikov V, Chukov S, Fedorov E, Kikuste I, Leja M. Gastric Cancer: Prevention, Screening and Early Diagnosis. World J Gastroenterol (2014) 20(38):13842–62. doi: 10.3748/wjg.v20.i38.13842
13. Kageyama T. Pepsinogens, Progastricsins, and Prochymosins: Structure, Function, Evolution, and Development. Cell Mol Life Sci (2002) 59(2):288–306. doi: 10.1007/s00018-002-8423-9
14. Agkoc M, Dursun H, Albayrak F, Yilmaz O, Kiziltunc A, Yilmaz A, et al. Usefulness of Serum Pepsinogen Levels as a Screening Test for Atrophic Gastritis and Gastric Cancer. Eurasian J Med (2010) 42(1):15–8. doi: 10.5152/eajm.2010.05
15. Westerveld BD, Pals G, Lamers CB, Defize J, Pronk JC, Frants RR, et al. Clinical Significance of Pepsinogen A Isozymogens, Serum Pepsinogen A and C Levels, and Serum Gastrin Levels. Cancer (1987) 59(5):952–8. doi: 10.1002/1097-0142(19870301)59:5<952::aid-cncr2820590517>3.0.co;2-g
16. Oishi Y, Kiyohara Y, Kubo M, Tanaka K, Tanizaki Y, Ninomiya T, et al. The Serum Pepsinogen Test as a Predictor of Gastric Cancer: The Hisayama Study. Am J Epidemiol (2006) 163(7):629–37. doi: 10.1093/aje/kwj088
17. Huang YK, Yu JC, Kang WM, Ma ZQ, Ye X, Tian SB, et al. Significance of Serum Pepsinogens as a Biomarker for Gastric Cancer and Atrophic Gastritis Screening: A Systematic Review and Meta-Analysis. PLoS One (2015) 10(11):e0142080. doi: 10.1371/journal.pone.0142080
18. Kang JM, Kim N, Yoo JY, Park YS, Lee DH, Kim HY, et al. The Role of Serum Pepsinogen and Gastrin Test for the Detection of Gastric Cancer in Korea. Helicobacter (2008) 13(2):146–56. doi: 10.1111/j.1523-5378.2008.00592.x
19. Nasrollahzadeh D, Aghcheli K, Sotoudeh M, Shakeri R, Persson EC, Islami F, et al. Accuracy and Cut-Off Values of Pepsinogens I, II and Gastrin 17 for Diagnosis of Gastric Fundic Atrophy: Influence of Gastritis. PLoS One (2011) 6(10):e26957. doi: 10.1371/journal.pone.0026957
20. Tong Y, Wu Y, Song Z, Yu Y, Yu X. The Potential Value of Serum Pepsinogen for the Diagnosis of Atrophic Gastritis Among the Health Check-Up Populations in China: A Diagnostic Clinical Research. BMC Gastroenterol (2017) 17(1):88. doi: 10.1186/s12876-017-0641-6
21. Miki K. Gastric Cancer Screening by Combined Assay for Serum Anti-Helicobacter Pylori IgG Antibody and Serum Pepsinogen Levels - "ABC Method". Proc Japan Acad Ser B Phys Biol Sci (2011) 87(7):405–14. doi: 10.2183/pjab.87.405
22. Moss SF. The Clinical Evidence Linking Helicobacter Pylori to Gastric Cancer. Cell Mol Gastroenterol Hepatol (2017) 3(2):183–91. doi: 10.1016/j.jcmgh.2016.12.001
23. Amieva M, Peek RM Jr. Pathobiology of Helicobacter Pylori-Induced Gastric Cancer. Gastroenterology (2016) 150(1):64–78. doi: 10.1053/j.gastro.2015.09.004
24. Huang TC, Lee PT, Wu MH, Huang CC, Ko CY, Lee YC, et al. Distinct Roles and Differential Expression Levels of Wnt5a mRNA Isoforms in Colorectal Cancer Cells. PLoS One (2017) 12(8):e0181034. doi: 10.1371/journal.pone.0181034
25. Ikeda F, Shikata K, Hata J, Fukuhara M, Hirakawa Y, Ohara T, et al. Combination of Helicobacter Pylori Antibody and Serum Pepsinogen as a Good Predictive Tool of Gastric Cancer Incidence: 20-Year Prospective Data From the Hisayama Study. J Epidemiol (2016) 26(12):629–36. doi: 10.2188/jea.JE20150258
26. Tu H, Sun L, Dong X, Gong Y, Xu Q, Jing J, et al. A Serological Biopsy Using Five Stomach-Specific Circulating Biomarkers for Gastric Cancer Risk Assessment: A Multi-Phase Study. Am J Gastroenterol (2017) 112(5):704–15. doi: 10.1038/ajg.2017.55
27. Wang X, Lu B, Meng L, Fan Y, Zhang S, Li M. The Correlation Between Histological Gastritis Staging- ’OLGA/OLGIM’ and Serum Pepsinogen Test in Assessment of Gastric Atrophy/Intestinal Metaplasia in China. Scand J Gastroenterol (2017) 52(8):822–7. doi: 10.1080/00365521.2017.1315739
28. Leung WK, Chow TP, Ng EK, Chan FK, Chung SC, Sung JJ. Validation of a New Immunoblot Assay for the Diagnosis of Helicobacter Pylori in the Asian Population. Aliment Pharmacol Ther (2001) 15(3):423–8. doi: 10.1046/j.1365-2036.2001.00899.x
29. Dixon MF, Genta RM, Yardley JH, Correa P. Classification and Grading of Gastritis. The Updated Sydney System. International Workshop on the Histopathology of Gastritis, Houston 1994. Am J Surg Pathol (1996) 20(10):1161–81. doi: 10.1097/00000478-199610000-00001
30. Zhou Y, Li HY, Zhang JJ, Chen XY, Ge ZZ, Li XB. Operative Link on Gastritis Assessment Stage Is an Appropriate Predictor of Early Gastric Cancer. World J Gastroenterol (2016) 22(13):3670–8. doi: 10.3748/wjg.v22.i13.3670
31. Liu C, Russell RM. Nutrition and Gastric Cancer Risk: An Update. Nutr Rev (2008) 66(5):237–49. doi: 10.1111/j.1753-4887.2008.00029.x
32. Lunet N, Valbuena C, Vieira AL, Lopes C, Lopes C, David L, et al. Fruit and Vegetable Consumption and Gastric Cancer by Location and Histological Type: Case-Control and Meta-Analysis. Eur J Cancer Prev (2007) 16(4):312–27. doi: 10.1097/01.cej.0000236255.95769.22
33. La Vecchia C, Negri E, Decarli A, D’Avanzo B, Franceschi S. A Case-Control Study of Diet and Gastric Cancer in Northern Italy. Int J Cancer (1987) 40(4):484–9. doi: 10.1002/ijc.2910400409
34. Bornschein J, Selgrad M, Wex T, Kuester D, Malfertheiner P. Serological Assessment of Gastric Mucosal Atrophy in Gastric Cancer. BMC Gastroenterol (2012) 12:10. doi: 10.1186/1471-230X-12-10
35. Leja M, Kupcinskas L, Funka K, Sudraba A, Jonaitis L, Ivanauskas A, et al. The Validity of a Biomarker Method for Indirect Detection of Gastric Mucosal Atrophy Versus Standard Histopathology. Dig Dis Sci (2009) 54(11):2377–84. doi: 10.1007/s10620-009-0947-5
36. Kikuchi S, Kato M, Katsuyama T, Tominaga S, Asaka M. Design and Planned Analyses of an Ongoing Randomized Trial Assessing the Preventive Effect of Helicobacter Pylori Eradication on Occurrence of New Gastric Carcinomas After Endoscopic Resection. Helicobacter (2006) 11(3):147–51. doi: 10.1111/j.1523-5378.2006.00392.x
37. Zhou L, Lin S, Ding S, Huang X, Jin Z, Cui R, et al. Relationship of Helicobacter Pylori Eradication With Gastric Cancer and Gastric Mucosal Histological Changes: A 10-Year Follow-Up Study. Chin Med J (2014) 127(8):1454–8. doi: 10.3760/cma.j.issn.0366-6999.20132494
38. Valle J, Kekki M, Sipponen P, Ihamaki T, Siurala M. Long-Term Course and Consequences of Helicobacter Pylori Gastritis. Results of a 32-Year Follow-Up Study. Scand J Gastroenterol (1996) 31(6):546–50. doi: 10.3109/00365529609009126
39. Shi R, Xu S, Zhang H, Ding Y, Sun G, Huang X, et al. Prevalence and Risk Factors for Helicobacter Pylori Infection in Chinese Populations. Helicobacter (2008) 13(2):157–65. doi: 10.1111/j.1523-5378.2008.00586.x
40. Wang W, Jiang W, Zhu S, Sun X, Li P, Liu K, et al. Assessment of Prevalence and Risk Factors of Helicobacter Pylori Infection in an Oilfield Community in Hebei, China. BMC Gastroenterol (2019) 19(1):186. doi: 10.1186/s12876-019-1108-8
Keywords: pepsinogens, gastric cancer, precancerous lesions, Helicobacter pylori, screening, diagnostic value
Citation: Tong Y, Wang H, Zhao Y, He X, Xu H, Li H, Shuai P, Gong L, Wu H, Xu H, Luo Y, Wang D, Liu S and Song Z (2021) Diagnostic Value of Serum Pepsinogen Levels for Screening Gastric Cancer and Atrophic Gastritis in Asymptomatic Individuals: A Cross-Sectional Study. Front. Oncol. 11:652574. doi: 10.3389/fonc.2021.652574
Received: 12 January 2021; Accepted: 22 July 2021;
Published: 24 August 2021.
Edited by:
Prasanna K. Santhekadur, JSS Academy of Higher Education and Research, IndiaReviewed by:
Srikanta B. Manjegowda, Mysore Medical College & Research Institute, IndiaLiping Sun, The First Affiliated Hospital of China Medical University, China
Copyright © 2021 Tong, Wang, Zhao, He, Xu, Li, Shuai, Gong, Wu, Xu, Luo, Wang, Liu and Song. This is an open-access article distributed under the terms of the Creative Commons Attribution License (CC BY). The use, distribution or reproduction in other forums is permitted, provided the original author(s) and the copyright owner(s) are credited and that the original publication in this journal is cited, in accordance with accepted academic practice. No use, distribution or reproduction is permitted which does not comply with these terms.
*Correspondence: Zhenya Song, songzhenya@zju.edu.cn