Effects of Salinity Stress at Reproductive Growth Stage on Rice (Oryza sativa L.) Composition, Starch Structure, and Physicochemical Properties
 Dongping Yao1,2,3†
  Jun Wu1† Qiuhong Luo4 Dongmeng Zhang4 Wen Zhuang1 Gui Xiao1 Qiyun Deng1,5 Bin Bai1*
- 1State Key Laboratory of Hybrid Rice, Hunan Hybrid Rice Research Center, Changsha, China
- 2College of Plant Science and Technology, Hunan Biological and Electromechanical Polytechnic, Changsha, China
- 3National Center of Technology Innovation for Saline-Alkali Tolerant Rice in Sanya, Sanya, China
- 4College of Agronomy, Hunan Agricultural University, Changsha, China
- 5Bio-Rice (Hunan) Co. Ltd., Changsha, China
This study aimed to investigate the changes in polished rice composition, starch structure, and physicochemical properties from three rice cultivars treated with medium and high salinity stress at the reproductive growth stage. The results showed that salt stress led to poor milling and appearance quality, higher total starch content, protein content, higher proportion of the medium, and long chains of amylopectin, as well as gelatinization temperature (GT) but lower amylose content and lower proportion of the short chain of amylopectin. Compared with salt-sensitive cultivars, the salt-tolerant cultivars exhibited lower GT and gelatinization enthalpy, better pasting properties, and more stable crystal structure; therefore, their eating and cooking quality (ECQ) was less affected. The above results imply that salt stress at the reproductive growth stage can degrade ECQ and can slightly increase the pasting property of starch from salt-tolerant rice cultivar.
Introduction
Rice (Oryza sativa L.) is one of the most important food crops providing more than 20% of the world's total dietary energy. It is grown in many parts of the world, especially in Asia where almost 90% of rice is cultivated (1). Rice grain is mainly composed of carbohydrates, most predominantly starch which accounts for 50–90% of rice grain dry weight. The changes in starch-related structure and physicochemical properties affect directly rice quality, especially eating and cooking quality (ECQ) (2). ECQ is usually evaluated by the amylose content, amylopectin chain length distribution, gelatinization temperature (GT), and pasting property (3). Yield stability is a primary agronomic concern where rice is critical to food security, while ECQ is an important factor to determine the market acceptance and price of rice (4). Both yield stability and ECQ are affected easily by environmental factors, and there is an increasing concern about both specific effects of environmental stress. Salinity stress is a major environmental factor limiting plant growth and crop production. Nearly 20% of arable land and half of the irrigated areas of the world are under salt stress, which leads to significant economic losses of food crops (5). Salinity stress, especially a high concentration of NaCl, is mainly caused by osmotic inhibition and ionic toxicity (6), which ultimately inhibits crop photosynthesis, decreases yield, and has a great influence on the accumulation, structure, and physicochemical properties of starch in cereal crops (7).
Among all the crops, rice is the first choice of grain crops for improving the quality and efficiency of saline–alkali land, but most rice cultivars are sensitive to salinity stress with the threshold limit of electrical conductivity (EC) around 3 dS/m (1). Soils with exceeding EC of 4 and 8 dS/m are considered moderate and high salt stress, respectively (8–10), and the salinity level of more than 5 dS/m will cause a significant reduction in terms of rice yield and quality (11). Being a moderately salt-sensitive crop, the responses of rice to salt stress are complex and its sensitivity varies from species to species, growth and development stages, and stress duration (12). Generally, the seedling stage and reproductive growth stage are the most sensitive to salt stress, and there is no necessary correlation between salt tolerances at different growth stages (13). The reproductive growth stage has the greatest impact on yield and quality (14). Panicle sterility is considered to be a major threat under salt stress during the rice reproductive stage (5). In terms of milling and appearance quality, most of the studies reported that salt stress had the greatest effect on the head rice rate and chalkiness, followed by the polished rice rate, the brown rice rate, and the grain length/width ratio (15).
A few studies on the effects of salt stress on physicochemical properties of rice starch have been reported. However, the results of the studies on the response of rice quality to salt stress are not consistent due to the differences in terms of treatments and tested rice cultivars. Aref and Rad (16) reported that salt stress significantly decreased starch synthase activity, which led to the reduction of starch accumulation. In addition, Rao et al. (17) proposed that 8 dS/m or higher salinity levels reduced amylose content. In contrast, Thitisaksakul et al. (14) found that salinity with EC of 2 or 4 dS/m increased amylose content during seedling and flowering stages. Some studies suggested that amylose content and pasting property being measured by Rapid Visco Analyser (RVA) were closely related to the salt concentration of treatment. Under low salt concentration, the viscosity of rice starch was generally higher than that of the control, while amylose content was lower than that of the control. Under high salt concentration, the amylose content of rice increased, while the viscosity decreased significantly compared with the control (15, 18). The effects of salt stress on physicochemical properties of rice starch need further study and systematic analysis. Therefore, the study was carried out to elucidate the effects of salinity stress on rice composition, starch structure, and physicochemical properties, in order to systematically evaluate the quality, especially ECQ level of salt-tolerant rice cultivars under salt stress.
Materials and Methods
Plant Materials and Planting Conditions
The salt stress experiment was carried out in the rainproof canopy of State Key Laboratory of Hybrid Rice, Hunan Hybrid Rice Research Center in Changsha City, Hunan Province, China, in 2020. The roof of the canopy was covered with white transparent plastic film with light transmittance of more than 90% and surrounded by barbed wire to ensure the circulation of natural air. There were three soil culture ponds in the rainproof canopy, each of which was 4.7 m long, 1.3 m wide, and 0.9 m high of soil.
Three promising rice cultivars were selected as plant materials for this experiment, based on their different response to salinity stress, namely, Xiang liangyou 900 (salt-tolerant cultivar), Y liangyou 900 (salt-tolerant cultivar), and IR64 (salt-sensitive cultivar) which were abbreviated as XLY900, YLY900, and IR64, respectively (Supplementary Table S1). These three cultivars were provided by Hunan Hybrid Rice Research Centre and showed relatively large differences in response to salt stress, based on our preliminary experiment on the evaluation of the salt tolerance of 28 rice cultivars by salinity treatment of 12 and 5 dS/m in the experimental base of National Center of Technology Innovation for Saline-Alkali Tolerant Rice in Sanya City of China. As the growth period of YLY900 is 2 days earlier than that of XLY900, while the growth period of IR64 is 5 days earlier than that of XLY900, the full and fresh seeds were sown on 30 April, 3 May, and 6 May, respectively, for XLY900, YLY900, and IR64 to adjust the growth period of three cultivars, thus ensuring that the growth and development stages of each cultivar were consistent. When the seedlings grew to the three-leaf stage, seedlings with the same growth were selected and transplanted to soil culture ponds. Water and fertilizer management was the same as in the field. The total nitrogen application was 180 kg·hm−2, and the ratio of nitrogen, phosphorus, and potassium was 1.0:0.6:1.1. In the base fertilizer, N and K accounted for 30 and 40% of the total N and K application, respectively, and all P fertilizer was used as the base fertilizer. In tillering fertilizer, N and K accounted for 40 and 20% of the total N and K application, and the remaining N and K fertilizers were used as panicle fertilizer.
Salinity Stress Treatments
Salt stress was designed to achieve EC values of 12 and 5 dS/m by adding 137 and 51 mM NaCl into two soil culture ponds at reproductive (R) physiological stages (R2 stage until maturity) of rice (19, 20). Another soil culture pond was used as control without the addition of NaCl and its EC was maintained at EC 0–1 dS/m. Three soil ponds constituted three salt ponds, and each salt pond was planted alternately in rows of XLY900, YLY900, and IR64 (Supplementary Figure S1). Digital Hand-Held “Pocket” Salt Meter (PAL-SALT, ATAGO, Japan) was used to monitor the salt concentration of the water layer every day and to adjust in a timely manner the salt concentration of the water layer being changed by evaporation. The water was cut off 7 days before the harvest. The field sowing, transplanting, management, and sampling methods were the same for all cultivars of the three batches of rice used in the experiment (2).
Measure Items and Methods
Determination of Milling and Appearance Quality
Brown rice rate, polished rice rate, head milled rice rate, the ratio of grain length to width, and chalkiness degree were determined according to the agricultural industry standards NY/T 83-2017 and NY/T 2334-2013 of the People's Republic of China to evaluate grain milling and appearance quality. To determine the milling quality, 140 g of rice was dehulled using a huller (THU35C, SATAKE, Japan) and weighed. The brown rice rate was then calculated. It was then followed by the processing of 100 g of brown rice into milled rice using a milling machine (LTJM-2099, Zhengzhou Zhonggu Machinery Equipment Co., Ltd, Zhengzhou, China) and weighed to calculate the polished rice rate. The Image Analysis Software SC-E (Hangzhou Wanshen Detection Technology Co., Ltd, Hangzhou, China) was used to obtain the head milled rice rate. In contrast, to determine the appearance quality, scanning images of milled rice were obtained by a scanner (MICROTEK ScanMaker i800 plus, Shanghai Zhongjing Technology Co., Ltd, Shanghai, China). The Image Analysis Software SC-E was then used to analyze the scanned images of the head milled rice to identify the number and area of chalky grains and to calculate the chalkiness, grain length, grain width, and length–width ratio.
Determination of Polished Rice Composition, Starch Isolation, and Starch Physicochemical Indexes
Rice starch isolation, gelatinization property, pasting property, and X-ray diffraction (XRD) measurement were determined to evaluate the effects of physicochemical properties of rice starch by salt stress using the methods described by Yao et al. (2). Total starch content was determined using the total starch detection kit (Megazyme, K-TSTA).
The amylose content was determined according to the agricultural industry standard NY/T 2639 of the People's Republic of China. To determine the amylose content, 10 g of milled rice was accurately weighed and pulverized using a mill. After sifting through a 0.25-mm sieve, the sample was poured into a paper bag and placed under the same conditions for 2 days with amylose reference samples (purchased from China National Rice Research Institute, containing sticky rice, low, medium, and high amylose reference samples) to balance water content. The samples to be tested and reference samples were weighed (0.1 g ± 0.2 mg) and placed in a 100-ml volumetric flask. A volume of 1.0 ml of 95% ethanol was added to moisten and disperse the samples, 9.0 ml sodium hydroxide solution (1.0 mol/L) was added, and then the volumetric flask was placed in a boiling water bath for 10 min. After cooling to room temperature, distilled water was added for constant volume to serve as an amylose reference solution and a sample test solution. At the same time, 9.0 ml sodium hydroxide solution (1.0 mol/L) and 91.0 ml distilled water were added to a 100-ml volumetric flask to serve as a blank solution. A volume of 2.5 ml amylose reference solution and sample solution to be tested was absorbed in a 50-ml volumetric flask and then added with about 25 ml water, 0.5 ml acetic acid solution (1 mol/L), and 1.0 ml iodine solution (weighed 2.0 g I2 and 20 g kI and dissolved them in a small amount of water, constant volume to 1,000 ml). Water was then added to a constant volume and the mixture was allowed to rest for 10 min. Finally, a spectrophotometer (SP-722, Shanghai Spectral Instrument Co., Ltd., Shanghai, China) was used and set to zero with the blank solution, while the absorbance value of the reference standard solution was measured at the wavelength of 620 nm. The standard curve was drawn with the absorbance value as the ordinate and amylose content as the abscissa. The absorbance value of the solution to be tested was determined at the wavelength of 620 nm, and its amylose content was converted by the standard curve. Two parallel samples were taken from each sample for determination, and the arithmetic mean value was taken as the result.
The protein content was determined according to the national standard GB 5009.5-2016 of the People's Republic of China. An amount of 0.2 g (accurate to 0.001 g) of powder samples was weighed in the digestion tube (2.25 g K2SO4 and 0.25 g CuSO4·5H2O), 5 ml of concentrated sulfuric acid was added as a catalyst, and the tube was gently shaken to soak the sample and placed on a Digestor (Labtec DT208 Digestor, FOSS, Denmark) for digestion (at the same time, blank test being done). When the temperature of the Digestor reached 420°C, the digestion continued for 60 min. The digestion tube was cooled to room temperature, added 5 ml of distilled water, and connected to an Automatic Kjeltic Nitrogen Analyzer (Kjeltic 8400, FOSS, Denmark) that had been added sodium hydroxide solution, hydrochloric acid or sulfuric acid standard solution, and boric acid solution containing mixed indicator. The determination procedure of the Kjeldahl apparatus includes the addition of liquid automatically, followed by distillation, titration, and calculation. The protein content of the sample was recorded after titration. Two parallel samples were taken from each sample for determination, and the arithmetic mean value was taken as the result.
Amylopectin Chain Length and Granule Size Distribution
Starch chain length distribution was determined by the ICS5000 ion chromatography system (ICS-5000, Thermo Fisher Scientific, Sunnyvale, USA) as performed by Nishi et al. (21) with a minor modification. The Dionex™ CarboPac™ PA200 (3.0 × 250 mm; Thermo Fisher Scientific, Sunnyvale, United States) ionic column was used according to the properties of the glucose chain. Mobile phase A (aqueous solution), mobile phase B (100 mM NaOH and 1 M NaAC), and mobile phase C (100 mM NaOH) were used, with the flow rate controlled at 0.4 ml/min, and the column temperature at 30°C.
The starch granule size distribution was measured using a Malvern laser particle size analyzer (Mastersizer 3000, Malvern Instruments Ltd., UK). Starch powder (100 mg) was weighed and dispersed in 1 ml of absolute ethanol, which was then stirred at 2,000 rpm. The blended samples were placed in the Mastersizer 3000 for determination. The results were analyzed using the Mastersizer 3000 software. According to the method described by Xiong et al. (22), the volume, surface area, and number distribution of the measured starch granules were divided into two types, namely, small and medium starch granules (starch granule diameter d < 10 μm) and large starch granules (d > 10 μm).
Statistical Analysis
All parameters shown in the tables and figures used in this article represent the mean values of the experimental data obtained from triplicate tests for all cultivars sown at three salt ponds. The analysis of all data was performed using the SPSS 24.0 statistical software program (IBM Corporation, Armonk, New York). One-way analysis of variance and Tukey's tests were used to determine whether statistically significant differences (P < 0.05) existed among the means.
Results
Rice Milling and Appearance Quality
Except for the polished rice rate of IR64, the brown rice rate, polished rice rate, and head milled rice rate of all cultivars were not affected by medium salt stress but decreased significantly under high salt concentration (Supplementary Table S2). Chalkiness was the most sensitive index to salinity stress among all milling and appearance quality. Salinity stress at the reproductive growth stage significantly increased chalkiness degree and chalkiness grain rate, and the changes were more significant under high salt stress. For salt-tolerant cultivars under medium and high salt concentrations, chalkiness of XLY900 increased by 385 and 628%, respectively, and chalkiness grain rate increased by 306 and 536%, respectively. However, for YLY900 at medium and high salt concentrations, the chalkiness increased by 715 and 883%, and the chalkiness grain rate increased by 286 and 384%, respectively. The difference in the effect between medium and high salt levels in XLY900 was greater than that in YLY900, which might be attributed to the different response mechanisms between these two cultivars. The chalkiness of salt-sensitive cultivar was most seriously affected by salt stress and increased obviously at medium salt level, but there was no significant difference between medium salt level and high salt level, indicating that the structure of salt-sensitive cultivar had been damaged by medium salinity level. The length–width ratio was the least sensitive to salt stress for these three cultivars.
Chemical Composition of Polished Rice
Salt stress significantly decreased the amylose content of YLY900 and IR64, but the degree of decline was consistent between medium and high salt stress (Table 1). Only the total starch content of XLY900 and YLY900 significantly increased under salt stress. After salt stress treatment, the protein content of the three cultivars showed the same trend, which only increased significantly under high salt stress, while the medium salt concentration had no significant change, indicating that the protein content was not sensitive to medium salt stress, and only the higher salt concentration could lead to the change of protein content.
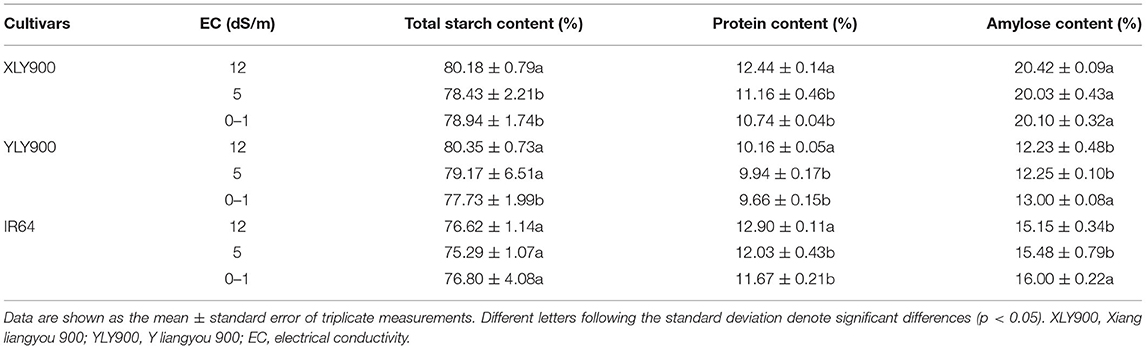
Table 1. Effects of salt stress on the chemical composition of polished rice.
Amylopectin Chain Length Distribution
As for the chain length distribution of amylopectin, it can be seen from the general trend that the three cultivars had similar changes, showing that the short chain with low polymerization degree decreased, while the middle and long chains with high polymerization degree increased, which promoted the formation of more perfect crystals (Figure 1) (23). According to previous studies, amylopectin chain was divided into four types, namely, A chain (6 ≤ DP ≤ 12, short chain), B1 chain (13 ≤ DP ≤ 24, medium chain), B2 chain (25 ≤ DP ≤ 36, medium and long chains), and B3 chain (DP ≥ 37, long chain) (24). As shown in Figure 1, the three cultivars showed the same change trend, i.e., a chain of amylopectin decreased significantly, while medium and long chains B2 and B3 increased obviously under the increasing salt stress. The proportion of B1 chain in all three cultivars first decreased and then increased, but the overall trends of B1 chain decreased in salt-tolerant cultivars, while it increased in the salt-sensitive cultivar. Compared with the salt-tolerant cultivars XLY900 and YLY900, the salt-sensitive cultivar IR64 showed a greater decrease in the A chain, but a lower degree of increase in the medium and long chains B2 and B3. The salt-tolerant cultivars with more medium and long chains of amylopectin promoted the formation of the double helix, which was conducive to the crystallization of starch granules (25).
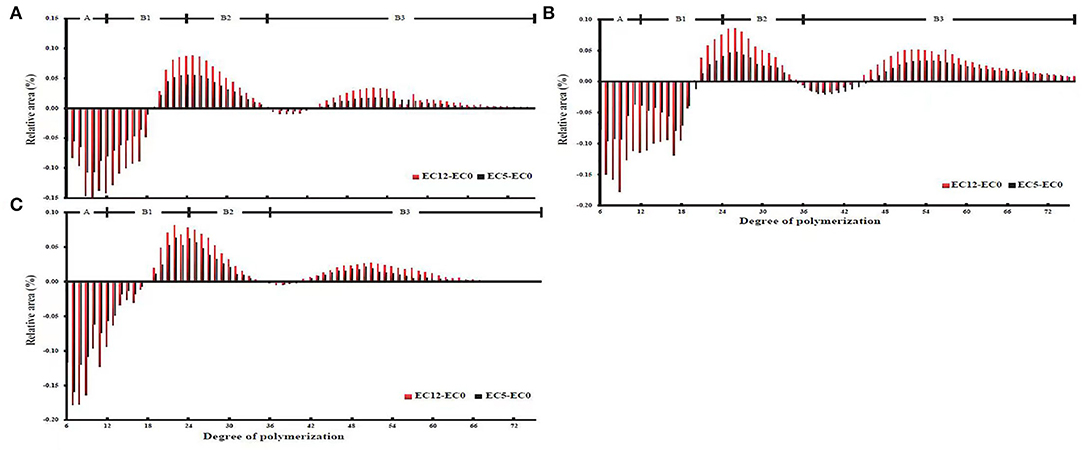
Figure 1. Starch chain distribution of Xiang liangyou 900 (A), Y liangyou 900 (B), IR64 (C) under salt stress, and the control. The branch chain length was categorized into four classes: a class (6 ≤ DP ≤ 12), B1 class (12 < DP ≤ 24), B2 (24 < DP ≤ 36), and B3 class (36 < DP ≤ 76). EC12, EC5, and EC0 represent that the electrical conductivity is 12, 5, and 0–1 dS/m, respectively.
Starch Granule Size Distribution
For the salt-tolerant cultivars YLY900 and XLY900, with the increase of salt stress, the proportion of surface area, volume, and number of small and medium starch granules decreased first and then increased, while large starch granules increased first and then decreased (Table 2). Salt stress affected YLY900 more than XLY900, which might be related to the higher proportion of small and medium starch granules in XLY900. For salt-sensitive cultivar IR64, the number, volume, and surface area proportion of small and medium starch granules showed a significant decrease, while the large starch granules showed an increase. Except for the number proportion of starch granules, there was no significant change between high and medium salt stress.
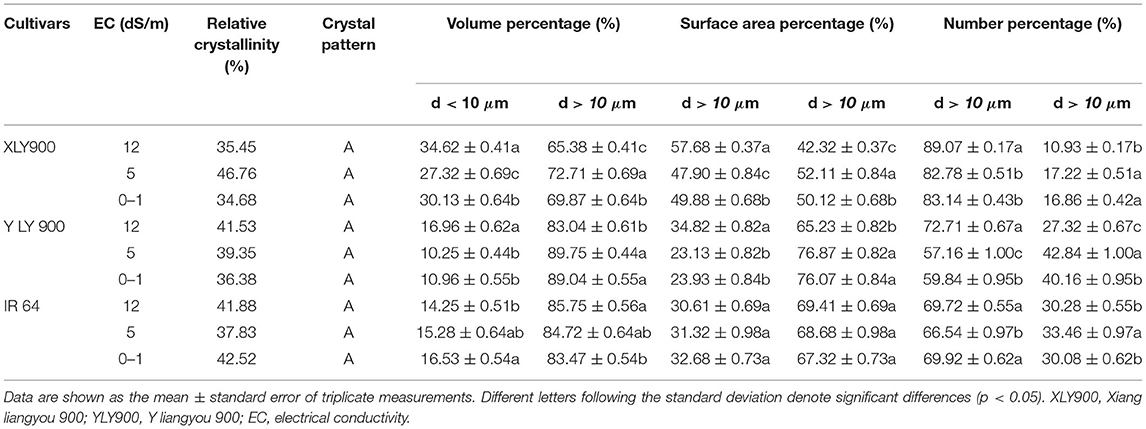
Table 2. Effects of salt stress on starch granule size distribution.
Physicochemical Properties of Rice Starch
Gelatinization and Pasting Properties
Except for T0 of XLY900, salt stress increased T0, Tp, and TC, and salt-sensitive cultivar IR64 was more affected (Table 3). The gelatinization enthalpy (ΔH) of salt-tolerant cultivars was not affected or increased under medium salt stress, but significantly decreased under high salt stress, whereas ΔH of salt-sensitive cultivar increased significantly under salt stress with the higher salt concentration.
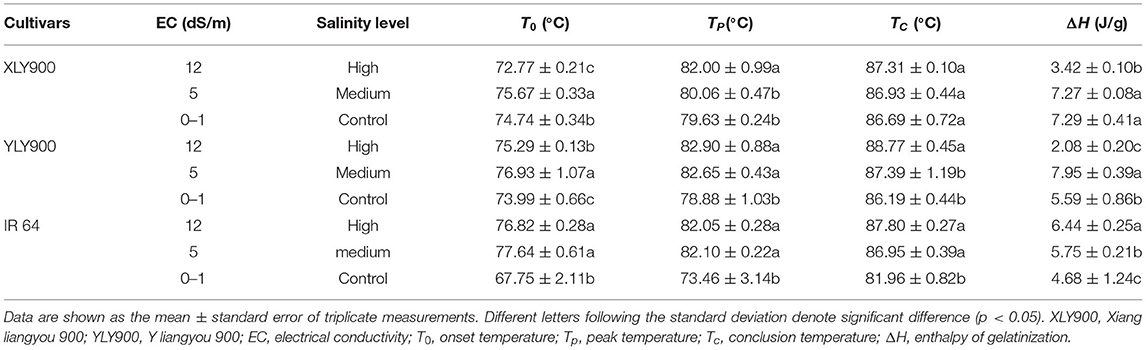
Table 3. Effects of salt stress on starch gelatinization properties.
For salt-tolerant cultivars XLY900 and YLY900, salt stress significantly decreased TV and CPV, while BD showed an increasing trend (Table 4). At the same time, it can be seen from Table 4 that salt stress reduced the PV of XLY900 and increased its SB, whereas YLY900 showed the opposite trend, which indicated that the pasting properties of XLY900 might become worse and the viscosity characteristics of YLY900 better; hence, it might be inferred that YLY900 might be more salt-tolerant than XLY900. For salt-sensitive cultivar IR64, salt stress reduced significantly PV, BD, and CPV, indicating that the pasting properties became worse. The pasting properties of different cultivars had different responses to salt stress. Rice cultivars with strong salt tolerance might have better pasting properties after salt stress treatment.
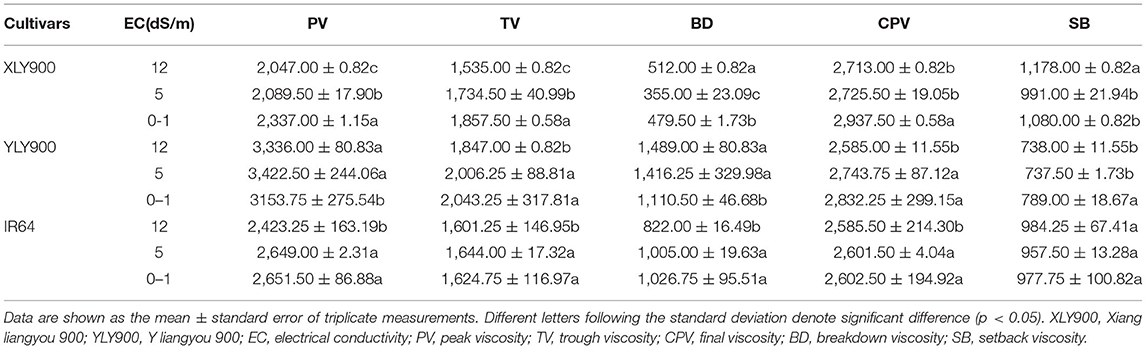
Table 4. Effects of salt stress on starch pasting properties.
Starch Crystal Characteristics
All tested starches showed similar XRD patterns, exhibiting A-type crystals with two strong 2θ peaks at ~15° and 23° and an unresolved double 2θ peak at 17° and 18°, indicating that the crystal type of rice starches was not changed by salt stress (Figure 2). Although salt stress did not change the crystal type of starch, it significantly changed the relative crystallinity of starch, indicating that salt stress destroyed the crystal structure to a certain extent (Table 2). The relative crystallinity of salt-tolerant cultivars XLY900 and YLY900 increased significantly after salt stress, while that of salt-sensitive cultivar IR64 decreased, which was mainly because the proportion of amylopectin medium and long chains in salt-tolerant cultivars increased more than that of a salt-sensitive cultivar.
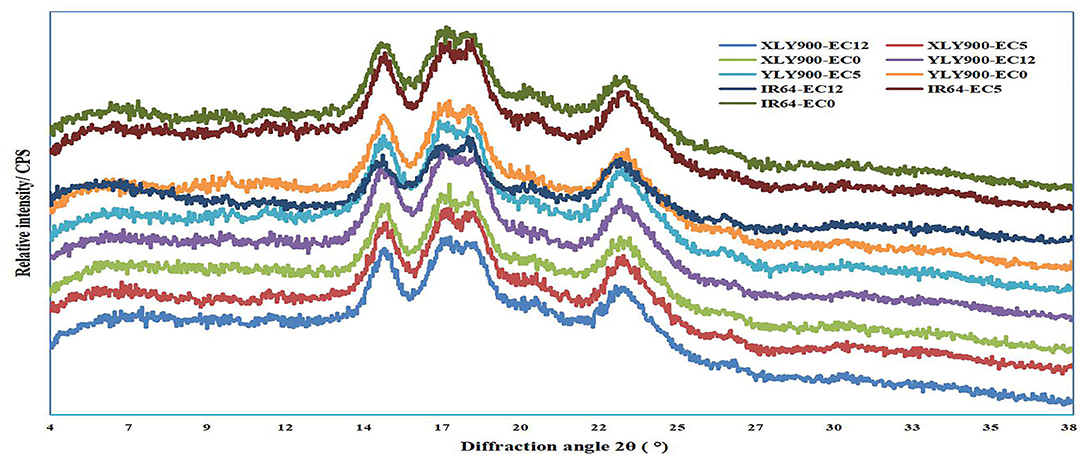
Figure 2. Effects of salt stress on the X-ray diffraction patterns of rice starch. XLY900, Xiang liangyou 900; YLY900, Y liangyou 900; EC12, EC5, and EC0 represent that the electrical conductivity is 12, 5, and 0–1 dS/m, respectively.
Discussion
Rice quality is an important trait for breeders to develop new rice cultivars. These traits determine directly the market price of rice and consist of a series of parameters, such as grain physical appearance, milled rice chemical composition, and structural features of rice starch. The parameters, in turn, affect the physicochemical properties of rice grains, which further reflect the ECQ of rice.
Effects of Salt Stress on Physicochemical Properties of Rice Starch
Salt stress significantly increased the total starch content and the proportion of the medium and long chains of amylopectin but obviously decreased amylose content and the proportion of short chain of amylopectin. The decrease of amylose content might be closely related to the change in GBSSI synthase activity, while the change in total starch content was the result of the combined action of starch synthase, starch debranching enzyme, and starch branching enzyme (26, 27), indicating that GBSSI activity of XLY900 might not be affected due to its strong salt tolerance. Similarly, Thitisaksakul (14) and Cheng et al. (28) reported that changes in starch composition might be related to salt concentration levels, and low salinity might promote starch accumulation. However, in this study, it was found that high salinity might also promote starch accumulation, which might be due to the different genotypes selected. Moreover, some studies reported that peroxidase activity in salt-tolerant cultivars was higher, but lower in salt-sensitive cultivars with increased salinity levels, which might cause the inconsistency of starch content changes between salt-tolerant and salt-sensitive cultivars (29). In general, short or medium chains were lower, and long chains were higher, resulting in worse ECQ of milled rice (30). Moreover, higher protein levels prevented starch grains from absorbing water, making rice ECQ worse (31).
Changes in starch composition and structure led to the according changes in starch physicochemical properties (23). The increase of GT might be closely related to the decrease of amylose content and the proportion of short chain as well as the increase of medium and long chains of amylopectin under salt stress. The GT reflected the cooking difficulty of rice, resulting in higher cooking temperature and longer cooking time required for milled rice matured at salt stress (32). Previous studies have shown that gelatinization enthalpy was related to starch crystal structure and starch grain size distribution (33). The proportion of large starch granules was positively correlated with the gelatinization enthalpy (22, 34). The change in trends of gelatinization enthalpy of the three tested cultivars was consistent with the change in the proportion of large starch granules. The large starch granules in the salt-sensitive cultivar increased significantly, so the gelatinization enthalpy obviously increased, making gelatinization of rice more difficult.
The changes in starch granule size distribution, gelatinization enthalpy, and pasting properties under salt stress differed the trends between salt-tolerant and salt-sensitive cultivars. The surface area, volume, and number distribution of small and medium starch granules in salt-tolerant cultivars decreased first and then increased, while the large starch granules increased first and then decreased. However, the proportion of small and medium starch granules in number, volume, and surface area of salt-sensitive cultivar decreased significantly, while the proportion of large starch granules increased. The gelatinization enthalpy of salt-tolerant cultivars decreased significantly, while that of salt-sensitive cultivars increased significantly under high salt stress. The change of starch granule size distribution of salt-tolerant rice showed a certain adaptability with the increase in salt concentration, suggesting that salt-tolerant rice cultivars might start their adaptive adjustment mechanism by stimulation of certain salt concentrations to alleviate the harm caused by salt stress (35).
Response Characteristics of Starch Physicochemical Properties to Salt Stress in Salt-Tolerant Rice Varieties
Our study found that the chalkiness of salt-tolerant cultivars increased less than that of salt-sensitive cultivars. The increase of starch accumulation was observed in salt-tolerant cultivars, while no change in salt-sensitive cultivars was observed. These results indicated that the normal grain-filling of salt-tolerant cultivars was less affected than that of salt-sensitive cultivars. A previous study has reported that salt could stimulate adenosine diphosphate-glucose pyrophosphorylase (ADPG) activity, leading further to starch accumulation (36). The starch enrichment in salt tolerance might play a key role as a chelator to chelate sodium ions to neutralize Na + toxicity (37). In contrast, high salt stress might not induce ADPG activity in semi-salt-tolerant or salt-sensitive varieties, so that starch accumulation in these rice varieties had no change or even decreased (17).
The salt-tolerant cultivars with more medium and long chains of amylopectin promoted the formation of the double helix, making the starch granule structure more stable than the salt-sensitive cultivar. Compared with salt-sensitive cultivar, salt-tolerant cultivars had lower GT and gelatinization enthalpy; therefore, their cooking quality was less affected. The viscosity characteristics of salt-tolerant cultivar with higher BD and PV as well as lower SB might become better after salt stress, while the viscosity characteristics of salt-sensitive cultivar became worse, suggesting that the integrity of the gel network might be compromised.
Conclusion
Salt stress significantly changed the chemical composition, starch structure, and physicochemical properties of rice and ultimately led to the deterioration of ECQ of rice. Compared with salt-sensitive cultivars, the salt-tolerant cultivars exhibited lower GT and gelatinization enthalpy, better pasting properties, and more stable crystal structure; therefore, their ECQ was less affected. This study analyzed the response difference between salt-tolerant and salt-sensitive rice cultivars to medium and high salt stress, providing a reference for breeders to develop salt-tolerant rice cultivars with good cooking and eating quality.
Data Availability Statement
The original contributions presented in the study are included in the article/Supplementary Material, further inquiries can be directed to the corresponding author.
Author Contributions
BB: conceptualization, funding acquisition, methodology, project administration, supervision, writing, reviewing, and editing. DY and JW: conceptualization, formal analysis, investigation, visualization, methodology, and writing the original draft. QL and DZ: methodology and resources. WZ: resources and investigation. GX and QD: validation. All authors contributed to the article and approved the submitted version.
Funding
This study was financially supported by the 2020 Research Program of Sanya Yazhou Bay Science and Technology City (SKJC-2020-02-006) and the National Natural Science Foundation of China (U19A2032).
Conflict of Interest
QD was employed by Bio-Rice (Hunan) Co. Ltd.
The remaining authors declare that the research was conducted in the absence of any commercial or financial relationships that could be construed as a potential conflict of interest.
Publisher's Note
All claims expressed in this article are solely those of the authors and do not necessarily represent those of their affiliated organizations, or those of the publisher, the editors and the reviewers. Any product that may be evaluated in this article, or claim that may be made by its manufacturer, is not guaranteed or endorsed by the publisher.
Acknowledgments
We thank the State Key Laboratory of Hybrid Rice Inspection and Testing Center for providing experiment assistance.
Supplementary Material
The Supplementary Material for this article can be found online at: https://www.frontiersin.org/articles/10.3389/fnut.2022.926217/full#supplementary-material
Supplementary Figure S1. Three cultivars were treated with salt stress at the reproductive growth stage at three salt ponds.
Supplementary Table S1. Information about the cultivars was used in the experiment.
Supplementary Table S2. Effects of salinity stress on rice milling and appearance quality.
References
1. Hussain S, Zhang J, Zhong C, Zhu L, Cao X, Yu S, et al. Effects of salt stress on rice growth, development characteristics, and the regulating ways: a review. J Integr Agric. (2017) 16:2357–74. doi: 10.1016/S2095-3119(16)61608-8
2. Yao DP, Wu J, Luo QH, Li JW, Zhuang W, Xiao G, et al. Influence of high natural field temperature during grain filling stage on the morphological structure and physicochemical properties of rice (Oryza sativa L.) starch. Food Chem. (2020) 310:125817. doi: 10.1016/j.foodchem.2019.125817
3. Calingacion M, Laborte A, Nelson A, Resurreccion A, Concepcion JC, Daygon VD, et al. Diversity of global rice markets and the science required for consumer-targeted rice breeding. PLoS ONE. (2014) 9:e85106. doi: 10.1371/journal.pone.0085106
4. Tang S, Zhang HX, Liu WZ, Dou Z, Zhou QY, Chen WZ, et al. Nitrogen fertilizer at heading stage effectively compensates for the deterioration of rice quality by affecting the starch-related properties under elevated temperatures. Food Chem. (2019) 277:455–62. doi: 10.1016/j.foodchem.2018.10.137
5. Razzaq A, Ali A, Safdar LB, Zafar MM, Rui Y, Shakeel A, et al. Salt stress induces physiochemical alterations in rice grain composition and quality. J Food Sci. (2020) 85:14–20. doi: 10.1111/1750-3841.14983
6. Parida AK, Das AB. Salt tolerance and salinity effects on plants: a review. Ecotoxicol Environ Saf. (2005) 60:324–49. doi: 10.1016/j.ecoenv.2004.06.010
7. He JF, Goyal R, Laroche A, Zhao ML, Lu ZX. Effects of salinity stress on starch morphology, composition and thermal properties during grain development in triticale. Can J Plant Sci. (2013) 93:765–71. doi: 10.4141/cjps2013-065
8. Abdullah Z, Khan MA, Flowers TJ. Causes of sterility in seed set of rice under salinity stress. J Agron Crop Sci. (2001) 187:25–32. doi: 10.1046/j.1439-037X.2001.00500.x
9. Baxter G, Zhao J, Blanchard C. Salinity alters the protein composition of rice endosperm and the physicochemical properties of rice flour. J Sci Food Agric. (2011) 91:2292–7. doi: 10.1002/jsfa.4458
10. Grattan SR, Zeng L, Shannon MC, Roberts SR. Rice is more sensitive to salinity than previously thought. Calif Agric. (2002) 56:189–98. doi: 10.3733/ca.v056n06p189
11. Yeo AR, Yeo ME, Flowers SA, Flowers TJ. Screening of rice (Oryza sativa L) genotypes for physiological characters contributing to salinity resistance, and their relationship to overall performance. Theor Appl Genet. (1990) 79:377–84. doi: 10.1007/BF01186082
12. Cramer GR, Schmidt CL, Bidart C. Analysis of cell wall hardening and cell wall enzymes of salt-stressed maize (Zea mays) leaves. Funct Plant Biol. (2001) 28:101–9. doi: 10.1071/PP00101
13. Chen T, Shabala S, Niu Y, Chen ZH, Shabala L, Meinke H, et al. Molecular mechanisms of salinity tolerance in rice. Crop J. (2021) 9:506–20. doi: 10.1016/j.cj.2021.03.005
14. Thitisaksakul M, Tananuwong K, Shoemaker CF, Chun A, Tanadul O, Labavitch JM, et al. Effects of timing and severity of salinity stress on rice (Oryza sativa L.) yield, grain composition, and starch functionality. J Agric Food Chem. (2015) 63:2296–304. doi: 10.1021/jf503948p
15. Xiao D, Li J, Deng X, Wei P, Tang J, Wei H, et al. Response of quality formation of different rice varieties to salt stress. J Nucl Agric Sci. (2022) 34:1840–7. doi: 10.11869/j.issn.100-8551.2020.08.1840
16. Aref F, Rad HE. Physiological characterization of rice under salinity stress during vegetative and reproductive stages. Indian J Sci Technol. (2012) 5:2578–86. doi: 10.17485/ijst/2012/v5i4.11
17. Rao PS, Mishra B, Gupta SR. Effects of soil salinity and alkalinity on grain quality of tolerant, semi-tolerant and sensitive rice genotypes. Rice Sci. (2013) 20:284–91. doi: 10.1016/S1672-6308(13)60136-5
18. Zhai CJ, Deng XL, Zhang J, Dai QG, Cui SY. Effects of salt stress on quality traits of japonica rice. China Rice. (2020) 26:44−8.
19. Cooper NT, Siebenmorgen TJ, Counce PA, Meullenet JF. Explaining rice milling quality variation using historical weather data analysis. Cereal Chem. (2006) 83:447–50. doi: 10.1094/CC-83-0447
20. Counce PA, Keisling TC, Mitchell AJ A uniform objective and adaptive system for expressing rice development. Crop Sci. (2000) 40:436–43. doi: 10.2135/cropsci2000.402436x
21. Nishi A, Nakamura Y, Tanaka N, Satoh H. Biochemical and genetic analysis of the effects of amylose-extender mutation in rice endosperm. Plant Physiol. (2001) 127:459–72. doi: 10.1104/pp.010127
22. Xiong R, Xie J, Chen L, Yang T, Tan X, Zhou Y, et al. Water irrigation management affects starch structure and physicochemical properties of indica rice with different grain quality. Food Chem. (2021) 347:129045. doi: 10.1016/j.foodchem.2021.129045
23. Bao J, Ying Y, Zhou X, Xu Y, Wu P, Xu F, et al. Relationships among starch biosynthesizing protein content, fine structure and functionality in rice. Carbohydr Polym. (2020) 237:116118. doi: 10.1016/j.carbpol.2020.116118
24. Hanashiro I, Abe JI, Hizukuri S. A periodic distribution of the chain length of amylopectin as revealed by high-performance anion-exchange chromatography. Carbohydr Res. (1996) 283:151–9. doi: 10.1016/0008-6215(95)00408-4
25. Smith AM, Denyer K, Martin C. The synthesis of the starch granule. Annu Rev Plant Physiol Plant Mol Biol. (1997) 48:65–87. doi: 10.1146/annurev.arplant.48.1.67
26. Hajihashemi S, Skalicky M, Brestic M, Pavla V. Cross-talk between nitric oxide, hydrogen peroxide and calcium in salt-stressed Chenopodium quinoa Willd. At seed germination stage. Plant Physiol Biochem. (2020) 154:657–64. doi: 10.1016/j.plaphy.2020.07.022
27. Yuan Y, Zhong M, Shu S, Du N, He L, Yuan L, et al. Effects of exogenous putrescine on leaf anatomy and carbohydrate metabolism in cucumber (Cucumis sativus L.) under salt stress. J Plant Growth Regul. (2015) 34:451–64. doi: 10.1007/s00344-015-9480-2
28. Cheng YE, Dong MY, Fan XW, Nong LL, Li YZ. A study on cassava tolerance to and growth responses under salt stress. Environ Exp Bot. (2018) 155:429–40. doi: 10.1016/j.envexpbot.2018.07.022
29. Singh RA, Roy NK, Haque MS. Changes in growth and metabolic activity in seedlings of lentil (Lens culinaris Medic) genotypes during salt stress. Indian J Plant Physiol. (2001) 6:406−10.
30. Tao K, Li C, Yu W, Gilbert RG, Li E. How amylose molecular fine structure of rice starch affects functional properties. Carbohydr Polym. (2019) 204:24–31. doi: 10.1016/j.carbpol.2018.09.078
31. Peng Y, Mao B, Zhang C, Shao Y, Wu T, Hu L, et al. Correlations between parental lines and indica hybrid rice in terms of eating quality traits. Front Nutr. (2021) 8:663504. doi: 10.3389/fnut.2021.663504
32. Zhang C, Zhou L, Zhu Z, Lu H, Zhou X, Qian Y, et al. Characterization of grain quality and starch fine structure of two japonica rice (Oryza sativa L.) cultivars with good sensory properties at different temperatures during the filling stage. J Agric Food Chem. (2016) 64:4048–57. doi: 10.1021/acs.jafc.6b00083
33. Bao J, Sun M, Zhu L, Corke H. Analysis of quantitative trait loci for some starch properties of rice (Oryza sativa L.): thermal properties, gel texture and swelling volume. J Cereal Sci. (2004) 39:379–85. doi: 10.1016/j.jcs.2004.01.004
34. Bhat FM, Riar CS. Effect of composition, granular morphology and crystalline structure on the pasting, textural, thermal and sensory characteristics of traditional rice cultivars. Food Chem. (2019) 280:303–9. doi: 10.1016/j.foodchem.2018.12.064
35. Sangwongchai W, Krusong K, Thitisaksakul M. Salt tolerance at vegetative stage is partially associated with changes in grain quality and starch physicochemical properties of rice exposed to salinity stress at reproductive stage. J Sci Food Agric. (2022) 102:370–82. doi: 10.1002/jsfa.11367
36. Schaffer AA, Levin I, Oguz I, Petreikov M, Cincarevsky F, Yeselson Y, et al. ADPglucose pyrophosphorylase activity and starch accumulation in immature tomato fruit: the effect of a Lycopersicon hirsutumderived introgression encoding for the large subunit. Plant Sci. (2000) 152:135–44. doi: 10.1016/S0168-9452(99)00224-1
Keywords: rice composition, salinity stress, reproductive growth stage, starch structure, starch physicochemical property
Citation: Yao D, Wu J, Luo Q, Zhang D, Zhuang W, Xiao G, Deng Q and Bai B (2022) Effects of Salinity Stress at Reproductive Growth Stage on Rice (Oryza sativa L.) Composition, Starch Structure, and Physicochemical Properties. Front. Nutr. 9:926217. doi: 10.3389/fnut.2022.926217
Received: 22 April 2022; Accepted: 20 May 2022;
Published: 29 June 2022.
Edited by:
Fatih Öz, Atatürk University, TurkeyReviewed by:
Volkan Arif Yilmaz, Ondokuz Mayis University, TurkeyVignesh Muthusamy, Indian Agricultural Research Institute (ICAR), India
Copyright © 2022 Yao, Wu, Luo, Zhang, Zhuang, Xiao, Deng and Bai. This is an open-access article distributed under the terms of the Creative Commons Attribution License (CC BY). The use, distribution or reproduction in other forums is permitted, provided the original author(s) and the copyright owner(s) are credited and that the original publication in this journal is cited, in accordance with accepted academic practice. No use, distribution or reproduction is permitted which does not comply with these terms.
*Correspondence: Bin Bai, baibin87@163.com
†These authors have contributed equally to this work