Quantitative Assessment of Abiotic Stress on the Main Functional Phytochemicals and Antioxidant Capacity of Wheatgrass at Different Seedling Age
 Bianling Jiang† Guizhen Gao† Mengting Ruan Ying Bian Fuyun Geng Weiwei Yan Xuehua Xu Mengdie Shen Jiafeng Wang Ran Chang Lisheng Xu Xingtao Zhang Fan Feng
  Qiong Chen*
- School of Biological and Food Engineering, Suzhou University, Suzhou, China
The wheat seedlings of 6 days old were daily subjected to ultraviolet irradiation (irradiating for 5, 10, 20, 40, and 60 min/day, respectively), Polyethylene glycol 6000 (5, 10, 15, 20, 25% in 1/2 Hoagland solution, respectively), and salinity solution (10, 25, 50, 100, 200 mM in 1/2 Hoagland solution, respectively), while the control group (CK) was supplied only with the Hoagland solution. The wheatgrass was harvested regularly seven times and the total soluble polysaccharides, ascorbic acid, chlorophyll, total polyphenol, total triterpene, total flavonoid, and proanthocyanins content were tested. The antioxidant capacity was evaluated through 2,2′-azino-bis (3-ethylbenzthia-zoline-6-sulfonic acid) (ABTS), 2,2-diphenyl-1-picrylhydrazyl (DPPH) scavenging ability, and ferric ion reducing power. Technique for order preference by similarity to ideal solution (TOPSIS) mathematical model was adopted to comprehensively assess the functional phytochemicals of the different treatments. The results showed that the accumulation patterns of phytochemicals under abiotic stress were complex and not always upregulated or downregulated. The antioxidant activity and functional phytochemicals content of wheatgrass were significantly affected by both the stress treatments and seedling age, while the latter affected the chemicals more efficiently. The top five highest functional phytochemicals were observed in the 200 mM NaCl treated group on the 21st and 27th day, 25% PEG treated group on the 24th day, 200 mM NaCl treated group on the 24th day, and the group of 40 min/day ultraviolet exposure on 27th day.
Introduction
Wheatgrass, the mature shoots of the common wheat plant (Triticum aestivum, Poaceae family) which has been considered the most edible grain cereal-grass crop globally (1), is used as herbal medicine and nutraceutical traditionally (2). The consumption of wheatgrass could be traced to as early as ancient Egypt of 5,000 years ago or Mesopotamian Civilization (3). The recent interests in the wheatgrass was boomed immensely by Dr. Ann Wigmore in 1970s who developed wheatgrass juice as a part of her herbal therapeutic nutritional approach and compiled “The Wheatgrass Book” (4). Wheatgrass was demonstrated to have a wide range of health benefits under conditions, such as common cold, astriction, diabetes, kidney swelling, anemia, eczema, (5) thalassemia, and myelodysplastic syndrome (2), and possess antimutation (6), anti-inflammatory, antioxidant, immunoregulation, hemostasis, diuresis, antimicrobial, antiaging, and anti-cancer (e.g., cervical cancer and oral squamous cell carcinoma) properties (7–9).
The therapeutic properties of wheatgrass could be attributed to the rich phytochemical components, such as chlorophyll, ascorbic acid, bioflavonoids, and so on (8, 10), which varied according to the production process and growing environments (11). Similar views were shared that abiotic stress factors could affect the plant bioactive compounds and produce differences in physiological condition and nutritional value (12, 13). Literature has shown that ascorbic acid, β-carotene, carotenoids, functional phytochemicals that include phenolics, flavonoids, and antioxidant activity of leafy vegetables were augmented under abiotic stresses, such as drought (14, 15) and salinity stress (16, 17). In addition, there were reports on the upregulation of ascorbic acid under abiotic stress during rice seed priming (12), but was observed decrease in wheatgrass and soybean plants under drought stress (18). As to triterpene, it was reported to be augmented in some plants (19). In blue light treated einkorn wheatgrass and red light treated emmer wheatgrass, the phenol and flavonoid content was increased (20). Falcinelli et al. (21) revealed that NaCl treatment could markedly increase the total polyphenols content (TPC) and antioxidant activity in wheatgrass. Jaiswal et al. (22) discovered that selenium and ultraviolet-B radiation or their combination could enhance the flavonoid and phenolic content. Benincasa et al. (23) demonstrated that optimal combination of temperature and time, light modulation, and salt stress would upregulate the phytonutrients such as ascorbic acid, tocopherol, β-carotene, phenols, and flavonoids in some extent. Hence, it was presumed that the plants as refer to wheatgrass would generally produce some phytochemicals, as secondary metabolites, whose role was to help plants cope with the unfavorable environmental conditions. However, all the existing data referring to the abiotic stress effect on phytochemicals of wheatgrass, to our best knowledge, were not integrated and focused mostly on a few kinds of compounds, such as flavonoids, phenols, tocopherol, or carotenes. The previous reported cereal grasses were normally germinated 6–10 days and no more than 14 days. The information that the long-term (exceeding 14 days) accumulation of phytonutrients, such as triterpene, proanthocyanin, soluble polysaccharides, ascorbic acid, and the like under different stress density still remains scarce.
Therefore, to reveal the effect of abiotic stress on the main functional phytochemicals and antioxidant activity, the wheat seedlings were suffered from the different densities of NaCl, PEG, and ultraviolet-C radiation and tested for the ascorbic acid content (AAC), TPC, total triterpenes content (TTC), total flavonoids content (TFC), total proanthocyanins content (TPAC), and total chlorophyll content (TChl) content and the antioxidant activity through 2,2'-azino-bis (3-ethylbenzthia- zoline-6-sulfonic acid) (ABTS) and 2,2-diphenyl-1-picrylhydrazyl (DPPH) assays and ferric ion reducing antioxidant power (FRAP) of different seedling ages.
Materials and Methods
Material and Reagents
The wheat seeds were kindly provided by a local farmer in Lingbi County, Suzhou City, Anhui Province, China. Hoagland Nutrition reagent was purchased from Qingdao Hope Bio-Technology Co., LTD (Qingdao, China). Polyethylene glycol 6000 was bought from Wuxi Yatai Allied Chemicals Co., Ltd. Glucose was from Shanghai Zhanyun Chemical Co., Ltd (Shanghai, China). Vanillin was from Sinopharm Chemical Reagent Co., Ltd (Shanghai, China). Ursolic acid, Folin–Ciocalteu's phenol reagent, gallic acid, rutin hydrate, (+)-catechin, L-ascorbic acid, ABTS, DPPH were purchased from Shanghai Macklin Biochemical Co., Ltd (Shanghai, China). (±)-6-Hydroxy 2,5,7,8-tetramethylchromane-2-Carboxylic acid (Trolox) was from Shanghai Aladdin Biochemical Technology Co., Ltd (Shanghai, China). All the reagents were of analytical grade.
Plant Materials and Abiotic Stress Treatment
Abiotic Treatment
The cultivation of the wheatgrass was executed based on the procedures proposed by the team (24). Briefly, 55 g of the thrice-washed seeds were sown evenly in a hydroponic tray sized 32.5 × 24.5 × 4.5 cm in four rectangular pieces, then were semi-immersed in deionized water for 24 h away from light to let malt. The wheat malts were supplied with 1/2 Hoagland solution and cultivated at 22 ± 1°C under 16 h-photoperiod (20 W) light irradiance. The aged 6 days seedlings were exposed to UV-C irradiation daily (40 W, Ozone free, for 5, 10, 20, 40, and 60 min correspondingly noted as UV 5, UV 10, UV 20, UV 40, and UV 60), Polyethylene glycol 6000 (5, 10, 15, 20, and 25% in 1/2 Hoagland solution correspondingly noted as PEG 5%, PEG 10%, PEG 15%, PEG 20%, and PEG 25%), and salinity solution (10, 25, 50, 100, and 200 mM in 1/2 Hoagland solution correspondingly noted as NaCl 10, NaCl 25, NaCl 50, NaCl 100, and NaCl 200), respectively, while the control group (CK) was supplied only with the Hoagland solution. All the media solutions used during the cultivation were 450 ml per tray and refreshed every 2 days. The deionized water was replenished properly on the interval of the culture matrix refreshing to restore the initial weight and keep the matrix concentration constant. The grass was sampled on 9th, 12th, 15th, 19th, 21st, 24th, and 27th day after seeding (noted as D9, D12, D15, D21, D24, and D27, respectively) and immediately frozen in liquid nitrogen (LN2) and stored at −80°C until use.
Preparation of Wheatgrass Extracts
Grass extracts to be analyzed for TTC, TPC, TFC, TPAC, and antioxidant capacity were prepared as followings: the wheatgrass was well ground in LN2 and 1.0 g sample of each treated group were ultrasonic extracted thrice (80 W, 20 min) with 25 ml of 80% methanol. The three filtrates were pooled and brought to 100 ml. The extracts for total soluble polysaccharides content (TSPC) analysis were prepared as: the above pellets were again aqueously extracted thrice in boiling water-bath for 30 min and standardized to 100 ml. The methanol extracts were stored at −20°C until use while the aqueous extracts were stored at 4°C and detected within 3 days. In the preparation, 112 samples in total were yielded and tested for the seven kinds of compounds and three antioxidant activity indices. All the tests were applied in a microplate reader (Thermo Fisher Scientific, Type 1510).
Determination of TTC
The TTC was measured using the methods described by Siyuan Luo et al. (25) with slight modifications. In this method, 100 μl extracts or ursolic acid standard solutions (20–120 μg ml−1) were mixed with 100 μl vanillin-acetic acid (2.5%) and 200 μl perchloric acid. After 60°C incubation for 15 min, 650 μl glacial acetic acid was added and well-mixed. In addition, 300 μl of the mixture was pipetted to a 96-well-microplate (CELLSTAR® from Greiner Bio-One GmbH) and read at 550 nm using the microplate reader after standing for 10 min. The TTC was calculated from the standard curve and expressed as milligram ursolic acid equivalents/gram (mg UAE/g) of fresh weight (FW).
Determination of TPC
The determination of TPC was performed using the Folin–Ciocalteau method previously described by Sarker and Oba (26). The extracts (100 μl) or series of standards (12.5, 25, 50, 100, 150, and 200 μg ml−1 gallic acid) were added. After reagent mixing and reaction, 300 μl was moved to a 96-well-plate and read at 740 nm. The results were estimated as equivalent to gallic acid standard (mg GAE/g FW).
Determination of TFC
The TFC was determined according to an assay described by Guo et al. (27). Briefly, the addition volume of the extracts or standard rutin solution (20–100 μg ml−1), NaNO2 solution (5%, w/v), Al (NO3)3 solution (10%, w/v), and NaOH solution (1 mol/L) were adjusted to 2.0, 0.2, 0.2, and 2.0 ml, respectively. The mixture (300 μl) was pipetted to a 96-well-plate and read at 510 nm. The amount of TFC was expressed as rutin equivalents/gram (mg RE/g FW).
Determination of TPAC
The TPAC was detected by using a method previously reported by Zribi et al. (28) which was adjusted to be feasible in the microplate reader. The volume of extracts or standard catechin solution (4–32 μg ml−1), 4% vanillin–methanol (w/v), and hydrochloric acid were adjusted to 200 μl, 1.0 ml, and 0.5 ml, respectively. The mixture (300 μl) was transferred to a 96-well-plate and read at 500 nm. TPAC was presented as milligram catechin equivalent/gram fresh weight (mg CE/g FW) using the catechin calibration curve.
Determination of TSPC
The TSPC was detected based on phenol-sulfuric acid assay described by Lei Guo et al. (29), of which the reagent volume was diminished aliquot for high throughput detection. Briefly, 0.2 ml of aqueous extracts or standard glucose solution (10–60 μg ml−1) was mixed with 0.2 ml 5% distilled phenol solution and 1 ml concentrated sulfuric acid. After vortex and 30 min standing at room temperature, the mixture (300 μl) was transferred and read at 490 nm. The results were obtained using a calibration curve from standard glucose solutions and expressed as milligram glucose equivalent/gram in fresh weight (mg GE/g FW).
Determination of Chlorophyll Content
The chlorophyll (such as chlorophyll a noted as Chl a, chlorophyll b noted as Chl b, and total chlorophyll noted as TChl) was extracted based on the procedure reported by Mashabela et al. (30) with modifications and detected by using the methods previously reported by Warren (31). Specifically, the wheatgrass samples were well-ground in liquid nitrogen and 1.0 g was weighed and macerated in 25 ml methanol at room temperature for 48 h. Afterward, the resulting mixtures were passed through a 0.22-μm nylon filter and diluted 1-fold. The dilutions of 200 μl were removed to a flat-bottomed 96-well-plate and read at 652 and 665 nm. The chlorophyll concentration was calculated from the following formula:
Chl a (μg mL−1) = −8.0962 A652, 1cm + 16.5169 A665, 1cm
Chl b (μg mL−1) = 27.4405 A652, 1cm – 12.1688 A665, 1cm
TChl = Chl a + Chl b
A652, 1cm = (A652, microplate - blank)/0.51
A665, 1cm = (A665, microplate - blank)/0.51
Where, A652, 1cm and A652, microplate represents the absorbance at 652 nm in a spectrophotometer and a microplate reader, respectively; A665, 1cm and A665, microplate represents the absorbance at 665 nm in a spectrophotometer and a microplate reader, respectively.
The results were expressed as milligram/gram fresh weight (mg/g FW).
Determination of AAC
The AAC was determined by a second-order derivative spectrometer method (32, 33). The wheatgrass samples of 2.0 g were ground and macerated in 100 ml 1.0 M HCl which was gradually added for 10 min. The extracts were passed through a 0.45-μm aqueous syringe filter and quantitatively diluted 5-fold. The peak-baseline amplitudes of the filtrates in the second-order derivation absorption spectra at 267.5 nm (detected using Type U-3900 UV/VIS spectrometer from HITACHI High-Tech Science Corporation, Tokyo, Japan) was used to construct the calibration curve of standard ascorbic acid solutions with the concentration ranging from 5 to 30 μg ml−1. The results were expressed as milligram ascorbic acid/g of FW.
Antioxidant Activity
ABTS Radical Scavenging Assay
The detection of ABTS bleaching ability was conducted using the method described by Lin et al. (34) with slight adjustments. An equal volume (25 ml) of 7.4 mM ABTS solution and 2.6 mM aqueous K2S2O8 were mixed at room temperature for at least 16 h away from light to generate ABTS•+ stock solution. Afterward, the stock solution was diluted using 5 mM pH 7.4 PBS to the absorbance of 0.75 at 734 nm in a 96-well-plate to prepare the working solution, of which 200 μl was mixed with 40 μl of the extracts or standard Trolox solution (0.02–0.16 mM). After incubation for 6 min in the dark and vibration for 15 s, the absorbance was read. The results were calculated from the Trolox calibration curve and expressed as milligram Trolox Equivalents/gram FW (mg TE/g FW).
DPPH Radical Scavenging Assay
The DPPH radical scavenging ability was evaluated according to a previously described method (34) with minor adjustment. The solution (200 μl) of 0.15 mM DPPH was blended with 100 μl of the extracts or standard Trolox solution (0.02–0.16 mM) in a 96-well-plate. After 37°C incubation for 30 min and 15 s vibration, the absorbance was read at 517 nm vs. 80% methanol blank. The results were expressed as milligram TE/gram FW.
FRAP Assay
The FRAP assay was conducted by using the method described by Lin et al. (34).
TOPSIS Model Establishments
The TOPSIS model proposed by Hwang and Yoon (35) was used to evaluate the comprehensive nutrition value of all the treated groups. The decision matrix was established as X = (Xij)m×n, where m means the different abiotic groups, such as five treatments of PEG, five treatments of NaCl, five treatments of ultraviolet, and a CK, while n represents seven criteria that include TTC, TPC, TFC, TPAC, TSPC, TChl, and AAC. The weight of individual criterion ωi was 1.0, 1.0, 1.0, 0.5, 1, 1.5, and 1.0, respectively.
Statistics Handling
All the tests were performed in triplicates and the results were shown as mean ± SD. Duncan's new multiple range was used for the difference analysis tests. Correlation-ship was analyzed using Pearson's correlation. A multi-factor analysis of variance (MANOVA) was conducted to examine which factor (seedling age or various abiotic treatments) dominates the corresponding phytochemicals. The principal component analysis (PCA) was also carried out. All the statistics handling were carried out using SPSS software (IBM Corp. USA, version 20.0). Asterisks indicated significant differences (**p < 0.01, *p < 0.05). The heatmap hierarchical clustering analysis (HHCA) of the measured functional compounds was run using TBtools software.
Results and Discussion
Triterpene
The TTC of wheatgrass ranged from 1.83 ± 1.40 to 12.00 ± 2.30 mg UAE/g FW, shown in Figure 1A. The results of MANOVA showed that the TTC was significantly affected by abiotic treatment and seedling age, while seedling age determined dominantly the TTC other than abiotic treatment [p < 0.01, F(seedlingage) = 76.02 > F(abiotictreatment) = 5.24]. Previous data indicated that UV-B treatment could contribute to an increment of TTC in the Adhatoda vasica plant (36) and that water deficit could stimulate the triterpene accumulation in Hypnum plumaeforme (but not in Pogonatum cirratum) (37) or that abiotic stress-induced the accumulation of some triterpenes in Quillaja brasiliensis (38). However, in the present study, based on MANOVA, we found that the NaCl 10, NaCl 25, and NaCl 50 groups had a lower TTC than the CK which showed no significant differences between the other groups like UV-, PEG-, or NaCl 100 and NaCl 200- treated group (p < 0.05). As a kind of UV-absorbing secondary metabolites, the accumulation content of triterpene was impacted by the impairment of metabolism and the upregulation of relative genes and enzymes (36, 38). The results suggested that UV exposure affected the triterpene minorly before D24 compared to control might be explained by the balance of the impairment and upregulation or by the different interactions of individual triterpene that existed in wheatgrass because there was a report that revealed some triterpene compounds were not affected by UV (36). On D24 and D27, that the TTC was upregulated non-/significantly in UV 10–60 groups (compared with control) might be due to the loss of water. The reason that the TTC was not incremented by PEG and salt stress could be as well-attributed to the different reactions of individual triterpene contained in wheatgrass. It might be inferred that the triterpene upregulation was not the pathway for wheat to cope with unfavorable conditions.
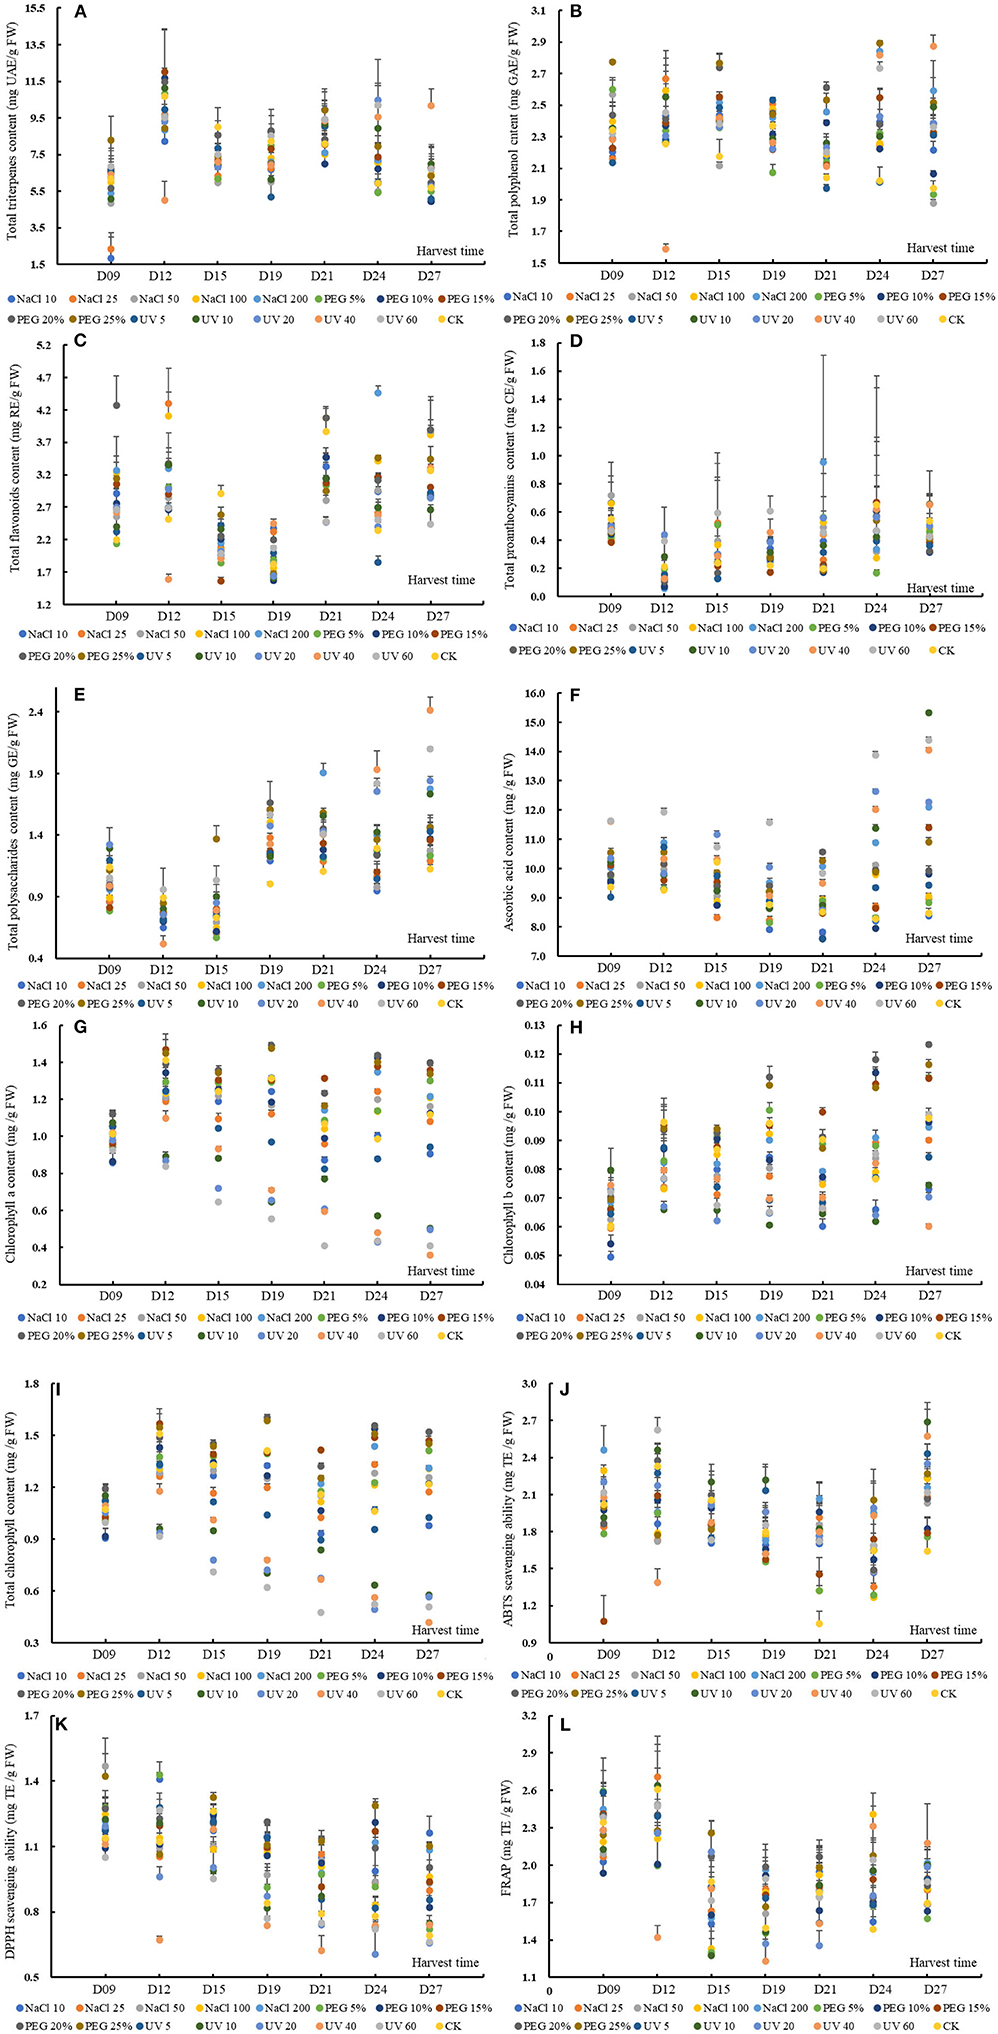
Figure 1. The content or value of total triterpenes (A), total polyphenols (B), total flavonoids (C), total proanthocyanins (D), total soluble polysaccharides (E), ascorbic acid (F), chlorophyll a (G), chlorophyll b (H) and total chlorophyll (I), 2,2'-azino-bis (3-ethylbenzthia- zoline-6-sulfonic acid) (ABTS) (J), and 2,2-diphenyl-1-picrylhydrazyl (DPPH) (K) scavenging ability and ferric iron-reducing antioxidant power (L) of wheatgrass on the 9th~27th day after seed sowing. A total of 112 samples (16 groups × 7 times of harvesting) were analyzed. The results were expressed as mean ± SD.
An obvious accumulation peak was noticed on D12 and D21 (based on MANOVA, p < 0.05), which shared a similar changing pattern with the previous study in UV-treated barley grass where the peak appeared on D15 and D21 (24). Specifically, except for UV40 and PEG 25% dose group, the TTC of other groups increased significantly on D12. The group of NaCl 10, NaCl 50, PEG 25%, UV5, UV10, and UV20 had a second peak TTC on D21. The TTC of wheatgrass could rival some fruit, such as Chinese jujube (TTC ranged from 7.52 ~ 16.57 mg UAE/g FW) (39).
Polyphenol
The TPC of wheatgrass in the present study varied from 1.59 ± 0.03 to 2.89 ± 0.01 mg GAE/g FW (Figure 1B). The MANOVA results showed that both the abiotic treatments and seedling age could affect the TPC significantly while the former worked more effectively [p < 0.01, F(seedlingage) = 6.36 > F(abiotictreatment) = 5.14]. Generally, except for the treatments of 50 mM NaCl, 5% PEG, 10% PEG, and 5-min-UV, the other treatments could induce a higher TPC than the control. The accumulation patterns of the TPC of all the groups were presented in a wavy manner and peak values appeared on D15 and D24 based on MANOVA. The TPC of the results from D9 to D12 was consistent with a previous study that no significant differences during quinoa malting were found when the seeds were treated with different wavelength light or solutions (40). Specifically, on D15 all the groups except NaCl 50 had a higher TPC than the control. On D21 and D24 except for group UV5, and on D27 except for group PEG 5% and PEG 10%, all the other groups showed higher TPC than the control, suggesting that abiotic treatment could improve or reserved the TPC under prolonged treating time. Differentiated results were found on whether the TPC increased or declined by abiotic stress (16, 40–42). Hence, it was explained that TPC generally stayed stable from D9 to D12 when the wheatgrass was struggling to adapt itself to the adverse conditions, then incremented to handle the situation. The different reactions of TPC between the previous reports and the results attributed to cultivar variations.
The TPC was much higher than some vegetables, such as sweet potatoes (43), or leafy vegetables such as amaranth (44, 45), and common fruits, e.g., apple, apricot, cherry, peach, plum (46), banana, mango, papaya, passion fruit, and so on (47).
Flavonoid
The TFC of wheatgrass in the present study ranged from 1.56 ± 0.05 to 4.47 ± 0.11 mg RE/g FW, shown in Figure 1C. In the present study, different intensity of UV stress or PEG-simulated drought was probed on the accumulations of flavonoid and found that the TFC were prone to be more susceptible to the seedling age rather than these abiotic treatments (including NaCl stress), on which the flavonoid value upregulated or not depended [p < 0.01, F(seedlingage) = 71.06 > F(abiotictreatment) = 10.77, data from MANOVA results]. The overall accumulation patterns of the total flavonoid varied significantly with the seedling age and three accumulation peaks appeared, respectively, on D12, D21, and D27. The MANOVA results showed that the 25 mM NaCl -, 100 mM NaCl -, 200 mM NaCl -, and 20% PEG treatment could improve the TFC. The previous studies reported that the flavonoid could be enhanced by drought treatment within 48 h in wheat leaves (48) or by violet treatment for 30 days in root culture of Setiva rebaudiana (49). It has been postulated that the TFC could be enhanced by abiotic stress, such as drought, salinity, and UV stress (41), however, in the results, the situation was complicated. Specifically, all the abiotic treated groups (except for PEG 5% on D9, UV40 on D12, and UV5 on D24) had non-/significantly higher TFC than the control on D9, D12, and D24. In contrast, all the treated groups (except for NaCl 100 on D21) showed a significantly lower TFC content than the control on D15 and D21. The accumulation patterns of TFC varied with the difference of treatments intensity, which could be explained by that the increase or decrease of some secondary metabolites in plants depends on the sensitivity of the plants to this type of stress condition (50). The reason for the fluctuation of TFC could be attributed to the genetic regulation mode of these compounds.
The TFC in the present study was much higher than some green vegetables, such as amaranth (41, 51), lettuce, salad spinach, mitsuba, pok choi, mizuna, komatsuna in Gifu (Japan) (52) and was in the same level of some Thai fruits, such as egg fruit, manila tamarind, otatheite apple, ivy gourd, and governor's plum (53) or tomato and lotus root (54, 55).
Proanthocyanin
The TPAC, ranging from 0.06 ± 0.02 to 0.95 ± 0.76 mg CE/g FW (Figure 1D), was not a remarkable functional phytochemical in wheatgrass but was still fell into the same level with rice of Sri Lanka (56), or some fruit, such as jujube (39), pomegranate (57), or even wild berries from Himalaya area (58). The overall TPAC changing patterns were found to decrease remarkably from D9 to D12 and then uprose gradually (p < 0.05) on basis of MANOVA. The previous studies revealed that condensed tannins (proanthocyanins) were ubiquitous in ligneous pants but almost absent in herbaceous species (59), which was in accordance with this study results. It was known from the MANOVA results that the seedling age significantly affected the TPAC (p < 0.05) while abiotic treatments did the little effect on the content. Saoussen et al. (60) found that salt stress could significantly increase the TPAC content of Tunisian safflower (a medicinal plant), however, in the present study results, no significant differences were noticed between the CKs and stress treatment groups (p < 0.05). To address specifically, UV20 and UV40 on D12, UV5, UV20, UV40, and UV60 on D19, and NaCl 100 on D21 had remarkably higher TPAC than the control. An interesting finding was that the higher TPAC compared to the control was mostly observed in UV treated groups, suggesting that certain intensity of UV stress could promote the proanthocyanins synthesis in some particular seedling age despite of the genetic restriction of this species.
Soluble Polysaccharide
The TSPC of wheatgrass in the present study ranged from 0.52 ± 0.07 to 2.41 ± 0.11 mg GE/g FW (Figure 1E). Some previous studies showed that the TSPC decreased significantly with the ripening or seedling age (24, 61). In this study, all the tested groups shared similar accumulation patterns of TSPC that decreased from D9 to D12 and then climbed up significantly (p < 0.05). Based on the MANOVA results, the TSPC was significantly affected by the seedling age and abiotic treatments, among which the seedling age influenced the content more efficiently [p < 0.01, F(seedlingage) = 136.80 > F(abiotictreatment) = 13.84]. Only 200 mM NaCl-, 20% PEG-, 25% PEG-, and UV-treatment (in exception of UV5) could enhance the TSP content (p < 0.05) and these results were subtly diverse with previous reports that salinity exposure enhanced the TSPC during germination and seedling period (62) or PEG limited low-molecular-mass TSPC (63). From D9 to D12, most of the abiotic groups (except UV20 and UV60) showed a lower TSPC than the control. When it was on D19, D21, and D27, all the treated groups showed a higher TSPC than the control. It could be explained that the decreased TSP from D9 to D12 was converted to monosaccharides and the latterly increased TSP was from the breakdown of wheat cell wall under the stress conditions (64), which was indirectly validated by previous reports that the activity of relative glycoside-hydrolyzing enzymes was increased under drought stress (64).
Besides, the TSPC in the current study was found to be much lower than some common fruits and vegetables (65) but still rival to medicinal-use fruit like jujube cv. Dazao, jujube cv. Junzao, and jujube cv. Huizao (66).
Ascorbic Acid
The AAC of the wheatgrass in the present study was ranging from 7.59 ± 0.10 to 15.32 ± 0.05 mg/g FW (Figure 1F). Based on MANOVA results, the AAC could be significantly affected by the seedling age and abiotic treatments [F(seedlingage) = 25.39 > F(abiotictreatment) = 23.86; p < 0.01]. The overall accumulation patterns of AAC gradually were observed to be decreased from D9 to D21, then increased from D21 to D27. Through MANOVA, 200 mM NaCl-, 20% PEG-, 25% PEG-, and UV-treatment (in exception of UV5) could significantly enhance the AAC (p < 0.05). An interesting founding was that the comparative higher AAC than the control was observed in intense abiotic stress groups, which was discording with previous studies that AAC declined under salt stress (30–40 days) in all the tested wheat genotypes and the decreasing magnitude augmented with salinity levels (67) and that drought decreased the AAC (68). There was a literature showing a similar result with ours that UV radiation treatment for 2 weeks elevated the AAC in Arabidopsis thaliana (69).
The different abiotic treatments showed different accumulation modes. More specifically, from D9 to D12, all the groups had a higher AAC than the control excluding UV5 on D9. In addition, on D24 and D27, most of the abiotic groups showed a higher AAC than the control except PEG 10% and NaCl 10 on D24 and NaCl 10/50 on D27. However, on D15, except groups of UV20–UV60, all other abiotic treatments induced a significantly lower AAC than the control. The literature with respect to the effects of abiotic stress on AAC mostly was of single-point sampling or no more than three times sampling throughout stressing period and concluded if the AAC was elevated or suppressed. However, the AAC response to stressors was regulated complicatedly by a series of successive biochemical reactions, activation or inhibition of relative enzymes, synthesis of other protective substances, and so on (70), hence, it was vitally important to take the growth time and stress intensity as well as cultivars into consideration.
The AAC in the results was much higher than most of the common fruits known as their high ascorbic acid value, such as strawberry, lemon, orange, kiwifruit, mandarin, mango (71), and leafy vegetables, such as amaranth (72, 73).
Chlorophyll
The Chl a content varied from 0.36 ± 0.00 to 1.49 ± 0.01 mg/g FW (Figure 1G), which was overwhelmingly higher than the Chl b content (0.049 ± 0.002 to 0.123 ± 0.001 mg/g FW, Figure 1H), which conforms with the results of leafy vegetable amaranth (74). The TChl content ranged from 0.42 ± 0.00 to 1.60 ± 0.02 mg/g FW (as shown in Figure 1I). The TChl content was more significantly affected by the different abiotic treatments [F(seedlingage) = 21.56 < F(abiotictreatment) = 62.12, p < 0.01] than the seedling age. PEG the 10 mM NaCl and UV treatments significantly decreased the chlorophyll content while 15~25% treatments could markedly upregulate it compared to control (p < 0.05). PEG was usually used to simulate the drought stress. There are reports that the drought stress decreased the chlorophyll or have no significant effect on chlorophyll concentration and that the chlorophyll was increased in some drought-tolerant wheat cultivars after 39 days of stress (75). The enhancement of TChl in young wheat leaves in the present study could be due to the activation of the enzyme in the light-dependent stage of biosynthesis (76). The TChl content was decreased non-/significantly under salinity stress from D9 to D21 but was increased on D24 compared to control. A previous study revealed that some wheat cultivars recorded a higher TChl at the tittering stage (77), which shared roughly consistent with the results to some extent. It could be inferred that the salinity stress could increment the TChl at some particular stage and UV stress would promote the degradation of chlorophyll.
Antioxidant Capacity
The ABTS scavenging capacity of wheatgrass was from 1.05 ± 0.10 to 2.69 ± 0.16 mg TE/g FW, shown in Figure 1J, and was rival to some herbal plants (Leguminosae, Bignoniaceae, Moraceae, Pluchea family, and so on) from the Amazonian region or Indonesia (78, 79) or some common fruits and vegetables, such as lemon, onion, parsley, sweet potato, and vegetable amaranths (80–82). According to the MANOVA results, the overall changing mode of ABTS bleaching ability was found decreasing from D12 to D24 and then rising on D27. Both the seedling age and abiotic treatments could significantly affect the ABTS scavenging capacity which could attribute to the enhancement of the phytochemicals in the plant. In addition, the seedling age influenced the ABTS radical scavenging ability more efficiently than the abiotic treatments [F(seedlingage) = 22.27 > F(abiotictreatment) = 5.63, p < 0.01], coinciding with the variation of functional chemical content. The treated groups that could improve the ABTS scavenging abilities were groups of NaCl 200, UV5, UV10, and UV20, discording to the previous studies that 25~100 mM NaCl reduced the ABTS scavenging ability in a short time (83). Specifically, on D21 and D27, all the groups showed a higher scavenging capacity (significantly or non-significantly) than the control.
The DPPH scavenging ability of our study ranged from 0.61 ± 0.12 to 1.47 ± 0.13 mg TE/g FW (Figure 1K), which was much higher than different vegetable amaranths (84, 85). The DPPH bleaching ability, on basis of MANOVA results, was significantly influenced by the seedling age and abiotic treatments, of which the former affected the DPPH radical scavenging ability more efficiently [F(seedlingage) = 59.87 > F(abiotictreatment) = 18.93, p < 0.01], coinciding with the variation of functional chemical content. Except for the UV10~60 treatments, all other treatments could markedly improve the DPPH bleaching ability, discording to the previous studies that 25~50 mM NaCl decreased the DPPH bleaching ability (83). The DPPH scavenging ability decreased significantly with the prolonging of the seedling age. Another notable finding was that NaCl and PEG treated groups rather than UV groups possessed significantly higher DPPH scavenging ability than the control, especially from D19 to D27 (p < 0.05).
The FRAP ranged from 1.23 ± 0.24 to 2.71 ± 0.26 mg TE/g FW (Figure 1L), which was comparable to common food like sweet potatoes (80) or papaya (86). Similarly, the FRAP was more significantly affected by the seedling age than abiotic treatments [F(seedlingage) = 39.48 > F(abiotictreatment) = 2.87, p < 0.01]. Interestingly, though the abiotic treatments could affect the FRAP, no statistically differences were found between the abiotic treating groups and the control, which discord with former studies that abiotic stress could significantly augment the antioxidant activity, such as FRAP (87). The discordance could be explained by the varied ability of the phytochemicals to the reducing power.
TOPSIS Ranking Results
The closeness coefficient (Rj) was calculated and the ranking list was presented in Table 1. Through the comprehensive ranking of the functional phytochemicals in wheatgrass, the top five highest functional phytochemicals were observed under NaCl 200 on D21 and D27, PEG 25% on D24, NaCl 200 on D24, and UV40 on D27, respectively.
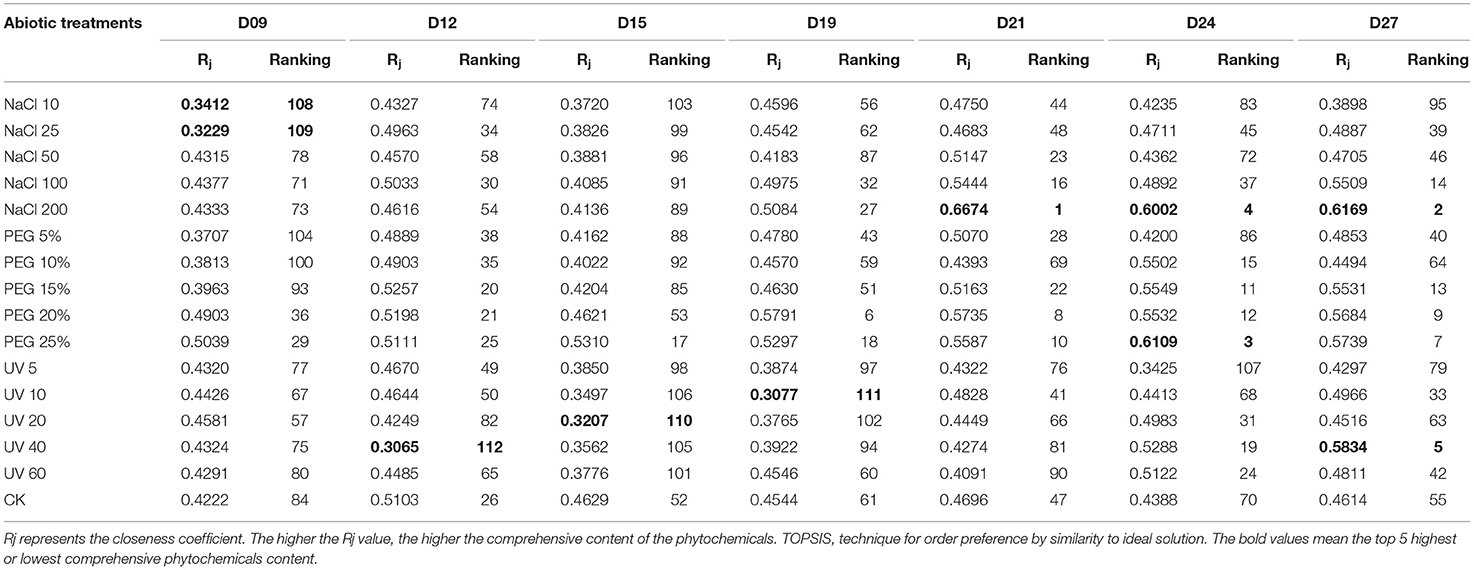
Table 1. TOPSIS ranking results of wheatgrass phytochemicals of different seedling ages under different abiotic treatments.
Correlation Analysis Results
Tables 2, 3 show the results of correlation analysis. On the 9th day, only TPC and TChl correlated positively with DPPH scavenging ability, meaning that at the early vegetative stage, the polyphenol and chlorophyll were the main antioxidants in wheatgrass (p < 0.01 and p < 0.05, respectively). On the 12th day, the TPC, TFC, and TTC were significantly or extremely significantly correlated with DPPH scavenging ability and FRAP, while TTC and TPAC correlated with ABTS bleaching capacity, suggesting that the content of these compounds started to increase and play a critical role in antioxidant activity. On the 15th day, the AAC, TTC, TFC, and TPC had a high correlation-ship with FRAP, meanwhile the TChl and TPC correlated with DPPH scavenging ability. On the 19th day, the TPC and TChl were highly related to DPPH scavenging ability and FRAP and were supposed to be the main antioxidant compounds as it was on the 21st day when TFC was included. The TTC had a negative correlation with ABTS bleaching ability (p < 0.01) on the 19th day.
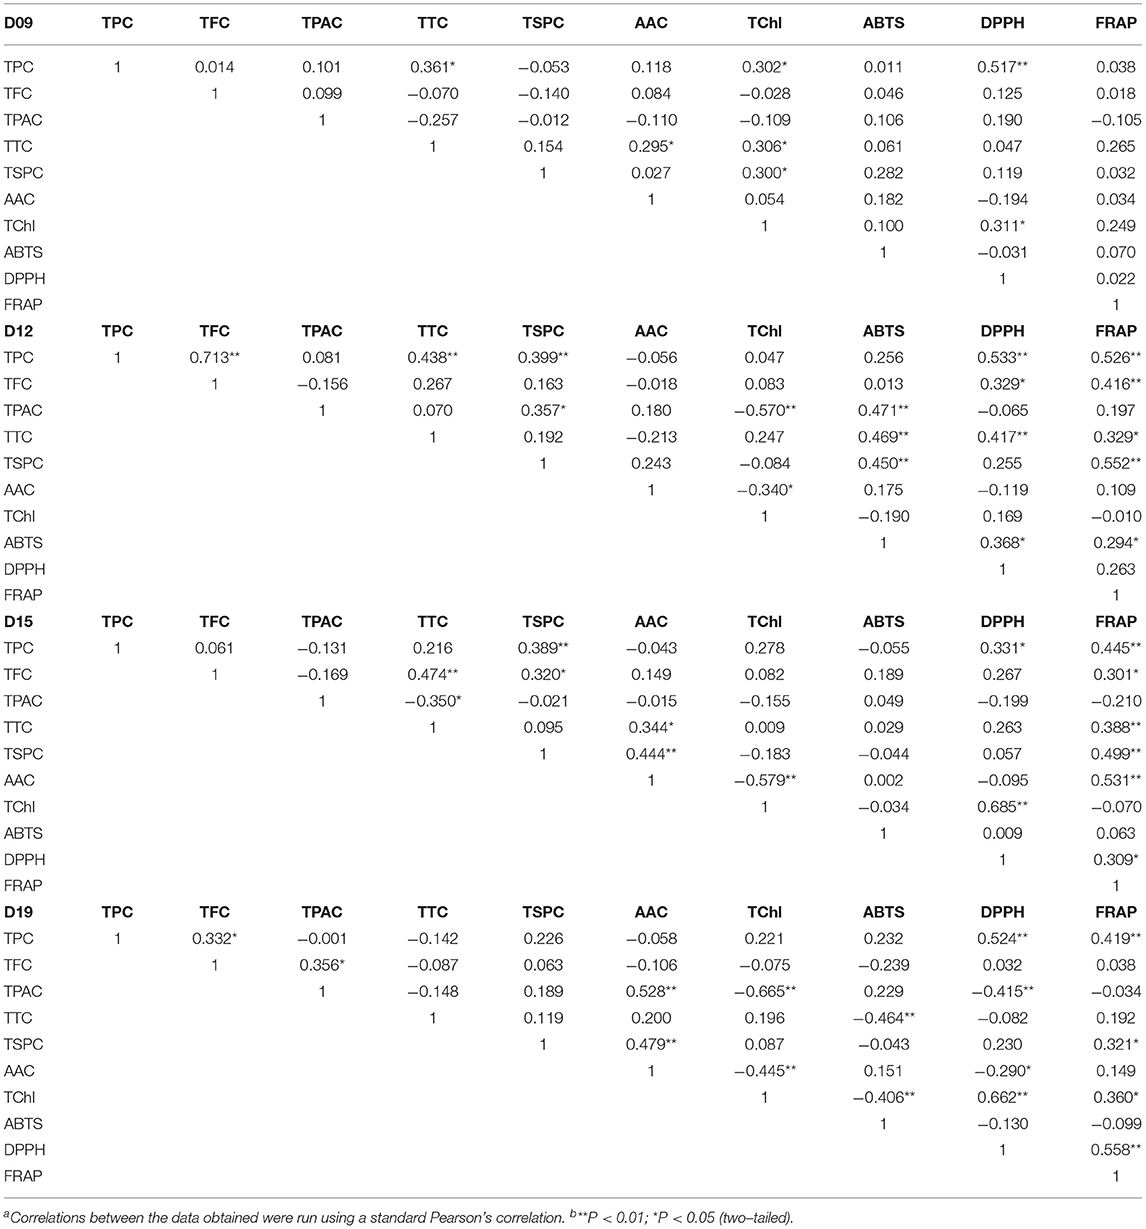
Table 2. Correlation coefficients of total polyphenols, total flavonoids, total proanthocyanins, total triterpenes, total soluble polysaccharides, ascorbic acid, total chlorophyll, ABTS and DPPH scavenging ability, and ferric iron-reducing antioxidant power of wheatgrass on the 9th~19th harvest daya,b.
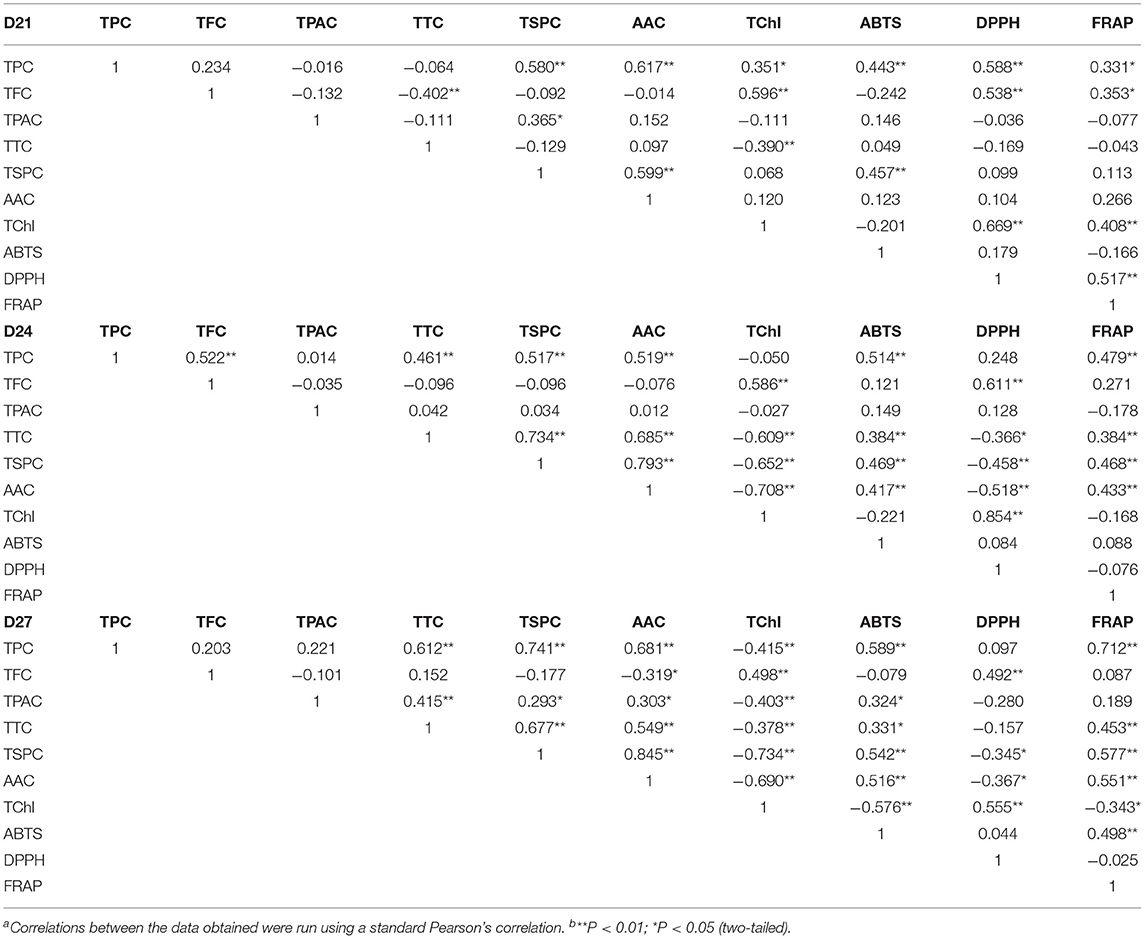
Table 3. Correlation coefficients of total polyphenols, total flavonoids, total proanthocyanins, total triterpenes, total soluble polysaccharides, ascorbic acid, total chlorophyll, abts and dpph scavenging ability, and ferric iron-reducing antioxidant power of wheatgrass on the 21st~27th harvest daya,b.
On 24th and 27th days, it was an interesting finding that the TTC, TChl, and AAC were highly positively correlated with ABTS and FRAP scavenging ability (p < 0.01) but were negatively correlated with DPPH, the reason for this was unclear. TPC showed a high correlation with ABTS and FRAP, and the TFC was correlated with DPPH (p < 0.01).
PCA and HHCA Reveal Differences in the Main Functional Phytochemicals
Principal component analysis and HHCA were further performed to depict the differences in the seven main functional chemicals of different abiotic treatments and antioxidant ability. The PCA plot (Figure 2) exhibited the similarities and differences among the abiotic treated groups of different seedling ages. PC 1 explained 96.527% of the variance which correlated with TPC, TFC, TTC, ABTS, DPPH, and FRAP, while PC 2 took up for 2.569% of the variance and correlated with TPAC, TSPC, AAC, and TChl. The samples were not separated from different abiotic treatments into groups, suggesting that each abiotic treatment did not have a relatively distinct phytochemical.
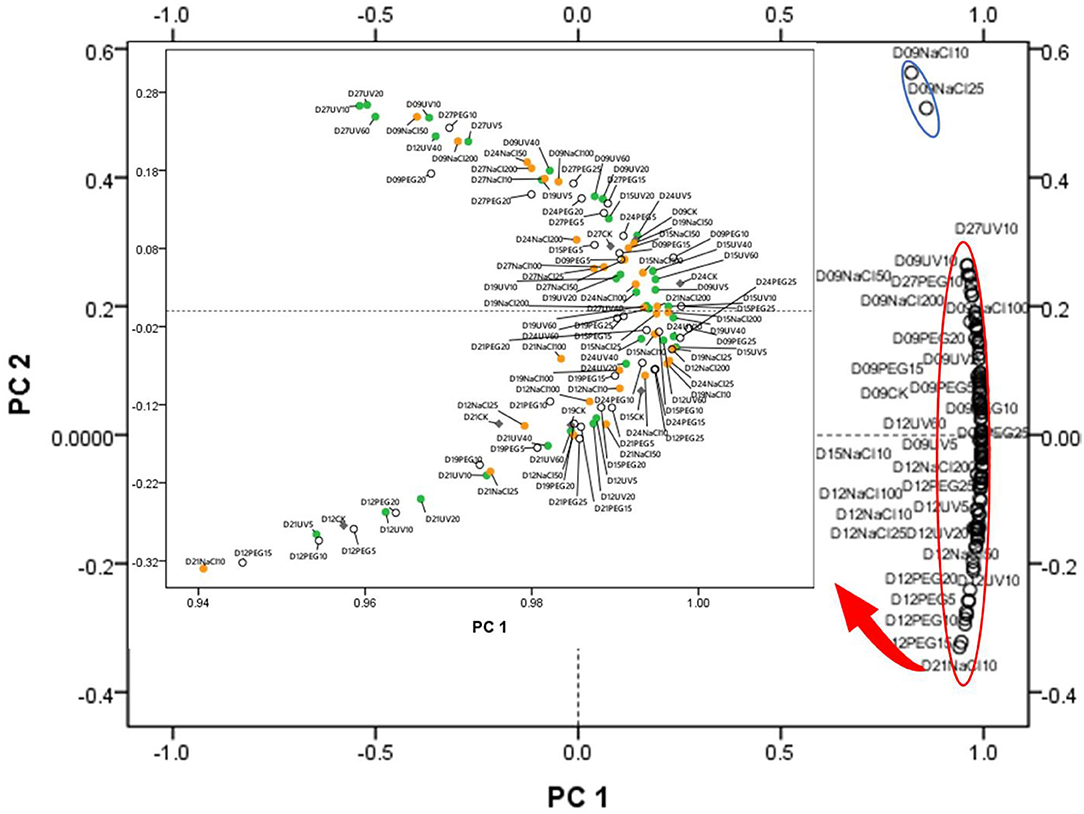
Figure 2. Principal component analysis (PCA) of the abiotic stress (15 kinds of treatments and one control group) × seedling ages (from D9 to D27) interactions. PC 1 explained 96.527% of the variance which correlated with total polyphenol content (TPC), total flavonoid content (TFC), total triterpene content (TTC), ABTS, DPPH, and ferric ion reducing antioxidant power (FRAP), while PC 2 took up for 2.569% of the variance and correlated with total proanthocyanins content (TPAC), total Soluble polysaccharides content (TSPC), ascorbic acid content (AAC), and total chlorophyll content (TChl). The green dots represent the UV treatments, the orange dots represent the NaCl treatments, the blank dots mean the PEG treatments, and the gray ones mean the control group (CK).
In the present study, the HHCA demonstrated abiotic variations in terms of the relative content of phytochemicals and antioxidant capacity (Figure 3). Based on the distinct accumulation patterns, the abiotic treatments could be divided into four main clusters. The abiotic treatments in cluster I generally contributed to the decrease in the value of ABTS scavenging ability, DPPH scavenging ability, FRAP, TPC, and TChl, but increased the TSPC value. The ones in cluster II roughly contributed to the upregulation of the antioxidant capacity and TPAC. The ones in cluster III contributed to the slight upregulation of TChl and DPPH scavenging ability and slight downregulation of the value of other detected items. The abiotic treatments in cluster IV roughly contributed to the augment of antioxidant ability, TChl, TPC, and TTC value and the decrease of TPAC and TSPC.
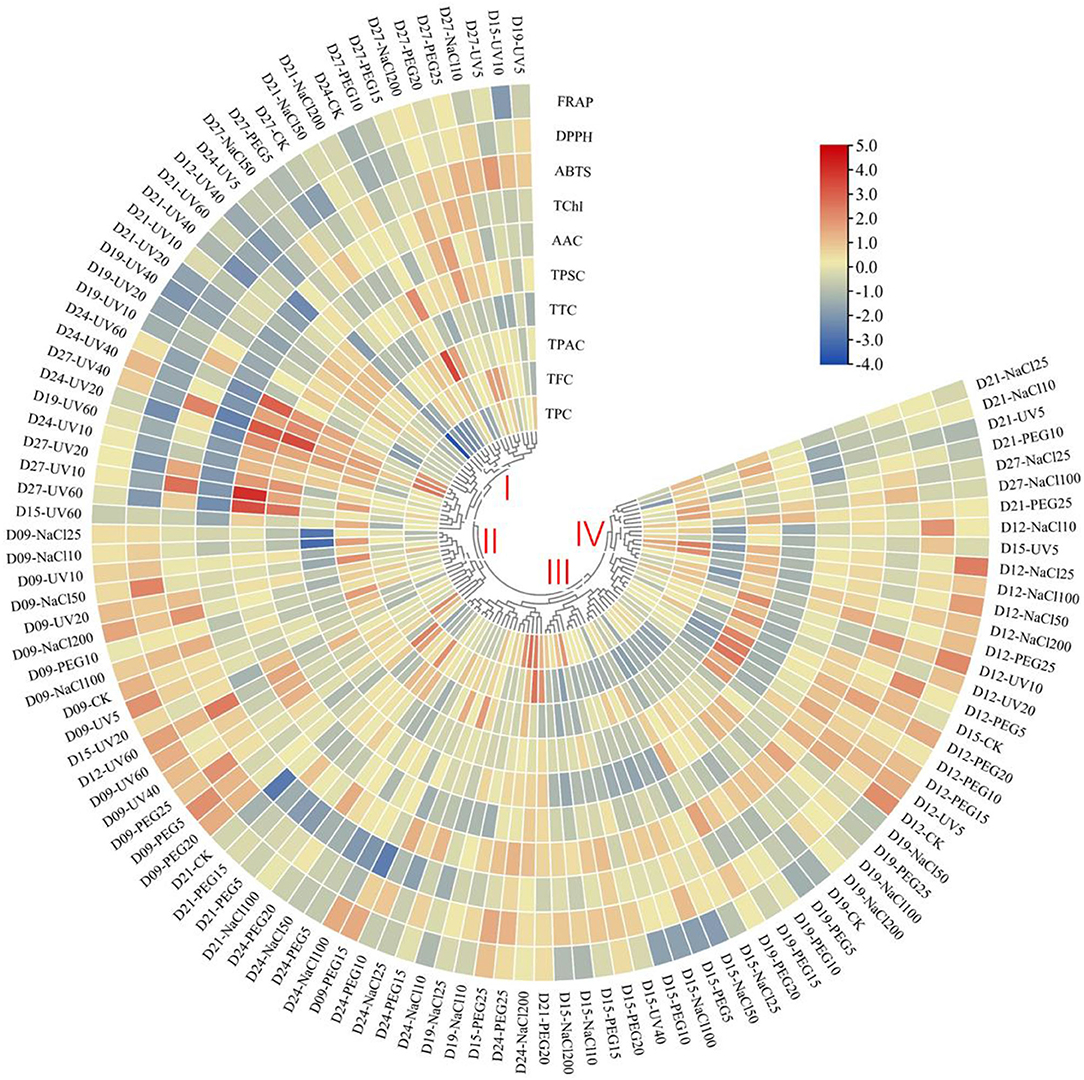
Figure 3. Heatmap hierarchical clustering analysis (HHCA) of the various abiotic treatments on different seedling ages of wheatgrass. Each value of the seven main functional phytochemicals and three antioxidant activity indices of abiotic treatments are visualized in a column, and each of the treatments is represented by a row. The abundance of each phytochemical content is represented by a bar with unique color. Red means upregulation, and blue means downregulation. The heatmap is constructed by TBtools software. Distance methods are using Pearson's distance.
Conclusion
The antioxidant activity and functional phytochemical content of wheatgrass could be significantly affected by both the stress treatments and seedling ages, while the latter affected phytochemicals except chlorophyll more efficiently. The different treatments did not always lead to an increase in the content of these functional compounds supposedly but resulted in the different accumulation patterns. Through the average Rj value (data not shown), the treatments with higher comprehensive phytochemical values were PEG 15~25% and NaCl 100~200. The artificial abiotic treatments would lead to some reduction in the yield though they could somehow elevate the content of the compounds, hence, taking into consideration the cost of the treatment application, it is better to harvest the wheatgrass at a particular seedling age to acquire better nutritional value.
The highest TPC, TFC, TPAC, TTC, TSPC, AAC, and TChl were 2.89 ± 0.01 mg GAE/g FW, 4.47 ± 0.11 mg RE/g FW, 0.95 ± 0.76 mg CE/g FW, 12 ± 2.3 mg UAE/g FW, 2.41 ± 0.11 mg GE/g FW, 15.32 ± 0.05 mg/g FW, 11.6 ± 0.02 mg/g FW, respectively, and were found in groups of PEG25% on D24, NaCl 200 on D24, NaCl 200 on D21, PEG 15% on D12, UV 40 on D27, UV10 on D27, and PEG20% on D19, which could serve as a theoretical basis to high yielding of the individual functional compounds. The time-dependent pathway on how the functional compounds were regulated between different stress-tolerant cultivars was complex and still not clear; hence, it needs further investigation.
Data Availability Statement
The original contributions presented in the study are included in the article/supplementary material, further inquiries can be directed to the corresponding author.
Ethics Statement
The field experiments in this research were carried out as per provisions of National Standards GB/T 27476.1-2014—Safety in testing laboratories (China) and National standards GB 19489-2008—Laboratories—General requirements for biosafety (China) issued by General Administration of Quality Supervision, Inspection and Quarantine of the People's Republic of China and Standardization Administration of China.
Author Contributions
BJ designed and funded the research. GG sponsored the publication fee and helped revise work of the manuscript. MR, YB, FG, WY, XX, MS, JW, and RC were responsible for the methodology, conducting, and data recording. LX helped in statistics handling. XZ and FF funded the research equally. QC drafted the manuscript and took the duty of data handling and revising the study. All authors contributed to the article and approved the submitted version.
Funding
The work was funded by a Research-Platform Open Project of Suzhou University (2019ykf13, 2017ykf06)—publication fee; Doctor/Professor Scientific Research Foundation of Suzhou University (2019jb07, 2019jb22)—Reagent and disposables; Natural Science Research Project in Anhui Province (KJ2017ZD36, KJ2019A0665, KJ2020A0729)—Reagents and disposables; National College Students' Innovative and Entrepreneurial Education and Training Program (202010379046)—Reagent and small devices Model; Leading Base of Superior Undergraduate Talents (2019rcsfjd086)—Publication fee.
Conflict of Interest
The authors declare that the research was conducted in the absence of any commercial or financial relationships that could be construed as a potential conflict of interest.
Publisher's Note
All claims expressed in this article are solely those of the authors and do not necessarily represent those of their affiliated organizations, or those of the publisher, the editors and the reviewers. Any product that may be evaluated in this article, or claim that may be made by its manufacturer, is not guaranteed or endorsed by the publisher.
Acknowledgments
Special thanks to Jun Chen, a local farmer from Lingbi County, Suzhou City, Anhui Province who kindly provide the wheat seeds for the research.
References
1. Suriyavathana M, Roopavathi I. Phytochemical characterization of triticum aestivum (Wheat Grass). J Pharmacogn Phytochem. (2016) 5:283. Available online at: www.phytojournal.com
2. Durairaj V, Hoda M, Shakya G, Babu SPP, Rajagopalan R. Phytochemical screening and analysis of antioxidant properties of aqueous extract of wheatgrass. Asian Pac J Trop Med. (2014) 7:S398–404. doi: 10.1016/S1995-7645(14)60265-0
3. Murali M, Archa Raj M, Akhil S, Liji R, Kumar S, Nair A, et al. Preliminary phytochemical analysis of wheat grass leaf extracts. Int J Pharm Sci Rev Res. (2016) 40:307–12. Available online at: www.globalresearchonline.net
4. Kumar N, Iyer U. Impact of wheatgrass (Triticum aestivum L.) supplementation on atherogenic lipoproteins and menopausal symptoms in hyperlipidemic South Asian women - a randomized controlled study. J Diet Suppl. (2017) 14:503–13. doi: 10.1080/19390211.2016.1267063
5. Devi CB, Bains K, Kaur H. Effect of drying procedures on nutritional composition, bioactive compounds and antioxidant activity of wheatgrass (Triticum aestivum L). J Food Sci Technol. (2018) 56:491–6. doi: 10.1007/s13197-018-3473-7
6. Kulkarni SD, Tilak JC, Acharya R, Rajurkar NS, Devasagayam T, Reddy A. Evaluation of the antioxidant activity of wheatgrass (Triticum aestivum L.) as a function of growth under different conditions. Phytother Res. (2006) 20:218–27. doi: 10.1002/ptr.1838
7. Padalia S, Drabu S, Raheja I, Gupta A, Dhamija M. Multitude potential of wheatgrass juice (Green Blood): an overview. Chronicles Young Sci. (2010) 1:23–8. doi: 10.4103/2229-5186.79341
8. Rana S, Kamboj JK, Gandhi V. Living life the natural way–wheatgrass and health. Funct Foods Health Dis. (2011) 1:444–56. doi: 10.31989/ffhd.v1i11.112
9. Gore RD. Wheatgrass: green blood can help to fight cancer. J Clin Diagn Res. (2017) 11:ZC40–2. doi: 10.7860/JCDR/2017/26316.10057
10. Ghumman A, Singh N, Kaur A. Chemical, nutritional and phenolic composition of wheatgrass and pulse shoots. Int J Food Sci Technol. (2017) 52:2191–200. doi: 10.1111/ijfs.13498
11. Bar-Sela G, Cohen M, Ben-Arye E, Epelbaum R. The medical use of wheatgrass: review of the gap between basic and clinical applications. Mini Rev Med Chem. (2015) 15:1002–10. doi: 10.2174/138955751512150731112836
12. Thomas DT, Puthur JT. Amplification of abiotic stress tolerance potential in rice seedlings with a low dose of UV-B seed priming. Funct Plant Biol. (2019) 46:455. doi: 10.1071/FP18258
13. Złotek U, Szymanowska U, Jakubczyk A, Sikora M, Swieca M. Effect of arachidonic and jasmonic acid elicitation on the content of phenolic compounds and antioxidant and anti-inflammatory properties of wheatgrass (Triticum aestivum L.). Food Chem. (2019) 288:256–61. doi: 10.1016/j.foodchem.2019.02.124
14. Sarker U, Oba S. Drought stress enhances nutritional and bioactive compounds, phenolic acids and antioxidant capacity of Amaranthus leafy vegetable. BMC Plant Biol. (2018) 18:258. doi: 10.1186/s12870-018-1484-1
15. Sarker U, Oba S. Response of nutrients, minerals, antioxidant leaf pigments, vitamins, polyphenol, flavonoid and antioxidant activity in selected vegetable amaranth under four soil water content. Food Chem. (2018) 252:72–83. doi: 10.1016/j.foodchem.2018.01.097
16. Sarker U, Oba S. Salinity stress enhances color parameters, bioactive leaf pigments, vitamins, polyphenols, flavonoids and antioxidant activity in selected Amaranthus leafy vegetables. J Sci Food Agric. (2019) 99:2275–84. doi: 10.1002/jsfa.9423
17. Sarker U, Oba S. The response of salinity stress-induced A. tricolor to growth, anatomy, physiology, non-enzymatic and enzymatic antioxidants. Front Plant Sci. (2020) 11:559876. doi: 10.3389/fpls.2020.559876
18. Seminario A, Song L, Zulet A, Nguyen HT, Gonzalez EM, Larrainzar E. Drought stress causes a reduction in the biosynthesis of ascorbic acid in soybean plants. Front Plant Sci. (2017) 8:1042. doi: 10.3389/fpls.2017.01042
19. Takshak S, Agrawal SB. Defense potential of secondary metabolites in medicinal plants under UV-B stress. J Photochem Photobiol B Biol. (2019) 193:51–88. doi: 10.1016/j.jphotobiol.2019.02.002
20. Benincasa P, Tosti G, Farneselli M, Maranghi S, Bravi E, Marconi O, et al. Phenolic content and antioxidant activity of einkorn and emmer sprouts and wheatgrass obtained under different radiation wavelengths. Ann Agric Sci. (2020) 65:68–76. doi: 10.1016/j.aoas.2020.02.001
21. Falcinelli B, Benincasa P, Calzuola I, Gigliarelli L, Lutts S, Marsili V. Phenolic content and antioxidant activity in raw and denatured aqueous extracts from sprouts and wheatgrass of einkorn and emmer obtained under salinity. Molecules. (2017) 22:2132. doi: 10.3390/molecules22122132
22. Jaiswal SK, Prakash R, Skalny AV, Skalnaya MG, Grabeklis AR, Skalnaya AA, et al. Synergistic effect of selenium and UV-B radiation in enhancing antioxidant level of wheatgrass grown from selenium rich wheat. J Food Biochem. (2018) 42:e12577. doi: 10.1111/jfbc.12577
23. Benincasa P, Falcinelli B, Lutts S, Stagnari F, Galieni A. Sprouted grains: a comprehensive review. Nutrients. (2019) 11:421. doi: 10.3390/nu11020421
24. Jiang B, Geng F, Chang R, Ruan M, Bian Y, Xu L, et al. Comprehensive evaluation of the effect of ultraviolet stress on functional phytochemicals of hulless barley (Qingke) grass in different growth times at vegetative stage. ACS Omega. (2020) 5:31810–20. doi: 10.1021/acsomega.0c04576
25. Luo S, Zeng C, Li J, Feng S, Zhou L, Chen T, et al. Effects of ultrasonic-assisted extraction on the yield and the antioxidative potential of bergenia emeiensis triterpenes. Molecules. (2020) 25:4159. doi: 10.3390/molecules25184159
26. Sarker U, Oba S. Phenolic profiles and antioxidant activities in selected drought-tolerant leafy vegetable amaranth. Sci Rep. (2020) 10:18287. doi: 10.1038/s41598-020-71727-y
27. Guo L, Zhu WC, Liu YT, Wu Y, Zheng AQ, Liu YL, et al. Response surface optimized extraction of flavonoids from mimenghua and its antioxidant activities in vitro. Food Sci Biotechnol. (2013) 22:1–8. doi: 10.1007/s10068-013-0214-6
28. Zribi I, Omezzine F, Haouala R. Variation in phytochemical constituents and allelopathic potential of Nigella sativa with developmental stages. South African J Botany. (2014) 94:255–62. doi: 10.1016/j.sajb.2014.07.009
29. Guo L, Guo J, Zhu W, Jiang X. Optimized synchronous extraction process of tea polyphenols and polysaccharides from Huaguoshan Yunwu tea and their antioxidant activities. Food Bioprod Process. (2016) 100:303–10. doi: 10.1016/j.fbp.2016.08.001
30. Mashabela MN, Selahle KM, Soundy P, Crosby KM, Sivakumar D. Bioactive compounds and fruit quality of green sweet pepper grown under different colored shade netting during postharvest storage. J Food Sci. (2015) 80:H2612–8. doi: 10.1111/1750-3841.13103
31. Warren CR. Rapid measurement of chlorophylls with a microplate reader. J Plant Nutr. (2008) 31:1321–32. doi: 10.1080/01904160802135092
32. Pfendt LB, Vukašinović VL, Blagojević NZ, Radojević MP. Second order derivative spectrophotometric method for determination of vitamin C content in fruits, vegetables and fruit juices. Europ Food Res Technol. (2003) 217:269–72. doi: 10.1007/s00217-003-0746-8
33. Liu S, Li X, Guo Z, Zhang X, Chang X. Polyphenol content, physicochemical properties, enzymatic activity, anthocyanin profiles, and antioxidant capacity of cerasus humilis(Bge.) Sok. Genotypes. J Food Qual. (2018) 2018:1–13. doi: 10.1155/2018/5479565
34. Lin S, Guo H, Gong JDB, Lu M, Lu M.-Y., et al. Phenolic profiles, β-glucan contents, and antioxidant capacities of colored Qingke (Tibetan hulless barley) cultivars. J Cereal Sci. (2018) 81:69–75. doi: 10.1016/j.jcs.2018.04.001
35. Hwang CL, Yoon K. Multiple Attribute Decision Making. Methods and Applications. Berlin Heidelberg: Springer-Verlag (1981).
36. Pandey A, Jaiswal D, Agrawal SB. Ultraviolet-B mediated biochemical and metabolic responses of a medicinal plant Adhatoda vasica Nees. at different growth stages. J Photochem Photobiol B. (2021) 216:112142. doi: 10.1016/j.jphotobiol.2021.112142
37. Liu BY, Lei CY, Jin JH, Li S, Zhang YS, Liu WQ. Physiological responses of two moss species to the combined stress of water deficit and elevated nitrogen deposition. I. Secondary metabolism. Int J Plant Sci. (2015) 176:446–57. doi: 10.1086/681023
38. de Costa F, Yendo ACA, Fleck JD, Gosmann G, Fett-Neto AG. Accumulation of a bioactive triterpene saponin fraction of Quillaja brasiliensis leaves is associated with abiotic and biotic stresses. Plant Physiol Biochem. (2013) 66:56–62. doi: 10.1016/j.plaphy.2013.02.003
39. Kou X, Chen Q, Li X, Li M, Kan C, Chen B, et al. Quantitative assessment of bioactive compounds and the antioxidant activity of 15 jujube cultivars. Food Chem. (2015) 173:1037–44. doi: 10.1016/j.foodchem.2014.10.110
40. Fischer S, Wilckens R, Jara J, Aranda M, Valdivia W, Bustamante L, et al. Protein and antioxidant composition of quinoa (Chenopodium quinoa Willd.) sprout from seeds submitted to water stress, salinity and light conditions. Ind Crops Prod. (2017) 107:558–64. doi: 10.1016/j.indcrop.2017.04.035
41. Sharma A, Shahzad B, Rehman A, Bhardwaj R, Landi M, Zheng B. Response of phenylpropanoid pathway and the role of polyphenols in plants under abiotic stress. Molecules. (2019) 24:2452. doi: 10.3390/molecules24132452
42. Kowalczewski PL, Radzikowska D, Ivanisova E, Szwengiel A, Kacaniova M, Sawinska Z. Influence of abiotic stress factors on the antioxidant properties and polyphenols profile composition of green barley (Hordeum vulgare L.). Int J Mol Sci. (2020) 21:397. doi: 10.3390/ijms21020397
43. Alam MK, Rana ZH, Islam SN. Comparison of the proximate composition, total carotenoids and total polyphenol content of nine orange-fleshed sweet potato varieties grown in Bangladesh. Foods. (2016) 5:64. doi: 10.3390/foods5030064
44. Sarker U, Hossain MN, Iqbal MA, Oba S. Bioactive components and radical scavenging activity in selected advance lines of salt-tolerant vegetable amaranth. Front Nutr. (2020) 7:587257. doi: 10.3389/fnut.2020.587257
45. Sarker U, Oba S. Nutraceuticals, phytochemicals, and radical quenching ability of selected drought-tolerant advance lines of vegetable amaranth. BMC Plant Biol. (2020) 20:564. doi: 10.1186/s12870-020-02780-y
46. Denev P, Lojek A, Ciz M, Kratchanova M. Antioxidant activity and polyphenol content of Bulgarian fruits. Bulg J Agric Sci. (2013) 19:22–27. Available online at: www.researchgate.net/publication/258447428
47. Murillo E, Britton GB, Durant AA. Antioxidant activity and polyphenol content in cultivated and wild edible fruits grown in Panama. J Pharm Bioallied Sci. (2012) 4:313–7. doi: 10.4103/0975-7406.103261
48. Ma D, Sun D, Wang C, Li Y, Guo T. Expression of flavonoid biosynthesis genes and accumulation of flavonoid in wheat leaves in response to drought stress. Plant Physiol Biochem. (2014) 80:60–6. doi: 10.1016/j.plaphy.2014.03.024
49. Idrees M, Sania B, Hafsa B, Kumari S, Khan H, Fazal H, et al. Spectral lights trigger biomass accumulation and production of antioxidant secondary metabolites in adventitious root cultures of Stevia rebaudiana (Bert.). C R Biol. (2018) 341:334–42. doi: 10.1016/j.crvi.2018.05.003
50. Zlotek U, Szymanowska U, Baraniak B, Karas M. Antioxidant activity of polyphenols of adzuki bean (Vigna angularis) germinated in abiotic stress conditions. Acta Sci Pol Technol Aliment. (2015) 14:55–63. doi: 10.17306/J.AFS.2015.1.6
51. Sarker U, Oba S. Polyphenol and flavonoid profiles and radical scavenging activity in leafy vegetable Amaranthus gangeticus. BMC Plant Biol. (2020) 20:499. doi: 10.1186/s12870-020-02700-0
52. Khanam UKS, Oba S, Yanase E, Murakami Y. Phenolic acids, flavonoids and total antioxidant capacity of selected leafy vegetables. J Funct Foods. (2012) 4:979–987. doi: 10.1016/j.jff.2012.07.006
53. Kubola J, Siriamornpun S, Meeso N. Phytochemicals, vitamin C and sugar content of Thai wild fruits. Food Chem. (2011) 126:972–81. doi: 10.1016/j.foodchem.2010.11.104
54. Yi Y, Sun J, Xie J, Min T, Wang LM, Wang HX. Phenolic profiles and antioxidant activity of lotus root varieties. Molecules. (2016) 21:863. doi: 10.3390/molecules21070863
55. Mahieddine B, Amina B, Faouzi SM, Sana B, Wided D. Effects of microwave heating on the antioxidant activities of tomato (Solanum lycopersicum). Ann Agric Sci. (2018) 63:135–9. doi: 10.1016/j.aoas.2018.09.001
56. Priyanthi C, Sivakanesan R. The total antioxidant capacity and the total phenolic content of rice using water as a solvent. Int J Food Sci. (2021) 2021:5268584. doi: 10.1155/2021/5268584
57. Yan L, Zhou X, Shi L, Shalimu D, Ma C, Liu Y. Phenolic profiles and antioxidant activities of six Chinese pomegranate (Punica granatum L.) cultivars. Int J Food Propert. (2017) 20:S94–107. doi: 10.1080/10942912.2017.1289960
58. Bahukhandi A, Barola A, Sekar KC. Antioxidant activity and polyphenolics of fragaria nubicola: a wild edible fruit species of Himalaya. Proc Natl Acad Sci India Sect B Biol Sci. (2019) 90:761–7. doi: 10.1007/s40011-019-01142-5
59. Furlan CM, Motta LB, Santos D, Petridis G. Tannins: what do they represent in plant life. In: Petridis GK, editor. Tannins: Types, Foods Containing and Nutrition. New York, NY: Nova Science Publishers, Inc (2011). p. 251–63.
60. Abdallah SB, Rabhi M, Harbaoui F, Zar-kalai F, Lachâal M, Karray-Bouraoui N. Distribution of phenolic compounds and antioxidant activity between young and old leaves of Carthamus tinctorius L. and their induction by salt stress. Acta Physiol Plantarum. (2012) 35:1161–9. doi: 10.1007/s11738-012-1155-z
61. Ninio R, Lewinsohn E, Mizrahi Y, Sitrit Y. Changes in sugars, acids, and volatiles during ripening of koubo [Cereus peruvianus (L.) Miller] fruits. J Agric Food Chem. (2003) 51:797–801. doi: 10.1021/jf020840s
62. Ahmad F, Singh A, Kamal A. Osmoprotective role of sugar in mitigating abiotic stress in plants. In: Roychoudhury A, Tripathi DK, editors. Protective Chemical Agents in the Amelioration of Plant Abiotic Stress: Biochemical and Molecular Perspectives. Chichester: John Wiley & Sons Ltd (2020). p. 53–70. doi: 10.1002/9781119552154.ch3
63. Le Gall H, Philippe F, Domon JM, Gillet F, Pelloux J, Rayon C. Cell wall metabolism in response to abiotic stress. Plants. (2015) 4:112–66. doi: 10.3390/plants4010112
64. Konno H, Yamasaki Y, Sugimoto M, Takeda K. Differential changes in cell wall matrix polysaccharides and glycoside-hydrolyzing enzymes in developing wheat seedlings differing in drought tolerance. J Plant Physiol. (2008) 165:745–54. doi: 10.1016/j.jplph.2007.07.007
65. Englyst H, Bingham S, Runswick S, Collinson E, Cummings J. Dietary fibre (non-starch polysaccharides) in fruit, vegetables and nuts. J Human Nutr Dietetics. (1988) 1:247–86. doi: 10.1111/j.1365-277X.1988.tb00197.x
66. Chen K, Fan D, Fu B, Zhou J, Li H. Comparison of physical and chemical composition of three chinese jujube (Ziziphus jujuba Mill.) cultivars cultivated in four districts of Xinjiang region in China. Food Sci Technol. (2019) 39:912–21. doi: 10.1590/fst.11118
67. Sairam R, Srivastava G, Agarwal S, Meena R. Differences in antioxidant activity in response to salinity stress in tolerant and susceptible wheat genotypes. Biol Plant. (2005) 49:85. doi: 10.1007/s10535-005-5091-2
68. Bartoli CG, Simontacchi M, Tambussi E, Beltrano J, Montaldi E, Puntarulo S. Drought and watering-dependent oxidative stress: effect on antioxidant content in Triticum aestivum L. leaves. J Exp Botany. (1999) 50:375–83. doi: 10.1093/jxb/50.332.375
69. Bartoli CG, Yu J, Gomez F, Fernandez L, McIntosh L, Foyer CH. Inter-relationships between light and respiration in the control of ascorbic acid synthesis and accumulation in Arabidopsis thaliana leaves. J Exp Bot. (2006) 57:1621–31. doi: 10.1093/jxb/erl005
70. Badridze G. Influence of ultraviolet irradiation and acid precipitations on the content of antioxidants in wheat leaves. Appl Ecol Environ Res. (2015) 13:993–1013. doi: 10.15666/aeer/1304_9931013
71. Szeto YT, Tomlinson B, Benzie IF. Total antioxidant and ascorbic acid content of fresh fruits and vegetables: implications for dietary planning and food preservation. Br J Nutr. (2002) 87:55–9. doi: 10.1079/BJN2001483
72. Sarker U, Hossain MM, Oba S. Nutritional and antioxidant components and antioxidant capacity in green morph Amaranthus leafy vegetable. Sci Rep. (2020) 10:1336. doi: 10.1038/s41598-020-57687-3
73. Sarker U, Oba S, Daramy MA. Nutrients, minerals, antioxidant pigments and phytochemicals, and antioxidant capacity of the leaves of stem amaranth. Sci Rep. (2020) 10:3892. doi: 10.1038/s41598-020-60252-7
74. Sarker U, Islam MT, Rabbani MG, Oba S. Variability in total antioxidant capacity, antioxidant leaf pigments and foliage yield of vegetable amaranth. J Integr Agric. (2018) 17:1145–53. doi: 10.1016/S2095-3119(17)61778-7
75. Keyvan S. The effects of drought stress on yield, relative water content, proline, soluble carbohydrates and chlorophyll of bread wheat cultivars. J Anim Plant Sci. (2010) 8:1051–60. Available online at: m.elewa.org/JAPS
76. Nikolaeva M, Maevskaya S, Shugaev A, Bukhov N. Effect of drought on chlorophyll content and antioxidant enzyme activities in leaves of three wheat cultivars varying in productivity. Russian J Plant Physiol. (2010) 57:87–95. doi: 10.1134/S1021443710010127
77. Ghogdi EA, Izadi-Darbandi A, Borzouei A. Effects of salinity on some physiological traits in wheat (Triticum aestivum L.) cultivars. Indian J Sci Technol. (2012) 5:1901–6. doi: 10.17485/ijst/2012/v5i1.23
78. Silva EM, Souza JNS, Rogez H, Rees JF, Larondelle Y. Antioxidant activities and polyphenolic contents of fifteen selected plant species from the Amazonian region. Food Chem. (2007) 101:1012–8. doi: 10.1016/j.foodchem.2006.02.055
79. Andarwulan N, Batari R, Sandrasari DA, Bolling B, Wijaya H. Flavonoid content and antioxidant activity of vegetables from Indonesia. Food Chem. (2010) 121:1231–5. doi: 10.1016/j.foodchem.2010.01.033
80. Rautenbach F, Faber M, Laurie S, Laurie R. Antioxidant capacity and antioxidant content in roots of 4 sweetpotato varieties. J Food Sci. (2010) 75:C400–5. doi: 10.1111/j.1750-3841.2010.01631.x
81. Romaric GB. Phenolic compounds and antioxidant activities in some fruits and vegetables from Burkina Faso. Afr J Biotechnol. (2011) 10:7934–41. doi: 10.5897/AJB10.2010
82. Sarker U, Oba S. Antioxidant constituents of three selected red and green color Amaranthus leafy vegetable. Sci Rep. (2019) 9:18233. doi: 10.1038/s41598-019-52033-8
83. Islam MZ, Park B-J, Lee Y.-T. Effect of salinity stress on bioactive compounds and antioxidant activity of wheat microgreen extract under organic cultivation conditions. Int J Biol Macromol. (2019) 140:631–6. doi: 10.1016/j.ijbiomac.2019.08.090
84. Sarker U, Oba S. Augmentation of leaf color parameters, pigments, vitamins, phenolic acids, flavonoids and antioxidant activity in selected Amaranthus tricolor under salinity stress. Sci Rep. (2018) 8:12349. doi: 10.1038/s41598-018-30897-6
85. Sarker U, Oba S. Leaf pigmentation, its profiles and radical scavenging activity in selected Amaranthus tricolor leafy vegetables. Sci Rep. (2020) 10:18617. doi: 10.1038/s41598-020-66376-0
86. Addai ZR, Abdullah A, Mutalib SA. Effect of extraction solvents on the phenolic content and antioxidant properties of two papaya cultivars. J Med Plants Res. (2013) 7:3354–9. doi: 10.5897/JMPR2013.5116
87. Rosales MA, Cervilla LM, Sanchez-Rodriguez E, Rubio-Wilhelmi M del M, Blasco B, Rios JJ, et al. The effect of environmental conditions on nutritiona quality of cherry tomato fruits: evaluation of two experimental Mediterranean greenhouses. J Sci Food Agric. (2011) 91:152–62. doi: 10.1002/jsfa.4166
Keywords: wheat young leaves, ultraviolet stress, drought stress, salinity stress, functional compounds, comprehensive nutrition ranking
Citation: Jiang B, Gao G, Ruan M, Bian Y, Geng F, Yan W, Xu X, Shen M, Wang J, Chang R, Xu L, Zhang X, Feng F and Chen Q (2021) Quantitative Assessment of Abiotic Stress on the Main Functional Phytochemicals and Antioxidant Capacity of Wheatgrass at Different Seedling Age. Front. Nutr. 8:731555. doi: 10.3389/fnut.2021.731555
Received: 27 June 2021; Accepted: 28 July 2021;
Published: 24 August 2021.
Edited by:
Carmit Ziv, Agricultural Research Organization (ARO), IsraelReviewed by:
Athanasios Koukounaras, Aristotle University of Thessaloniki, GreeceUmakanta Sarker, Bangabandhu Sheikh Mujibur Rahman Agricultural University, Bangladesh
Copyright © 2021 Jiang, Gao, Ruan, Bian, Geng, Yan, Xu, Shen, Wang, Chang, Xu, Zhang, Feng and Chen. This is an open-access article distributed under the terms of the Creative Commons Attribution License (CC BY). The use, distribution or reproduction in other forums is permitted, provided the original author(s) and the copyright owner(s) are credited and that the original publication in this journal is cited, in accordance with accepted academic practice. No use, distribution or reproduction is permitted which does not comply with these terms.
*Correspondence: Qiong Chen, xilinmuyu@sina.com
†These authors share first authorship