Acetylcholinesterase (AChE) is an important link in the apoptotic pathway induced by hyperglycemia in Y79 retinoblastoma cell line
- 1Department of Ophthalmology, Bnai-Zion Medical Center, Haifa, Israel
- 2Ruth and Bruce Rappaport Faculty of Medicine, Technion - Israel Institute of Technology, and The Rappaport Institute, Haifa, Israel
Acetylcholinesterase (AChE) expression was found to be induced in the mammalian CNS, including the retina, by different types of stress leading to cellular apoptosis. Here, we tested possible involvement of AChE in hyperglycemia-induced apoptosis in a retinal cell line. Y79 retinoblastoma cells were incubated in starvation media (1% FBS and 1 mg/ml glucose) for 16–24 h, and then exposed to hyperglycemic environment by raising extracellular glucose concentrations to a final level of 3.5 mg/ml or 6 mg/ml. Similar levels of mannitol were used as control for hyperosmolarity. Cells were harvested at different time intervals for analysis of apoptosis and AChE protein expression. Apoptosis was detected by the cleavage of Poly ADP-ribose polymerase (PARP) using western blot, and by Terminal deoxynucleotidyl-transferase-mediated dUTP nick-end-labeling (TUNEL) assay. AChE protein expression and activity was detected by western blot and by the Karnovsky and Roots method, respectively. MissionTM shRNA for AChE was used to inhibit AChE protein expression. Treating Y79 cells with 3.5 mg/ml of glucose, but not with 3.5 mg/ml mannitol, induced apoptosis which was confirmed by TUNEL assay and by cleavage of PARP. A part of the signaling pathway accompanying the apoptotic process involved up-regulation of the AChE-R variant and an N-extended AChE variant as verified at the mRNA and protein level. Inhibition of AChE protein expression by shRNA protected Y79 cell from entering the apoptotic pathway. Our data suggest that expression of an N-extended AChE variant, most probably an R isoform, is involved in the apoptotic pathway caused by hyperglycemia in Y79 cells.
Introduction
Acetylcholinesterase (AChE) is an essential enzyme in cholinergic synapses since it hydrolyses acetylcholine, thereby terminating cholinergic excitation. However, AChE was also found in tissues devoid of cholinergic innervations (Small et al., 1996), indicating potential non-cholinergic functions for this enzyme including response to stress (Grisaru et al., 2001) and neurogenesis (Robitzki et al., 1998; Bytyqi et al., 2004). There are three different isoforms of AChE resulting from alternative splicing of a single gene: synaptic (S), erythrocytic (E), and read-through (R) (Soreq and Seidman, 2001). Each of these three C-terminal variants can appear in one of two forms depending upon the length of its N-terminus; a normal N-terminus and an extended one. Thus, in principal AChE can appear in six different isoforms. Different AChE variants are believed to be involved in different physiological and/or pathological processes. AChE-S is the variant located in cholinergic synapses and responsible for termination of cholinergic excitation (reviewed in Meshorer and Soreq, 2006). AChE-R was found to play a role in the response to stress in laboratory animals (Kaufer et al., 1998; Shohami et al., 2000). Forced swimming (physiological stress) induced AChE-R mRNA expression in FVB/N mice (Kaufer et al., 1998). 2′-O-methyl RNA-capped antisense oligonucleotide (AS-ODN) against AChE mRNA blocked over-expression of AChE-R in head-injured mice, reducing the number of dead CA3 hippocampal neurons and facilitating neurological recovery (Shohami et al., 2000). A novel AChE variant with an extended N-terminus was found to exacerbate light-induced photoreceptor degeneration in albino rats. Treatment with AS-ODNs significantly reduced the expression of this protein, and lowered the degree of light-induced functional damage as expressed by electroretinogram recordings (Kehat et al., 2007). AChE was found to be expressed during apoptosis in different cell types in which the apoptotic pathway could be prevented by AS-ODNs of AChE (Soreq et al., 1994; Zhang et al., 2002). It was later reported that the AChE variant involved in apoptosis was the N-extended AChE-S one (Toiber et al., 2008, 2009). There is evidence regarding the correlation between stress-activated protein kinase family and apoptosis-associated AChE expression. Phosphorylation of c-Jun N-terminal kinase (JNK) and its downstream transcription factor, c-Jun, was enhanced during apoptosis induced by the DNA topoisomerase inhibitors etoposide or excisanin A, in colon cancer cell line SW620. A corresponding increase in AChE expression in the apoptotic cells was observed. This up-regulation in AChE was eliminated by administering a JNK inhibitor, silencing JNK with siRNA or antagonizing c-Jun with a dominant-negative c-Jun mutant (Deng et al., 2006).
Apoptosis—programmed cell death, is an active process that has well-documented biochemical and morphological characteristics, including nuclei break into several pycnotic granules as a result of DNA fragmentation and cell shrinkage (Majno and Joris, 1995). In the retina, apoptosis plays a major role in the loss of visual cells in degenerative disorders such as Retinitis Pigmentosa and Age-Related Macular Degeneration (reviewed in Wenzel et al., 2005), and also occurs in Diabetic Detinopathy (Barber et al., 1998). Biochemical, physiological, and morphological alterations have been observed in non-vascular retinal cells (Barber et al., 1998; Li et al., 2002; Mohr et al., 2002; Kusner et al., 2004; Xi et al., 2005) during early stages of diabetes in animal models, raising the possibility that hyperglycemia is detrimental to retinal neurons prior to any vascular involvement. Rats with streptozotocin-induced-diabetes exhibited reduced electroretinogram responses as early as two weeks after the onset of the diabetes. The rats also expressed glial fibrilary acidic protein (GFAP) in Muller cells before any vascular abnormality was detected in the retina, a sign of early retinal damage (Li et al., 2002). Several studies have shown that Muller cells incubated in elevated glucose concentrations undergo apoptosis as determined in part by annexin-V staining and activation of caspase 3 (Lorenzi and Gerhardinger, 2001; Mohr et al., 2002; Kusner et al., 2004; Xi et al., 2005). Our goals were to test the hypothesis that AChE is involved in hyperglycemia-induced apoptosis of retinal cell line and to identify the AChE variant included in this process.
Materials and Methods
Cell Culture
Y79 (HTB18) retinoblastoma cell line was obtained from the American Type Culture Collection (ATCC, The global Bioresource Center, USA), and cultured in DMEM containing 10% fetal bovine serum (FBS), 4.5 mg/ml glucose, 1% glutamine, 1% penicillin, and streptomycin (HG-medium) at 37°C in a humidified atmosphere with 5% CO2/95% air. Culture medium was changed twice weekly. Twenty-four hours before experiments, the cells were transferred to a starvation medium containing 1 mg/ml glucose, mimicking physiologic levels of blood glucose concentrations and 1% FBS, 1% glutamine, 1% penicillin, and streptomycin (LG-medium). Then, glucose was added to the Y79 cells to reach a final concentration of 3.5 mg/ml or 6 mg/ml mimicking hyperglycemia (final concentrations in media: 3.5 mg/ml, 19.4 mM, 350 mg/dl and 6 mg/ml, 33.3 mM, 600 mg/dl, respectively). Identical mannitol concentrations were added to the media instead of glucose, to isolate the effect of hyperglycemia from hyperosmolarity.
Cells were harvested at different time points (1, 2, and 24 h after the addition of glucose/mannitol) and analyzed for apoptosis and AChE expression and activity. It is important to note that since serum is known to contain a complex mixture of growth factors, cytokines, and other signaling molecules that stimulate the expression of several genes like c-fos, c-myc, cyclin D1, and VEGF in cultured cells (Harris et al., 2001), it was important to reduce the percentage of the FBS to the minimum (1%) needed for the Y79 retinoblastoma cells to maintain the cells in a quiescent un-stimulated phase.
Detection of Apoptosis by Tunel
Apoptosis was detected by Terminal Deoxynucleotidyl-transferase-mediated dUTP nick-end-labeling (TUNEL) using the fluorescein-dUTP-in situ cell death detection kit (Roche Diagnostic GmbH, Mannheim, Germany). For TUNEL assay, cells were seeded on microscope cover glasses pre-coated with 0.1% poly-D-lysine [prepared in 100 mM Na2B4O7.10(H2O) buffer at pH 8.2], and cultured over-night in the HG-medium. After confirming attachment of cells to the cover slips, medium was changed to LG-medium for over-night starvation. Glucose was added to the starved cells at different concentrations and for different time periods, after which TUNEL was performed according to manufacturer's instructions. Briefly, cells were fixed in 4% paraformaldehyde for 1 h, and then washed in PBS. Cells were permeabilized in a solution containing 0.1% Triton X-100 in 0.1% sodium citrate on ice, washed twice with PBS and incubated with TUNEL reaction mixture for 60 min at 37°C in a humidified atmosphere in the dark. Slides were washed twice with PBS, stained with DAPI for nuclei detection, and washed again with PBS. The cover glasses with cells were flapped on glass slides covered with a few drops of mounting media (DakoCytomation), photographed using an upright fluorescence microscope (Axioscop 2, ZEISS), and processed by the Image Pro software.
Western Blot Analysis
Apoptosis was also detected by PARP cleavage from 116 kDa into 89 kDa fragments using western blot analysis. Since PARP is a nuclear protein, we decided to test its cleavage in nuclear extracts and not in whole-cell extracts to prevent dilution. Nuclear extracts were prepared and collected as described previously (Schreiber et al., 1989). Proteins were separated by 10% polyacrylamide gel electrophoresis and transferred onto a nitrocellulose membrane. Membranes were incubated in 5% non-fat dry milk in PBS for 1 h, and subsequently probed with a primary monoclonal antibody: anti-PARP (SeroTec, UK) that detects the full length as well as the cleaved PARP. HRP-conjugated Donkey-anti-mouse (Jackson ImmunoResearch Laboratories, Inc., USA) was used as secondary antibody. Bound antibodies were detected using enhanced chemiluminescence reagent-ECL (prepared locally) and visualized by autoradiography. AChE expression was also detected using western blot analysis. Cytoplasmic extracts were prepared (Schreiber et al., 1989), and separated on 12.5% polyacrylamide gel electrophoresis and transferred to a nitrocellulose membrane as described above. A rabbit anti-human polyclonal AChE antibody, which detects all isoforms of AChE, was used (sc-11409, diluted 1:500 from Santa Cruz Biotechnology, Inc., USA). A mouse monoclonal antibody anti-α-Tubulin (T6199, diluted 1:4000 from Sigma-aldrich, USA) was used for normalizing cytoplasmic protein loading. HRP-conjugated Donkey-anti-rabbit or anti mouse (1:5000 diluted in 50% glycerol, Jackson ImmunoResearch Laboratories, Inc., USA) was used as secondary antibody. Densitometry analysis was done by TotalLab Quant software.
AChE Activity
The method of AChE cytochemical staining is based on the ability of AChE to hydrolyze acetylthiocholine, which contains a sulfur atom substituted for oxygen in the ester linkage. Enzymatic cleavage of acetylthiocholine by AChE yields acetate and thiocholine, whose sulphydryl group reduces ferricyanide to ferrocyanide. Brown copper ferrocyanide (Hatchett's brown), is formed at the site of enzymatic activity and immediately precipitates thus marking the site of AChE activity. The procedure for detecting AChE activity was originally described by Karnovsky and Roots (Karnovsky and Roots, 1964), and modified by Hanker et al. (Hanker et al., 1973) and Kobayashi et al. (Kobayashi et al., 1994). Briefly, cells were seeded on microscope cover glasses while cultured in the DMEM culturing medium. Upon being dried at room temperature, the cells were fixed in 4% paraformaldehyde for 1 h, and then washed in PBS. The cover glasses were then covered with 1 ml per slide of a mixture containing: 65 mM sodium phosphate pH 6.0 containing 0.5 mg acetylthiocholine iodide, 5 mM sodium citrate solution, 10 mM copper sulphate solution, 0.5 mM potassium ferricyanide, 0.1 ml DDW, and 10−2 mM of Iso-OMPA (Tetra-isopropyl pyrophosphoramide for inhibition of Butyrylcholinesterase) at room temperature for overnight incubation. The cover glasses were flapped on glass slides covered with few drops of immuno-mount (Thermo scientific, USA). Cells preparations were viewed and photographed under light microscopy.
RNA Extraction and Real-Time RT-PCR
Total RNA was extracted by TRI-REAGENT™ (Sigma Aldrich, St. Louis, USA), according to Sigma's product information. RNA samples (0.2 μg) were used for cDNA synthesis prepared by the Verso™ cDNA Kit (Thermo SCIENTIFIC, UK). Real-time RT-PCR was performed using the Rotor-Gene Q (Qiagen, Corbett life science, Germany) and SYBR green master mix ABsolute™ Blue (Thermo SCIENTIFIC, UK). Different primer sequences for human AChE variants were used according to previous description; Primer sequences (listed below), for AChE-S, AChE-R, 18S rRNA (house-keeping reference transcript) (Berson et al., 2008) and for N-extended AChE (Ofek et al., 2007). Serial dilutions of samples served to evaluate primers efficiency and the appropriate cDNA concentration that yields linear changes. Annealing temperature was 60°C for all primers. Melting curve analysis verified the identity of end products.
PCR primers were employed as follows:
hAChE-S (Accession no NM000665);
(Forward primer position 1789-1807) – 5′-cttcctccccaaattgctc-3′
(Reverse primer position 1901-1920) – 5′-tcctgcttgctgtagtggtc-3′
hAChE-R (Accession no AY750146);
(Forward primer position 7092-7110) – 5′cttcctccccaaattgctc-3′
(Reverse primer position 7177-7196) – 5′-ggggagaagagaggggttac-3′
h N-extended-AChE (Accession no AY389977);
(Forward primer position 189-207) – 5′-atgctaggcctggtgatgt-3′
(Reverse primer position 285-303) – 5′-ggcagtggaaacttctgga-3′
h18S rRNA (Accession no M10098);
(Forward primer position 1049-1068) – 5′-cgccgctagaggtgaaattc-3′
(Reverse primer position 1092-1110) – 5′-ttggcaaatgctttcgctc-3′
Mission™ shRNA for AChE
shRNA packed in Lenti viral particles were prepared using Lenti compatible vectors; VSVG and delta-NRF which were kindly provided by Prof. Gera Neufeld (Faculty of Medicine, Technion), and five pLKO.1—puro vectors each cloned with a potential translational—blocker-complimentary sequence (21 bp long) to AChE exons (Sigma Aldrich, St. Louis, USA). Each pLKO.1 vector together with the two vectors mentioned above were co-transfected in 293-T cell line (using TransIT®-LT-1 Transfection reagent, Mirus Corporation, USA). Forty-eight hours post-transfection, medium containing viruses was collected and filtered through a 0.45 μm filter, and was used to infect Y79 cells for 48 h. Puromycin (2.5 μg/ml) was added to culture media for an additional 48 h for selecting positive-Lenti-infected-cells. Prior to the addition of 3.5 mg/ml glucose, infected-Y79 cells were serum starved under the same conditions as mentioned above. At different time intervals following exposure to glucose, cells were harvested for testing by Western Blot and TUNEL assays as mentioned above.
Statistics
Statistically significant differences were calculated by t-test (2 tails).
Results
Apoptosis Induction by Hyperglycemia
Keeping Y79 cells for 1 or 24 h in 1 mg/ml glucose (5.5 mM), mimicking physiologic conditions did not induce apoptosis (Figure 1A). Raising the level of glucose to 3.5 mg/ml (19.4 mM) or to 6 mg/ml (33.3 mM), for 1 h also did not result in apoptosis (Figure 1A). However, after 24 h in high glucose (3.5 mg/ml or 6 mg/ml—mimicking hyperglycemia in diabetes), apoptosis was stimulated as evident by abundance of TUNEL positive cells (Figure 1A).
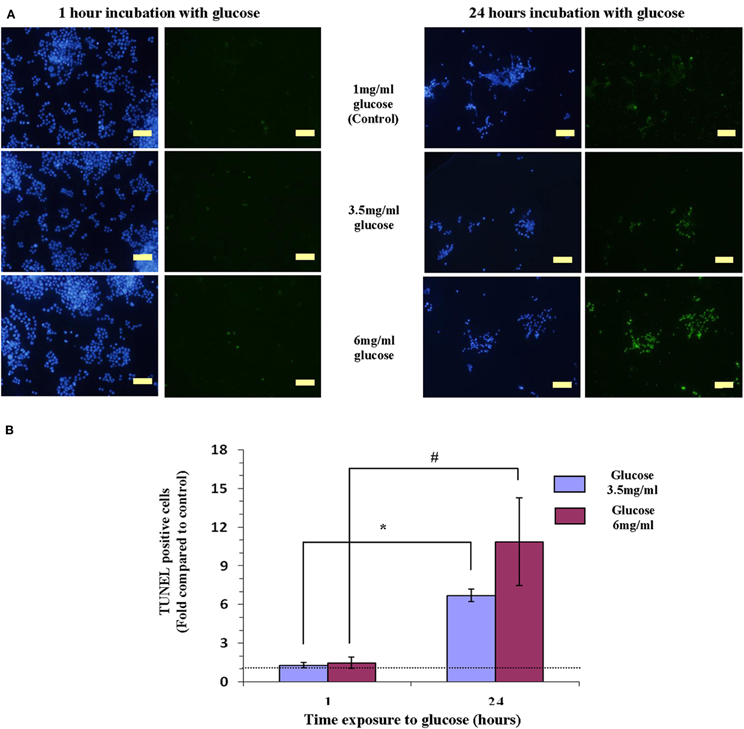
Figure 1. Hyperglicemia (3.5 mg/ml or 6 mg/ml of glucose)-induced apoptosis induction in Y79 cells. (A) Cells tested by TUNEL to detect apoptosis (green) and stained with DAPI for detecting nuclei (blue). Y79 cells were pre-treated for 16–24 h in starvation medium (1% FBS and 1 mg/ml glucose), and then incubated for 1 h with 3.5 mg/ml glucose did not show signs of apoptosis (left); while cells incubated for 24 h in 3.5 mg/ml or 6 mg/ml glucose are TUNEL positive. Scale bar is 50 μm. (B) TUNEL positive cells were counted and calculated as fold of control (cells cultured in starvation media containing 1% FBS and 1 mg/ml glucose) and plotted in histograms. Values are means ± SEM, (N = 3). *p < 0.05, #p = 0.05.
Counting TUNEL positive cells, indicated that incubating cells in 3.5 mg/ml or 6 mg/ml glucose for 24 h increased apoptosis significantly (p = 0.05), by 7- and 10-fold, respectively, as compared to cells exposed to the same concentrations of glucose for 1 h (Figure 1B).
Full-length PARP is an 116 kDa nuclear protein involved in the repair of DNA, in differentiation and in chromatin structure formation. During apoptosis this protein is cleaved by caspase-3, and possibly by other caspases, into an 89 kDa fragment (Lazebnik et al., 1994). Thus, demonstration of PARP cleavage is accepted as a molecular indicator for the induction of an apoptotic process. Since cleavage of PARP is an early stage (between 1 and 3 h) in apoptosis, we used western blot to measure its cleavage in nuclear extracts of cells prepared after 1 h incubation in different glycemic conditions as shown in Figure 2A. PARP cleavage was induced in cells exposed to 3.5 mg/ml or 6 mg/ml of glucose for 1 h, as compared to 1 mg/ml of glucose. To test a possible osmotic effect induced by hyperglycemia and leading to apoptosis, identical mannitol concentrations were added to starved-Y79 cells and PARP cleavage was examined after 1 h. We assessed quantitatively the magnitude of PARP cleavage and its significance from the cleaved/non-cleaved PARP ratio, as suggested by others (Biggs et al., 2001; Grader-Beck et al., 2007). We scanned the western blots and calculate the ratio of cleaved/non-cleaved PARP as shown in Figure 2B. PARP cleavage was similar in cells treated with 6 mg/ml of glucose or mannitol, but was more prominent, and statistically significant (p < 0.05), in cells treated with 3.5 mg/ml of glucose which showed 2.2 ± 0.16-fold of control, as compared to the same concentration of mannitol which showed 1.3 ± 0.22-fold of control. These results indicate that hyperglycemia caused by 6 mg/ml of glucose, induced apoptosis primarily as a result of hyperosmolarity, while at a lower concentration of 3.5 mg/ml of glucose, apoptosis was induced mainly as a result of hyperglycemia and to a lesser extent by hyperosmolarity.
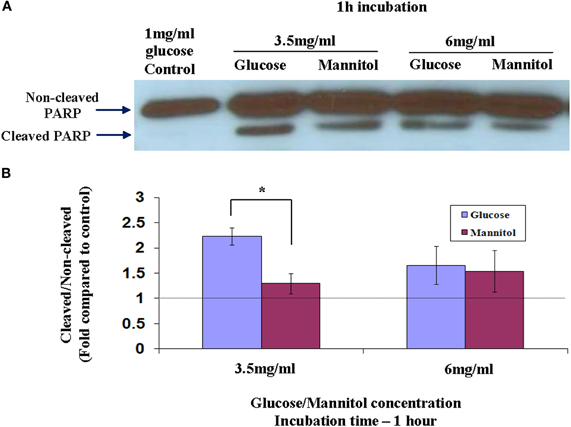
Figure 2. Cleavage of PARP in nuclear extracts of Y79 cells treated by adding glucose or mannitol. Y79 cells were incubated for 16–24 h in starvation medium (1% FBS and 1 mg/ml glucose), and then glucose or mannitol was added (except in control) to reach a concentration of 3.5 mg/ml or 6 mg/ml and incubated for 1 or 2 h. (A) Nuclear extracts were prepared and run on SDS-PAGE, blotted, and probed with anti-PARP as described under Materials and Methods. (B) Three independent experiments were conducted and densitometry values were calculated for cleaved to non-cleaved ratios, and plotted in histograms as fold of control (cells cultured in starvation media containing 1% FBS and 1 mg/ml glucose). Values are means ± SEM, (N = 3). *p < 0.05.
AChE Expression Induced by Hyperglycemia
Figure 3 shows western blot analysis for AChE expression in Y79 cells following 1 h or 2 h incubation in different media. AChE expression was increased in Y79 cells treated with 3.5 mg/ml glucose (G) for 1 h and decreased after 2 h to control levels. AChE expression was not increased in cells treated with 6 mg/ml glucose or in cells treated with either 3.5 mg/ml or 6 mg/ml mannitol (M). The dispersed bands seen in Figure 3 in the range of 50–75 kDa probably reflect the formation of covalent PRiMA-AChE complexes or differences in the degree of glycosylation of AChE subunits (Darreh-Shori et al., 2004).
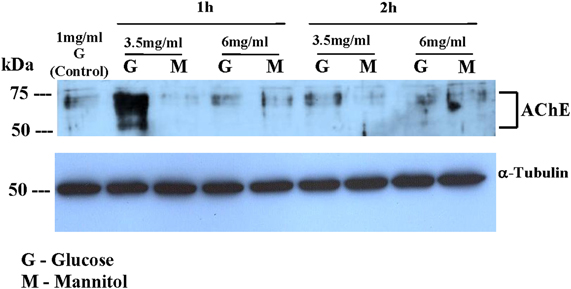
Figure 3. AChE expression in Y79 cells treated by adding glucose or mannitol. Y79 cells were treated first for 16–24 h in starvation medium (1% FBS and 1 mg/ml glucose), and then incubated with 3.5 mg/ml or 6 mg/ml of glucose or mannitol for 1 or 2 h. Following 1 or 2 h incubation cytoplasmic extracts were prepared and run on SDS-PAGE, blotted, and probed with anti- AChE or anti-α-Tubulin (for loading control) as described under Materials and Methods. The western blot shown is one of two independent experiments.
To test whether the hyperglycemia-induced expression of AChE is also accompanied by increased AChE activity, we tested AChE activity in Y79 cells exposed to glucose concentrations that induced apoptosis. AChE activity, as demonstrated by Karnovsky and Roots staining (Karnovsky and Roots, 1964) (Figure 4A), was calculated relative to control conditions (1 mg/ml glucose), and was found to increase by 7.0 ± 1.9-fold in cells treated with 3.5 mg/ml glucose for 1 h. In agreement with AChE expression pattern, AChE activity decreased with time after exposure to high glucose (3.5 mg/ml) and after 24 h was only 1.3 ± 0.34-fold relative to control (Figure 4B). This decrease within 24 h was statistically significant (p < 0.05). AChE activity in cells exposed to 3.5 mg/ml glucose for 1 h was significantly (p < 0.05) higher compared to cells exposed for the same time period to 6 mg/ml glucose. AChE activity was not increased in cells treated with 6 mg/ml glucose for the same time intervals (Figure 4B).
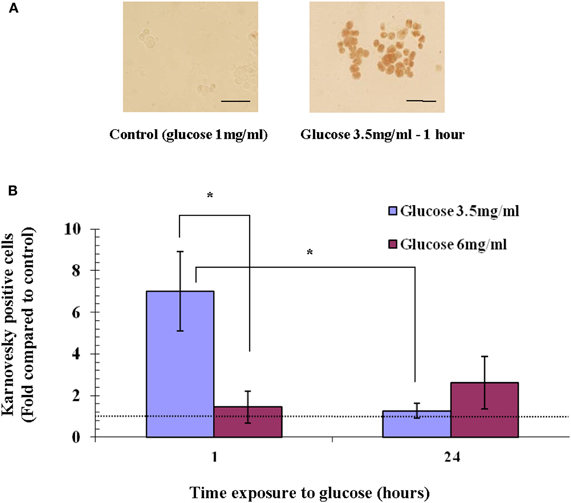
Figure 4. AChE activity in Y79 cells treated with glucose. Y79 cells were pre-treated for 16–24 h in starvation medium (1% FBS and 1 mg/ml of glucose), and then with 3.5 mg/ml or 6 mg/ml glucose for 1 h or 24 h, after which Karnovsky and Roots assay was performed. Positive Karnovsky and Roots staining is seen in (A) on the right side compared to the negative control at the left. Scale bar is 50 μm. (B) Three independent experiments at which about 20 fields of cells (from each experiment) were counted for each treatment, calculated, and plotted as fold of control (cells cultured in starvation media containing 1% FBS and 1 mg/ml glucose) in histograms. Values are mean ± SEM, (N = 3). *p < 0.05.
Since AChE was detected in the cytoplasmic (Figure 3) fraction, and in part of the experiments also in the membranous fraction (data not shown), we hypothesized that the isoforms detected by the western blot assays might be the short cytoplasmic R monomeric soluble isoform, and the membranous one might be the longer N-extended AChE (R or S variants) and/or the AChE-S variant. To test this hypothesis, Reverse Transcription (RT) real-time PCR was performed. As seen in Figure 5, mRNA expression levels corresponding to the AChE-S isoform were low and did not change significantly after 15-, 30- or 60- min incubation with 3.5 mg/ml of glucose. However, mRNA expression transcripts tested for the AChE-R or the N-extended isoforms, were significantly (p < 0.05) up-regulated by 1.5 ± 0.15 and by 1.4 ± 0.14-fold respectively, compared to control Y79 cells.
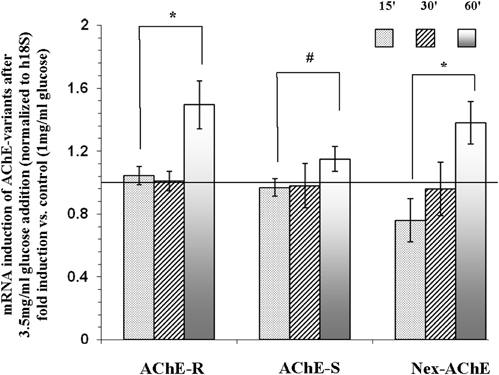
Figure 5. mRNA expression of N-extended AChE, AChE-S, and AChE-R isoforms following treatment of Y79 cells with glucose for 1 h. Y79 cells were pre-treated for 16–24 h in starvation medium (1% FBS and 1 mg/ml of glucose) and then with 3.5 mg/ml glucose for different time intervals. Total RNA was extracted and cDNA was prepared for real-time PCR procedure as described under Materials and Methods. Results are presented as fold of control cells cultured in starvation media. Values are means ± SEM, (N = 4). *p < 0.05, #p = 0.12.
AChE Expression and Apoptosis
In order to examine whether AChE expression plays a role in the hyperglycemia-induced apoptosis of Y79 cells, we tested five AChE shRNA sequences each cloned in pLKO.1- Lenti compatible vector (Sigma-Aldrich, St. Louis, USA). An empty pLKO.1 vector (Sigma-Aldrich, St. Louis, USA), devoid of a relevant shRNA sequence was used as control. As shown in Figure 6A, the expression of AChE tested under glucose exposure in the presence of the first sequences sh-1 (lane 3), was high and similar to that expressed in the presence of the sh-control-sequence (lane 2). The expression of AChE in these samples was considerably higher compared to sh-control Lenti-infected Y79 cells, which remained under 1 mg/ml glucose (lane1). These data indicate that sh-1 was not an efficient sequence for blocking AChE translation.
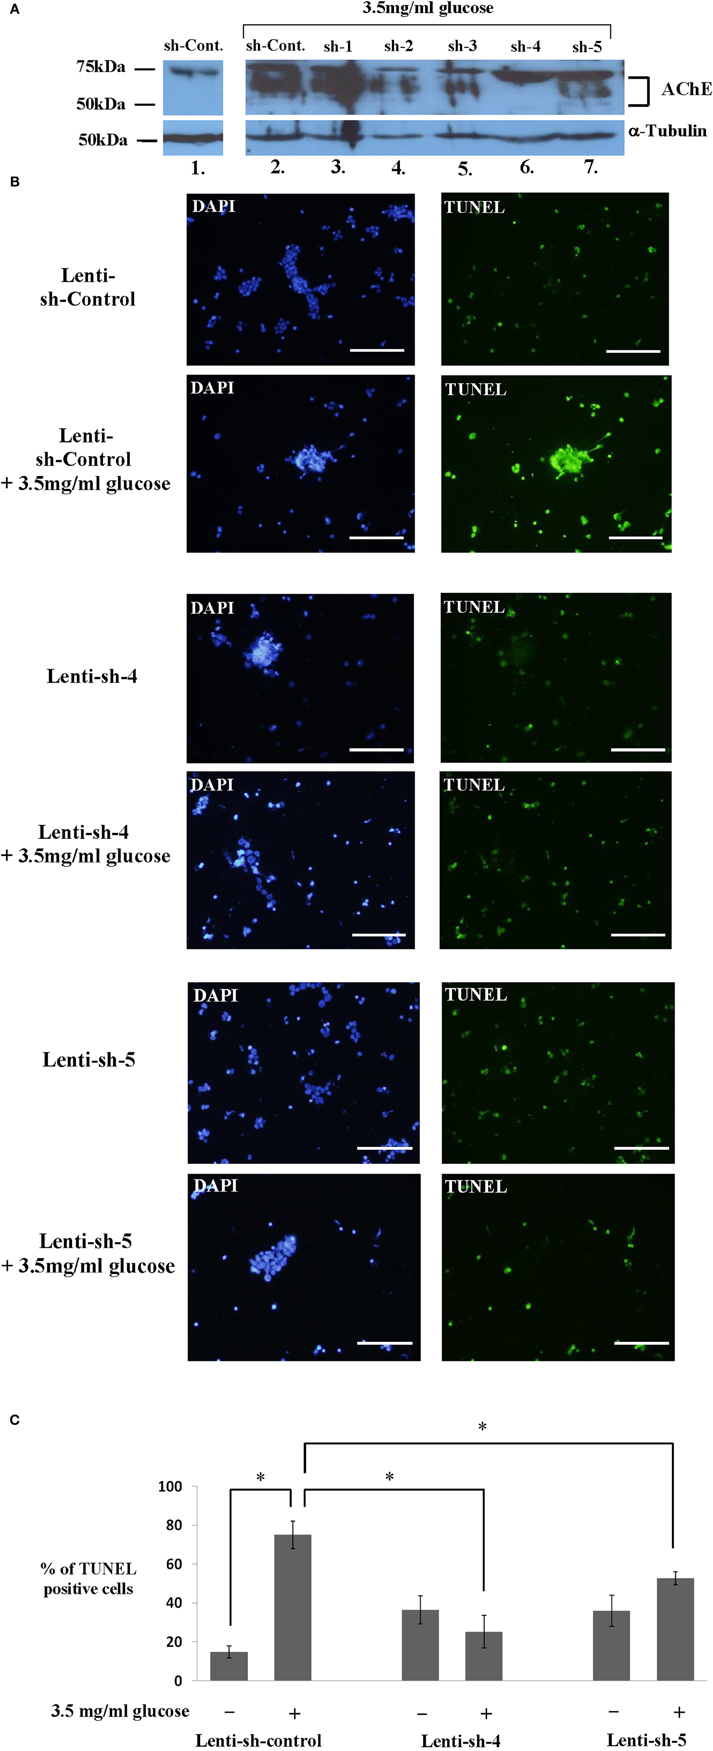
Figure 6. Inhibiting AChE protein expression by different sh-RNA sequences reduces apoptosis in Y79 cells treated with glucose. (A) Y79 sh-RNA lenti-infected and selected cells (as described under Materials and Methods), were pre-treated in starvation medium containing 1% FBS and 1 mg/ml of glucose for 16–24 h and then treated with 3.5 mg/ml glucose for 1 h except for sh-control in lane 1. Cytoplasmic extracts were prepared and run for western blot analysis to detect AChE expression or anti α-Tubulin (for loading control) as described under Materials and Methods. The sample in lane 1 and those in 2–7 were run in separate lanes on the same gels. The western blot shown is one of two independent experiments. (B) Y79 sh-RNA lenti-infected and selected cells (as described under Materials and Methods), were pre-treated in starvation medium as described in A and then assayed by TUNEL (green) to detect apoptosis after 24 h in 3.5 mg/ml glucose. Nuclei were stained with DAPI (blue). Cells were photographed under an upright fluorescence microscope (Zeiss). Scale bar is 100 μm. (C) TUNEL positive Y79 sh-RNA lenti-infected and selected cells were counted and calculated as fold of control cells incubated under starvation medium, and plotted in histograms. Values are means ± SEM, (N = 3). *p < 0.05.
A partial inhibition of AChE protein expression was observed with sh-2, sh-3, and sh-5 (lanes 4, 5, and 7, respectively), as indicated by the weaker band of AChE protein. The most efficient blockage of translation was found with sh-4 (lane 6) in which the AChE band is barely visible. Equal loading of total protein is confirmed by the α-Tubulin band, shown in Figure 6A.
We chose Y79 cells, expressing either AChE mRNA sh-4 or AChE mRNA sh-5 to test the effectiveness of sh-4 and sh-5 in blocking hyperglycemia-induced apoptosis. Starved Lenti-infected Y79 cells with sh-4, sh-5, or sh-control were incubated for 24 h in 3.5 mg/ml or left in 1 mg/ml glucose media and TUNEL assay was performed. Figure 6B shows representative pictures of cells undergoing TUNEL assay, and Figure 6C shows the fraction (percentage) of TUNEL positive cells of total number of cells. Y79 cells expressing sh-control underwent a significant apoptotic effect 24 h after incubation in 3.5 mg/ml glucose (Figure 6B, 2nd row), compared to sh-control Lenti-infected Y79 cells which remained under 1 mg/ml glucose (Figure 6B, 1st row); 75 ± 7.1% and 14.9 ± 3.0%, respectively (p < 0.05) (Figure 6C). A significant (p < 0.05) inhibition of apoptosis was seen in sh-4 Lenti-infected Y79 cells following 24 h incubation in 3.5 mg/ml of glucose addition (Figure 6B, 4th row), compared to sh-control Lenti-infected Y79 treated under the same conditions (Figure 6B, 2nd row), 25.2 ± 8.4% and 75 ± 7.1%, respectively (Figure 6C). No significant induction of apoptosis was seen between sh-4 Lenti-infected Y79 cells incubated under 3.5 mg/ml glucose (Figure 6B, 4th row), and sh-4 Lenti infected Y79 cells, which remained under 1 mg/ml glucose (Figure 6B, 3rd row), 25.2 ± 8.4% and 36.5 ± 7.2%, respectively (Figure 6C). sh-5 was also effective in blocking hyperglycemia-induced apoptosis. The fraction of TUNEL positive cells was significantly (p < 0.05) reduced by sh-5 in Y79 cells incubated for 24 h in 3.5 mg/ml glucose (Figure 6B, 6th row) compared to sh-control cells incubated under the same conditions (Figure 6B, 2nd row); 52.8 ± 3.4% and 75 ± 7.1%, respectively (Figure 6C). No significant differences were found in the fraction of TUNEL positive cells between sh-5 Lenti-infected Y79 cells incubated in 3.5 mg/ml glucose for 24 h (Figure 6B, 6th row), compared to sh-5 Lenti-infected Y79 cells which remained under 1 mg/ml glucose (Figure 6B, 5th row), 52.8 ± 3.4% and 36 ± 8%, respectively (Figure 6C).
The TUNEL results were strengthened by measurements of PARP cleavage in nuclear extracts of the sh-Lenti infected lines; sh-control, sh-4, and sh-5. The western blot shown in Figure 7A and the densitometry results plotted in Figure 7B, show that PARP was cleaved by almost 3-fold in sh-control Lenti infected Y79 cells following 1 h incubation in 3.5 mg/ml glucose compared to cells remaining in 1 mg/ml glucose. In contrast, cleavage of PARP could not be detected in the sh-4 and sh-5 Lenti-infected Y79 cells, where AChE translation was blocked. The TUNEL and PARP results and the AChE protein expression data seen in Figures 6 and 7, suggest that inhibition of AChE protein expression prevents Y79 cells from entering into the apoptotic cascade.
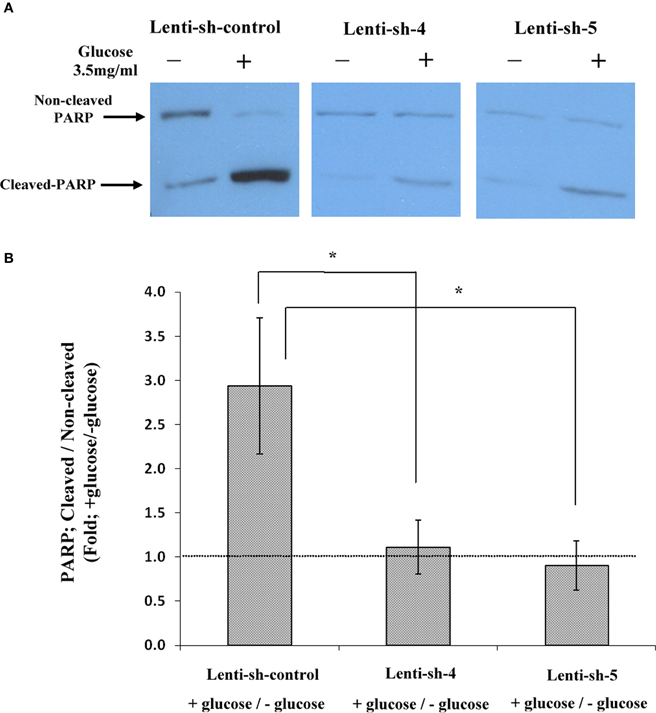
Figure 7. Cleavage of PARP in nuclear extracts of sh-RNA lenti-infected Y79 cells treated by adding glucose. Nuclear extracts were prepared from starved Y79 sh-RNA lenti-infected and selected cells, after raising glucose concentration to 3.5 mg/ml glucose for 1 h or keeping the cells in control (1 mg/ml glucose) conditions (–). Extracts were run on SDS-PAGE, blotted and probed with anti- PARP as described under Materials and Methods. Five independent western experiments were conducted; one is shown in (A). Densitometry values were calculated for cleaved to non-cleaved ratios, and then calculated as fold of cells incubated under starvation medium (containing 1% FBS and 1 mg/ml glucose) and plotted in histograms as shown in (B). Values are mean ± SEM, (N = 5). *p = 0.05.
Discussion
Apoptosis is an essential process during development and differentiation, and following exposure to damaging insults. It removes unwanted cells, which may be injured or misplaced, thus preventing the spread of pathological processes from injured cells to healthy ones. This naturally occurring cell death is prominent in neurons of CNS including the retina during development (Young, 1984; Rodier, 1995). Apoptosis also occurs in the adult CNS tissue subjected to a variety of stressful events such as pathological changes observed in both Alzheimer's disease and other neurodegenerative disorders in brain (Sasaki et al., 1998). In the adult retina, apoptosis is observed after subjecting it to photic stress (Hafezi et al., 1999; Grimm et al., 2001), or to metabolic stress such as hyperglycemia (Barber et al., 1998; Mohr et al., 2002; Kusner et al., 2004; Xi et al., 2005).
Here, apoptosis was induced in a retinal Y79 cell line by exposure to hyperglycemia, and was assessed by PARP cleavage as a molecular indication for apoptosis process (Figure 2), and by positive TUNEL staining as indication of apoptotic cells (Figure 1). Part of this effect could be attributed to hyperosmolarity, as tested by comparing the effects of adding glucose to those induced by adding mannitol, but exposure to 3.5 mg/ml glucose induced apoptosis mainly by hyperglycemia (Figure 2). These results are comparable to previous findings in different cell types such as endothelial cells (McGinn et al., 2003), pericytes (Naruse et al., 2000), myocytes (Shizukuda et al., 2002), and neuronal cells (Lelkes et al., 2001), undergoing apoptosis when exposed to glucose, but not to mannitol until a specific osmolarity level was reached (0.33–0.8%), depending on the cell type.
It should be noted that 6 mg/ml glucose induced a lesser degree of apoptosis compared to 3.5 mg/ml glucose, as indicated by PARP cleavage (Figure 2), but not by TUNEL (Figure 1). This suggests different pathways for hyperglycemia-induced apoptosis compared to hyperosmolarity-induced apoptosis. Indeed, different mechanisms for apoptosis induction by hyperglycemia and hyperosmolarity were described (Igarashi et al., 1999), showing that glucose concentrations in the range 11–16.5 mM (2–3 mg/ml, respectively), could activate p38 kinase associated with apoptosis, via a PKC-delta isoform-dependent pathway, while higher glucose or mannitol concentrations activated p38 kinase by hyperosmolarity via a PKC-independent pathway (Igarashi et al., 1999).
Although the molecular mechanisms underlying apoptosis have been extensively studied, these mechanisms and the interactions between the proteins which are involved seem to be very complex and much remains to be elucidated. Increasing body of evidence has shown that AChE may be involved in apoptosis (Zhang et al., 2002; Jin et al., 2004; Deng et al., 2006; Toiber et al., 2008). Under control conditions, AChE expression (Figure 3) and activity (Figure 4) in Y79 cells is very low, probably reflecting de-differentiation of this retinoblastoma-derived cell line. However, when Y79 cells were treated with 3.5 mg/ml glucose for an hour, AChE expression and activity (Figures 3 and 4, respectively) were significantly increased compared to control. AChE expression decreased almost back to the control level, when tested 2 h after exposure to 3.5 mg/ml glucose (Figure 3), reminiscent of an immediate early gene mRNA and protein expression (Kaufer et al., 1998). AChE expression was not increased in cells treated with 6 mg/ml glucose or in cells treated with mannitol although Y79 cells exposed to these conditions were shown to undergo apoptosis, probably as a result of hyperosmolarity (Figures 2, 3). This may indicate that AChE induction is involved in apoptosis induced by selective stress types, e.g., hyperglycemia but not by hyperosmolarity. These results shown involvement of AChE-stress-induced apoptosis, agree with multiple previous reports demonstrating stress-induced expression of AChE following a variety of stress episodes to the central nervous system, e.g., forced swimming (Kaufer et al., 1998), head trauma (Shohami et al., 2000), and photic stress to the retina (Kehat et al., 2007). The findings that apoptosis and AChE were induced by hyperglycemia can reflect two unrelated pathways linked by a common trigger or can reflect a single pathway in which AChE expression leads to apoptosis. To differentiate between these possibilities we blocked AChE expression with shRNA. We found that preventing AChE expression using shRNA was accompanied by prevention of apoptosis (Figures 6 and 7), thus supporting the hypothesis that AChE is involved in the apoptosis induced by hyperglycemia in Y79 cells.
Our RT-PCR studies indicated that hyperglycemia-induced the expression of an N-extended AChE variant and an AChE-R variant (Figure 5). The trivial conclusion is that hyperglycemia (3.5 mg/ml glucose) induced the expression of an N-extended AChE-R variant and of an AChE-R variant with regular N-terminus. The former is found in the membrane fraction and the latter in the cytoplasm fraction. This conclusion is contrary to recent findings suggesting that the N-extended AChE-S is the detrimental variant causing apoptosis (Toiber et al., 2008, 2009). These differences may be related to the type of stress and/or to the stressed tissue, but the common feature of the two variants, the N-extended terminus, probably includes elements that are involved in cellular apoptosis. This is supported by a previous retinal study demonstrating that photic stress induced the expression of an N-extended AChE variant that was involved in cell apoptosis, but its specific C-terminus type could not be identified at the protein level (Kehat et al., 2007). In the same study, in-situ hybridization showed up-regulation of AChE-R mRNA (Kehat et al., 2007). It should be noted that our findings cannot rule-out that hyperglycemia induced the expression of a low-level of N-extended AChE-S that was sufficient to cause apoptosis, but was not detected by the RT-PCR experiments. A potential mechanism for the role of AChE in the induction of apoptosis was suggested recently emphasizing the role of the extended N-terminus (Toiber et al., 2008, 2009). According this suggestion, the extended N-terminus protrudes into the cytoplasm, while the core domain is exposed to the extracellular compartment (Toiber et al., 2008). Several proteins, known to be involved in the apoptotic signaling cascade, i.e., GSK3, GAK (cyclin G associated kinase), JAB1/CSN5, integrin, and Fas (TNF receptor super-family, member 6), were found to interact with the extended N-terminus of AChE-S (Toiber et al., 2009), thus probably linking this AChE variant to apoptosis. It should be stressed that this hypothesis emphasizes the role of the extended N-terminus in apoptosis and not of the C-terminus. Therefore, it is possible that, depending upon the studied cells, the N-extended AChE-R or the N-extended AChE-S can equally play a role in inducing cell apoptosis. Therefore, the protein partners, mentioned above, would be very interesting to test in our in vitro system. Our in vitro findings on retinoblastoma cell line are consistent with the hypothesis that AChE expression pattern in the mammalian retina is altered by hyperglycemia in a manner affecting its roles. A previous study reported a reduction in AChE catalytic activity in the diabetic rat retina probably due to loss of the hydrophobic variant of AChE (Sanchez-Chavez and Salceda, 2001). Here we showed, in a retinoblastoma cell line, that hyperglycemia altered the expression pattern of AChE causing up-regulation of the AChE-R and the extended N-terminus AChE variants. The latter variant is the prime candidate to induce the observed cell apoptosis, reminiscent of retinal cells' apoptosis that was observed during early stages of diabetes (Barber et al., 1998), before any vascular alteration. These findings need to be expanded to identify with certainty the AChE variant involved in hyperglycemia-induced apoptosis, and to test this effect in vivo, in experimental diabetic models, before new therapeutic approaches can be suggested.
Conflict of Interest Statement
The authors declare that the research was conducted in the absence of any commercial or financial relationships that could be construed as a potential conflict of interest.
Acknowledgments
The authors wish to thank Ms. Irit Mann for her excellent technical assistance. This research was partially supported by the Technion V.P.R fund—The Macular Degeneration Research Fund.
References
Barber, A. J., Lieth, E., Khin, S. A., Antonetti, D. A., Buchanan, A. G., and Gardner, T. W. (1998). Neural apoptosis in the retina during experimental and human diabetes. Early onset and effect of insulin. J. Clin. Invest. 102, 783–791.
Berson, A., Knobloch, M., Hanan, M., Diamant, S., Sharoni, M., Schuppli, D., Geyer, B. C., Ravid, R., Mor, T. S., Nitsch, R. M., and Soreq, H. (2008). Changes in readthrough acetylcholinesterase expression modulate amyloid-beta pathology. Brain 131(Pt 1), 109–119.
Biggs, J. R., Yang, J., Gullberg, U., Muchardt, C., Yaniv, M., and Kraft, A. S. (2001). The human brm protein is cleaved during apoptosis: the role of cathepsin G. Proc. Natl. Acad. Sci. U.S.A. 98, 3814–3819.
Bytyqi, A. H., Lockridge, O., Duysen, E., Wang, Y., Wolfrum, U., and Layer, P. G. (2004). Impaired formation of the inner retina in an AChE knockout mouse results in degeneration of all photoreceptors. Eur. J. Neurosci. 20, 2953–2962.
Darreh-Shori, T., Hellstrom-Lindahl, E., Flores-Flores, C., Guan, Z. Z., Soreq, H., and Nordberg, A. (2004). Long-lasting acetylcholinesterase splice variations in anticholinesterase-treated Alzheimer's disease patients. J. Neurochem. 88, 1102–1113.
Deng, R., Li, W., Guan, Z., Zhou, J. M., Wang, Y., Mei, Y. P., Li, M. T., Feng, G. K., Huang, W., Liu, Z. C., Han, Y., Zeng, Y. X., and Zhu, X. F. (2006). Acetylcholinesterase expression mediated by c-Jun-NH2-terminal kinase pathway during anticancer drug-induced apoptosis. Oncogene 25, 7070–7077.
Grader-Beck, T., Casciola-Rosen, L., Lang, T. J., Puliaev, R., Rosen, A., and Via, C. S. (2007). Apoptotic splenocytes drive the autoimmune response to poly(ADP-ribose) polymerase 1 in a murine model of lupus. J. Immunol. 178, 95–102.
Grimm, C., Wenzel, A., Behrens, A., Hafezi, F., Wagner, E. F., and Reme, C. E. (2001). AP-1 mediated retinal photoreceptor apoptosis is independent of N-terminal phosphorylation of c-Jun. Cell Death Differ. 8, 859–867.
Grisaru, D., Deutsch, V., Shapira, M., Pick, M., Sternfeld, M., Melamed-Book, N., Kaufer, D., Galyam, N., Gait, M. J., Owen, D., Lessing, J. B., Eldor, A., and Soreq, H. (2001). ARP, a peptide derived from the stress-associated acetylcholinesterase variant, has hematopoietic growth promoting activities. Mol. Med. 7, 93–105.
Hafezi, F., Marti, A., Grimm, C., Wenzel, A., and Reme, C. E. (1999). Differential DNA binding activities of the transcription factors AP-1 and Oct-1 during light-induced apoptosis of photoreceptors. Vision Res. 39, 2511–2518.
Hanker, J. S., Thornburg, L. P., Yates, P. E., and Moore, H. G. 3rd. (1973). The demonstration of cholinesterases by the formation of osmium blacks at the sites of Hatchett's brown. Histochemie 37, 223–242.
Harris, V. K., Kagan, B. L., Ray, R., Coticchia, C. M., Liaudet-Coopman, E. D., Wellstein, A., and Tate Riegel, A. (2001). Serum induction of the fibroblast growth factor-binding protein (FGF-BP) is mediated through ERK and p38 MAP kinase activation and C/EBP-regulated transcription. Oncogene 20, 1730–1738.
Igarashi, M., Wakasaki, H., Takahara, N., Ishii, H., Jiang, Z. Y., Yamauchi, T., Kuboki, K., Meier, M., Rhodes, C. J., and King, G. L. (1999). Glucose or diabetes activates p38 mitogen-activated protein kinase via different pathways. J. Clin. Invest. 103, 185–195.
Jin, Q. H., He, H. Y., Shi, Y. F., Lu, H., and Zhang, X. J. (2004). Overexpression of acetylcholinesterase inhibited cell proliferation and promoted apoptosis in NRK cells. Acta Pharmacol. Sin. 25, 1013–1021.
Karnovsky, M. J., and Roots, L. (1964). A direct-coloring thiocholine method for cholinesterases. J. Histochem. Cytochem. 12, 219–221.
Kaufer, D., Friedman, A., Seidman, S., and Soreq, H. (1998). Acute stress facilitates long-lasting changes in cholinergic gene expression. Nature 393, 373–377.
Kehat, R., Zemel, E., Cuenca, N., Evron, T., Toiber, D., Loewenstein, A., Soreq, H., and Perlman, I. (2007). A novel isoform of acetylcholinesterase exacerbates photoreceptors death after photic stress. Invest. Ophthalmol. Vis. Sci. 48, 1290–1297.
Kobayashi, H., O'Briain, D. S., Hirakawa, H., Wang, Y., and Puri, P. (1994). A rapid technique of acetylcholinesterase staining. Arch. Pathol. Lab. Med. 118, 1127–1129.
Kusner, L. L., Sarthy, V. P., and Mohr, S. (2004). Nuclear translocation of glyceraldehyde-3-phosphate dehydrogenase: a role in high glucose-induced apoptosis in retinal Muller cells. Invest. Ophthalmol. Vis. Sci. 45, 1553–1561.
Lazebnik, Y. A., Kaufmann, S. H., Desnoyers, S., Poirier, G. G., and Earnshaw, W. C. (1994). Cleavage of poly(ADP-ribose) polymerase by a proteinase with properties like ICE. Nature 371, 346–347.
Lelkes, E., Unsworth, B. R., and Lelkes, P. I. (2001). Reactive oxygen species, apoptosis and altered NGF-induced signaling in PC12 pheochromocytoma cells cultured in elevated glucose: an in vitro cellular model for diabetic neuropathy. Neurotox. Res. 3, 189–203.
Li, Q., Zemel, E., Miller, B., and Perlman, I. (2002). Early retinal damage in experimental diabetes: electroretinographical and morphological observations. Exp. Eye Res. 74, 615–625.
Lorenzi, M., and Gerhardinger, C. (2001). Early cellular and molecular changes induced by diabetes in the retina. Diabetologia 44, 791–804.
Majno, G., and Joris, I. (1995). Apoptosis, oncosis, and necrosis. An overview of cell death. Am. J. Pathol. 146, 3–15.
McGinn, S., Poronnik, P., King, M., Gallery, E. D., and Pollock, C. A. (2003). High glucose and endothelial cell growth: novel effects independent of autocrine TGF-beta 1 and hyperosmolarity. Am. J. Physiol. Cell Physiol. 284, C1374–C1386.
Meshorer, E., and Soreq, H. (2006). Virtues and woes of AChE alternative splicing in stress-related neuropathologies. Trends Neurosci. 29, 216–224.
Mohr, S., Xi, X., Tang, J., and Kern, T. S. (2002). Caspase activation in retinas of diabetic and galactosemic mice and diabetic patients. Diabetes 51, 1172–1179.
Naruse, K., Nakamura, J., Hamada, Y., Nakayama, M., Chaya, S., Komori, T., Kato, K., Kasuya, Y., Miwa, K., and Hotta, N. (2000). Aldose reductase inhibition prevents glucose-induced apoptosis in cultured bovine retinal microvascular pericytes. Exp. Eye Res. 71, 309–315.
Ofek, K., Krabbe, K. S., Evron, T., Debecco, M., Nielsen, A. R., Brunnsgaad, H., Yirmiya, R., Soreq, H., and Pedersen, B. K. (2007). Cholinergic status modulations in human volunteers under acute inflammation. J. Mol. Med. (Berl.) 85, 1239–1251.
Robitzki, A., Mack, A., Hoppe, U., Chatonnet, A., and Layer, P. G. (1998). Butyrylcholinesterase antisense transfection increases apoptosis in differentiating retinal reaggregates of the chick embryo. J. Neurochem. 71, 413–420.
Rodier, P. M. (1995). Developing brain as a target of toxicity. Environ. Health Perspect. 103(Suppl. 6), 73–76.
Sanchez-Chavez, G., and Salceda, R. (2001). Acetyl- and butyrylcholinesterase in normal and diabetic rat retina. Neurochem. Res. 26, 153–159.
Sasaki, N., Fukatsu, R., Tsuzuki, K., Hayashi, Y., Yoshida, T., Fujii, N., Koike, T., Wakayama, I., Yanagihara, R., Garruto, R., Amano, N., and Makita, Z. (1998). Advanced glycation end products in Alzheimer's disease and other neurodegenerative diseases. Am. J. Pathol. 153, 1149–1155.
Schreiber, E., Matthias, P., Muller, M. M., and Schaffner, W. (1989). Rapid detection of octamer binding proteins with ‘mini-extracts’, prepared from a small number of cells. Nucleic Acids Res. 17, 6419.
Shizukuda, Y., Reyland, M. E., and Buttrick, P. M. (2002). Protein kinase C-delta modulates apoptosis induced by hyperglycemia in adult ventricular myocytes. Am. J. Physiol. Heart Circ. Physiol. 282, H1625–H1634.
Shohami, E., Kaufer, D., Chen, Y., Seidman, S., Cohen, O., Ginzberg, D., Melamed-Book, N., Yirmiya, R., and Soreq, H. (2000). Antisense prevention of neuronal damages following head injury in mice. J. Mol. Med. (Berl.) 78, 228–236.
Small, D. H., Michaelson, S., and Sberna, G. (1996). Non-classical actions of cholinesterases: role in cellular differentiation, tumorigenesis and Alzheimer's disease. Neurochem. Int. 28, 453–483.
Soreq, H., Patinkin, D., Lev-Lehman, E., Grifman, M., Ginzberg, D., Eckstein, F., and Zakut, H. (1994). Antisense oligonucleotide inhibition of acetylcholinesterase gene expression induces progenitor cell expansion and suppresses hematopoietic apoptosis ex vivo. Proc. Natl. Acad. Sci. U.S.A. 91, 7907–7911.
Soreq, H., and Seidman, S. (2001). Acetylcholinesterase–new roles for an old actor. Nat. Rev. Neurosci. 2, 294–302.
Toiber, D., Berson, A., Greenberg, D., Melamed-Book, N., Diamant, S., and Soreq, H. (2008). N-acetylcholinesterase-induced apoptosis in Alzheimer's disease. PLoS ONE 3:e3108. doi: 10.1371/journal.pone.0003108
Toiber, D., Greenberg, D. S., and Soreq, H. (2009). Pro-apoptotic protein-protein interactions of the extended N-AChE terminus. J. Neural Transm. 116, 1435–1442.
Wenzel, A., Grimm, C., Samardzija, M., and Reme, C. E. (2005). Molecular mechanisms of light-induced photoreceptor apoptosis and neuroprotection for retinal degeneration. Prog. Retin. Eye Res. 24, 275–306.
Xi, X., Gao, L., Hatala, D. A., Smith, D. G., Codispoti, M. C., Gong, B., Kern, T. S., and Zhang, J. Z. (2005). Chronically elevated glucose-induced apoptosis is mediated by inactivation of Akt in cultured Muller cells. Biochem. Biophys. Res. Commun. 326, 548–553.
Young, R. W. (1984). Cell death during differentiation of the retina in the mouse. J. Comp. Neurol. 229, 362–373.
Keywords: acetylcholinesterase, apoptosis, hyperglycemia, retinoblastoma
Citation: Shehadeh Masha'our R, Heinrich R, Garzozi HJ and Perlman I (2012) Acetylcholinesterase (AChE) is an important link in the apoptotic pathway induced by hyperglycemia in Y79 retinoblastoma cell line. Front. Mol. Neurosci. 5:69. doi: 10.3389/fnmol.2012.00069
Received: 11 December 2011; Paper pending published: 03 January 2012;
Accepted: 14 May 2012; Published online: 06 June 2012.
Edited by:
Hermona Soreq, The Hebrew University of Jerusalem, IsraelReviewed by:
Deborah Toiber, Massachusetts General Hospital, USATama Evron, Duke University Medical Center, USA
Copyright: © 2012 Shehadeh Masha'our, Heinrich, Garzozi and Perlman. This is an open-access article distributed under the terms of the Creative Commons Attribution Non Commercial License, which permits non-commercial use, distribution, and reproduction in other forums, provided the original authors and source are credited.
*Correspondence: I. Perlman, Ruth and Bruce Rappaport Faculty of Medicine, Department of Physiology and Biophysics, Technion - Israel Institute of Technology, Haifa 31096, Israel. e-mail: iperlman@tx.technion.ac.il
† These authors contributed equally to this work.