 Li Wang†
 Yue Wang
- Department of Neurology, Xinqiao Hospital and The Second Affiliated Hospital, Army Medical University, Chongqing, China
Background: Temporal lobe epilepsy (TLE) is a common brain disease. However, the pathogenesis of TLE and its relationship with immune infiltration remains unclear. We attempted to identify inflammation-related genes (IRGs) and the immune cell infiltration pattern involved in the pathological process of TLE via bioinformatics analysis.
Materials and methods: The GSE88992 dataset was downloaded from the Gene Expression Omnibus (GEO) database to perform differentially expressed genes screening and weighted gene co-expression network analysis (WGCNA). Subsequently, the functional enrichment analysis was performed to explore the biological function of the differentially expressed IRGs (DEIRGs). The hub genes were further identified by the CytoHubba algorithm and validated by an external dataset (GSE60772). Furthermore, the CIBERSORT algorithm was applied to assess the differential immune cell infiltration between control and TLE groups. Finally, we used the DGIbd database to screen the candidate drugs for TLE.
Results: 34 DEIRGs (33 up-regulated and 1 down-regulated gene) were identified, and they were significantly enriched in inflammation- and immune-related pathways. Subsequently, 4 hub DEIRGs (Ptgs2, Jun, Icam1, Il6) were further identified. Immune cell infiltration analysis revealed that T cells CD4 memory resting, NK cells activated, Monocytes and Dendritic cells activated were involved in the TLE development. Besides, there was a significant correlation between hub DEIRGs and some of the specific immune cells.
Conclusion: 4 hub DEIRGs (Ptgs2, Jun, Icam1, Il6) were associated with the pathogenesis of TLE via regulation of immune cell functions, which provided a novel perspective for the understanding of TLE.
Introduction
Epilepsy is a chronic neurological disease in which patients suffer from the recurrence of unprovoked seizures and neurocognitive deficits, impacting more than 70 million people’s life worldwide (Englot et al., 2020). Temporal lobe epilepsy (TLE) is a common type of intractable epilepsy. Previous reports have indicated significant changes in multiple cognitive domains, such as judgment, problem-solving, language, executive functions, and memory (Hermann et al., 2006; Keary et al., 2007; Allone et al., 2017). Although lots of genes and pathways involved in the etiology of TLE have been widely reported, the precise pathological mechanisms are still unclear. Besides, there are no effective therapeutic targets or precise biomarkers for the occurrence and development of TLE.
Accumulating evidence has revealed that neuroinflammatory, oxidative stress, and excitotoxicity contributed to posttraumatic epileptogenesis (Ambrogini et al., 2019; Eastman et al., 2020). Neuroinflammatory is one of the major biological processes in the development of brain pathology in epilepsy (Paudel et al., 2018; Rana and Musto, 2018). The inflammatory response to the insult induced a cascade of processes resulting in multiple pathological effects, including neurodegeneration, astrocyte dysfunction, damaged blood-brain barrier, long-term plastic alterations, and neuronal excitability. These lesions ultimately resulted in the occurrence and development of TLE (Suleymanova, 2021). Activation of neuroinflammation is commonly presented in epileptogenic brain areas and is implicated in animal models of epilepsy (Okuneva et al., 2016). Besides, IRGs in the molecular imaging and blood of neuroinflammation could provide diagnostic and predictive biomarkers for epilepsy (Vezzani et al., 2019). Furthermore, anti-inflammatory small molecules had the potential therapeutic effects of inhibiting brain inflammation in the treatment of epilepsy (Radu et al., 2017). The inflammatory responses induced the secretion of pro-inflammatory factors, which resulted in blood-brain barrier dysfunction as well as the involvement of resident immune cells in the inflammation pathway (Matin et al., 2015). Experimental models have demonstrated that neural injury and the onset of recurrent epilepsy are regulated by interactions between adaptive and innate immunity (Falsaperla et al., 2014; Vitaliti et al., 2014). Immunocyte infiltration takes part in the development of epilepsy primarily via exacerbating blood-brain barrier damage and activating brain inflammation (Wang et al., 2014). For example, the expression of the chemokines positively correlated with neutrophil infiltration in a rat seizure model (Johnson et al., 2011). Infiltration of T lymphocytes is also implicated in the pathology of epilepsy (Nakahara et al., 2010). Furthermore, PD-1 is an immune-inflammatory diagnostic biomarker for patients with intractable epilepsy (Tang and Wang, 2021). Based on these studies, an inflammatory- and immune-related therapeutic schedule could be effective in the prevention and treatment of TLE.
In the present study, we identified inflammation-related genes (IRGs) from the GSE88992 dataset using a combined approach of differentially expressed gene analysis and weighted gene coexpression network analysis. Subsequently, we identified the differential immunocyte types associated with TLE development. And the relationship between immune cell infiltrates and IRGs were evaluated.
Materials and methods
Collection of microarray data
We downloaded the gene expression profiles of the GSE88992 dataset (Mus musculus) with 9 control samples and 8 TLE samples from the Gene Expression Omnibus (GEO) database.1 The mouse model of TLE was established by intrahippocampal microinjection of kainate. We collected the IRGs list from the GeneCards database,2 the threshold for IRGs screening was set as follows: the relevance score > 5. GSE60772 dataset (Mus musculus) was used as an external dataset. The microarray data were normalized with the normalize between arrays function of the limma package.
Screening of differentially expressed genes
We used the limma package of R software to identify the DEGs between the control and TLE groups. The screening criteria were p.adj < 0.05 and |log2 FC| > 1. The volcano and heatmap of DEGs were generated by the ggplot2 package and the Complex Heatmap package in R software, respectively.
Weighted gene co-expression network analysis
We used the WGCNA R package to carry out the WGCNA analysis (Langfelder and Horvath, 2008). A total of 20,812 genes were identified from each sample of GSE88992 dataset. Firstly, the Pearson correlation coefficient between every two genes was calculated to construct the similarity matrix. In the present study, we selected the power value β = 6 (scale free R2 = 0.91) and mean connectivity = 10.54. Then, the similarity matrix was transformed into a topological overlap matrix (TOM). Next, hierarchical clustering was performed to identify modules, the minimum size cutoff value was 30 and the depth segmentation value was 3. The eigengene was calculated, the modules were clustered, and the similar modules were merged (module merge threshold = 0.25). Subsequently, the gene modules that were related to the clinical traits of TLE were identified. Finally, the potential hub genes were identified based on the criteria: gene significance (GS) > 0.8 and module significance (MS) > 0.8.
Functional enrichment analysis of inflammation-related genes
The cluster Profiler package of R software was used to perform the KEGG and biological process (BP), cellular component (CC), and molecular function (MF) enrichment analyses of DEIRGs. P < 0.05 was considered significant enrichment (Yu et al., 2012).
Identification of hub genes
First, the PPI network of IRGs was established using a STRING3 and Cytoscape (v 3.7.2) software. Then, we selected the top 8 genes by eight topological analysis algorithms in cytoHubba, namely, radiality, MNC, EPC, MCC, degree, closeness, betweenness, and bottleneck (Chin et al., 2014). The hub genes were identified using an R package “UpSet” (Lex et al., 2014).
Gene set enrichment analysis
GSEA was carried out via GSEA version 4.1.0 software to further explore the potential biological functions of genes in the GSE88992 dataset (Tragante et al., 2017). False discovery rate (FDR) < 0.25 and p.adjust < 0.05 and were considered significant enrichment.
Assessment of immunocyte infiltration
The gene expression profiles of the GSE88992 dataset were uploaded to CIBERSORT to evaluate immune cell infiltration of TLE samples and control samples (Newman et al., 2015). The ggplot2 package and the ComplexHeatmap package in R software were used to visualize the infiltration level of 22 types of immune cells between the control and TLE groups.
Correlation analysis between the infiltrating immune cells and hub genes
The correlation analysis between the infiltrating immune cells and hub genes (Ptgs2, Jun, Icam1, and Il6) was carried out via Spearman, the results were visualized via the ggplot2 package of R software.
The kainite model of temporal lobe epilepsy and hub genes validation
The male C57BL/6 mice (8 weeks old and 20–24 g) were obtained from the Experimental Animal Center of Chongqing. All animal experimental protocols were approved by the Animal Care Committee of Army Medical University. All animals were randomly divided into two groups, including control group (Con, n = 6) and kainite model group (TLE, n = 6). Mice were anesthetized with a combination of xylazine (8 mg/kg, i.p.) and ketamine (100 mg/kg, i.p.), and placed symmetrically in the stereotactic apparatus and then drilled into the skull. Then, freshly prepared kainite solution (20 mmol/L in saline) (Araki et al., 2020) was microinjected into the right side of the hippocampus by a microsyringe to induce TLE. The microsyringe was slowly withdrawn and the scalp was stitched. The Con of mice was given the same amount of saline. During the first 4 h after kainite injection, the severity of TLE was evaluated based on the Racine scoring system: 0, no reaction; 1, mild facial clonus, eye blinking, and/or stereotypic mounting; 3, myoclonic jerks in the forelimbs; 4, clonic convulsions in the forelimbs with rearing; and 5, generalized clonic convulsions and loss of balance (Khamse et al., 2015).
Total RNA of hippocampus tissues were extracted using TRIzol reagent (Ambion). 2 μg of purified RNA was reverse transcribed into cDNA using cDNA synthesis kit (Bio-Rad, USA). Then, qRT-PCR was carried out using SYBR Green Master Mix reagent (VAZYME) on the PCR System (Applied Biosystems, CA, USA). The mRNA expression levels of genes were normalized using the 2–ΔΔCt method. The sequences of primers used in this study were presented in Table 1.
Table 1. Sequences of primers used quantitative real-time PCR.
Hub gene-drug interaction
Drug-Gene Interaction Database has drug-gene interaction data from 30 disparate sources including PharmGKB, NCBI Entrez, clinical trial databases, Ensembl, DrugBank, ChEMBL, and literature in NCBI PubMed. The four core IRGs were selected as the potential targets and imported into the Drug-Gene Interaction Database (DGIdb)4 to search for existing inhibitors or agonists, then the FDA-approved drugs with agonist or antagonist effects were identified. Finally, the interaction network between the core IRGs and the potential drugs was constructed by Cytoscape software.
Results
Identification of differentially expressed genes between temporal lobe epilepsy and control groups
First, the data from the GSE88992 dataset were normalized with the normalize between arrays function of the limma package (Figure 1A). And the results of PCA analysis indicated a significant difference in gene expression between control samples and TLE samples (Figure 1B). Therefore, we performed DEGs analysis in the next step. As shown in Figure 1C and Supplementary Table 1, we identified a total of 613 DEGs between TLE and control groups, including 474 up-regulated genes (red dots) and 139 down-regulated genes (green dots). The mRNA expression level of the top 40 DEGs was visualized in Figure 1D.
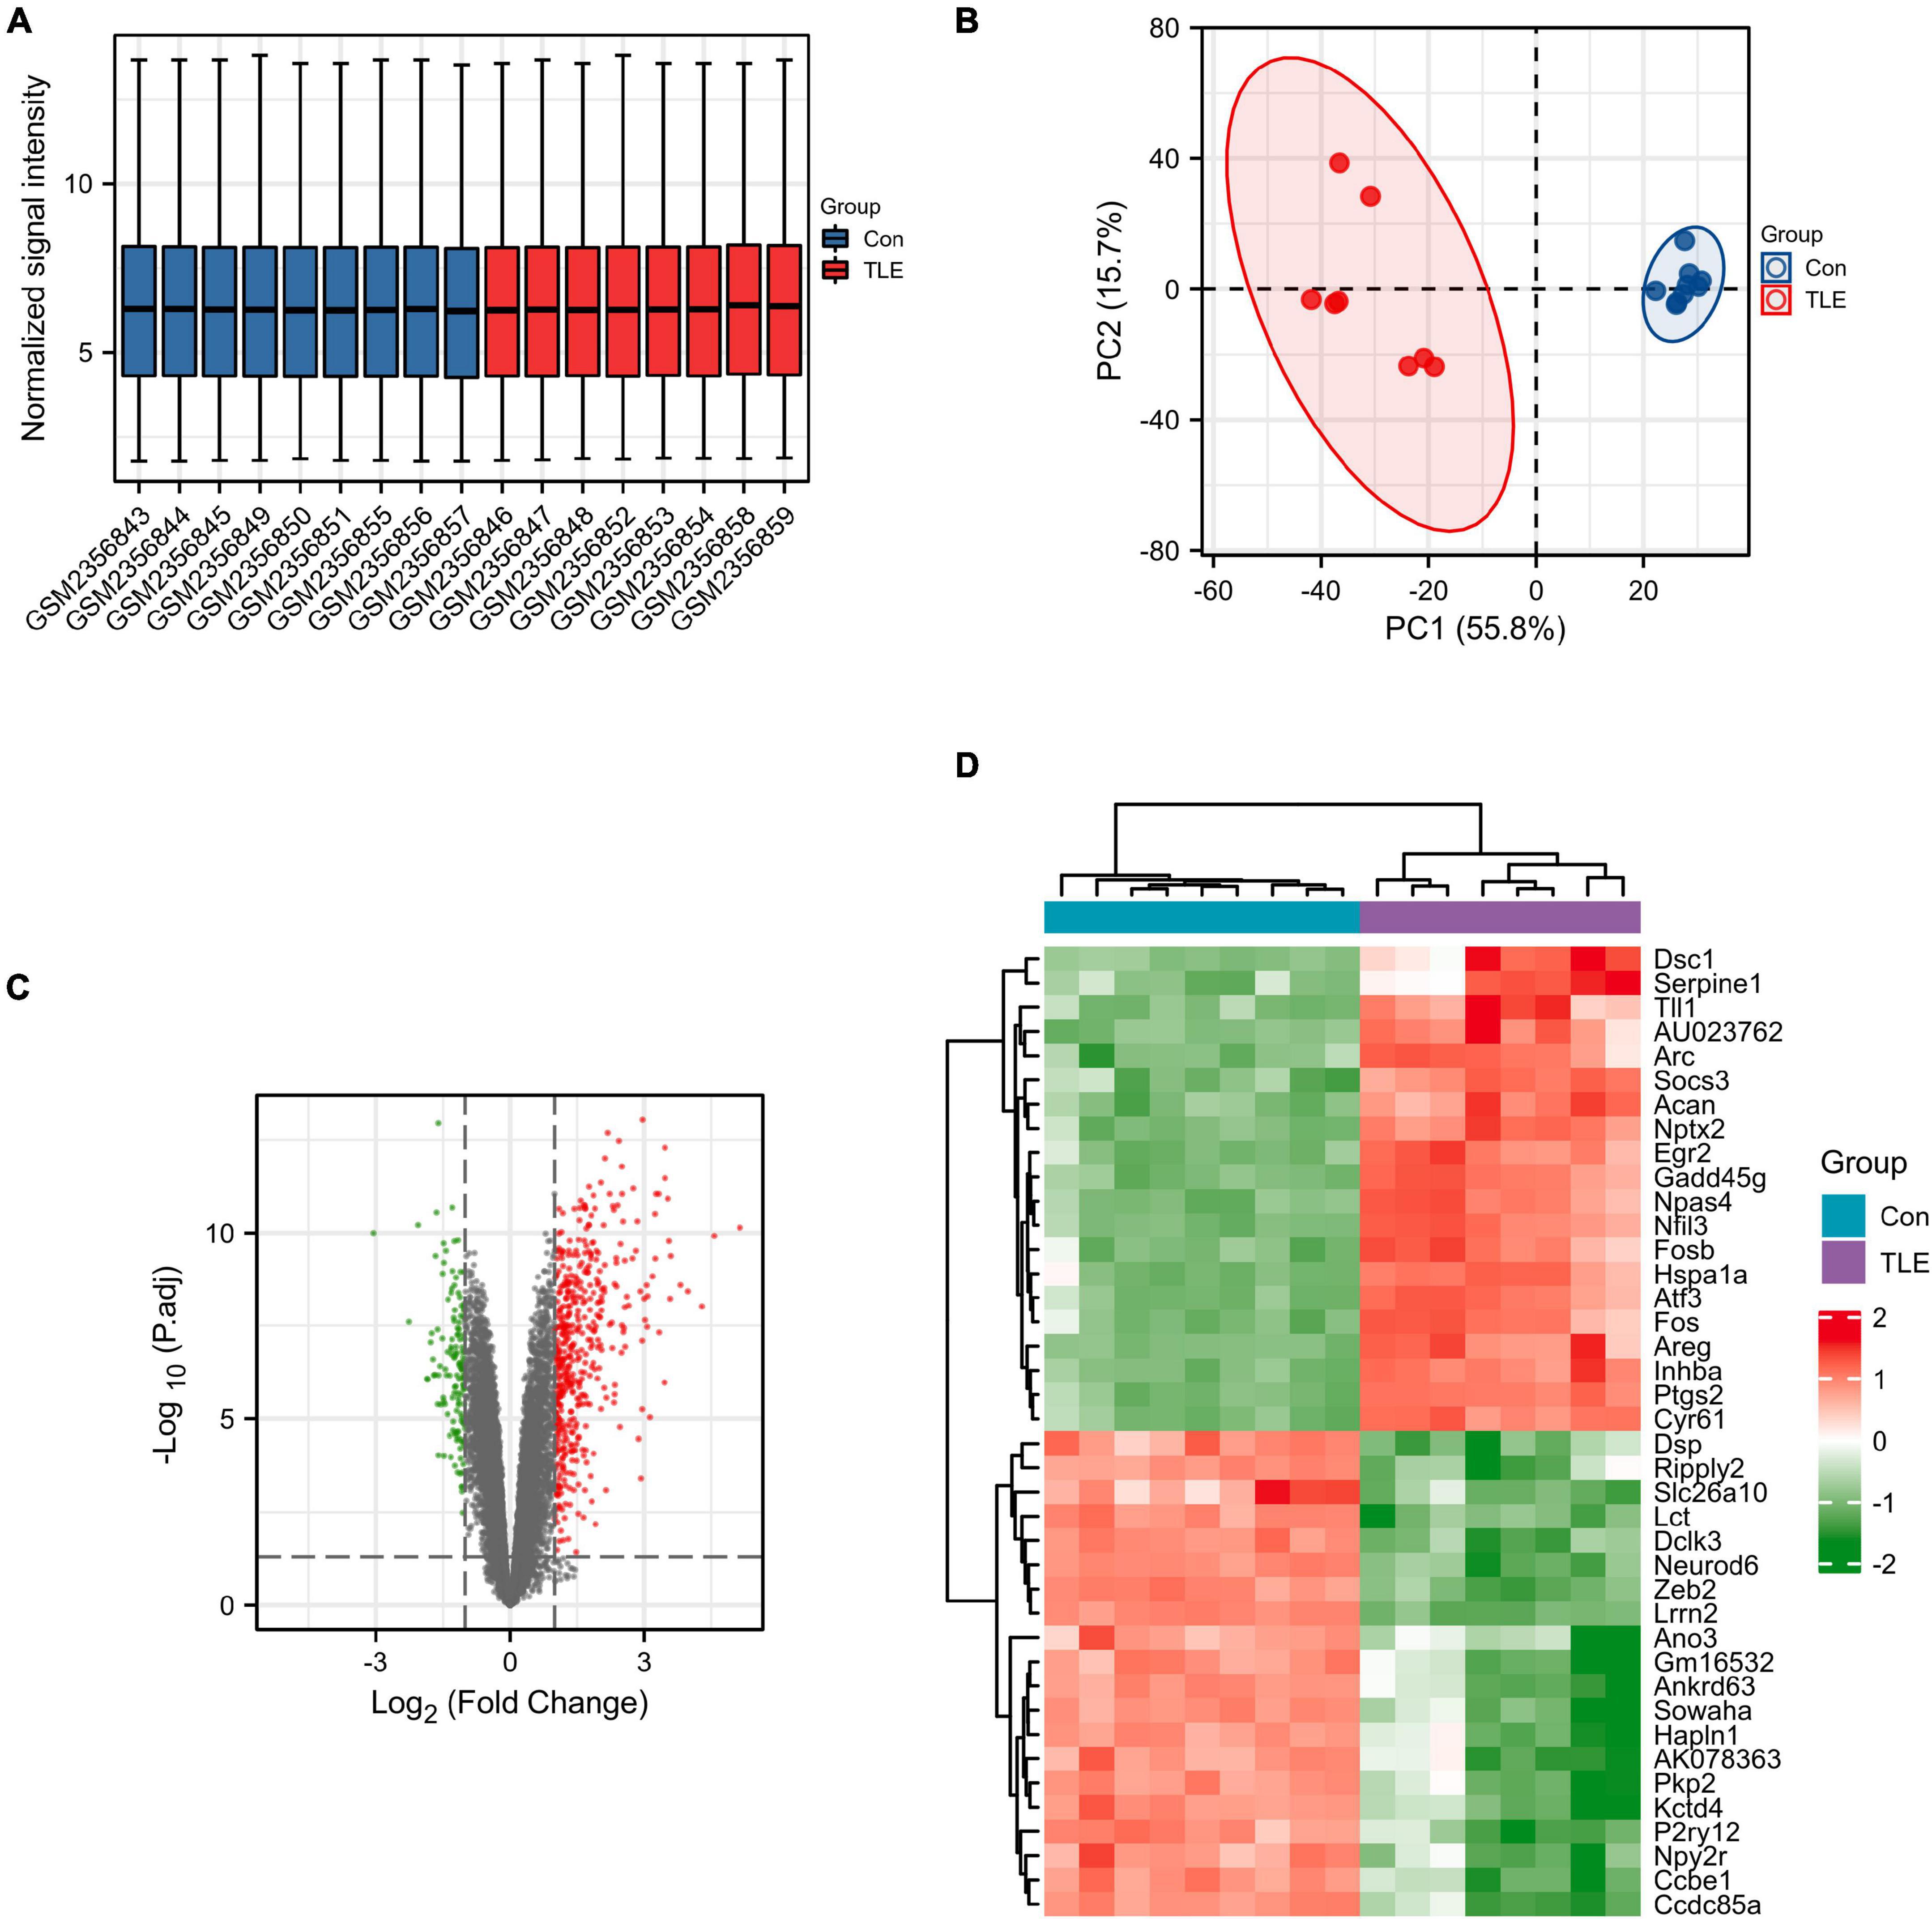
Figure 1. Identification of DEGs in TLE. (A) Normalized data from control and TLE groups. (B) Principal component analysis for GSE88992. (C) Volcano plot of the DEGs (green dots represent 139 down-regulated genes, red dots represent 474 up-regulated genes). (D) Heatmaps of the top 40 DEGs in the GSE88992 dataset. Red indicates up-regulated and green indicates down-regulated.
Temporal lobe epilepsy-related modules were identified by weighted gene co-expression network analysis
A total of 20,812 genes obtained from the gene expression profiles of the GSE88992 dataset were used to perform WGCNA. Then, hub modules were identified based on average dynamic tree clipping and hierarchical clustering (Supplementary Figures 1A,B). Two hub modules (blue and turquoise) were visualized in Supplementary Figure 1C and were most correlated with the TLE and selected for further investigation. As shown in Supplementary Figures 1D,E, we screened out the hub genes based on MM > 0.8 and GS > 0.8, and 2,312 and 2,651 key genes were identified in the blue and turquoise modules, respectively (Supplementary Table 2).
Identification of core inflammation-related genes and functional enrichment analysis
A total of 403 IRGs were obtained from GeneCards database (Supplementary Table 3). We intersected the most clinically significant modules (blue and turquoise) with the DEGs and IRGs to further identify 34 core IRGs (Figure 2A). The mRNA expression level of the 34 core IRGs in the GSE88992 dataset was visualized in Figure 2B. Subsequently, we performed a functional enrichment analysis of 34 core IRGs to obtain a better understanding of the underlying BP associated with TLE. As shown in Figures 2C,D, the GO-BP enrichment analysis indicated that the core IRGs involved in leukocyte migration, positive regulation of response to external stimulus, leukocyte chemotaxis, myeloid leukocyte migration, and cell chemotaxis; for GO-CC, the core IRGs mainly enriched in membrane raft, membrane microdomain, membrane region, receptor complex, and extracellular exosome; for GO-MF, the core IRGs significantly enriched in cytokine activity, receptor ligand activity, chemokine activity, G protein-coupled receptor binding, and chemokine receptor binding (Table 2). As shown in Figures 2E,F, the KEGG enrichment analysis indicated that the core IRGs enriched in TNF signaling pathway, IL-17 signaling pathway, Toll-like receptor signaling pathway, AGE-RAGE signaling pathway in diabetic complications, and Rheumatoid arthritis (Table 2).
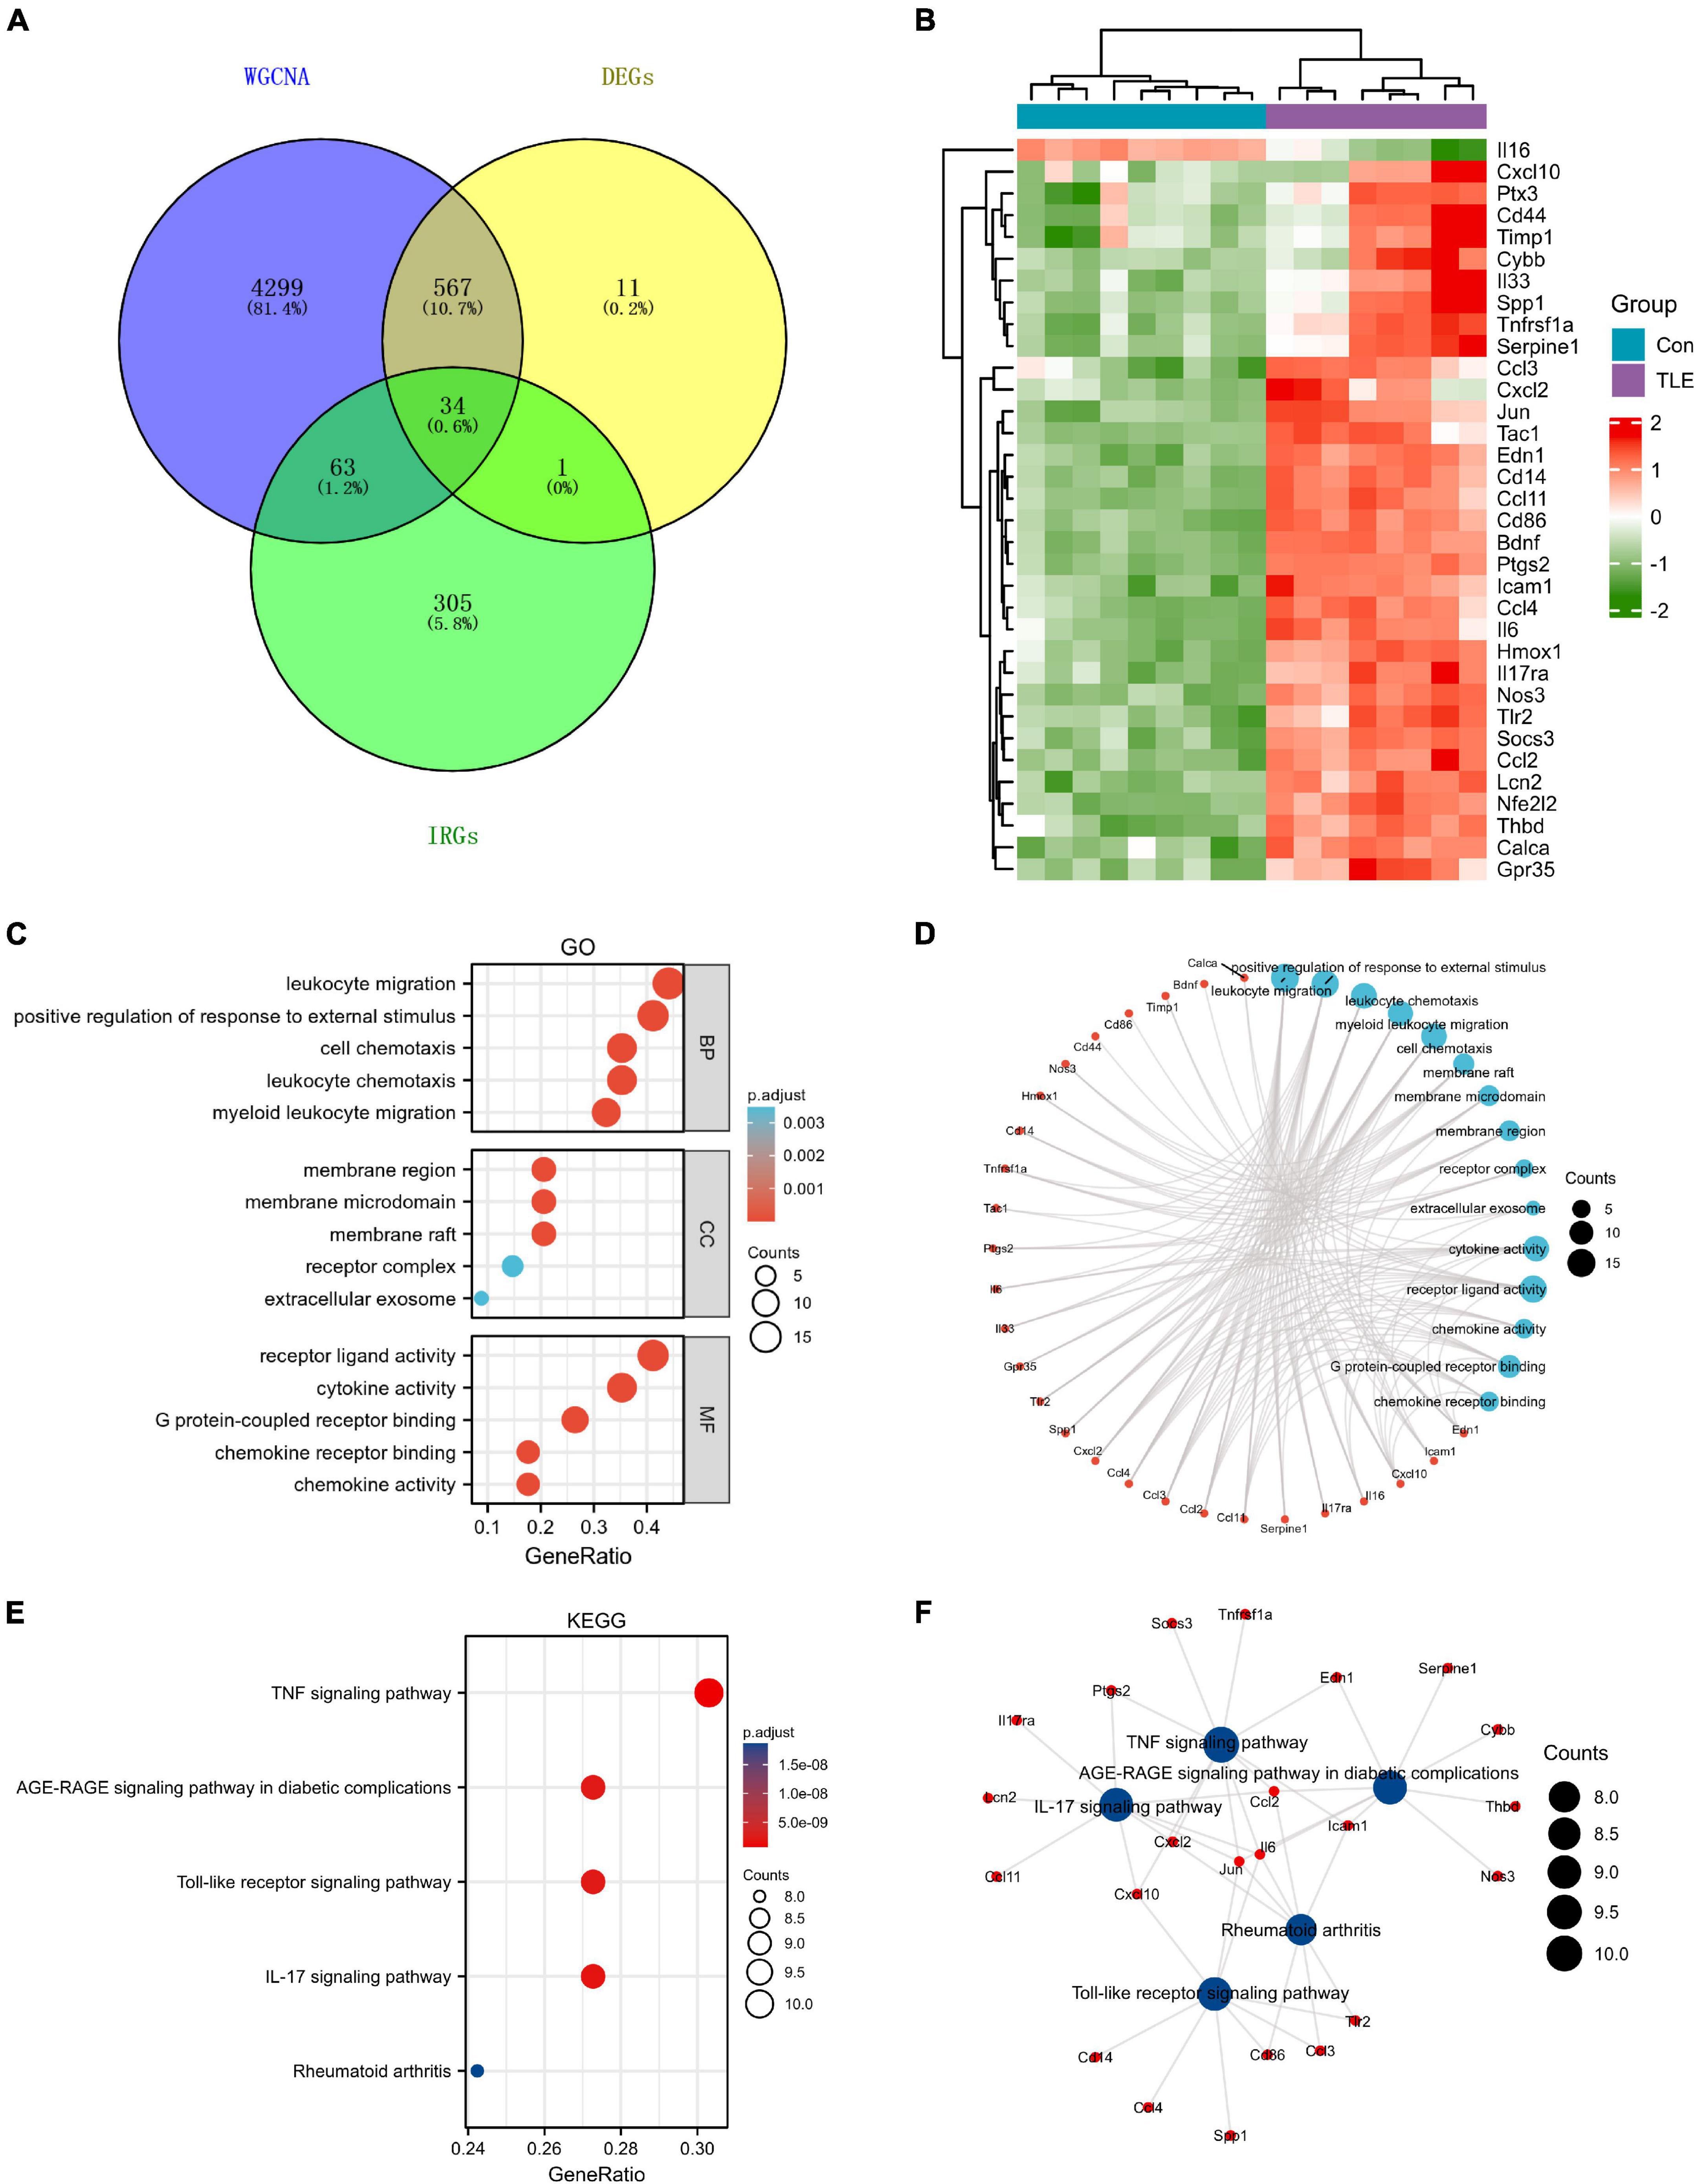
Figure 2. Identification of differentially expressed IRGs (DEIRGs) in TLE. (A) Venn diagram of the DEIRGs in DEGs, WGCNA, and IRGs. A total of 34 DEIRGs were identified. (B) Heatmaps of the 34 DEIRGs in the GSE88992 dataset. Red indicates up-regulated and green indicates down-regulated. The results showed that most of DEIRGs were all up-regulated in TLE group. (C,D) Biological process (BP), cellular component (CC), and molecular function (MF) enrichment analyses of DEIRGs. (E,F) KEGG enrichment analysis of DEIRGs.
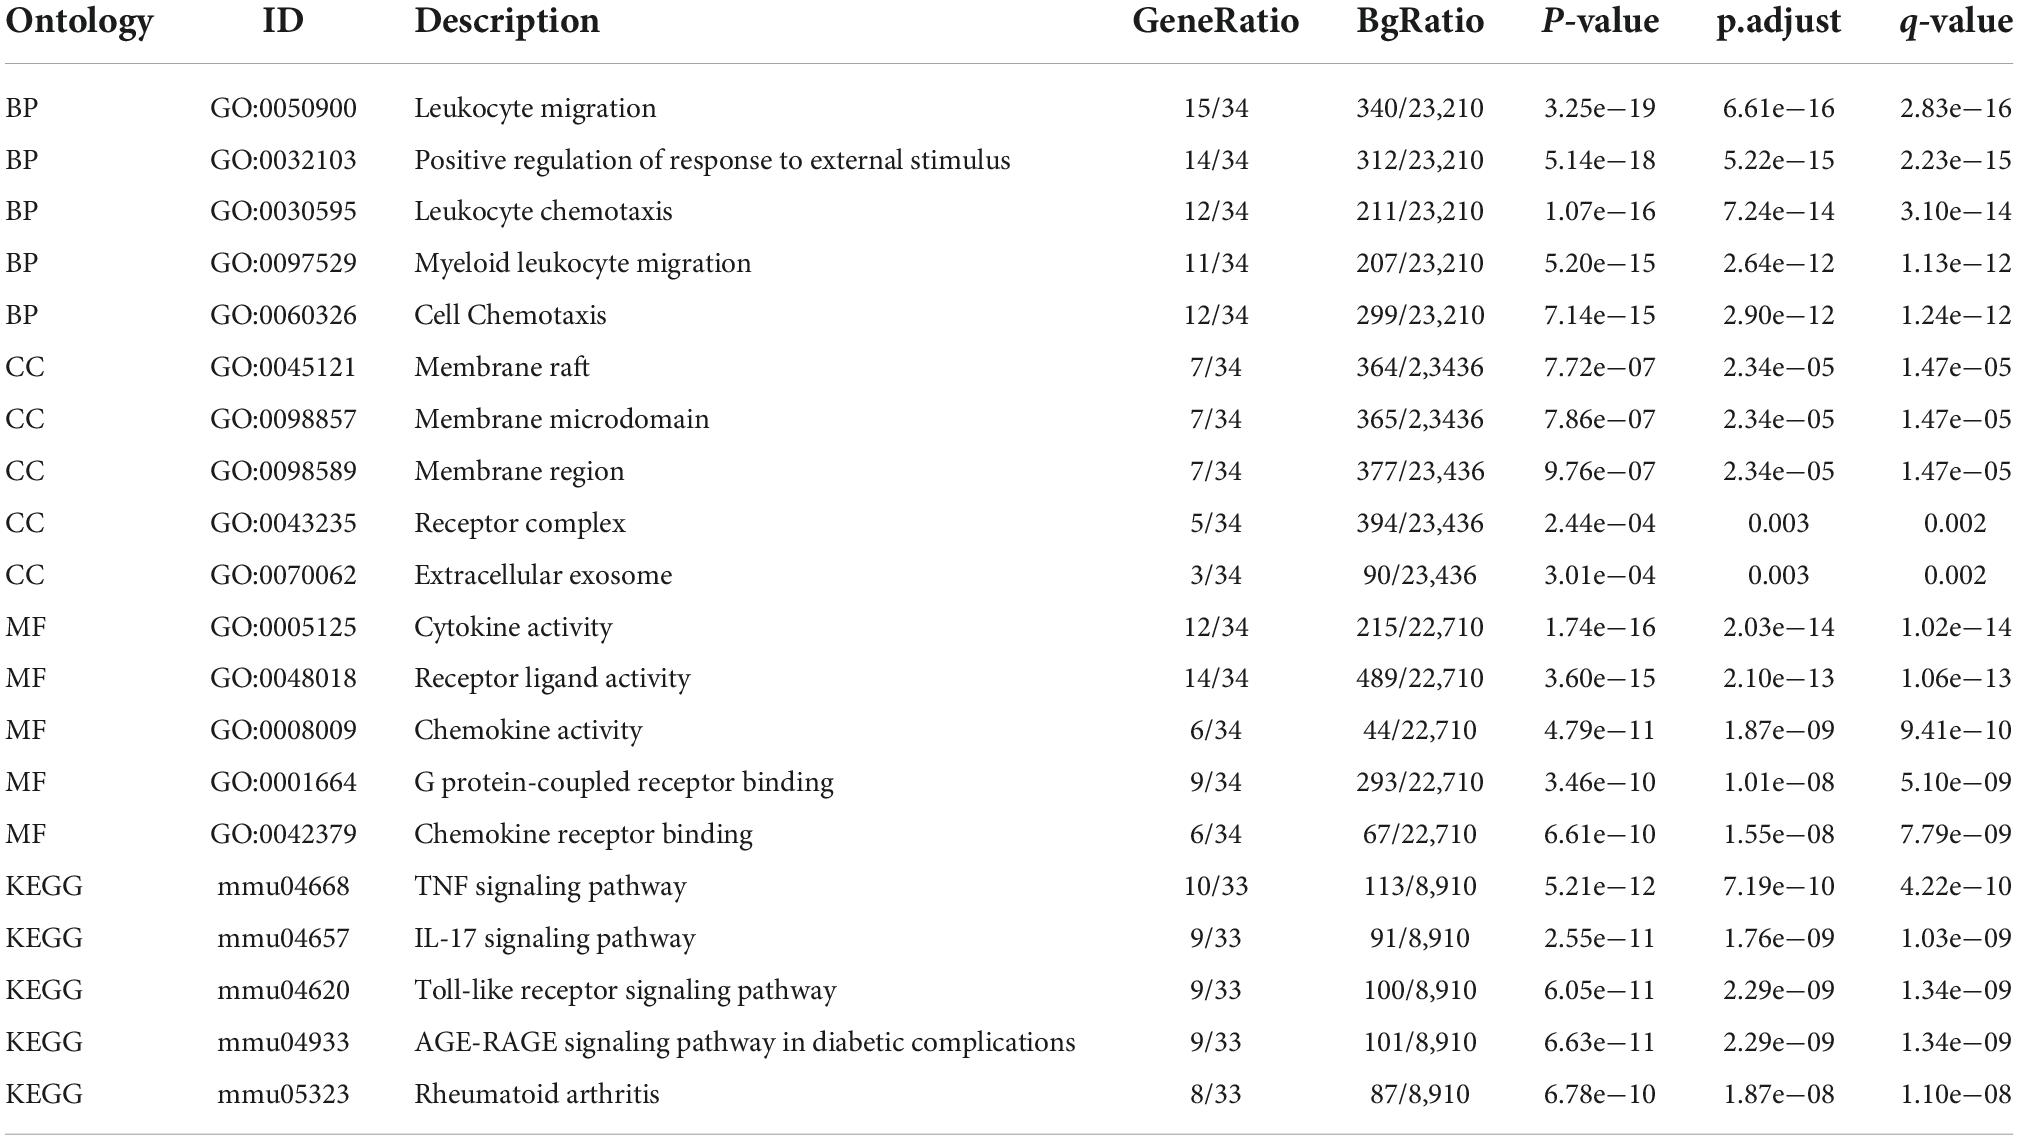
Table 2. Enrichment analysis of differentially expressed IRGs in kainite-induced epilepsy.
Identification and validation of hub genes
The top 8 genes were selected by 8 topological analysis algorithms (radiality, MNC, EPC, MCC, degree, closeness, betweenness, and bottleneck) in cytoHubba. Then, we used the R package “UpSet” to identify four hub genes, including Ptgs2, Jun, Icam1, and Il6 (Figure 3A). We also drew the heatmap of four hub genes in the GSE88992 dataset to visualize the mRNA expression levels (Figure 3B). Besides, we used an external dataset (GSE60772) and established a model of TLE to verify the results. As presented in Supplementary Table 4, Con group showed no signs of seizure activity and behavior during the first 4 h after kainite injection. However, all mice (100%) in TLE group showed high scores of seizures (p < 0.001), indicating that the TLE model was established. As shown in Figures 4A,B, the mRNA expression levels of Ptgs2, Jun, Icam1, and Il6 in the control group were significantly lower than those in the TLE group (p < 0.05), the results were consistent with those of bioinformatics screening.
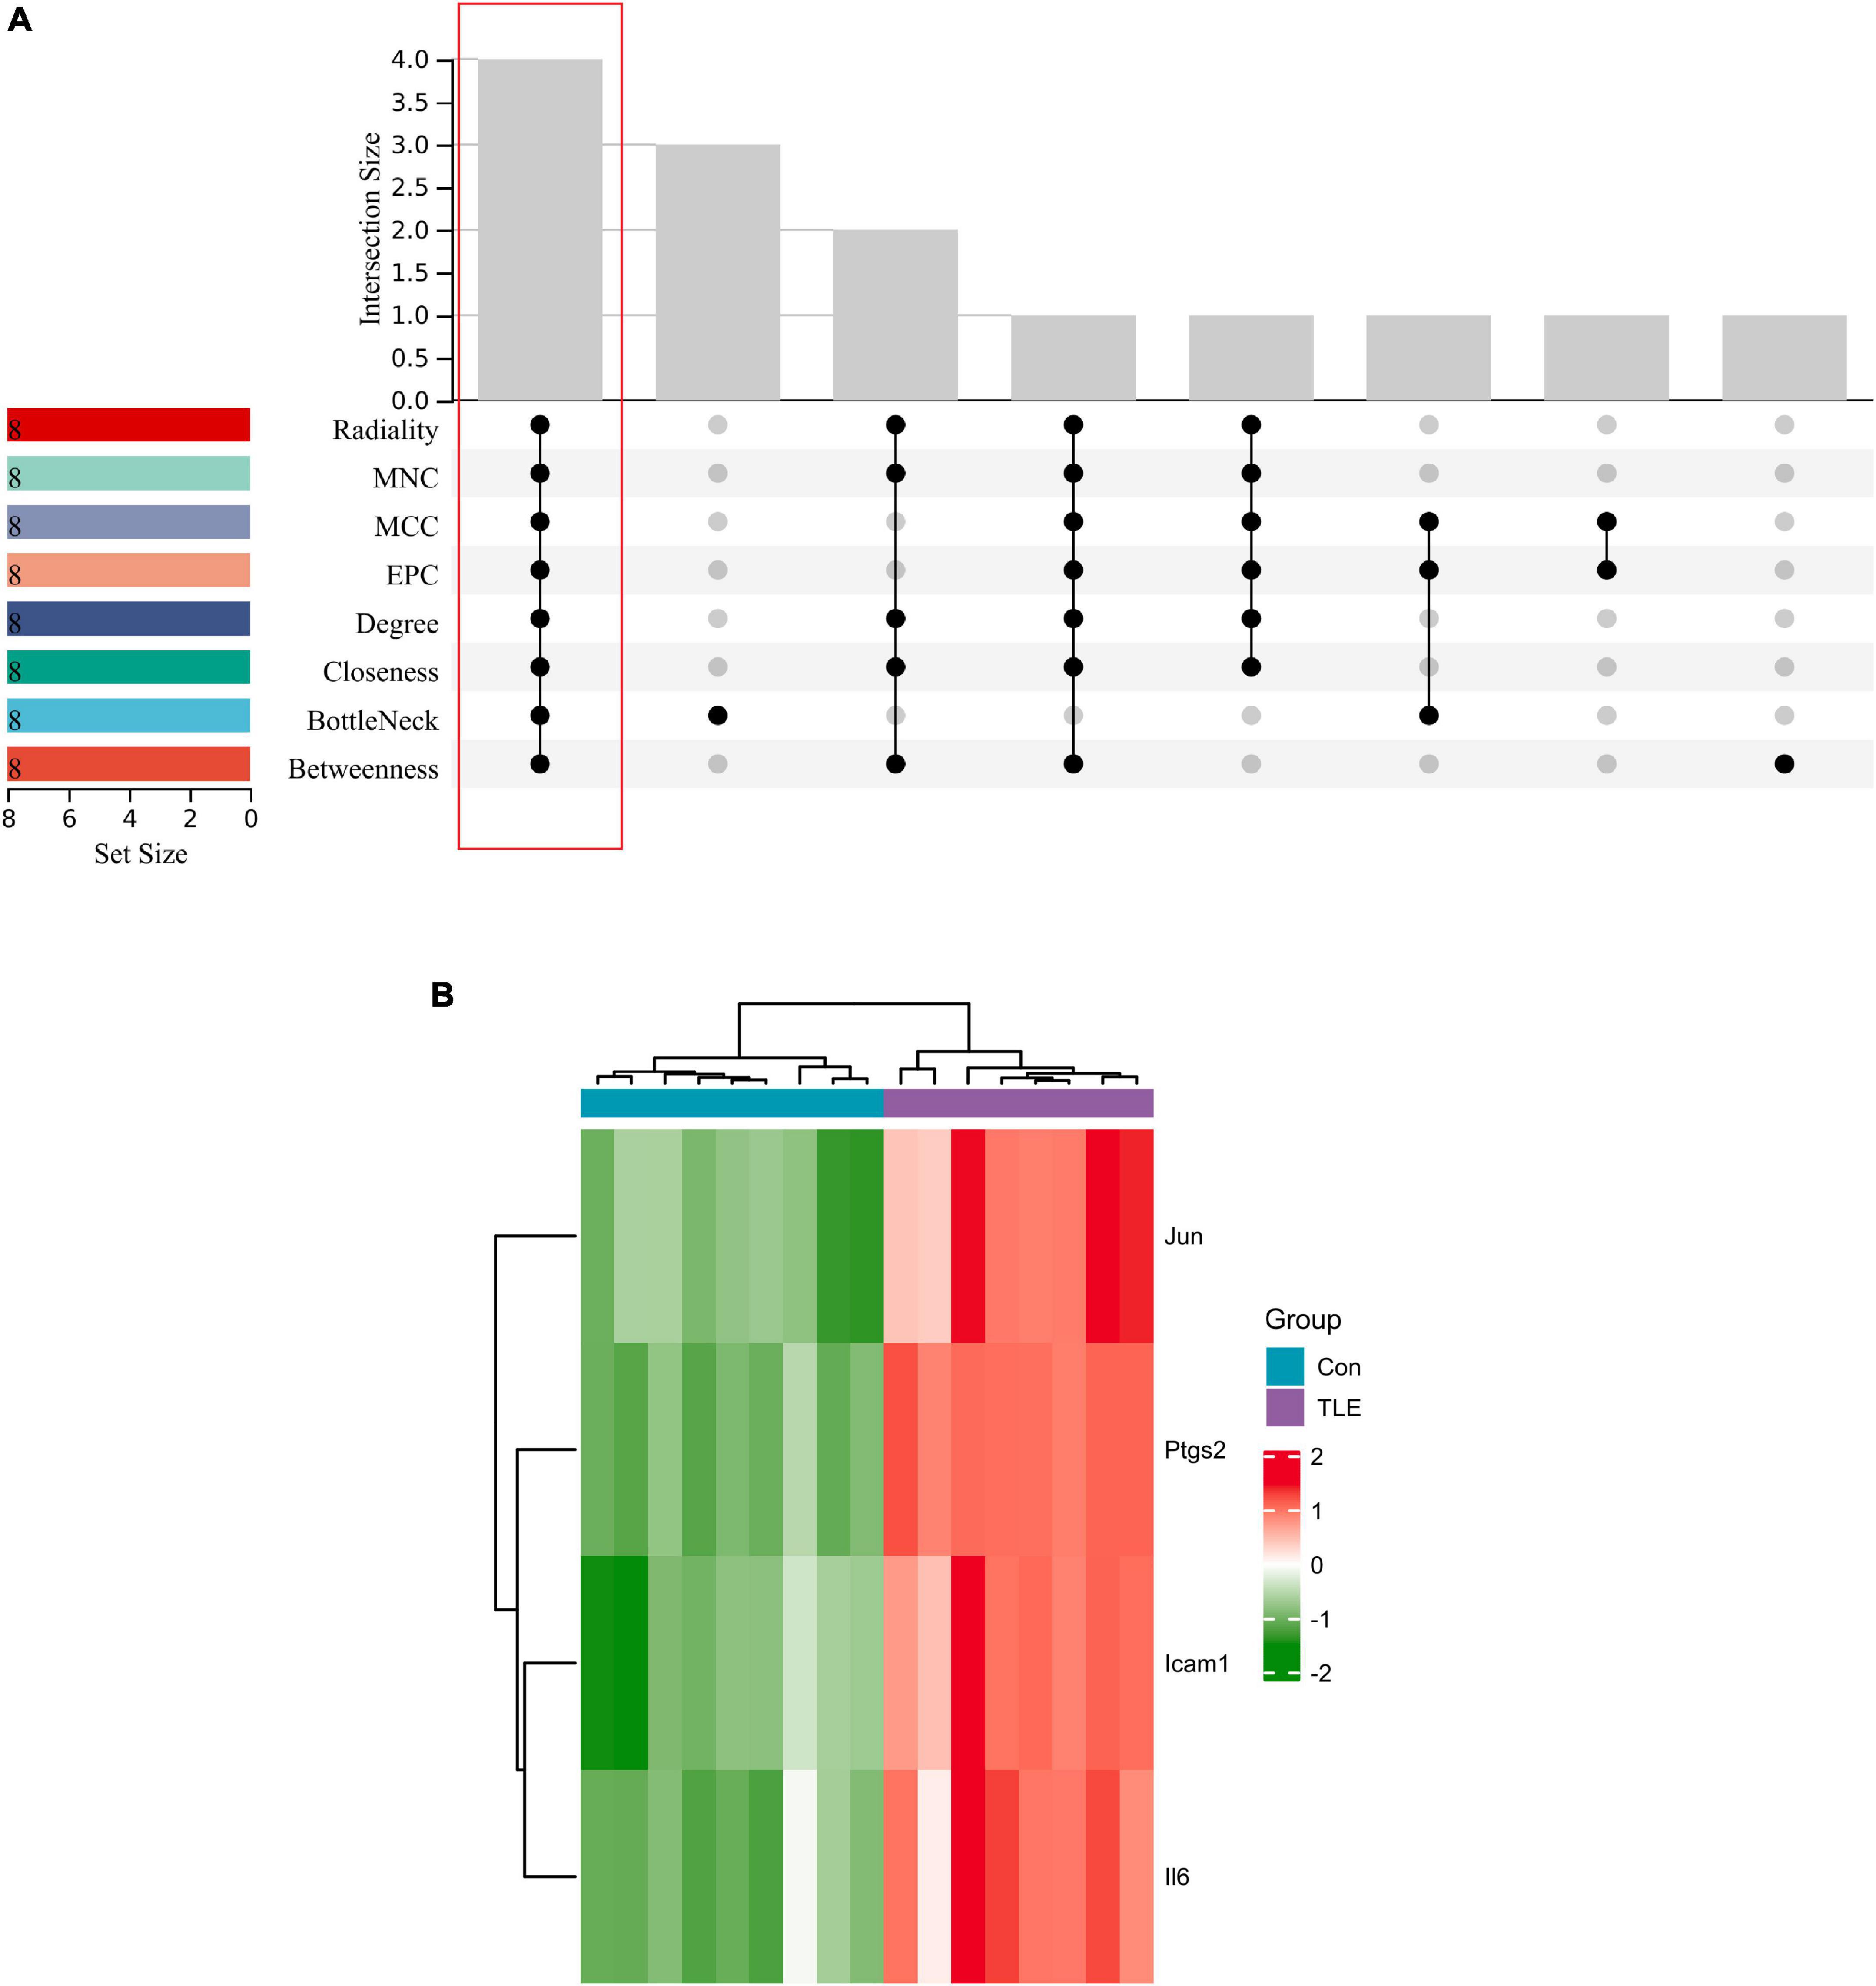
Figure 3. Identification of hub genes. (A) Eight algorithms were applied to identify hub genes based on the R package “UpSet.” Four IRGs (Ptgs2, Jun, Icam1, Il6) were identified as hub genes. (B) Heatmap of four hub genes (Ptgs2, Jun, Icam1, Il6) in the GSE88992 dataset. Red indicates up-regulated and green indicates down-regulated. The results showed that Ptgs2, Jun, Icam1, Il6 expression levels were all up-regulated in TLE group.
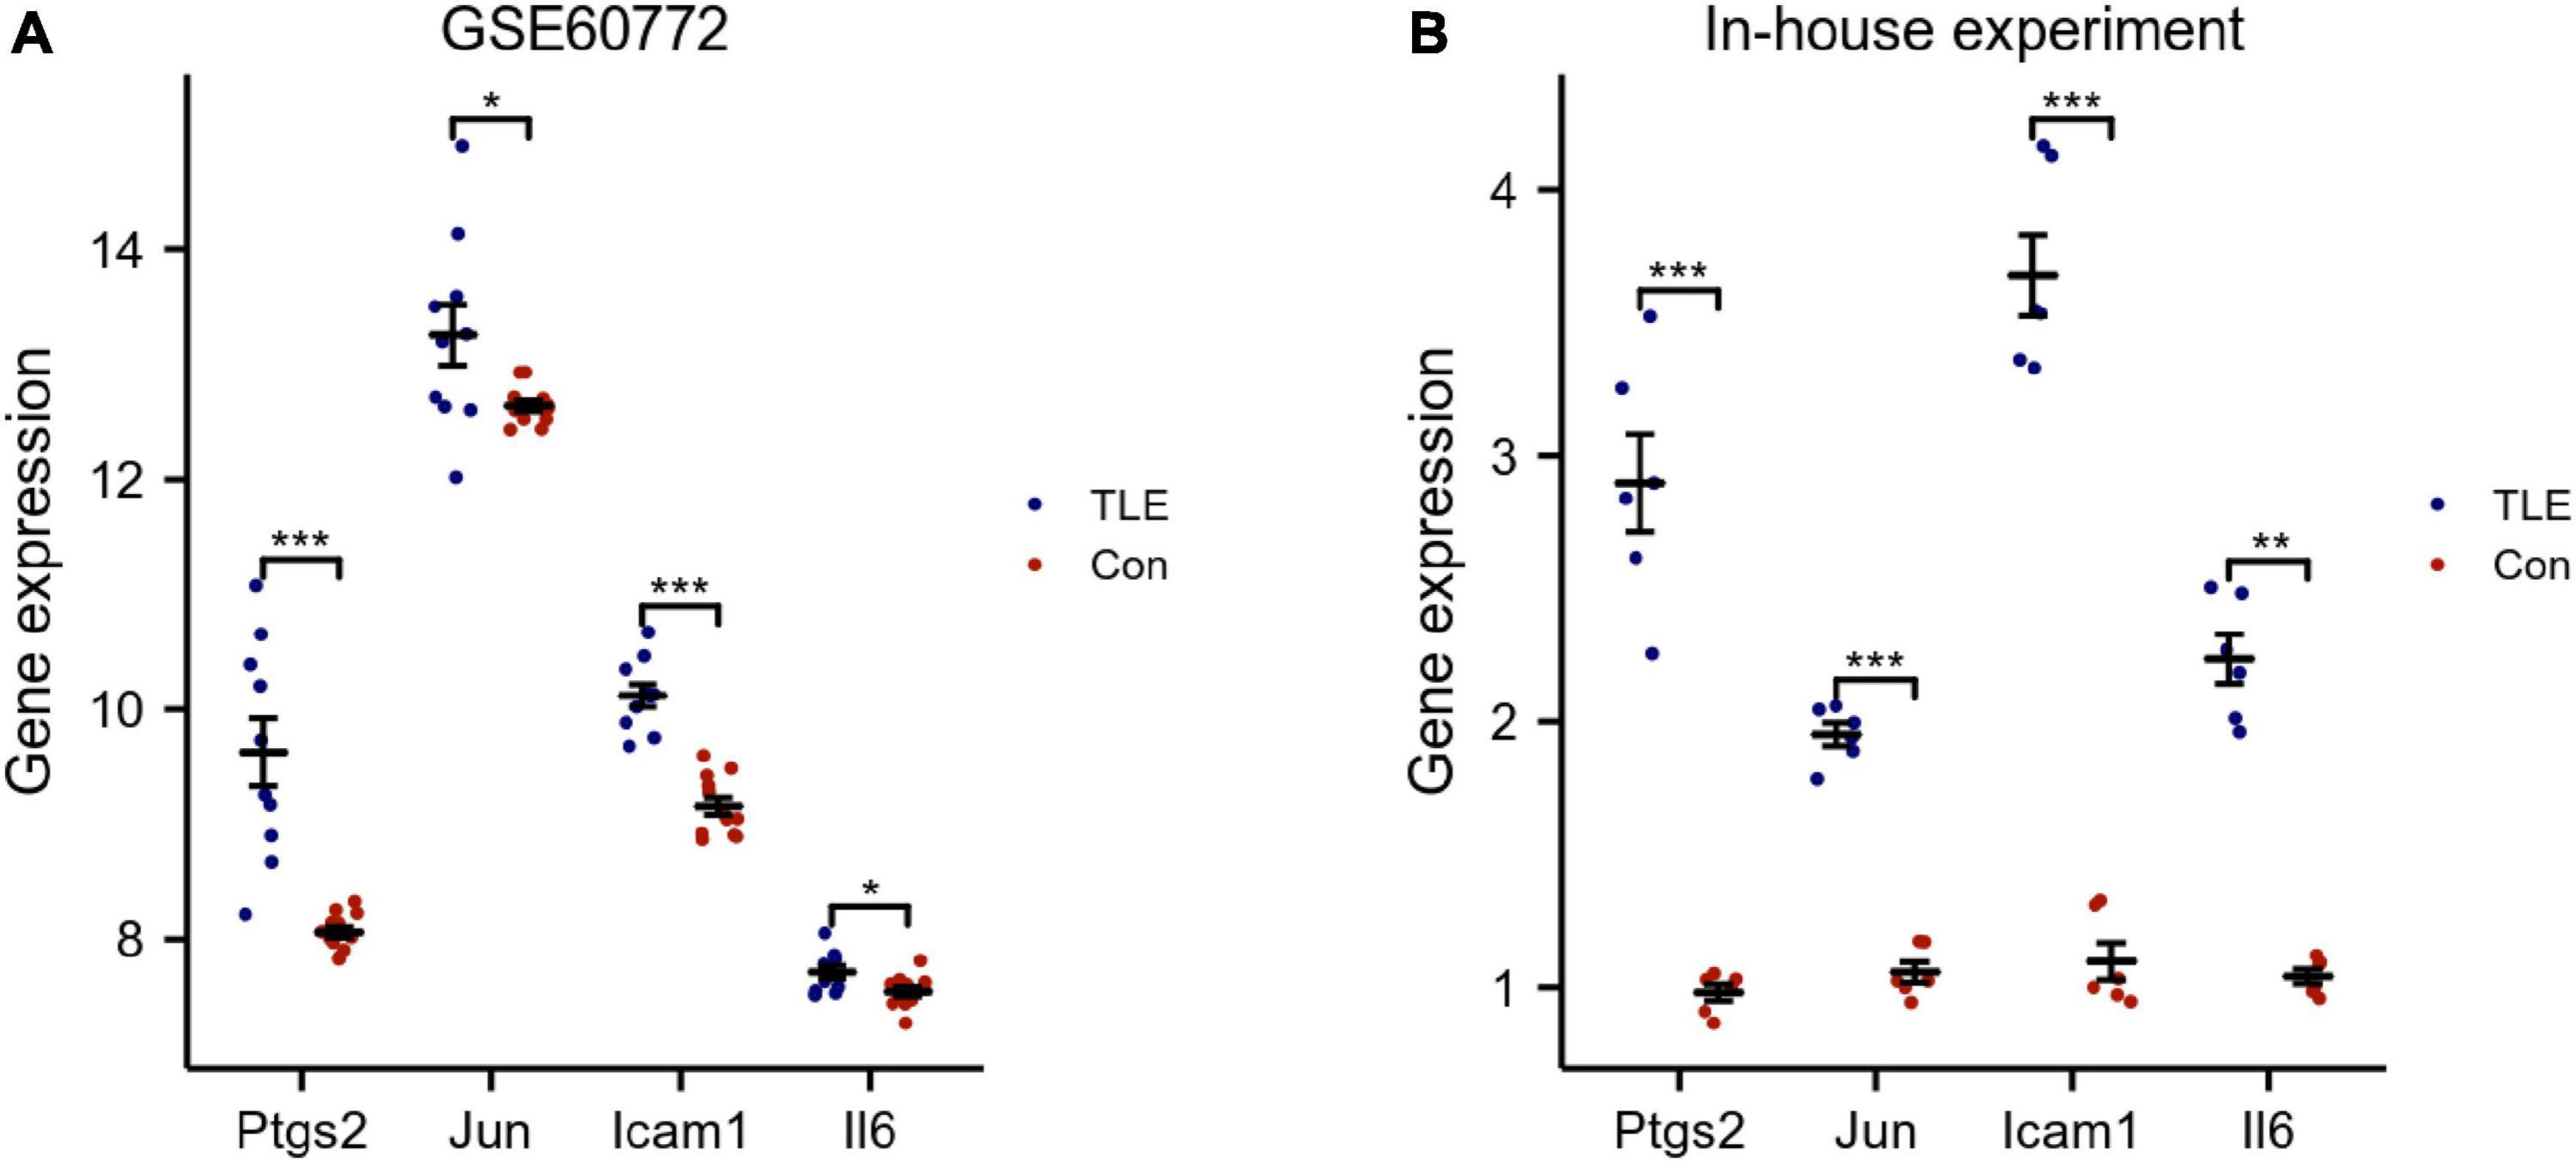
Figure 4. Validation of hub genes. (A) Validation of hub genes by an external dataset (GSE60772). (B) Verification of hub genes by an in-house experiment. The findings showed that Ptgs2, Jun, Icam1, Il6 expression levels were all increased in TLE group. Data were presented as mean ± standard deviation (SD). n = 3. *P < 0.05, **P < 0.01, ***P < 0.001.
Gene set enrichment analysis
As shown in Figure 5, our results revealed that most of the enriched gene sets were involved in immune- and inflammation-related pathways, including neutrophil degranulation, leukocyte transendothelial migration, disease of the immune system, cytokines and inflammatory response, inflammatory response pathway, IL18 signaling pathway, TNF alpha signaling pathway, and senescence and autophagy in cancer. These findings indicated immune response and inflammation may play a vital role in the pathological process of TLE.
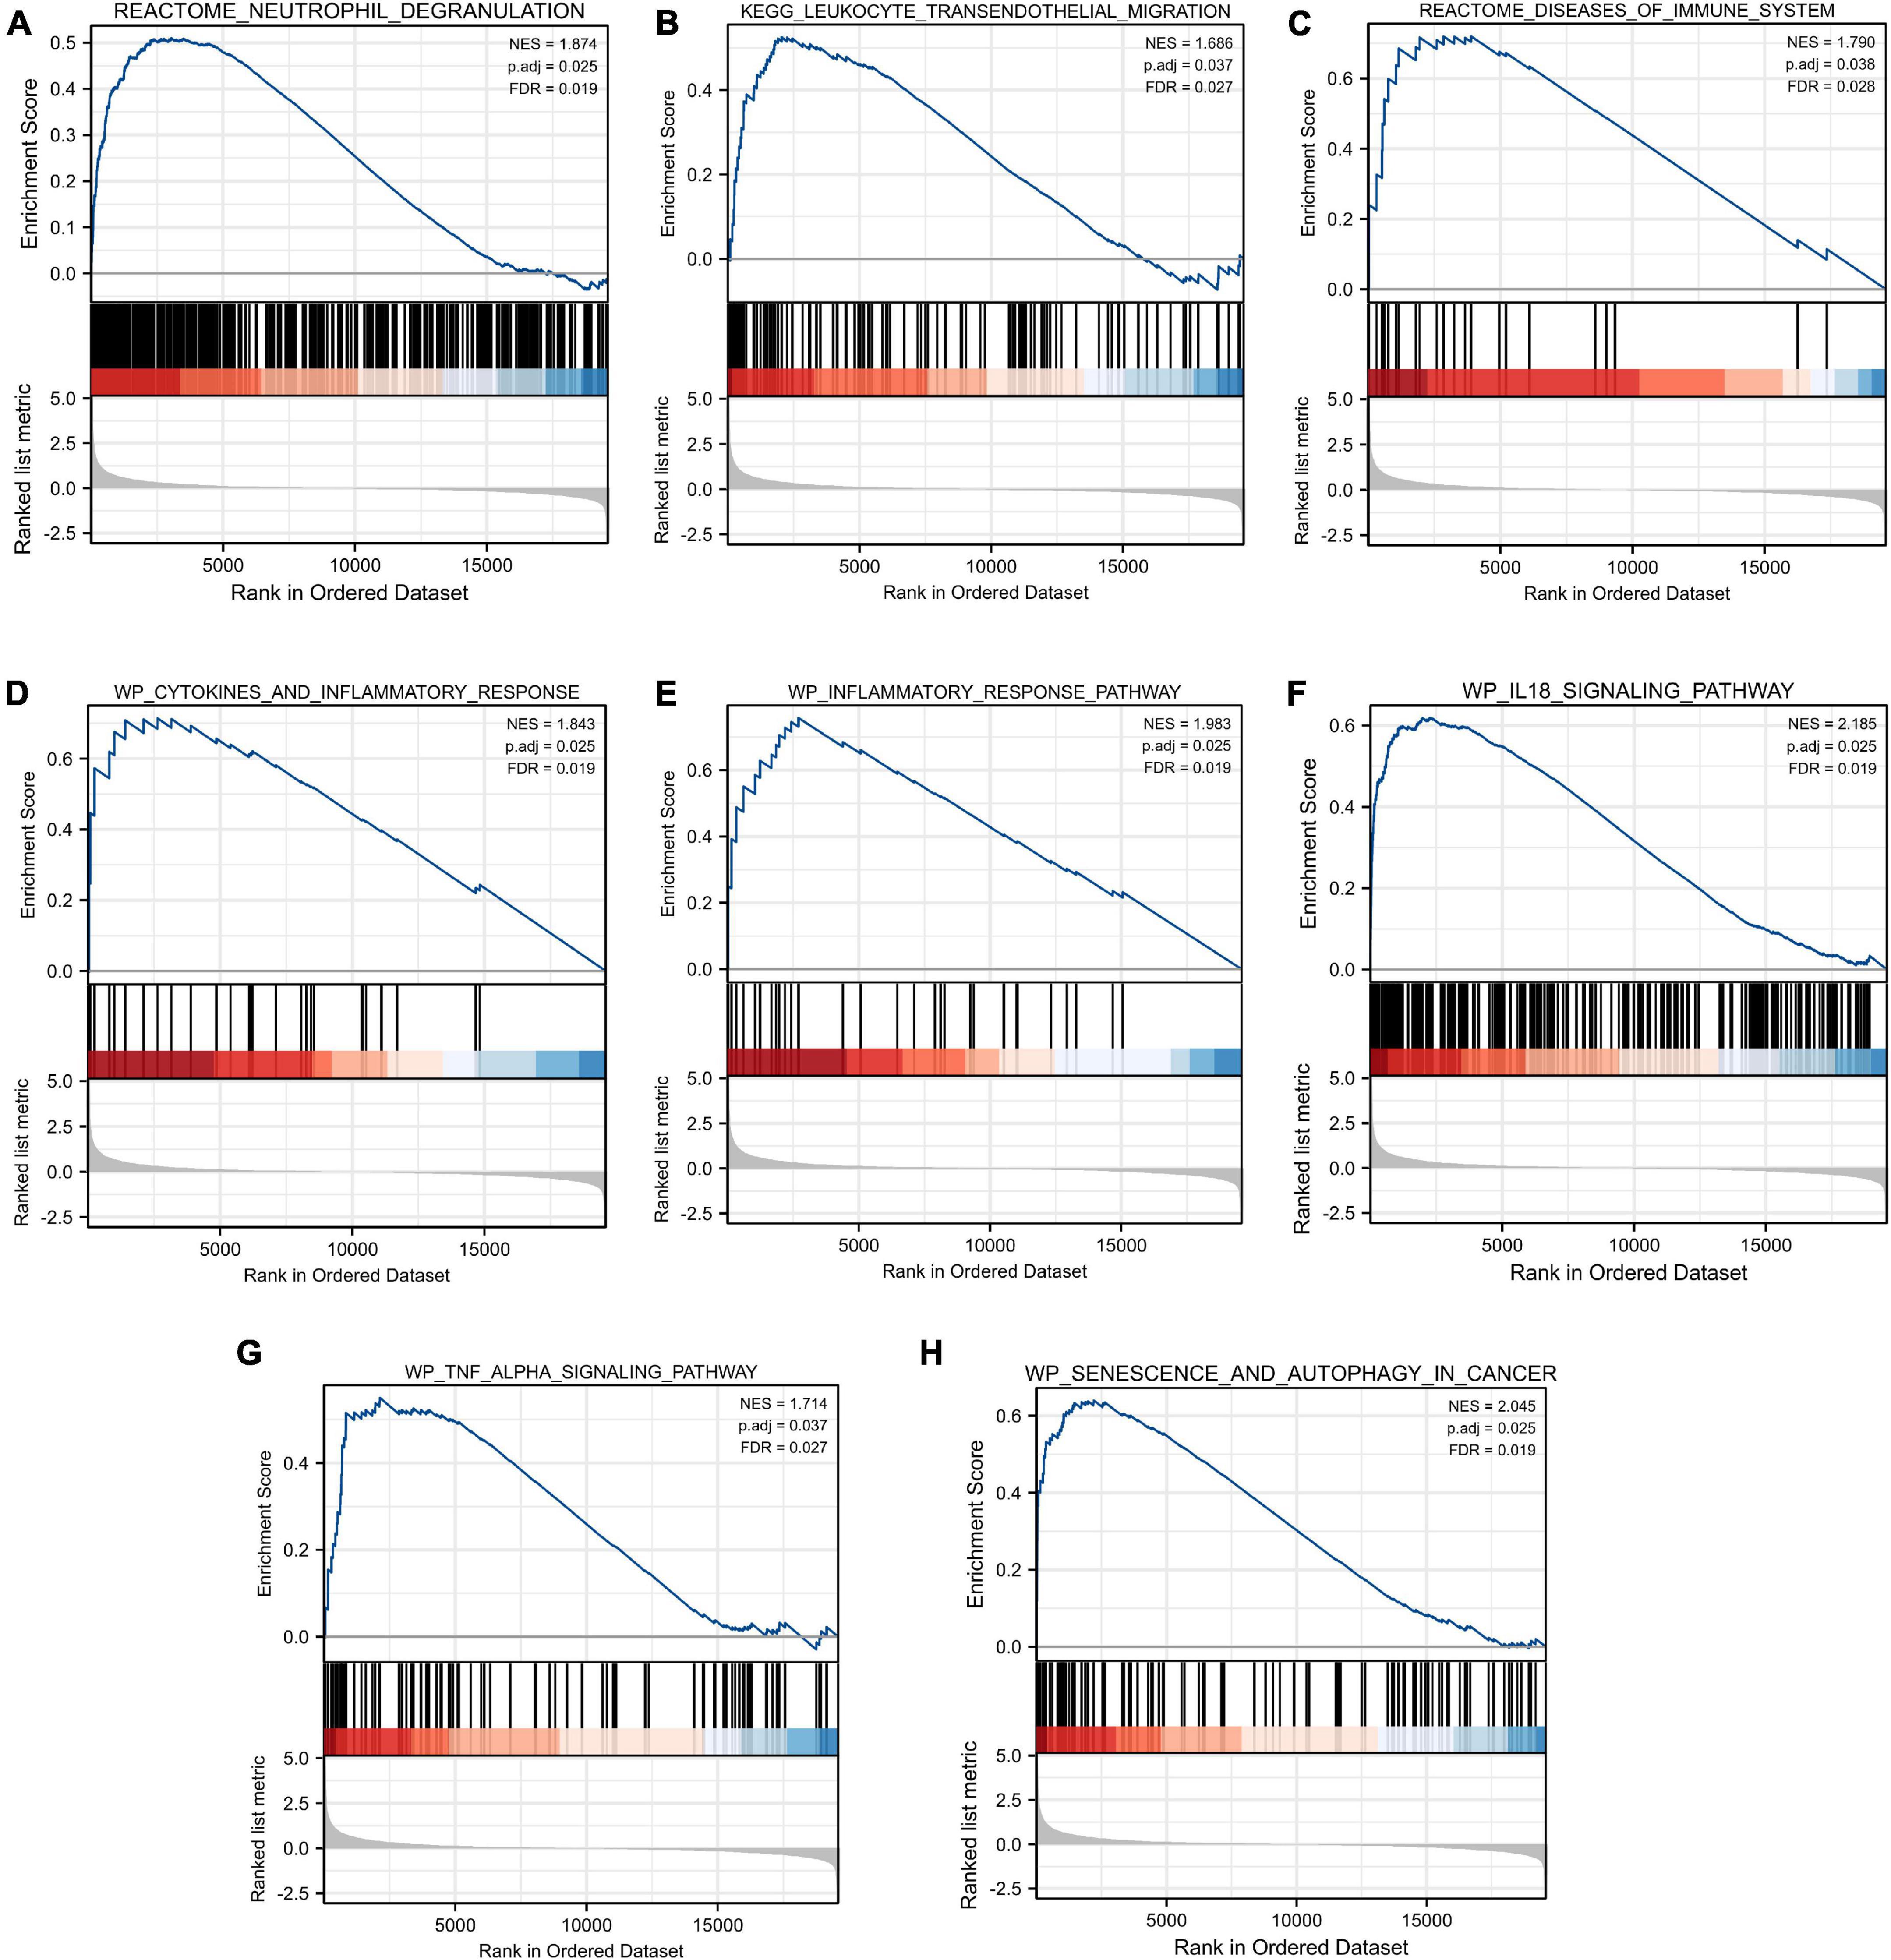
Figure 5. Gene Set Enrichment Analysis (GSEA). FDR < 0.25 and p.adjust < 0.05 were considered to be significant. (A) Neutrophil degranulation, (B) leukocyte transendothelial migration, (C) disease of the immune system, (D) cytokines and inflammatory response, (E) inflammatory response pathway, (F) IL18 signaling pathway, (G) TNF alpha signaling pathway, and (H) senescence and autophagy in cancer were involved in the pathological process of TLE. The GSEA results showed that immune- and inflammation-related pathways were significantly associated with TLE development.
Immune infiltration analysis
In this study, we performed immune infiltration analysis to identify the immune cell types potentially involved in the pathology of TLE. As shown in Figure 6A, compared to those in the control group, the score of T cells CD4 memory resting and dendritic cells activated were relatively low, while the score of NK cells activated and monocytes were relatively high in the TLE group. The proportions of the 22 types of immunocyte cells were visualized in Figure 6B.
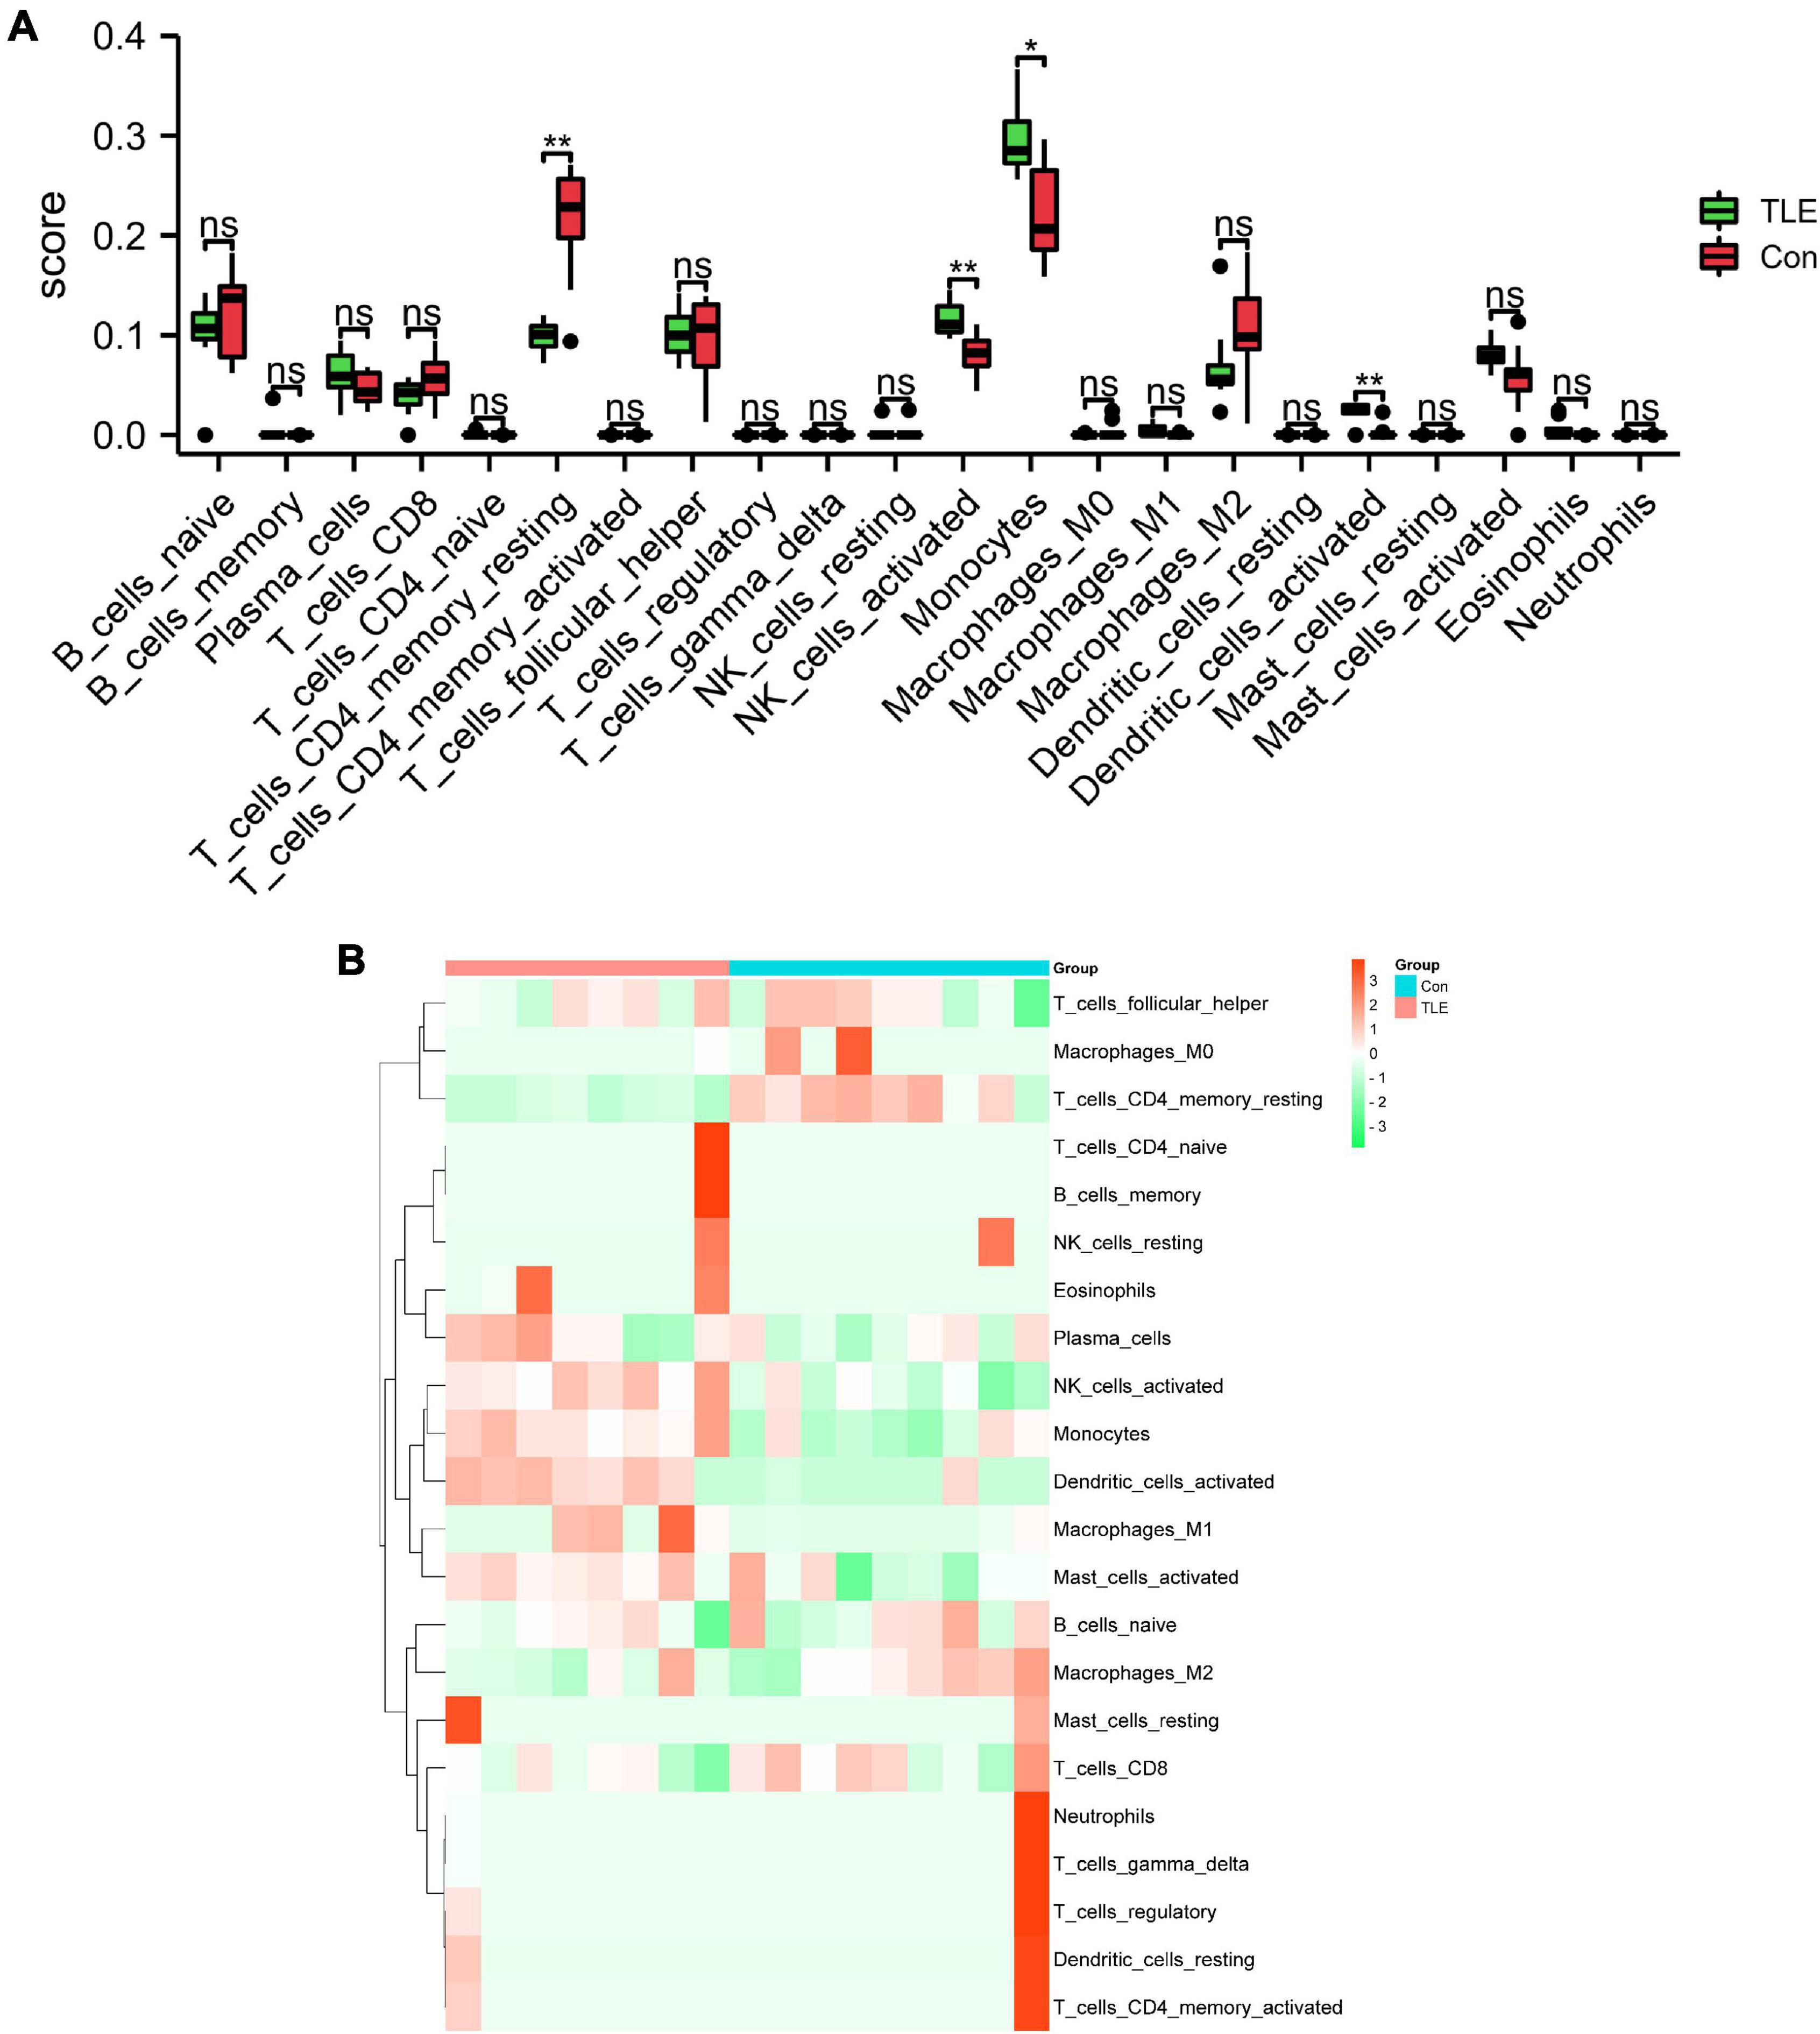
Figure 6. Analysis of immune cell infiltration landscape in TLE. (A) The histogram exhibits the differences in the score of the 22 types of immune cells between the control and TLE group in GSE88992 dataset. (B) Heatmap exhibited distribution of 22 types of immune cells between the control and TLE group in GSE88992 dataset. *P < 0.05, **P < 0.01.
Correlation analysis among Ptgs2, Jun, Icam1, Il6, and immune cells
Our correlation analysis indicated that Icam1 was negatively with macrophages M2 (r = −0.578, p = 0.015) and T cells CD4 memory resting (r = −0.575, p = 0.015), and positively correlated with dendritic cells activated (r = 0.715, p = 0.001), mast cells activated (r = 0.634, p = 0.006), NK cells activated (r = 0.588, p = 0.013), and monocytes (r = 0.558, p = 0.019) (Figure 7A). Il6 was negatively with T cells CD4 memory resting (r = −0.654, p = 0.004), and positively correlated with Dendritic cells activated (r = 0.723, p = 0.001), NK cells activated (r = 0.622, p = 0.007), and Mast cells activated (r = 0.580, p = 0.014) (Figure 7B). Jun was negatively with T cells CD4 memory resting (r = −0.786, p = 0.0002), and positively correlated with Dendritic cells activated (r = 0.822, p = 0.0000), Monocytes (r = 0.634, p = 0.006), and NK cells activated (r = 0.514, p = 0.034) (Figure 7C). Ptgs2 was negatively with T cells CD4 memory resting (r = −0.649, p = 0.004), and positively correlated with Dendritic cells activated (r = 0.705, p = 0.001), Monocytes (r = 0.571, p = 0.016), Mast cells activated (r = 0.571, p = 0.016), and NK cells activated (r = 0.531, p = 0.028) (Figure 7D).
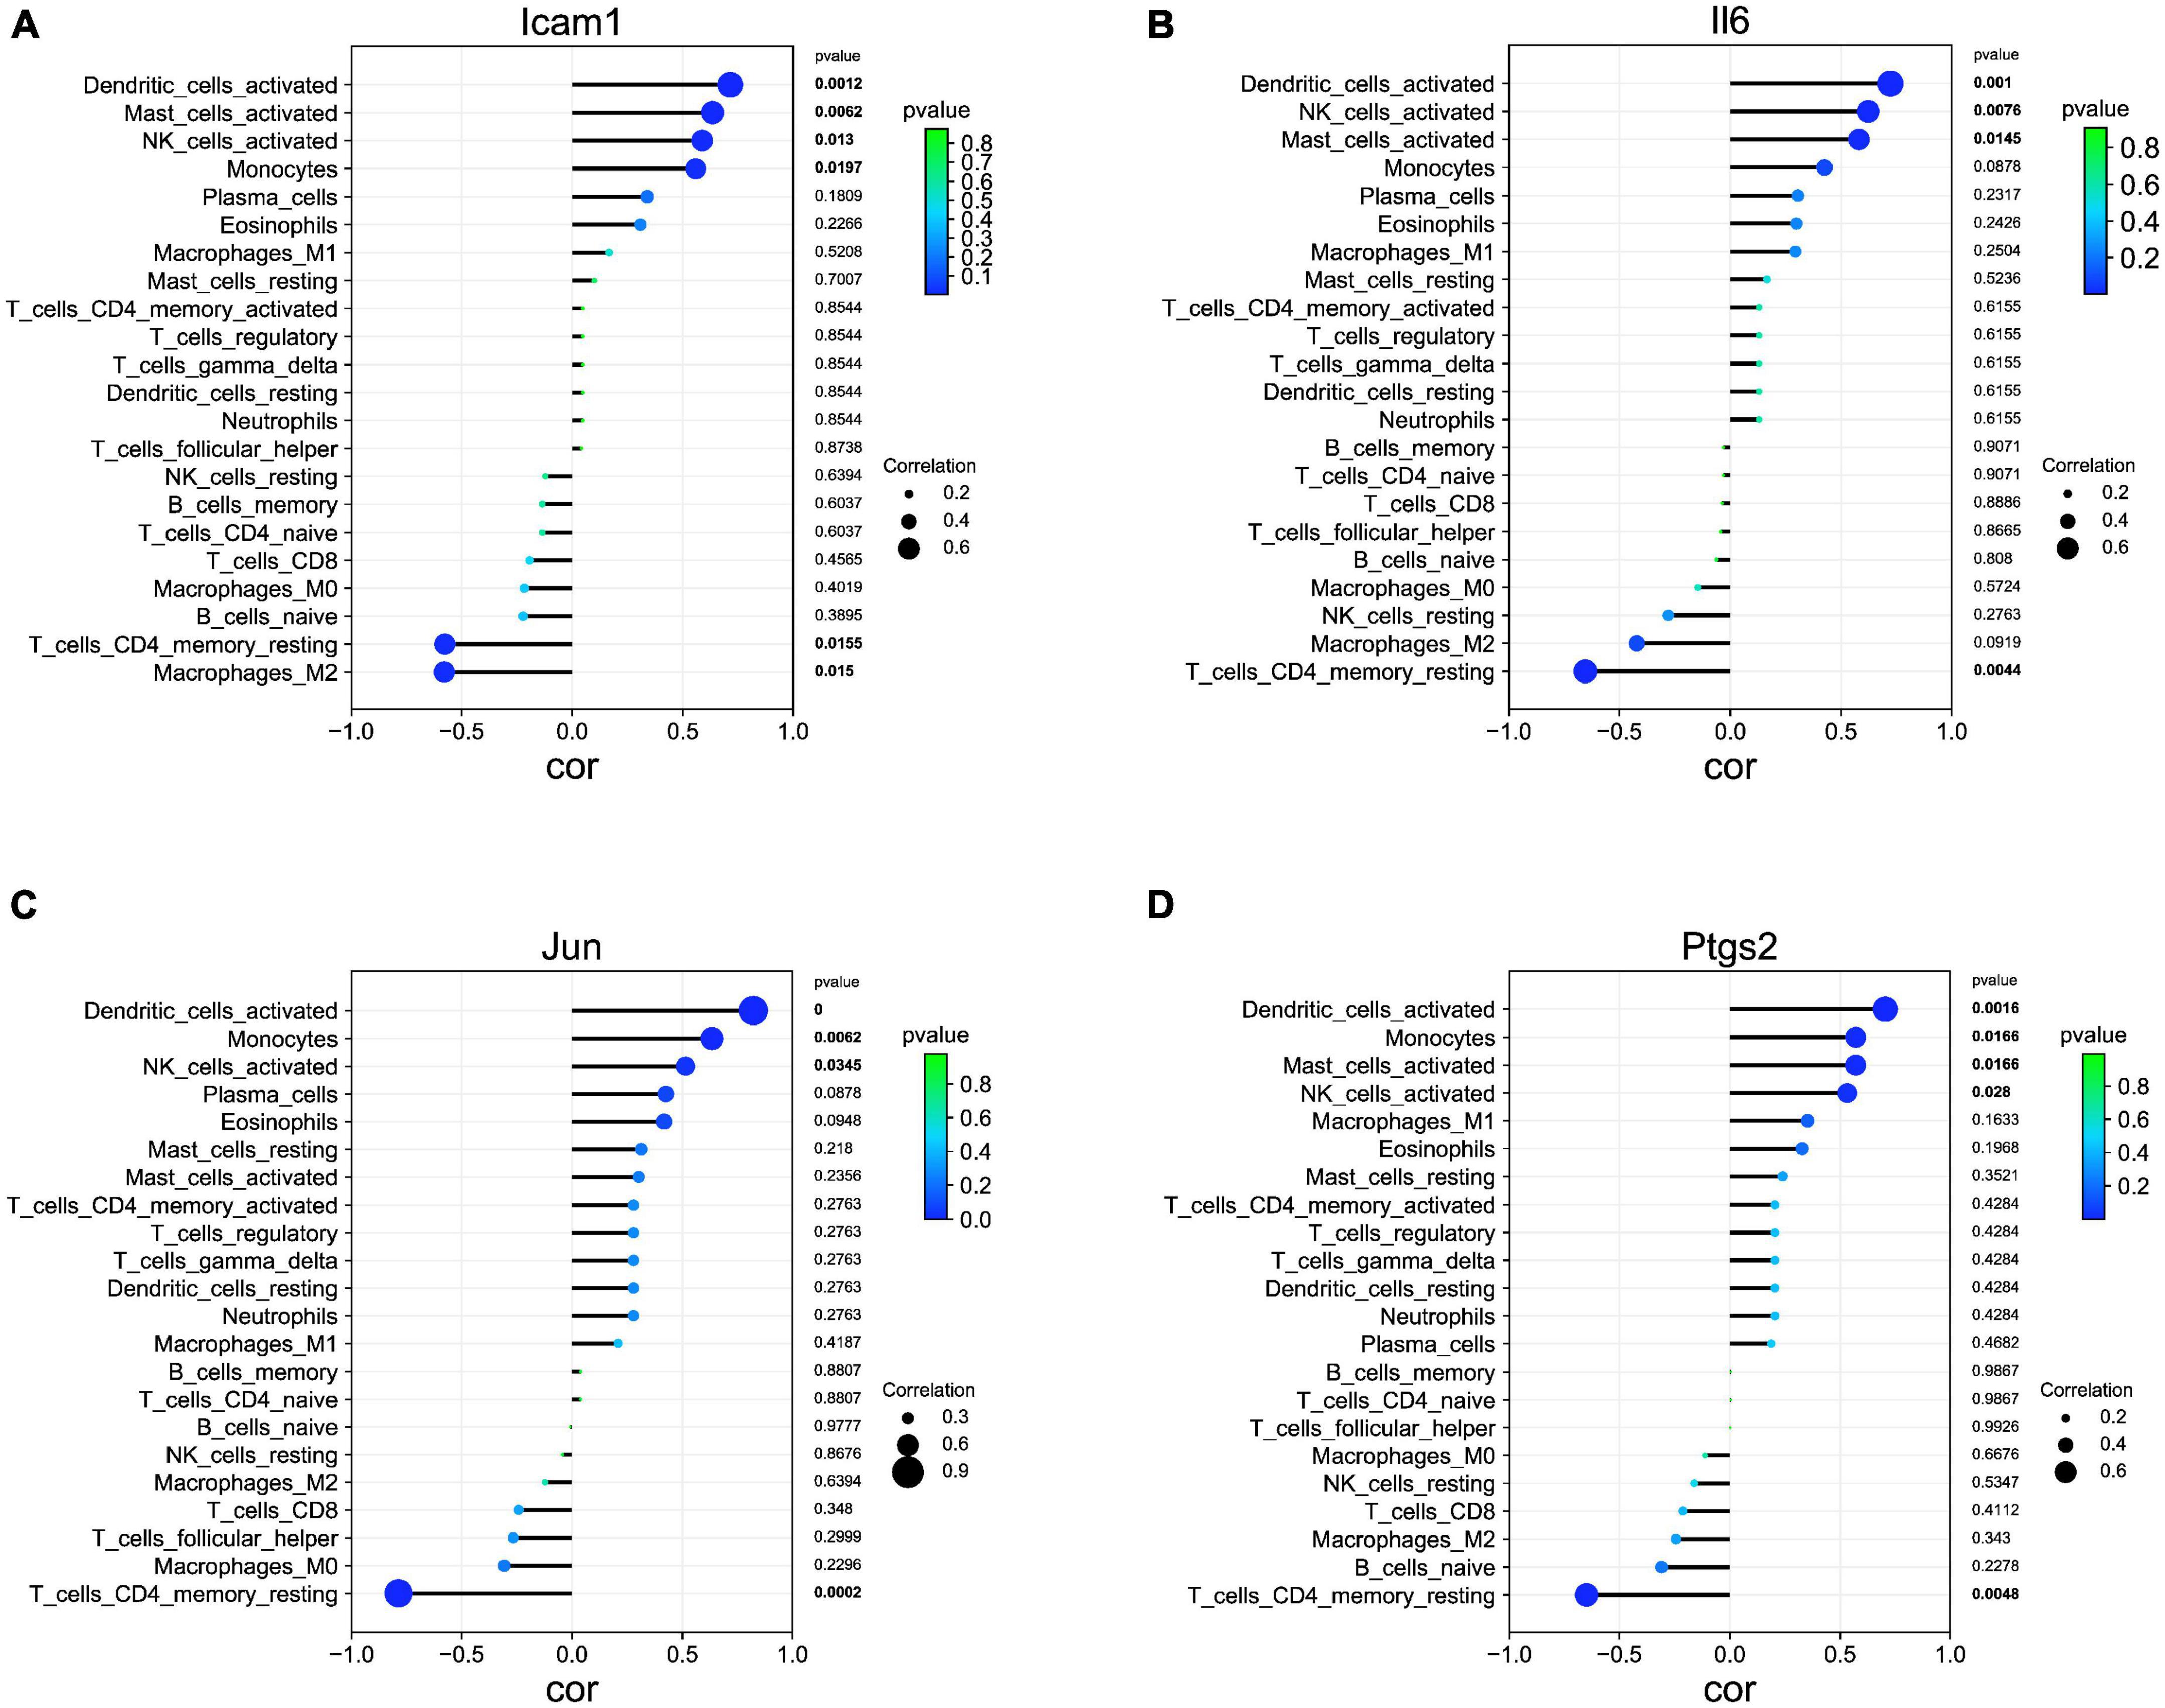
Figure 7. Association of hub genes with immune infiltrates. (A) Correlation between Icam1 and infiltrating immune cells. (B) Correlation between Il6 and infiltrating immune cells. (C) Correlation between Jun and infiltrating immune cells. (D) Correlation between Ptgs2 and infiltrating immune cells.
Hub gene-drug interaction
As shown in Figure 8, we investigated the hub gene-drug interactions of the 31 potential drugs and 4 hub genes for possibly treating TLE. As shown in Table 3, the potential 31 candidate drugs were all approved by FDA. Most of these potential drugs might interact with the Ptgs2 (13/31). Promising drugs of these hub genes included ETORICOXIB, ALICAFORSEN, SILTUXIMAB, OLOKIZUMAB, etc.
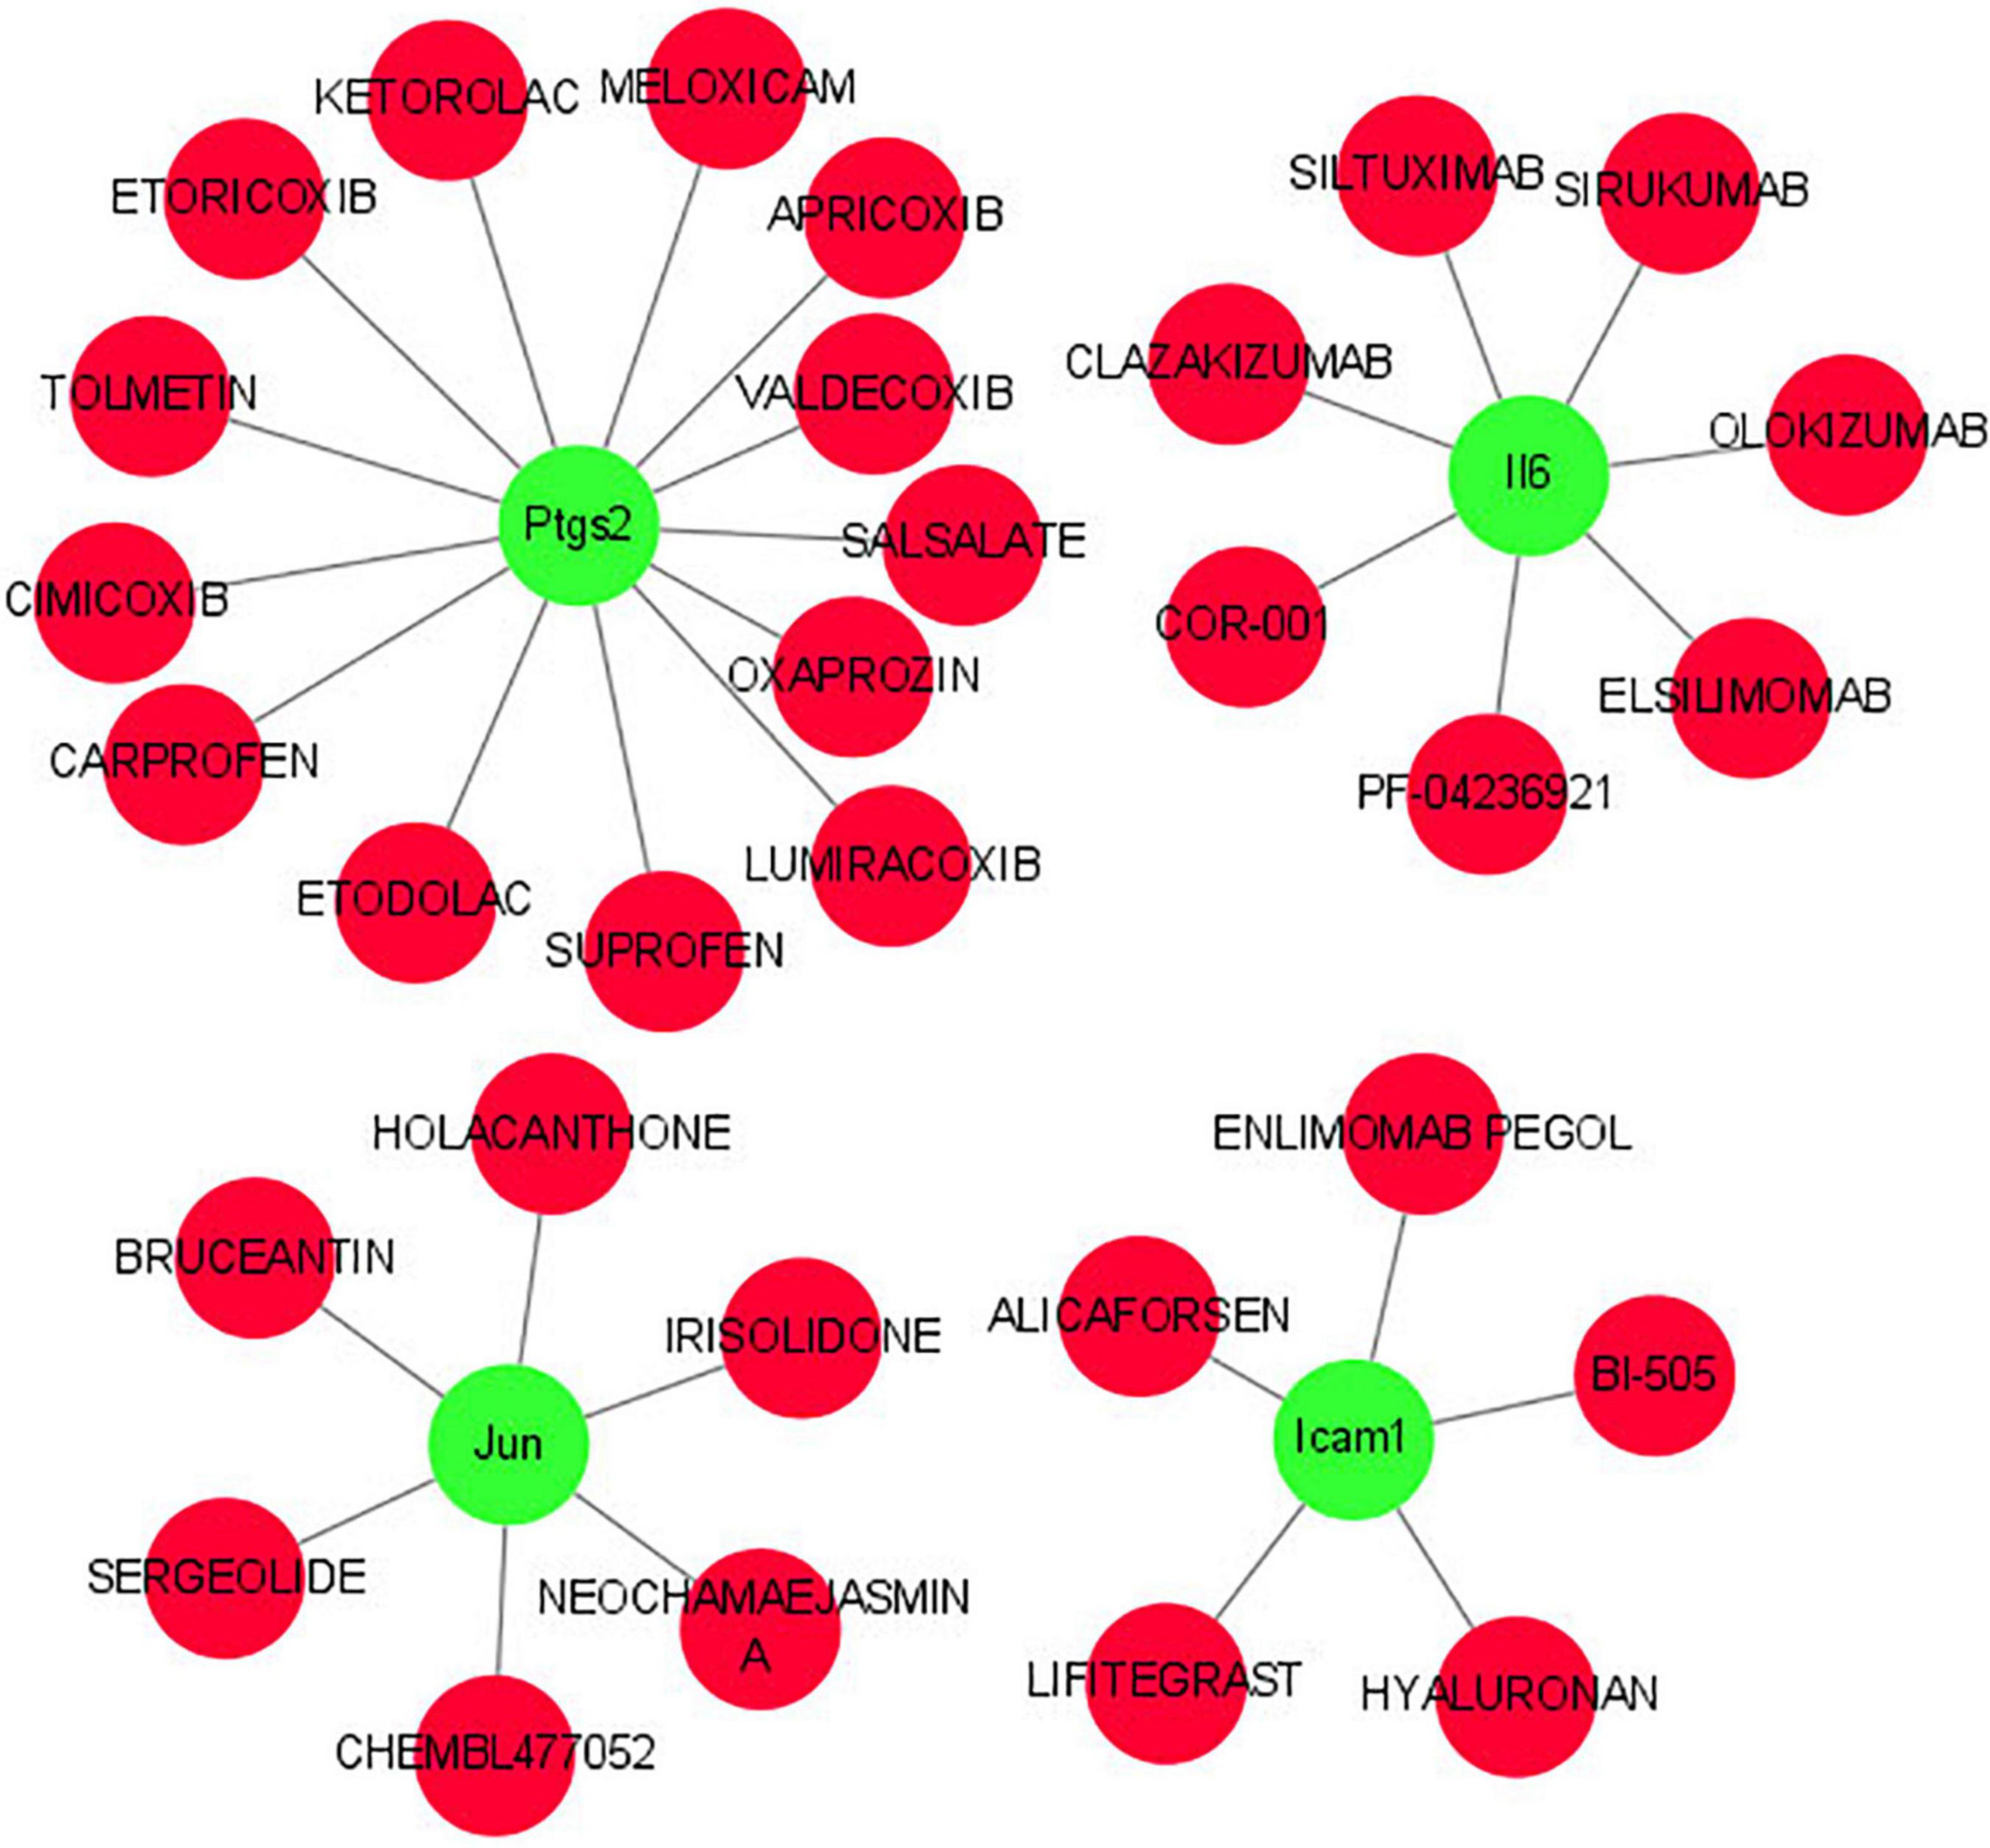
Figure 8. Interaction network between core IRGs and potential drugs. Green nodes represent the hub IRGs (Ptgs2, Jun, Icam1, Il6); red nodes represent the potential drugs for TLE.
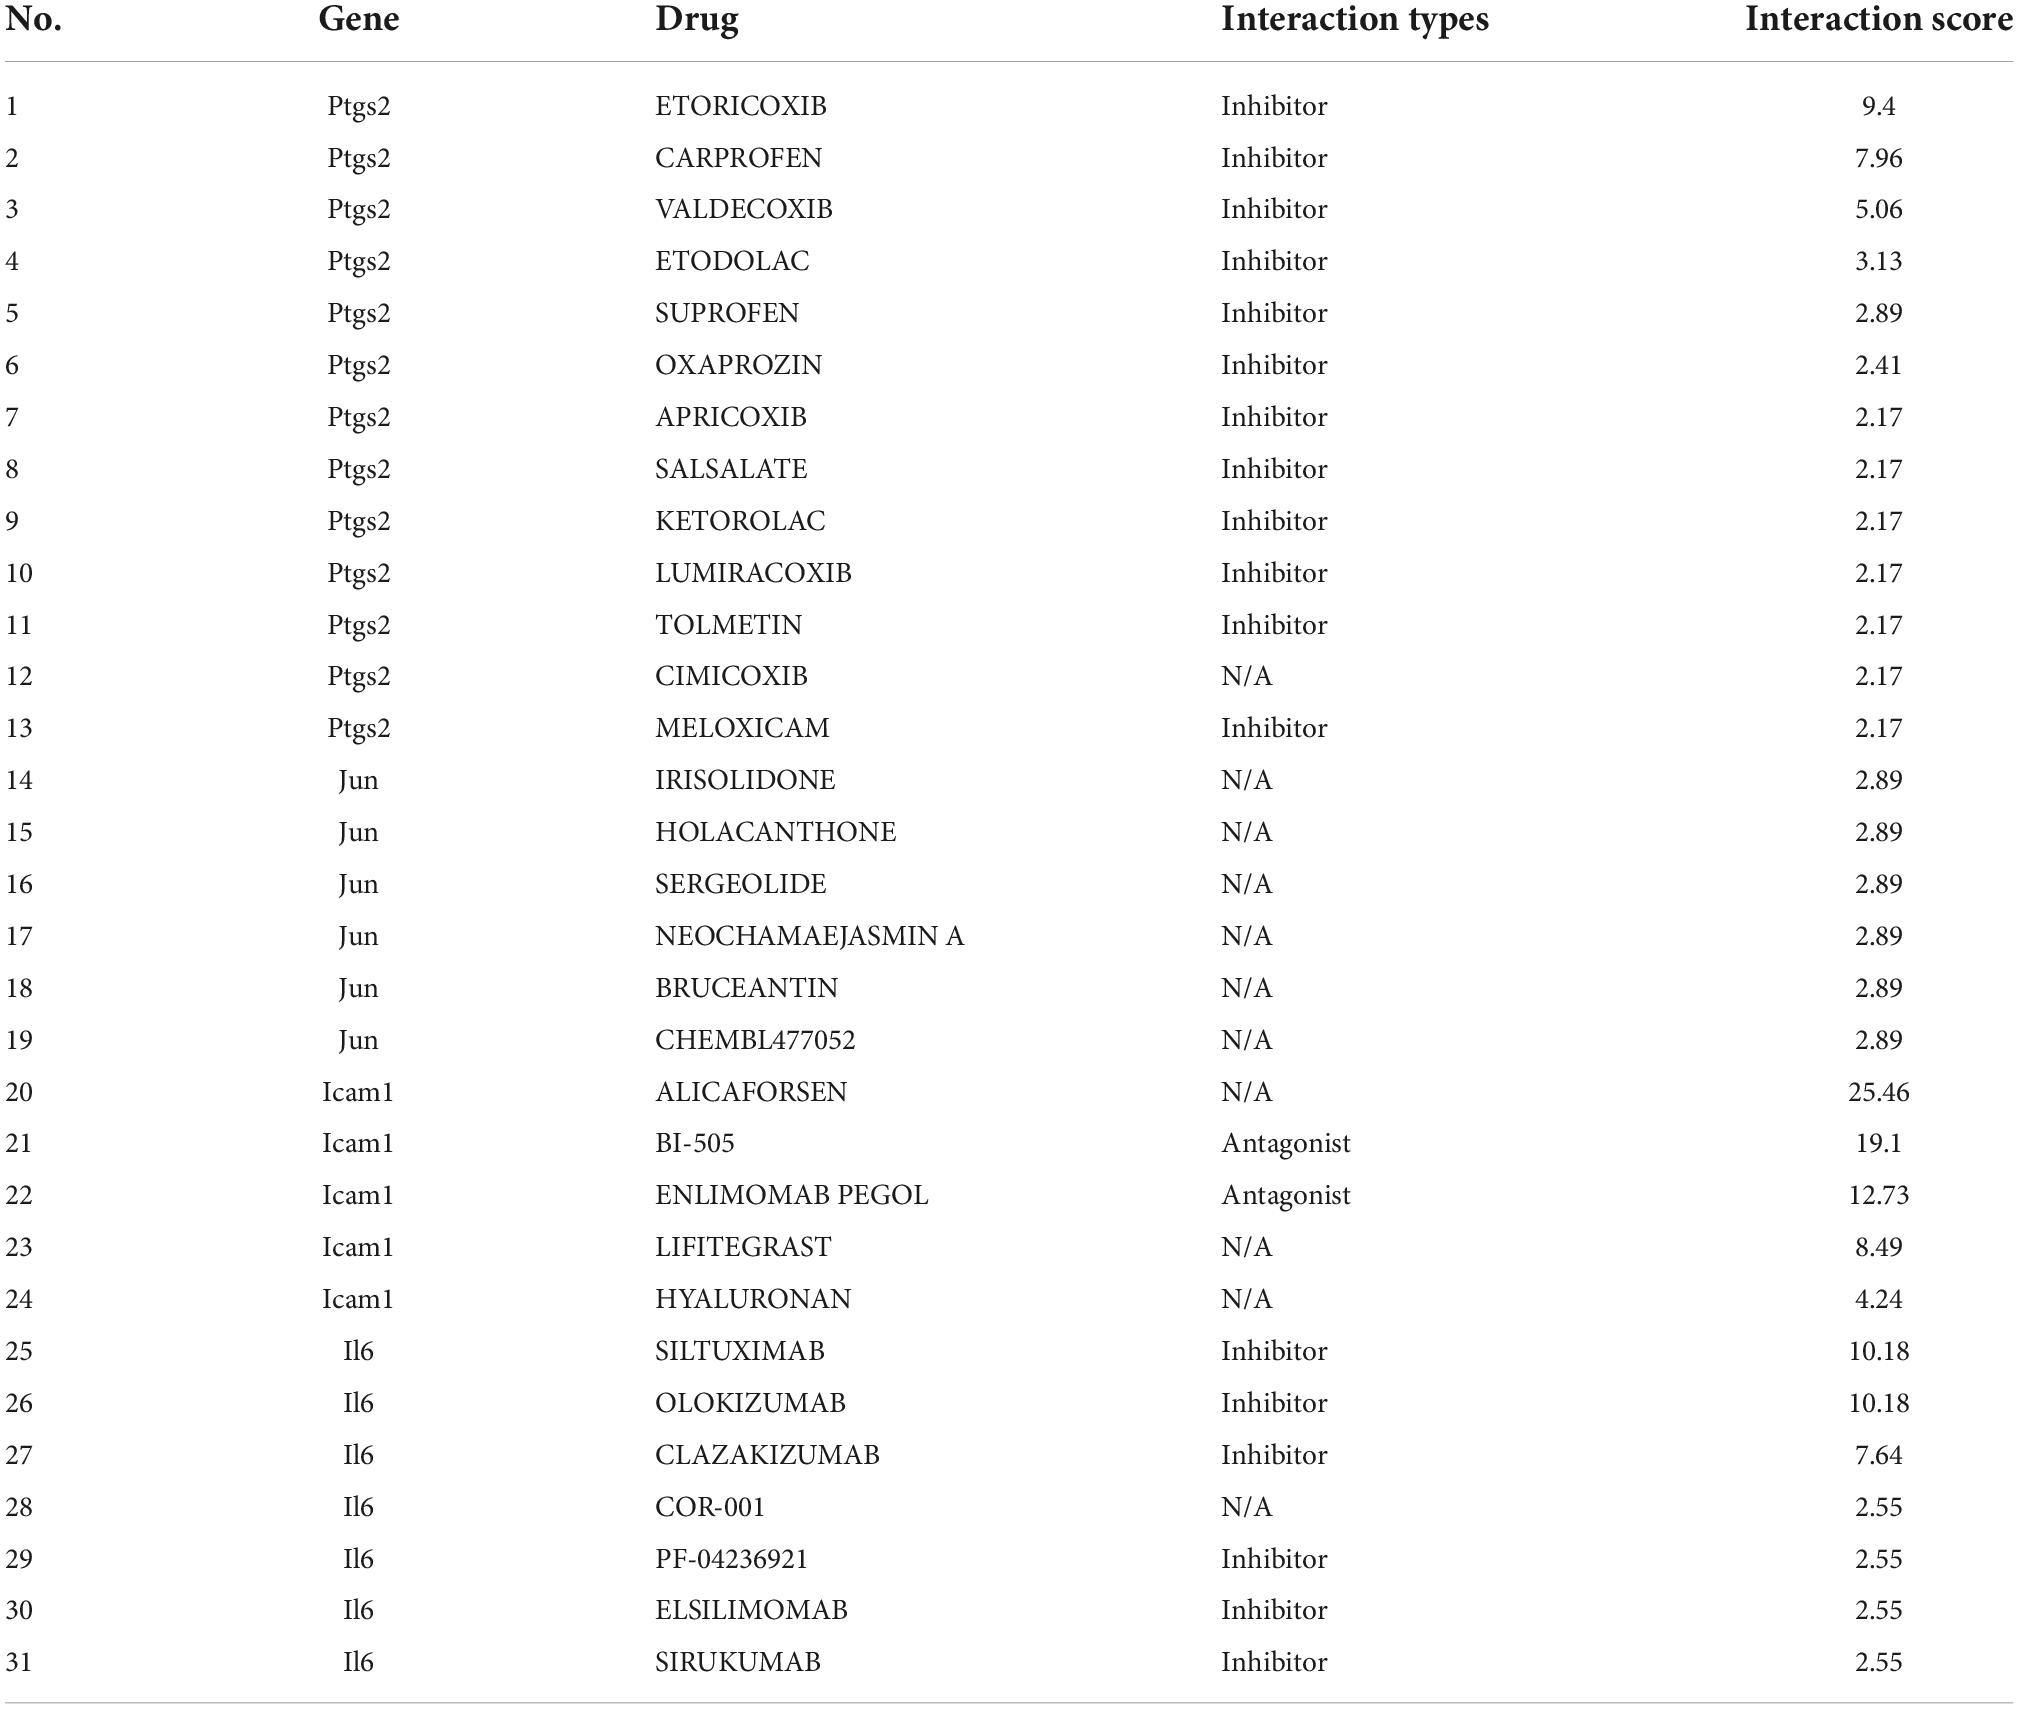
Table 3. Candidate drugs targeted by the hub genes.
Discussion
Epilepsy is a brain disorder characterized by recurrent seizures. Imbalanced regulation of inflammation contributes to epilepsy development (Rana and Musto, 2018). Neuroinflammation is associated with an increased risk for epilepsy in related animal models and humans (Terrone et al., 2020). Increasing evidence indicated that systemic autoimmune disorders are the major pathogenesis of epilepsy (Steriade et al., 2021). Investigating the biological functions of immunity and inflammation in epileptogenesis will help in the identification of novel biomarkers for better screening of patients with epilepsy. Therefore, it is of great importance to further understand the role of IRGs and immune cell infiltration in epilepsy, and thus identify novel therapeutic targets. The present study aimed to systematically assess potential IRGs and investigated the correlations of immune cell infiltration in TLE.
In the present study, we screened 613 DEGs between TLE and the control group via bioinformatics methods. Then, we constructed a weighted co-expression network using WGCNA and identified hub modules for TLE, and four IRGs (Ptgs2, Jun, Icam1, Il6) were identified as hub genes. Besides, the proportions of T cells CD4 memory resting, dendritic cells activated, NK cells activated and monocytes were significant differences between TLE and control group, implying that immune response is involved in the TLE development. Furthermore, our results showed that these four IRGs were associated with immune cell infiltration in TLE, which could guide the selection of immunotherapy in the treatment of TLE.
An important result of this research was that the up-regulation of Ptgs2, Jun, Icam1, and Il6 was closely associated with the development of TLE. Prostaglandin-endoperoxide synthase 2 (Ptgs2) plays an important role in regulating inflammatory responses. It has been reported that Ptgs2 is dynamically regulated during the initiation and resolution of acute inflammation (Hellmann et al., 2015). Besides, down-regulation of peripheral PTGS2 in response to valproate treatment in epileptic (Rawat et al., 2020). Jun is a proto-oncogene, which encoded a variety of key regulatory proteins in the normal tissues. A previous study has indicated that Jun had the potential to serve as a prognostic marker for neuropathic pain (Yang et al., 2018). JUN was identified as a potential biomarker for the prognosis of brain low-grade gliomas (Xu et al., 2020). Besides, the c-JUN-medicated signaling pathway was an important BP involved in the pathogenesis of hippocampal neuronal damage in kainite-induced epilepsy (Lee et al., 2001). Intercellular adhesion molecule 1 (Icam1) is a cell surface glycoprotein that was reported for driving inflammatory responses in the onset of pathologic conditions. For example, increases in soluble Icam1 were associated with inflammatory responses, and some clinical studies used soluble Icam1 as a biomarker to classify patients with inflammatory diseases, as well as non-infectious systemic inflammatory responses syndrome (de Pablo et al., 2013). Icam1 was also reported to play an important role in regulating leukocyte trafficking and transendothelial migration (Kanters et al., 2008). Besides, expression of Icam1 was significantly up-regulated in the hippocampi with hippocampal sclerosis (Nakahara et al., 2010). Interleukin-6 (Il6) is a prototypical proinflammatory cytokine for maintaining homeostasis, and animal experiments showed the involvement of cytokines in epilepsy (Shen et al., 2020). The previous report has revealed that an increased level of IL6 was observed in cerebrospinal fluid and serum from patients with epilepsy (Peltola et al., 1998; Tao et al., 2020). Therefore, we speculated that these hub genes may play an important role in epilepsy.
Accumulating evidence has indicated that the activation of immune responses in the brain may be implicated in epilepsy (Granata et al., 2011). Peripheral immune cell invasion into the brain, along with cerebrovascular dysfunction and neuroinflammation, was implicated in the pathogenesis of epilepsy (Yamanaka et al., 2021). A previous study has reported that leukocytes infiltration in brain tissue is involved in the pathogenesis of TLE (Zattoni et al., 2011). As previously indicated, both microglial proliferation and monocytes recruitment resulted in significant microgliosis following epilepsy (Feng et al., 2019). Besides, infiltrating monocytes play an important role in the pathological process of epilepsy (Bosco et al., 2020). It has been reported that immunodeficient (depletion of T cells CD4) mice exhibited significant shortening of the latent stage before epilepsy onset, suggesting the protective effect of T cells in epileptogenesis (Deprez et al., 2011). Furthermore, compared with the healthy individuals, a significant increase of natural killer (NK) cells, while a significant decrease of CD4 T cells was observed in patients with TLE (Bauer et al., 2008). These results were in agreement with our findings. We also used CIBERSORT to comprehensively assess TLE immune cell infiltration to further investigate the role of immunocyte infiltration in TLE development. In this study, the score of T cells CD4 memory resting and dendritic cells activated were relatively low, while the score of NK cells activated and monocytes was relatively high in the TLE group. Moreover, the correlation analysis between Ptgs2, Jun, Icam1, Il6, and immune cells indicated that all these hub gene expressions were positively correlated with NK cells activated and negatively correlated with T cells CD4 memory resting. These findings further indicated the importance of immunocyte infiltration in the pathogenesis of TLE. We speculated that up-regulation of Ptgs2, Jun, Icam1, and Il6 contributes to NK cells activated infiltration and inhibits T cells CD4 memory resting infiltration, and subsequently results in the development of TLE. However, these results require additional in vivo or in vitro experiments to prove the complex interactions between hub genes and immunocyte infiltration.
Conclusion
In conclusion, the present study combined WGCNA and DEG analyses to identify potential genes (Ptgs2, Jun, Icam1, and Il6) associated with specific immune cells involved in TLE development. Up-regulation of Ptgs2, Jun, Icam1, and Il6 contributes to TLE development via regulation of T cells CD4 and NK cells. Our findings provided a novel insight into the immunocyte infiltration pattern of TLE and its potential immune regulatory mechanisms.
Data availability statement
The datasets presented in this study can be found in online repositories. The names of the repository/repositories and accession number(s) can be found below: https://www.ncbi.nlm.nih.gov/geo/, GSE88992 and GSE60772.
Ethics statement
The animal study was reviewed and approved by the Animal Care Committee of Army Medical University.
Author contributions
LW took part in drafting the manuscript. CD made substantial contributions to conception and design. RW and LC performed data analysis and interpretation of data. YW revised it critically for important intellectual content and gave final approval of the version to be published. All authors have read and agreed to the published version of the manuscript.
Conflict of interest
The authors declare that the research was conducted in the absence of any commercial or financial relationships that could be construed as a potential conflict of interest.
Publisher’s note
All claims expressed in this article are solely those of the authors and do not necessarily represent those of their affiliated organizations, or those of the publisher, the editors and the reviewers. Any product that may be evaluated in this article, or claim that may be made by its manufacturer, is not guaranteed or endorsed by the publisher.
Supplementary material
The Supplementary Material for this article can be found online at: https://www.frontiersin.org/articles/10.3389/fnins.2022.996368/full#supplementary-material
Supplementary Figure 1 | Construction of WGCNA modules. (A) Dendrogram of all genes clustered based on a dissimilarity measure. (B) Heatmap of the eigengene adjacency. (C) Heatmap of the module-trait relationships. (D) Scatter plot for correlation analysis between gene significance and gene module membership in the blue module. (E) Scatter plot for correlation analysis between gene significance and gene module membership in the turquoise module.
Footnotes
- ^ https://www.ncbi.nlm.nih.gov/
- ^ https://www.genecards.org/
- ^ https://string-db.org
- ^ http://www.dgidb.org/
References
Allone, C., Lo Buono, V., Corallo, F., Pisani, L. R., Pollicino, P., Bramanti, P., et al. (2017). Neuroimaging and cognitive functions in temporal lobe epilepsy: A review of the literature. J. Neurol. Sci. 381, 7–15.
Ambrogini, P., Torquato, P., Bartolini, D., Albertini, M. C., Lattanzi, D., Di Palma, M., et al. (2019). Excitotoxicity, neuroinflammation and oxidant stress as molecular bases of epileptogenesis and epilepsy-derived neurodegeneration: The role of vitamin E. Biochim. Biophys. Acta 1865, 1098–1112. doi: 10.1016/j.bbadis.2019.01.026
Araki, T., Ikegaya, Y., and Koyama, R. (2020). Microglia attenuate the kainic acid-induced death of hippocampal neurons in slice cultures. Neuropsychopharmacol. Rep. 40, 85–91. doi: 10.1002/npr2.12086
Bauer, S., Köller, M., Cepok, S., Todorova-Rudolph, A., Nowak, M., Nockher, W. A., et al. (2008). NK and CD4+ T cell changes in blood after seizures in temporal lobe epilepsy. Exp. Neurol. 211, 370–377. doi: 10.1016/j.expneurol.2008.01.017
Bosco, D. B., Tian, D. S., and Wu, L. J. (2020). Neuroimmune interaction in seizures and epilepsy: Focusing on monocyte infiltration. FEBS J. 287, 4822–4837. doi: 10.1111/febs.15428
Chin, C. H., Chen, S. H., Wu, H. H., Ho, C. W., Ko, M. T., and Lin, C. Y. (2014). cytoHubba: Identifying hub objects and sub-networks from complex interactome. BMC Syst. Biol. 8(Suppl. 4):S11. doi: 10.1186/1752-0509-8-S4-S11
de Pablo, R., Monserrat, J., Reyes, E., Díaz, D., Rodríguez-Zapata, M., de la Hera, A., et al. (2013). Circulating sICAM-1 and sE-Selectin as biomarker of infection and prognosis in patients with systemic inflammatory response syndrome. Eur. J. Intern. Med. 24, 132–138.
Deprez, F., Zattoni, M., Mura, M. L., Frei, K., and Fritschy, J. M. (2011). Adoptive transfer of T lymphocytes in immunodeficient mice influences epileptogenesis and neurodegeneration in a model of temporal lobe epilepsy. Neurobiol. Dis. 44, 174–184. doi: 10.1016/j.nbd.2011.06.011
Eastman, C. L., D’Ambrosio, R., and Ganesh, T. (2020). Modulating neuroinflammation and oxidative stress to prevent epilepsy and improve outcomes after traumatic brain injury. Neuropharmacology 172:107907. doi: 10.1016/j.neuropharm.2019.107907
Englot, D. J., Morgan, V. L., and Chang, C. (2020). Impaired vigilance networks in temporal lobe epilepsy: Mechanisms and clinical implications. Epilepsia 61, 189–202.
Falsaperla, R., Pavone, P., Miceli Sopo, S., Mahmood, F., Scalia, F., Corsello, G., et al. (2014). Epileptic seizures as a manifestation of cow’s milk allergy: A studied relationship and description of our pediatric experience. Expert Rev. Clin. Immunol. 10, 1597–1609. doi: 10.1586/1744666X.2014.977259
Feng, L., Murugan, M., Bosco, D. B., Liu, Y., Peng, J., Worrell, G. A., et al. (2019). Microglial proliferation and monocyte infiltration contribute to microgliosis following status epilepticus. Glia 67, 1434–1448. doi: 10.1002/glia.23616
Granata, T., Cross, H., Theodore, W., and Avanzini, G. (2011). Immune-mediated epilepsies. Epilepsia 52(Suppl. 3), 5–11.
Hellmann, J., Tang, Y., Zhang, M. J., Hai, T., Bhatnagar, A., Srivastava, S., et al. (2015). Atf3 negatively regulates Ptgs2/Cox2 expression during acute inflammation. Prostaglandins Other Lipid Mediat. 11, 49–56. doi: 10.1016/j.prostaglandins.2015.01.001
Hermann, B. P., Seidenberg, M., Dow, C., Jones, J., Rutecki, P., Bhattacharya, A., et al. (2006). Cognitive prognosis in chronic temporal lobe epilepsy. Ann. Neurol. 60, 80–87.
Johnson, E. A., Dao, T. L., Guignet, M. A., Geddes, C. E., Koemeter-Cox, A. I., and Kan, R. K. (2011). Increased expression of the chemokines CXCL1 and MIP-1α by resident brain cells precedes neutrophil infiltration in the brain following prolonged soman-induced status epilepticus in rats. J. Neuroinflammation 8:41. doi: 10.1186/1742-2094-8-41
Kanters, E., van Rijssel, J., Hensbergen, P. J., Hondius, D., Mul, F. P., Deelder, A. M., et al. (2008). Filamin B mediates ICAM-1-driven leukocyte transendothelial migration. J. Biol. Chem. 283, 31830–31839. doi: 10.1074/jbc.M804888200
Keary, T. A., Frazier, T. W., Busch, R. M., Kubu, C. S., and Iampietro, M. (2007). Multivariate neuropsychological prediction of seizure lateralization in temporal epilepsy surgical cases. Epilepsia 48, 1438–1446.
Khamse, S., Sadr, S. S., Roghani, M., Hasanzadeh, G., and Mohammadian, M. (2015). Rosmarinic acid exerts a neuroprotective effect in the kainate rat model of temporal lobe epilepsy: Underlying mechanisms. Pharma. Biol. 53, 1818–1825. doi: 10.3109/13880209.2015.1010738
Langfelder, P., and Horvath, S. (2008). WGCNA: An R package for weighted correlation network analysis. BMC Bioinformatics 9:559. doi: 10.1186/1471-2105-9-559
Lee, M. C., Rho, J. L., Kim, M. K., Woo, Y. J., Kim, J. H., Nam, S. C., et al. (2001). c-JUN expression and apoptotic cell death in kainate-induced temporal lobe epilepsy. J. Korean Med. Sci. 16, 649–656. doi: 10.3346/jkms.2001.16.5.649
Lex, A., Gehlenborg, N., Strobelt, H., Vuillemot, R., and Pfister, H. (2014). UpSet: Visualization of intersecting sets. IEEE Trans. Vis. Comput. Graph. 20, 1983–1992.
Matin, N., Tabatabaie, O., Falsaperla, R., Lubrano, R., Pavone, P., Mahmood, F., et al. (2015). Epilepsy and innate immune system: A possible immunogenic predisposition and related therapeutic implications. Hum. Vaccines Immunother. 11, 2021–2029. doi: 10.1080/21645515.2015.1034921
Nakahara, H., Konishi, Y., Beach, T. G., Yamada, N., Makino, S., and Tooyama, I. (2010). Infiltration of T lymphocytes and expression of icam-1 in the hippocampus of patients with hippocampal sclerosis. Acta Histochem. Cytochem. 43, 157–162. doi: 10.1267/ahc.10022
Newman, A. M., Liu, C. L., Green, M. R., Gentles, A. J., Feng, W., Xu, Y., et al. (2015). Robust enumeration of cell subsets from tissue expression profiles. Nat. Methods 12, 453–457.
Okuneva, O., Li, Z., Körber, I., Tegelberg, S., Joensuu, T., Tian, L., et al. (2016). Brain inflammation is accompanied by peripheral inflammation in Cstb (-/-) mice, a model for progressive myoclonus epilepsy. J. Neuroinflammation 13:298. doi: 10.1186/s12974-016-0764-7
Paudel, Y. N., Shaikh, M. F., Shah, S., Kumari, Y., and Othman, I. (2018). Role of inflammation in epilepsy and neurobehavioral comorbidities: Implication for therapy. Eur. J. Pharmacol. 837, 145–155. doi: 10.1016/j.ejphar.2018.08.020
Peltola, J., Hurme, M., Miettinen, A., and Keränen, T. (1998). Elevated levels of interleukin-6 may occur in cerebrospinal fluid from patients with recent epileptic seizures. Epilepsy Res. 31, 129–133. doi: 10.1016/s0920-1211(98)00024-2
Radu, B. M., Epureanu, F. B., Radu, M., Fabene, P. F., and Bertini, G. (2017). Nonsteroidal anti-inflammatory drugs in clinical and experimental epilepsy. Epilepsy Res. 131, 15–27.
Rana, A., and Musto, A. E. (2018). The role of inflammation in the development of epilepsy. J. Neuroinflammation 15:144. doi: 10.1186/s12974-018-1192-7
Rawat, C., Kutum, R., Kukal, S., Srivastava, A., Dahiya, U. R., Kushwaha, S., et al. (2020). Downregulation of peripheral PTGS2/COX-2 in response to valproate treatment in patients with epilepsy. Sci. Rep. 10:2546. doi: 10.1038/s41598-020-59259-x
Shen, W., Poliquin, S., Macdonald, R. L., Dong, M., and Kang, J. Q. (2020). Endoplasmic reticulum stress increases inflammatory cytokines in an epilepsy mouse model Gabrg2(+/Q390X) knockin: A link between genetic and acquired epilepsy? Epilepsia 61, 2301–2312. doi: 10.1111/epi.16670
Steriade, C., Titulaer, M. J., Vezzani, A., Sander, J. W., and Thijs, R. D. (2021). The association between systemic autoimmune disorders and epilepsy and its clinical implications. Brain 144, 372–390.
Suleymanova, E. M. (2021). Behavioral comorbidities of epilepsy and neuroinflammation: Evidence from experimental and clinical studies. Epilepsy Behav. 117:107869. doi: 10.1016/j.yebeh.2021.107869
Tang, H., and Wang, X. (2021). PD-1 is an immune-inflammatory potential biomarker in cerebrospinal fluid and serum of intractable epilepsy. Biomed Res. Int. 2021:7973123. doi: 10.1155/2021/7973123
Tao, H., Gong, Y., Yu, Q., Zhou, H., and Liu, Y. (2020). Elevated serum matrix metalloproteinase-9, interleukin-6, hypersensitive C-reactive protein, and homocysteine levels in patients with epilepsy. J. Interferon Cytokine Res. 40, 152–158. doi: 10.1089/jir.2019.0137
Terrone, G., Balosso, S., Pauletti, A., Ravizza, T., and Vezzani, A. (2020). Inflammation and reactive oxygen species as disease modifiers in epilepsy. Neuropharmacology 167:107742.
Tragante, V., Gho, J., Felix, J. F., Vasan, R. S., Smith, N. L., Voight, B. F., et al. (2017). Gene Set Enrichment Analyses: Lessons learned from the heart failure phenotype. BioData Min. 10:18. doi: 10.1186/s13040-017-0137-5
Vezzani, A., Balosso, S., and Ravizza, T. (2019). Neuroinflammatory pathways as treatment targets and biomarkers in epilepsy. Nat. Rev. Neurol. 15, 459–472.
Vitaliti, G., Pavone, P., Mahmood, F., Nunnari, G., and Falsaperla, R. (2014). Targeting inflammation as a therapeutic strategy for drug-resistant epilepsies: An update of new immune-modulating approaches. Hum. Vaccines Immunother. 10, 868–875. doi: 10.4161/hv.28400
Wang, H., Liu, S., Tang, Z., and Liu, J. (2014). Some cross-talks between immune cells and epilepsy should not be forgotten. Neurol. Sci. 35, 1843–1849. doi: 10.1007/s10072-014-1955-6
Xu, J., Sun, M., Wang, Y., Xie, A., and Gao, J. (2020). Identification of hub genes of mesio temporal lobe epilepsy and prognostic biomarkers of brain low-grade gliomas based on bioinformatics analysis. Cell Transplant. 29:963689720978722. doi: 10.1177/0963689720978722
Yamanaka, G., Morichi, S., Takamatsu, T., Watanabe, Y., Suzuki, S., Ishida, Y., et al. (2021). Links between immune cells from the periphery and the brain in the pathogenesis of epilepsy: A narrative review. Int. J. Mol. Sci. 22:4395. doi: 10.3390/ijms22094395
Yang, J. A., He, J. M., Lu, J. M., and Jie, L. J. (2018). Jun, Gal, Cd74, and C1qb as potential indicator for neuropathic pain. J. Cell. Biochem. 119, 4792–4798. doi: 10.1002/jcb.26673
Yu, G., Wang, L. G., Han, Y., and He, Q. Y. (2012). clusterProfiler: An R package for comparing biological themes among gene clusters. Omics 16, 284–287. doi: 10.1089/omi.2011.0118
Keywords: temporal lobe epilepsy, PPI, WGCNA, immunocyte infiltration, neuroinflammatory, kainite
Citation: Wang L, Duan C, Wang R, Chen L and Wang Y (2022) Inflammation-related genes and immune infiltration landscape identified in kainite-induced temporal lobe epilepsy based on integrated bioinformatics analysis. Front. Neurosci. 16:996368. doi: 10.3389/fnins.2022.996368
Received: 27 July 2022; Accepted: 06 October 2022;
Published: 27 October 2022.
Edited by:
Kai Hu, Xiangya Hospital, Central South University, ChinaReviewed by:
Liemin Zhou, Seventh Affiliated Hospital, Sun Yat-sen University, ChinaJian He, Xiangya Hospital, Central South University, China
Copyright © 2022 Wang, Duan, Wang, Chen and Wang. This is an open-access article distributed under the terms of the Creative Commons Attribution License (CC BY). The use, distribution or reproduction in other forums is permitted, provided the original author(s) and the copyright owner(s) are credited and that the original publication in this journal is cited, in accordance with accepted academic practice. No use, distribution or reproduction is permitted which does not comply with these terms.
*Correspondence: Yue Wang, wangyue22004@126.com
†These authors have contributed equally to this work