Feature optimization based on improved novel global harmony search algorithm for motor imagery electroencephalogram classification
 Bin Shi
 Xiaokai Chen2
  Benguo Wang
 Jing Wang
- 1Xi’an Research Institute of High-Technology, Xi’an, Shaanxi, China
- 2Rehabilitation Medical Center, Huizhou Third People’s Hospital, Huizhou, China
- 3Institute of Robotics and Intelligent System, School of Mechanical Engineering, Xi’an Jiaotong University, Xi’an, China
- 4iHarbour Academy of Frontier Equipment (iAFE), Xi’an, China
- 5Department of Rehabilitation Medicine, Longgang District People’s Hospital of Shenzhen, Shenzhen, China
- 6Department of Rehabilitation Medicine, The Second Affiliated Hospital of The Chinese University of Hong Kong, Shenzhen, China
Background: Effectively decoding electroencephalogram (EEG) pattern for specific mental tasks is a crucial topic in the development of brain-computer interface (BCI). Extracting common spatial pattern (CSP) features from motor imagery EEG signals is often highly dependent on the selection of frequency band and time interval. Therefore, optimizing frequency band and time interval would contribute to effective feature extraction and accurate EEG decoding.
Objective: This study proposes an approach based on an improved novel global harmony search (INGHS) to optimize frequency-time parameters for effective CSP feature extraction.
Methods: The INGHS algorithm is applied to find the optimal frequency band and temporal interval. The linear discriminant analysis and support vector machine are used for EEG pattern decoding. Extensive experimental studies are conducted on three EEG datasets to assess the effectiveness of our proposed method.
Results: The average test accuracy obtained by the time-frequency parameters selected by the proposed INGHS method is slightly better than artificial bee colony (ABC) and particle swarm optimization (PSO) algorithms. Furthermore, the INGHS algorithm is superior to PSO and ABC in running time.
Conclusion: These superior experimental results demonstrate that the optimal frequency band and time interval selected by the INGHS algorithm could significantly improve the decoding accuracy compared with the traditional CSP method. This method has a potential to improve the performance of MI-based BCI systems.
Introduction
A brain-computer interface (BCI) system is utilized to sense and transform the electroencephalogram (EEG) signal from the scalp into commands to control external devices and help users to accomplish tasks (Wolpaw, 2002; Cervera et al., 2018; Lazarou et al., 2018; Xu et al., 2018, 2021; Mudgal et al., 2020; Rashid et al., 2020). The EEG is commonly used for brain analysis (Nicolas-Alonso and Gomez-Gil, 2012). A large number of researchers pay more attention to the research of BCI based on motor imagery (MI). The mechanism of EEG-based MI-BCI is that the subject can autonomously regulate the sensorimotor rhythm (SMR) through performing the MI task (Pfurtscheller et al., 1993, 2006). The SMR is characterized by power changes in specific frequency bands (8–30) over the sensorimotor cortex. The modulation of SMR generates contralateral preponderant event-related desynchronization (ERD) and synchronization (ERS), which are short lasting attenuation and enhancements of SMR. It is generally accepted that ERD/ERS happens in the different spatial-frequency-temporal domains when different subjects execute MI task, causing difficulty in extracting effective features (Hamedi et al., 2016; Li et al., 2019; Jiao et al., 2020).
A standard BCI system comprises a signal acquisition unit, signal processing unit, controlling unit, and application or feedback unit. The signal processing unit further includes three parts, namely, preprocessing, feature extraction, and feature classification. The effective feature extraction method is very important for the recognition of MI intention (Rasheed, 2021). Various feature extraction techniques are used for the feature extraction of EEG-based MI, such as Principal Component Analysis (PCA) (Mirzaei and Ghasemi, 2021), Wavelet Transform (WT) (Sreeja et al., 2017), Fast Fourier Transform (FFT) (Chaudhary et al., 2019), and Common Spatial Pattern (CSP) (Miao et al., 2017b). Currently, the CSP is one of the most popular feature extraction methods which can effectively extract the spatial information of ERD/ERS (Siuly and Li, 2015). However, due to the influence of nonstationary in EEG and inherent defects of the CSP objective function, the spatial filters, and their corresponding features are not necessarily optimal in the feature space used within CSP. On the one hand, internal feature selection method of CSP based on L1-norm and Dempster–Shafer theory was proposed to result in a significant increase in the performance of MI-based BCI systems (Jin et al., 2021). On the other hand, the selection of frequency band and time interval has a great influence on the CSP features. Under the same experimental paradigm, the most reactive frequency band and response time interval of different subjects performing the MI are distinct (Ramoser and Muller-Gerking, 2000). It is demonstrated that the classification performance of the BCI system could be enhanced through the selection of the distinguishable frequency band, maximum discriminative time interval, and high-separability power channels for specific participants (Ince et al., 2009).
The main study for the select of frequency band and temporal interval focuses on the following aspects. (1) Frequency band optimizing: the sub-band common spatial pattern (SBCSP) was reported (Quadrianto et al., 2007). Mutual information-based feature selection method was employed to select distinguishable pairs of frequency bands in filter bank common spatial pattern (FBCSP) algorithm that yields superior classification performance compared with CSP and SBCSP (Kai et al., 2008). Discriminative filter bank common spatial pattern (DFBCSP) was reported to extract the optimal frequency band by means of fisher ratio and achieved better classification accuracy (Thomas et al., 2009). A sparse filter band common spatial pattern (SFBCSP) was introduced to optimize the frequency domain (Zhang et al., 2015). (2) Temporal domain optimizing: the novel correlation-based time window selection (CTWS) algorithm was applied for MI-based BCIs, and the results indicate that compared to the classical CSP method, the CTWS algorithm significantly enhanced the average classification accuracy of healthy participants and stroke survivors (Feng et al., 2018). (3) Frequency-temporal optimizing: the frequency-time synthesis optimizing method for the MI-based BCI system was reported to adapt to the individual difference (Tao et al., 2004). The local discriminant bases algorithm was proposed to find the starting time of the ERD/ERS in the sub-band of the EEG (Ince et al., 2007). Fisher discriminant analysis-type F-score approach was developed to simultaneously optimize the frequency-time domain for multi-class classification (Yang et al., 2017).
All these mentioned works have demonstrated that optimizing frequency band or time interval could contribute to yield better classification results. However, most of the studies aim to find the optimal time-frequency parameters in multiple sub-bands and time intervals based on the same bandwidth and time window length. The fixed bandwidth and time window length is not individual variability. Furthermore, although most of the proposed algorithms can automatically optimize the frequency band and time interval, they are independent of each other in the selection process. Since the optimal CSP features are determined by the mutual influence of both frequency and time parameters, the above sequential select procedure method is not the optimal solution in terms of finding the optimal frequency band and time interval. In essence, it might be the best choice to select simultaneously frequency-temporal parameters in the optimization process so that the CSP features obtained by the optimal frequency-time parameters can enhance the classification performance for MI-based BCI systems. Recently, some meta-heuristic algorithms were introduced to optimize frequency-temporal parameters. The particle swarm optimization (PSO) algorithm was utilized to select the optimal frequency and time parameters to extract the effective CSP features (Xu et al., 2014). The artificial bee colony (ABC) algorithm was proposed to solve the frequency-temporal optimization problem (Miao et al., 2017a). However, most of these algorithms require complex operations when creating an offspring. Moreover, these algorithms have many options for parameters and need a relatively long run time to find the global optimal solution.
Harmony search (HS) algorithm was firstly proposed in 2001 (Geem et al., 2001). Since then, HS and its variants have been reported and widely applied to various optimization problems (Mahdavi et al., 2007; Omran and Mahdavi, 2008; Zou et al., 2010). An improved novel global harmony search algorithm (INGHS) was proposed (Ouyang et al., 2015) and the results indicate that the INGHS algorithm performs better than PSO and ABC algorithms in solving the reliability optimization problem. INGHS algorithm has been successfully applied to data clustering and engineering design optimization problems (Ouyang et al., 2018; Talaei et al., 2020). To sum up, the iterative updating principle of INGHS is simpler than PSO and ABC, with faster convergence and better performance. The PSO and ABC algorithms can find good time-frequency parameters in the application of BCI system, but the time cost is high. Therefore, in our work, the INGHS algorithm is introduced in this article to solve the combined frequency-time optimization problem for more accurate MI-related EEG classification. Extracting CSP features from MI EEG signals is often highly dependent on the selection of frequency band and time interval. The CSP features obtained with fixed frequency band and time interval might affect the classification performance of MI-based BCI systems. To address the above drawbacks, the contribution of this work is:
1. Propose an approach based on an INGHS to optimize frequency-time parameters for effective CSP feature extraction.
2. Conduct a set of experiments validating the effectiveness of the proposed method.
3. Compared with PSO and ABC, INGHS algorithm can converge to the global optimal solution faster, so it is helpful for specific subjects to find the optimal time interval and frequency band in the actual offline experiment in a shorter time, thus shortening the offline calibration time.
Therefore, the rest of the article is organized as follows. The applied datasets and methods are described in section “Methods and materials.” Then, in the section “Results and discussion,” we describe the results of channel selection, test classification comparison, analysis of frequency-temporal parameters optimization, and computational time comparison. Finally, this study is summarized in section “Conclusion.”
Methods and materials
Electroencephalogram data description
(1) Data 1: The first dataset was from the BCI Competition IV dataset 1. The EEG signals of seven subjects (“a” to “g”) at 59 EEG electrodes were recorded. The calibration data consisting of 200 trials for each subject was utilized in this study. In each trial, cue show a duration of 4 s, during which each subject performed the corresponding MI (right hand and left hand or foot) tasks. The original data are downsampled to 100 Hz. The timeline of a trial is illustrated in Figure 1A. More details can be found in the following website: http://www.bbci.de/competition/iv/.
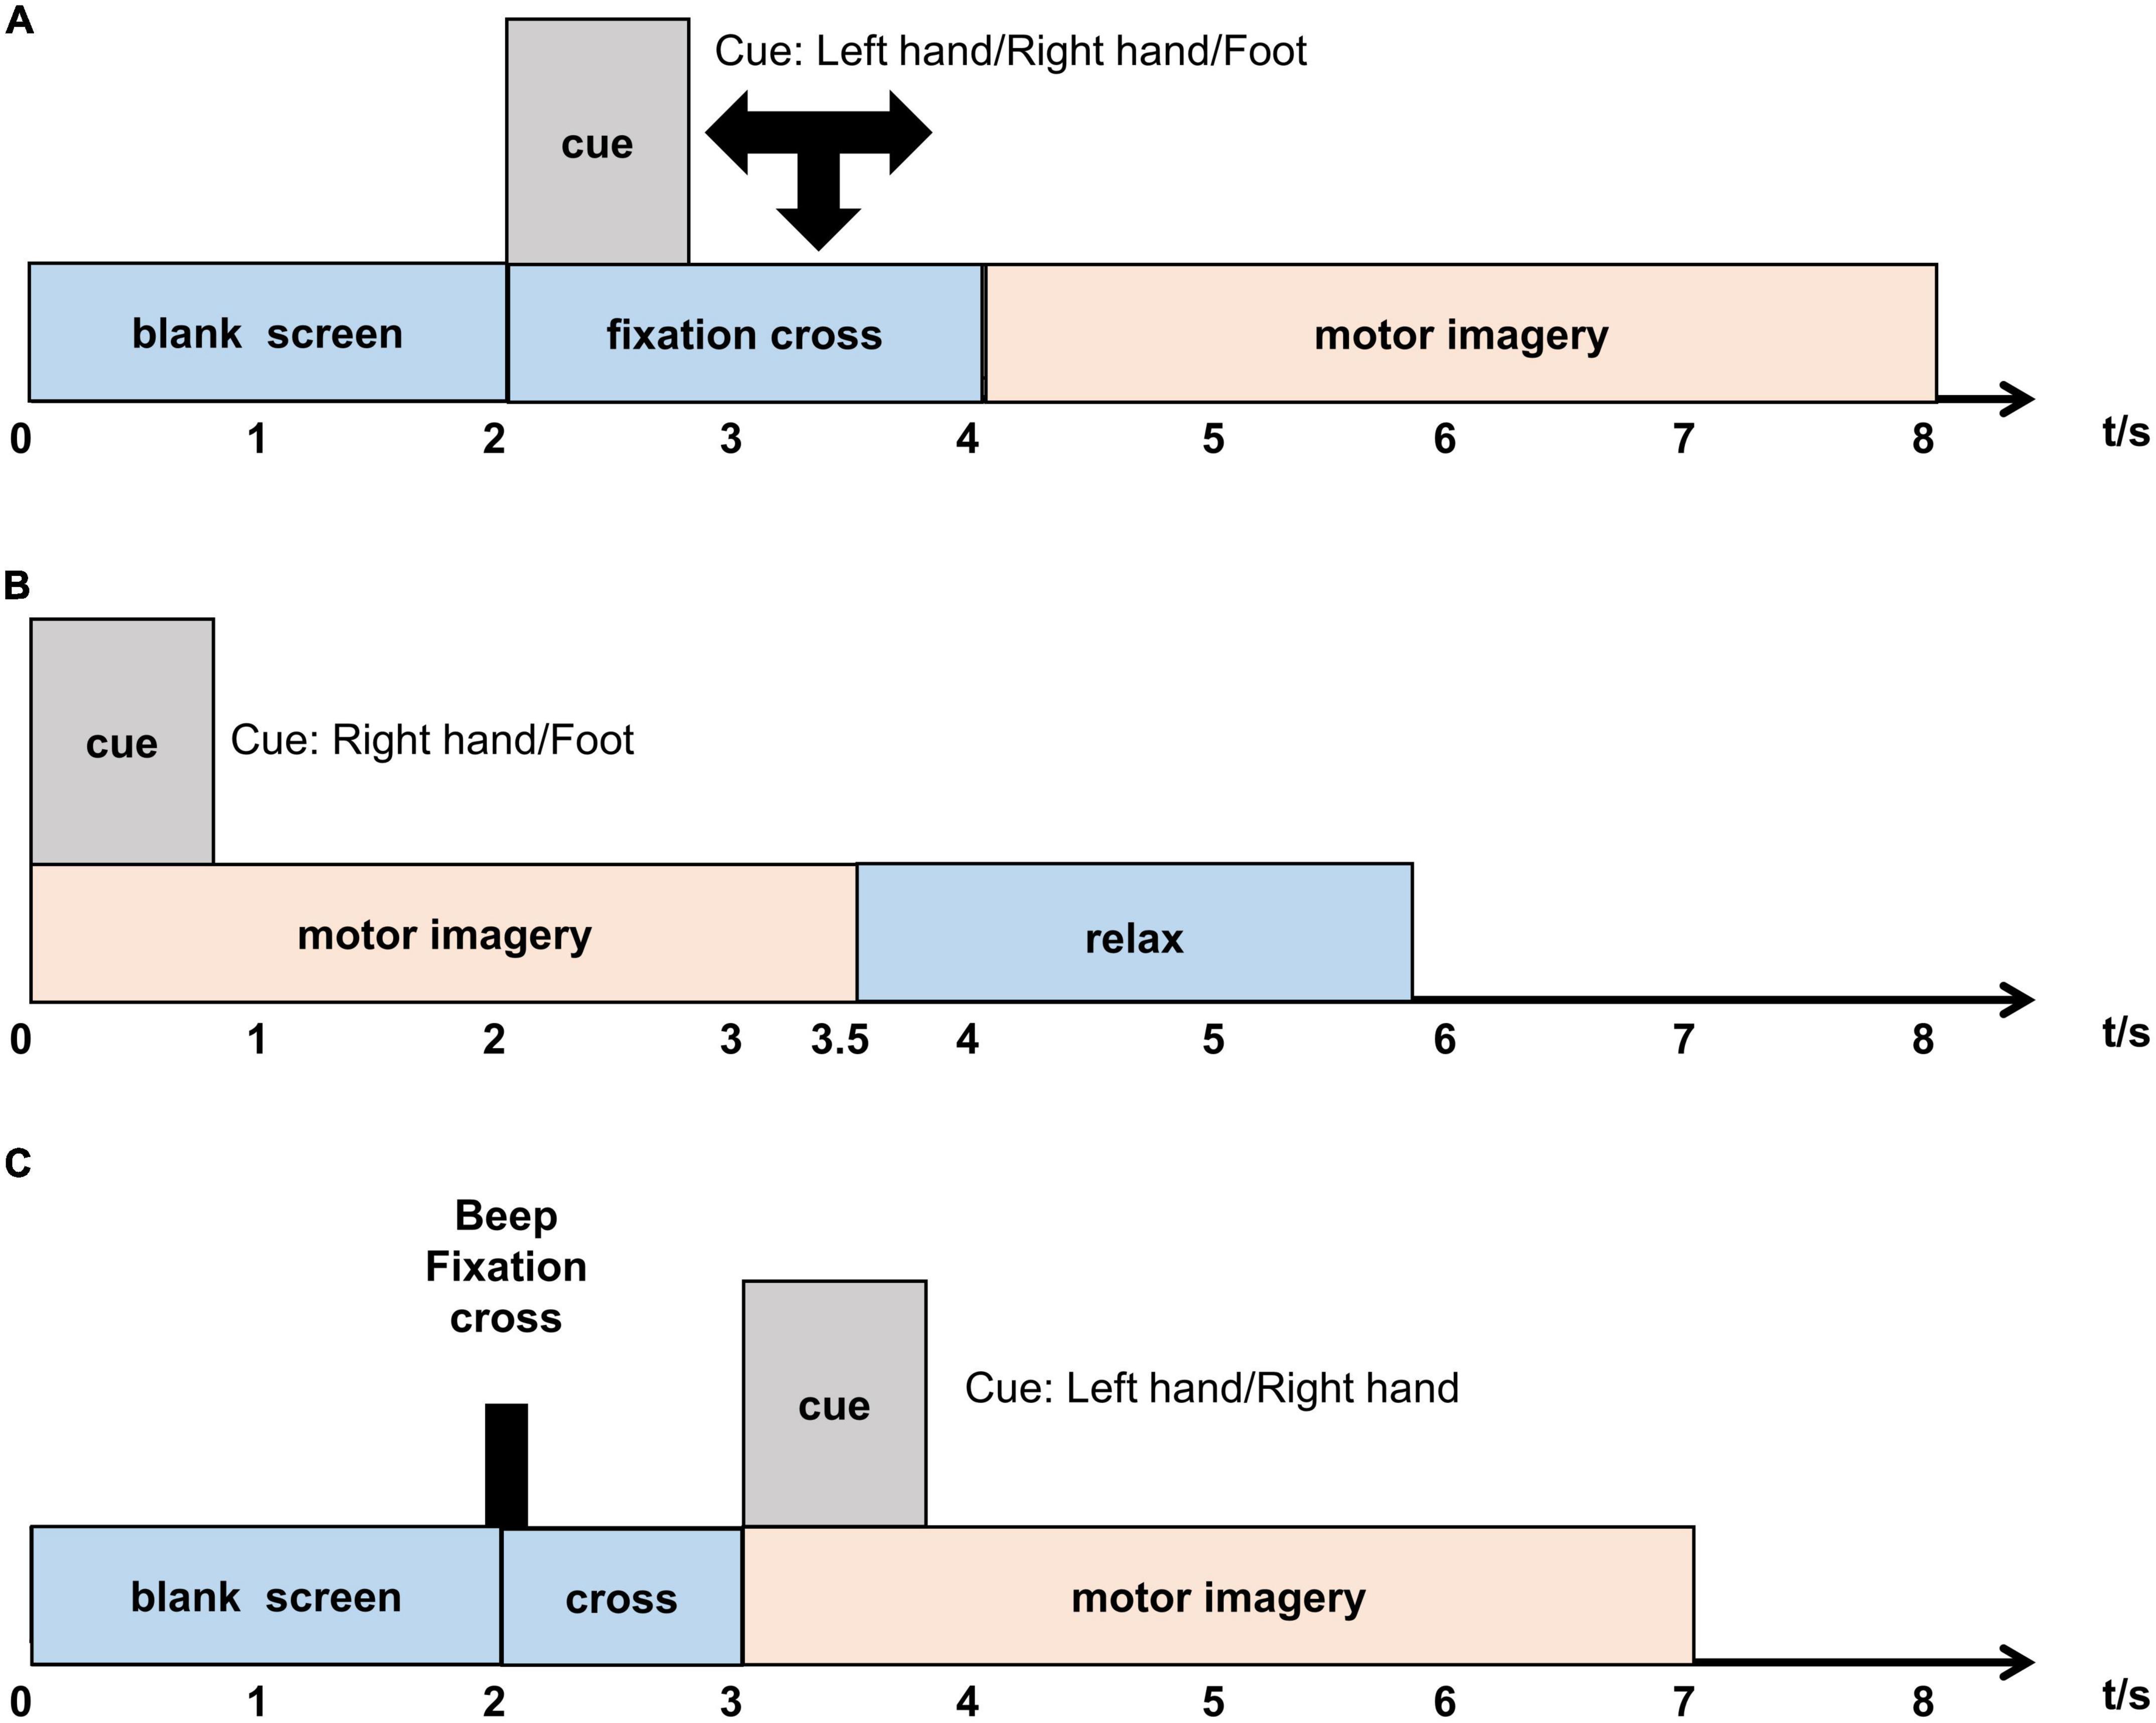
Figure 1. (A–C) Timeline of a trial of three datasets.
(2) Data 2: We used the BCI Competition III dataset IVa for the experimental study. Five healthy participants (“aa” to “ay”) from 118 EEG electrodes were recorded in this dataset. The data are downsampled to 100 Hz. In each trial, cues show a duration of 3.5 s, during which each subject performed the corresponding MI (right hand and right foot) tasks. The timeline of a trial is shown in Figure 1B. More details can be found in the following website: http://www.bbci.de/competition/iii/.
(3) Data 3: The third dataset was from the BCI Competition III dataset IIIa. The EEG signals of three subjects were recorded in this dataset at 64 electrodes but the competition received data of only 60 electrodes. Only the EEG data of left-hand and right-hand are employed in this study due to the binary classification. During each run, the first 2 s were quiet and a cross was displayed at t = 2 s. Then from t = 3–7 s, the subject executed the imagery task. The sampling rate is 250 Hz and have different numbers of trials for each subject in this study. The subjects are “k3b” (90), “k6b” (60), and “l1b” (60). The timeline of a trial is illustrated in Figure 1C. More details can be found in the following website: http://www.bbci.de/competition/iii/.
Data preprocessing and channel selection
At first, the continuous EEG data from three datasets are divided into single-trial data and then common average reference (CAR) is applied for the spatial filter to enhance the signal-to-noise ratio (Mcfarland et al., 1997). Moreover, the EEG data are filtered by using a fifth-order Butterworth band-pass filter from 5 to 40 Hz (Miao et al., 2017a).
The channel selection method could not only remove the irrelevant and redundant channels but also reduce the calculation cost for the subsequent time-frequency parameter optimization to obtain better classification performance (He et al., 2013). The discriminative power of each channel is calculated by Fisher’s discriminative criteria (FDC) value between the two classes. First of all, time segmentation is conducted by using rectangular time windows (100 points) and the length of signal (250 points) for datasets 1 (100 Hz × 4 s) and dataset IVa (100 Hz × 3.5 s), and dataset IIIa (250 Hz × 4 s), respectively. The 50% overlapping is used in neighboring t-segments for three datasets. For single-channel, Pch,t = log(var(xch,t)) is calculated as the feature of each segment, where xch,t is signal data of t-segment of channel ch, and Pch,t denotes log-power. Then, the FDC value between two classes is , where m1 and m2 are means of Pch,t of all trials in two classes. and denote log-power of two classes, respectively. Finally, the maximum FDC of all t-segments is taken as the FDC value of each channel. The FDC values of all channels are arranged in descending order. In the set of FDC values, the first K corresponding channels are taken as the optimal channels in this study. K denotes the number of the selected channels.
Feature extraction and classification
The CSP is a feature extraction method that projects multichannel EEG signals from the two classes into a subspace and decomposes them into different spatial patterns (He et al., 2010; Alvarez-Meza et al., 2015; Nicolas-Alonso et al., 2015; Wang et al., 2020; Mladenović et al., 2022). The CSP algorithm maximizes the difference between classes by simultaneously diagonalizing the covariance matrix and is described as follows:
The e-th MI EEG data could be represented as , where n is the number of electrodes. Xd, d ∈ {1,2} denotes the EEG data of class 1 or class 2. The normalized average covariance matrix of class 1 and class 2 are calculated as:
where N is the number of trials for EEG data in a class. Then, the covariance space consists of mean covariance matrices of the two classes. The eigendecomposition of Cc can be expressed as . P is the whitening matrix: . Define and . Then, R1 is calculated by Rd = BλdBT. B is the orthogonal matrix and λd is a diagonal matrix. If R1 = Bλ1BT, then R2 = Bλ2BT, and λ1 + λ2 = I. When the λ1 is closer to I, the λ2 is closer to 0. Thus, the difference between the two classes is the largest. The projection matrix W is calculated as: W = BTP. The Xe is projected onto Z = WXe. The number of features is 2m and m = 1 in this study. The features fp, could be calculated as follows:
In this article, linear discriminant analysis (LDA) and a Radial Basis Function (RBF) kernel-based support vector machine (SVM) are used as classification methods (Jin et al., 2019; Jin et al., 2020; Mladenović et al., 2022). The MATLAB Toolbox (LIBSVM) is used in this study for classification (Chang and Lin, 2011).
Improved novel global harmony search algorithm
Inspired by the music improvisation process, Geem proposed a new meta-heuristic optimization algorithm called harmony search (HS) (Geem et al., 2001). The novel global harmony search algorithm (NGHS) was proposed based on the idea of swarm intelligence of particle swarm (Zou et al., 2010). The NGHS algorithm first initializes the problem and parameters including genetic mutation probability (Pm), maximum iteration number, and harmony memory size (HMS). Then position updates and low-probability genetic mutations are used to produce a new harmony. Finally, no matter whether the new harmony is better than the worst harmony in the harmony memory (HM), the new harmony would replace the worst harmony. If the predetermined termination criterion is not met, the above process is repeated. However, the purpose of the position update operation is to move the worst harmony in the HM to the best harmony in each iteration in the NGHS algorithm, which can easily result in premature convergence. Moreover, the algorithm has never considered that other harmony solutions except for the worst harmony can improvise better harmony in each iteration. Therefore, an INGHS algorithm was proposed to boost the quality of the solution and keep the NGHS algorithm from falling into local optimal solution (Ouyang et al., 2015). The INGHS algorithm proposed a coefficient of optimization opportunity, which can dynamically adjust to keep a balance between the exploitation and exploration to enhance the local search ability and accelerate the convergence rate of algorithm. Figure 2 presents the flow chart of the INGHS algorithm.
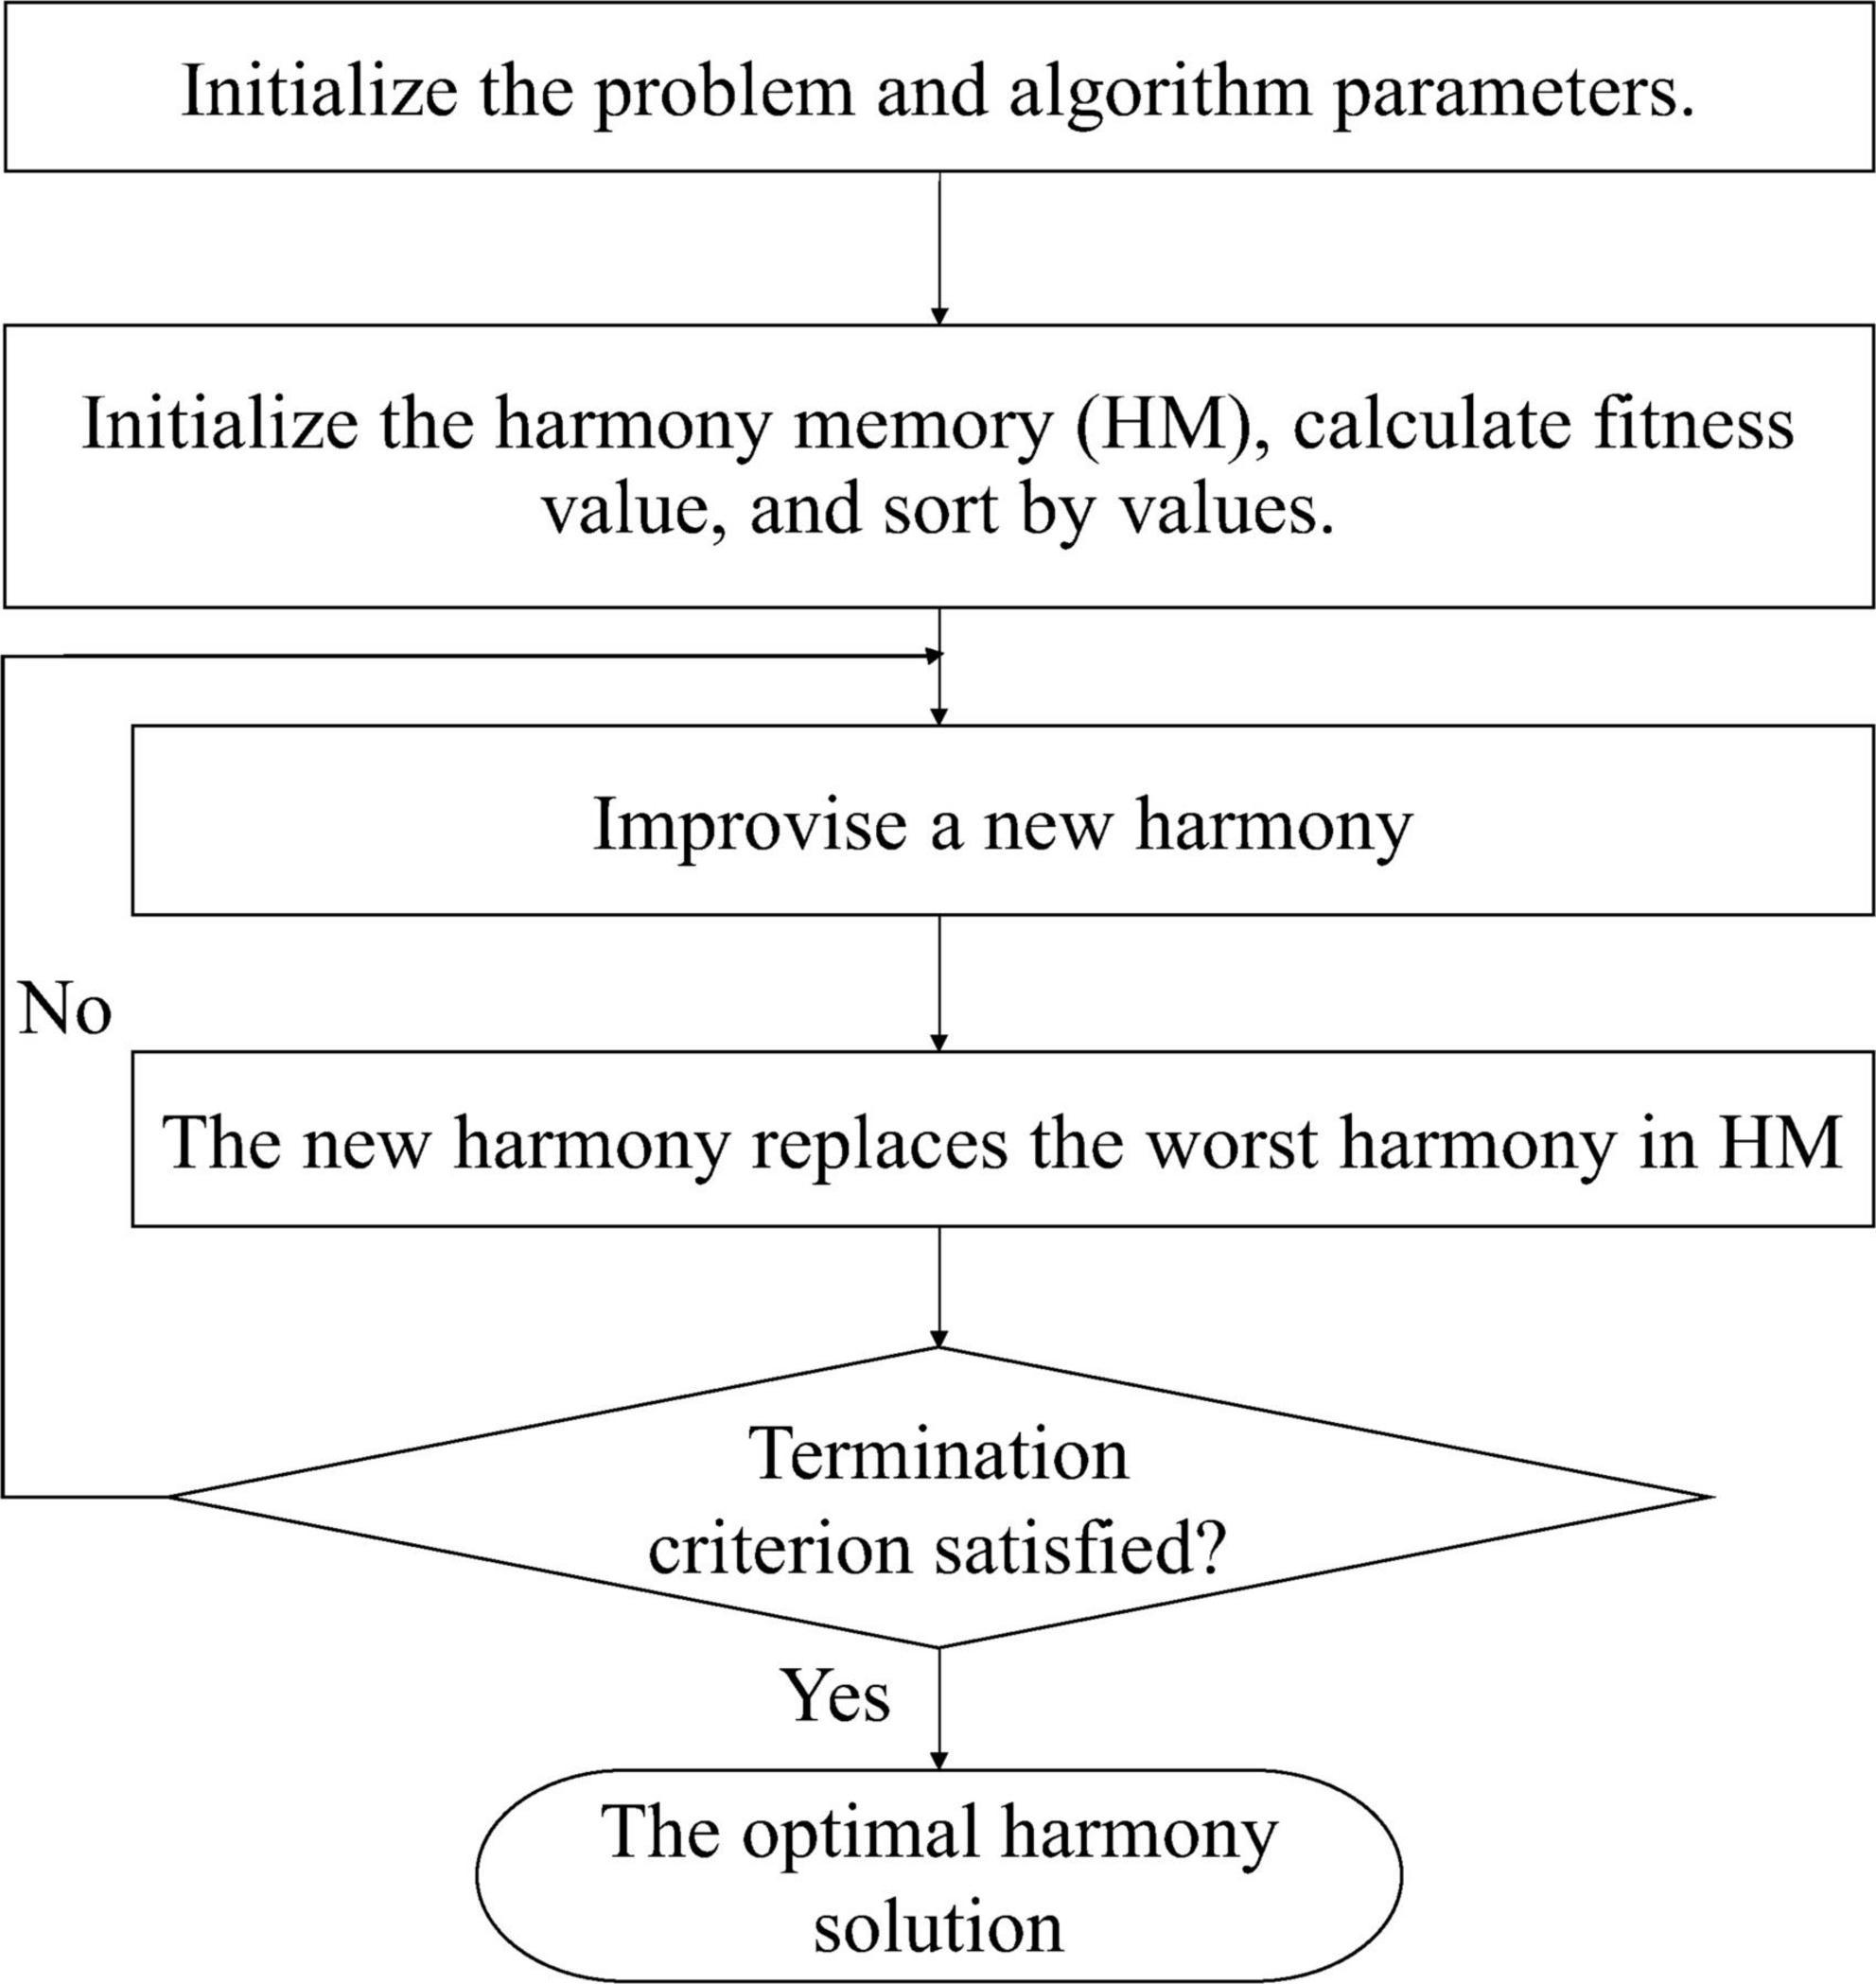
Figure 2. The flow chart of the INGHS algorithm.
The INGHS works as follows:
Step 1: Initialize the problem and parameters
The optimization problem is defined as minimize (or maximize) f(x) such that xiL ≤ xi ≤ xiU(i = 1,2, …, n), where the objective function denotes f(x), and x is a candidate solution composing of n decision variables (xi). This step also needs to determine the parameters which include the HMS, genetic mutation probability Pm, and the number of iterations (Ni).
Step 2: Initialize the harmony memory (HM)
The initial HM is yielded from a uniform distribution in the variable interval [xiL xiU], where xiL and xiU are the lower and upper bounds for xi, respectively. This is done as follows: . Where r∼U(0,1), and f(x) is the objective function values of each harmony vectors, as shown in Equation 3.
Step 3: Improvise a new harmony
Generating a new harmony is called improvisation. is the new harmony vector. O(u) is defined as the coefficient of optimization opportunity and its expression is (u is the current iteration). represents the i-th components of the best harmony (minimum fitness value) in HM, and represents the i-th components of the worst harmony (maximum fitness value) in HM. is the i-th components of stochastic harmony in HM. r is uniformly generated random number in the region of [0 1]. The objective of the new harmony vector f(x′) is calculated. The specific procedure is as follows:
For each i ∈ [1, n] do
If r < O(u)
Else
End if
If xR < xiL
Else If xR > xiU
End if
/*position updating*/
If r < Pm then
/*genetic mutation*/
End if
End for
Step 4: Update HM
If the objective value of the improvised harmony vector x′ is better than that of the stochastic selected harmony xs, we replace the stochastic selected harmony in the HM with x′.
Step 5: Check the stopping criterion
The iteration is terminated when the maximum Ni is reached. Otherwise, Steps 3 and 4 are repeated.
An improved novel global harmony search-based frequency-temporal parameter optimization scheme
Firstly, the original EEG data sets were preprocessed by CAR and band-pass filter. Then, the FDC-based method is used for the raw EEG data to select the optimal channel sets. The 10-fold cross-validation is employed to verify the effectiveness of the proposed INGHS method. Specifically, the raw EEG data with channel selection were randomly divided into 10 parts, 9 parts of which were used as training data and the remaining one as test data. Figure 3 presents the flow chart of the INGHS-based frequency-temporal parameter optimization. The proposed method mainly includes training phase and test phase. For the training phase, the INGHS algorithm was used for the training data sets to search the optimal frequency band and time interval. Thereafter, the projection matrix is obtained by CSP algorithm to applied training data extracted with the optimal frequency-temporal parameter. The CSP features is applied to train the SVM model. For test phase, the optimal frequency-temporal parameter is employed for testing samples to extract the EEG segment. Then, the projection matrix is used to extract the CSP features which is putted into SVM model to classification.
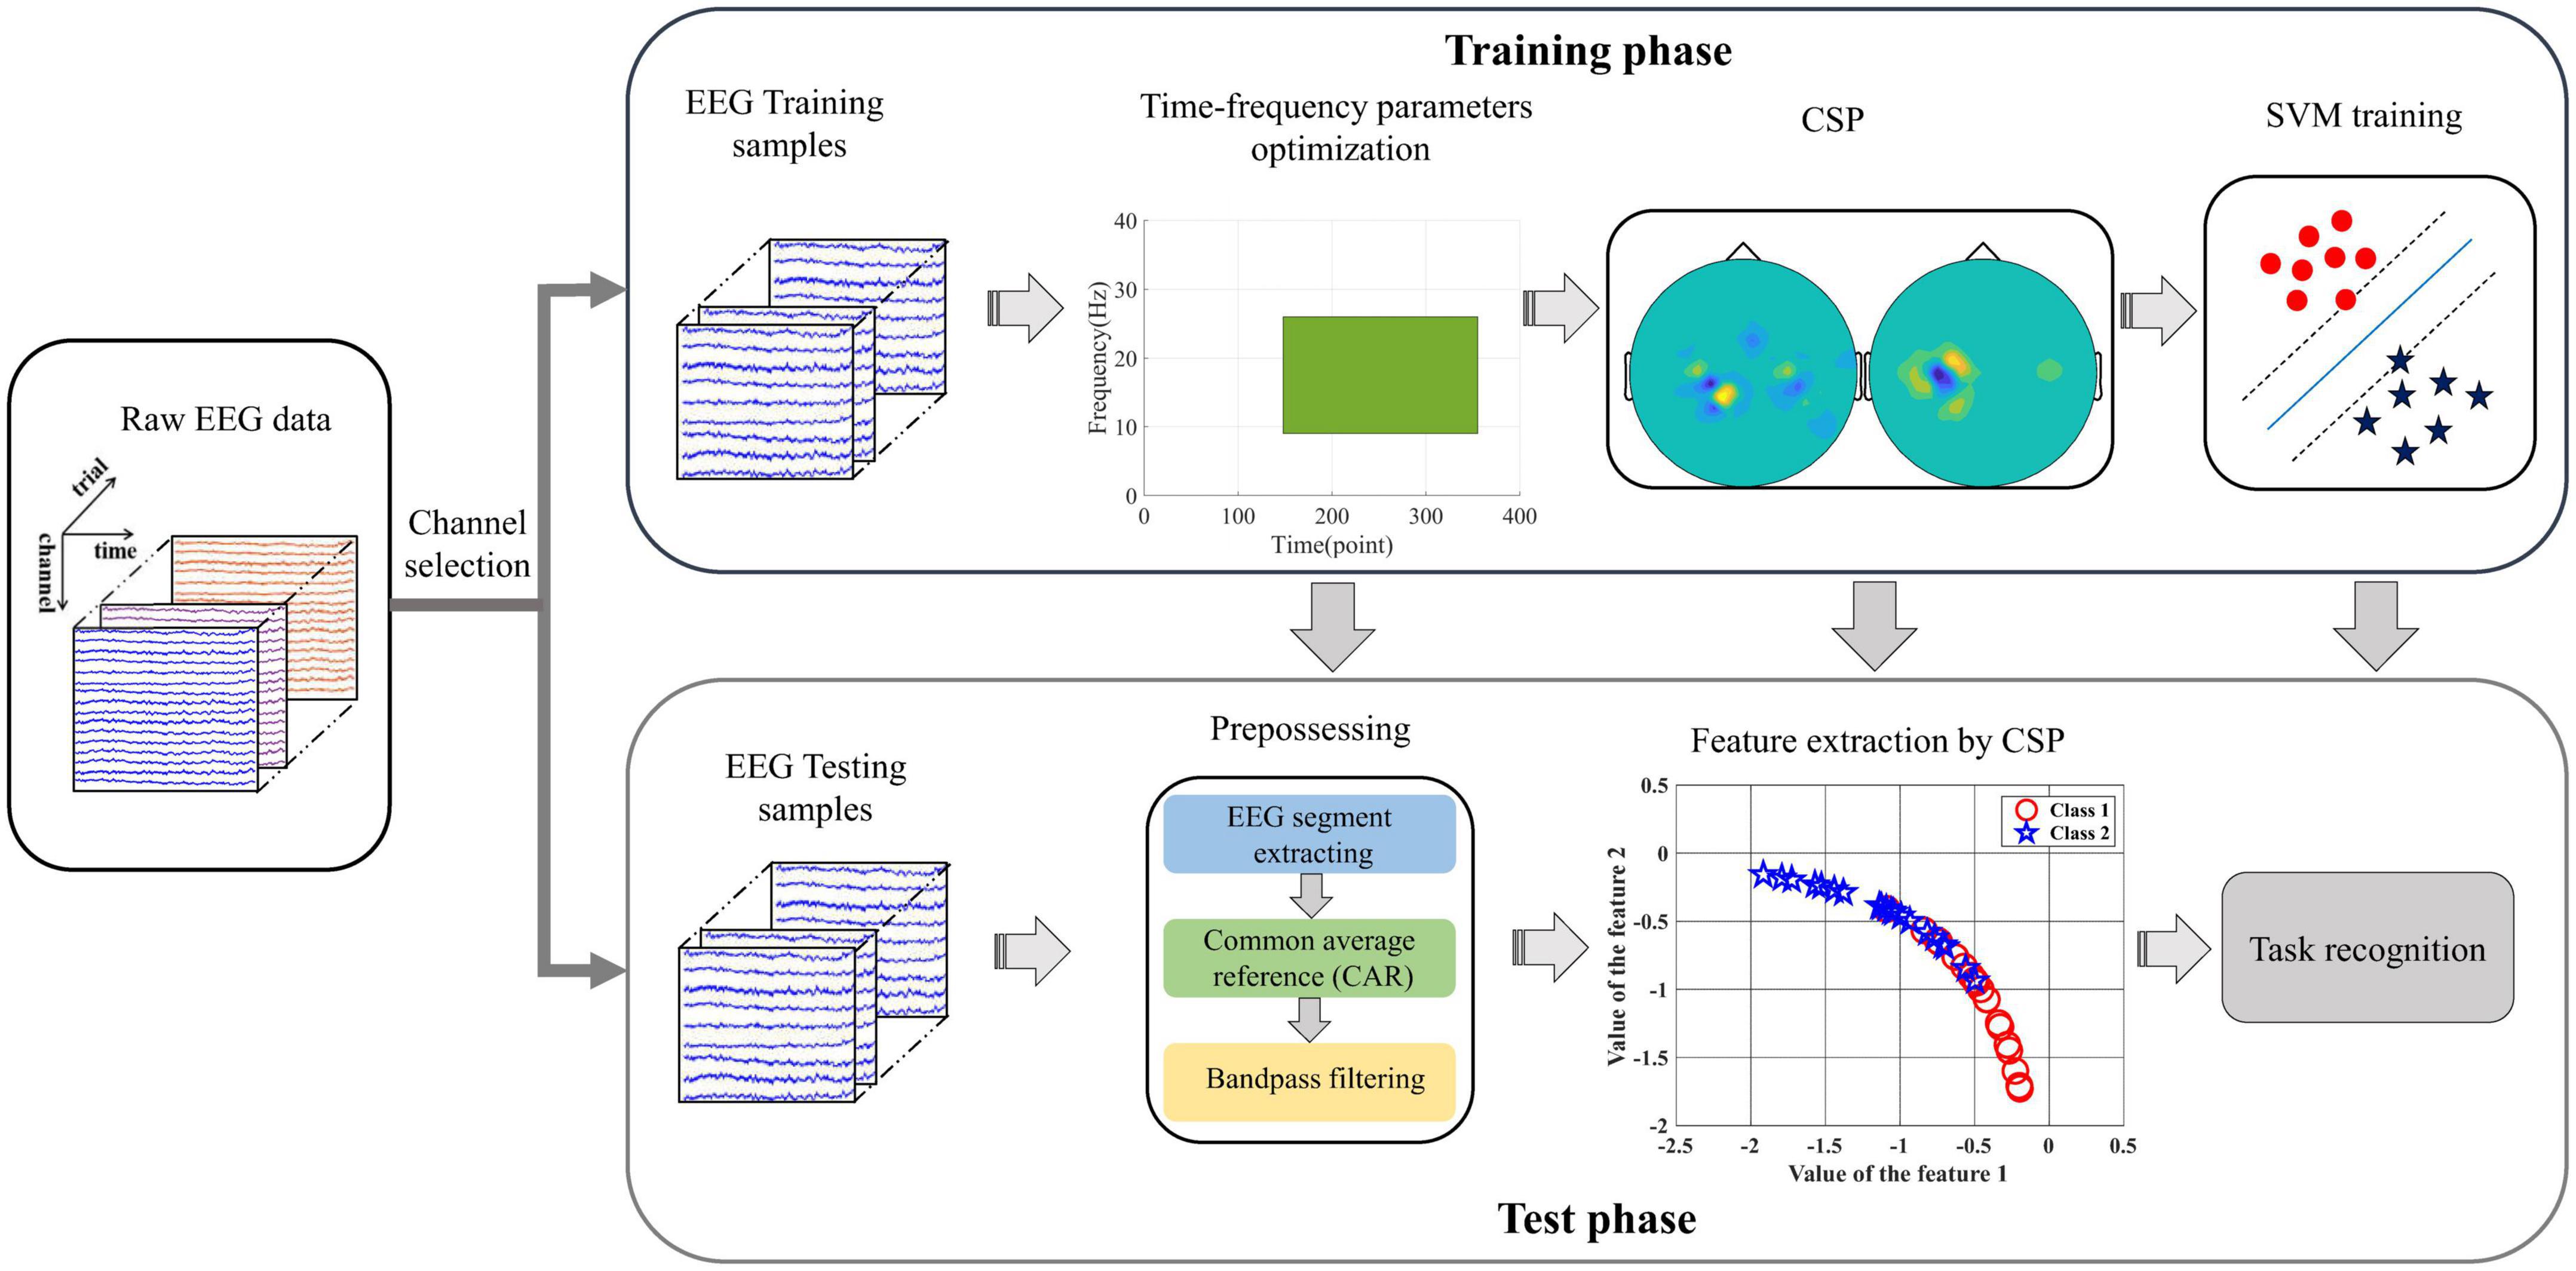
Figure 3. The flow chart of the proposed INGHS-based method.
It should be noted that the objective function in INGHS algorithm was defined to calculate the fitness value for evaluating the quality of a solution. The objective functions are the mean error rate of fivefold cross-validation.
The INGHS-based approach works as follows:
(1) Initialize the problem and algorithm parameters.
The optimization problem is defined as minimize H (f, t) subject to hiL ≤ hi ≤ hiU(i = 1−4). h1 and h2 denote the start frequency (fstart) and bandwidth (fwidth), while h3 and h4 denote the starting of time interval (tstart) and the length of time interval (tlength). Therefore, the solution is expressed as {fstart, fwidth, tstart, tlength}. In this study, the introduced INGHS algorithm was applied for the training data sets to find the globally optimal solution. The searching ranges for each variable of feasible solution are listed in Table 1. For all subjects, if fstart + fwidth ≥ 40, then fwidth = 40 − fstart. For datasets 1, if tlength + tstart ≥ 4 × 100, then tlength = 4 × 100−tstart. For dataset IVa, if tlength + tstart ≥ 3.5 × 100, then tlength = 3.5 × 100−tstart. For dataset IIIa, if tlength + tstart ≥ 4 × 250, then tlength = 4 × 250−tstart. The INGHS algorithm parameters (HMS, Pm, and Ni) are also determined in this step.
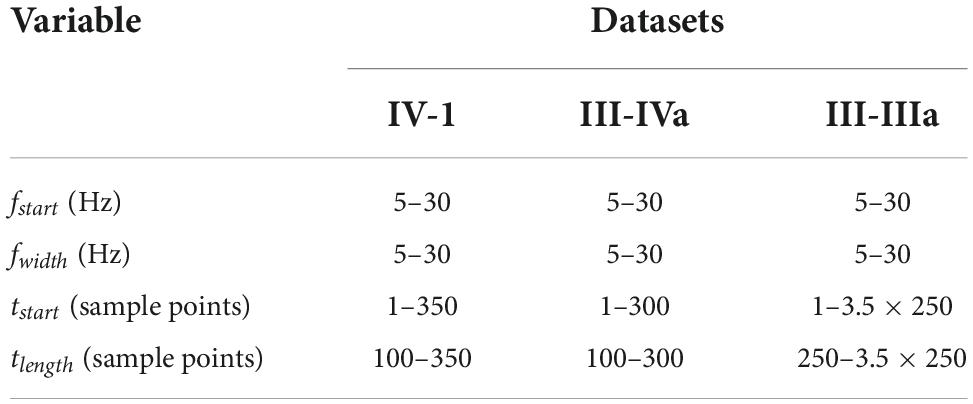
Table 1. The range of four variables for each feasible solution.
(2) Initialize the HM and calculate the fitness value.
The initial HM is generated from a uniform distribution in the ranges [hiL, hiU], as shown in Figure 4. Each harmony vector (solution) is applied on the training data. At the same time, the features are extracted by the CSP algorithm based on the training data sets. Frequently, the obtained features is inputted into the LDA (or SVM) classification algorithm to calculate the fitness value H(f, t), and then sort by fitness values.
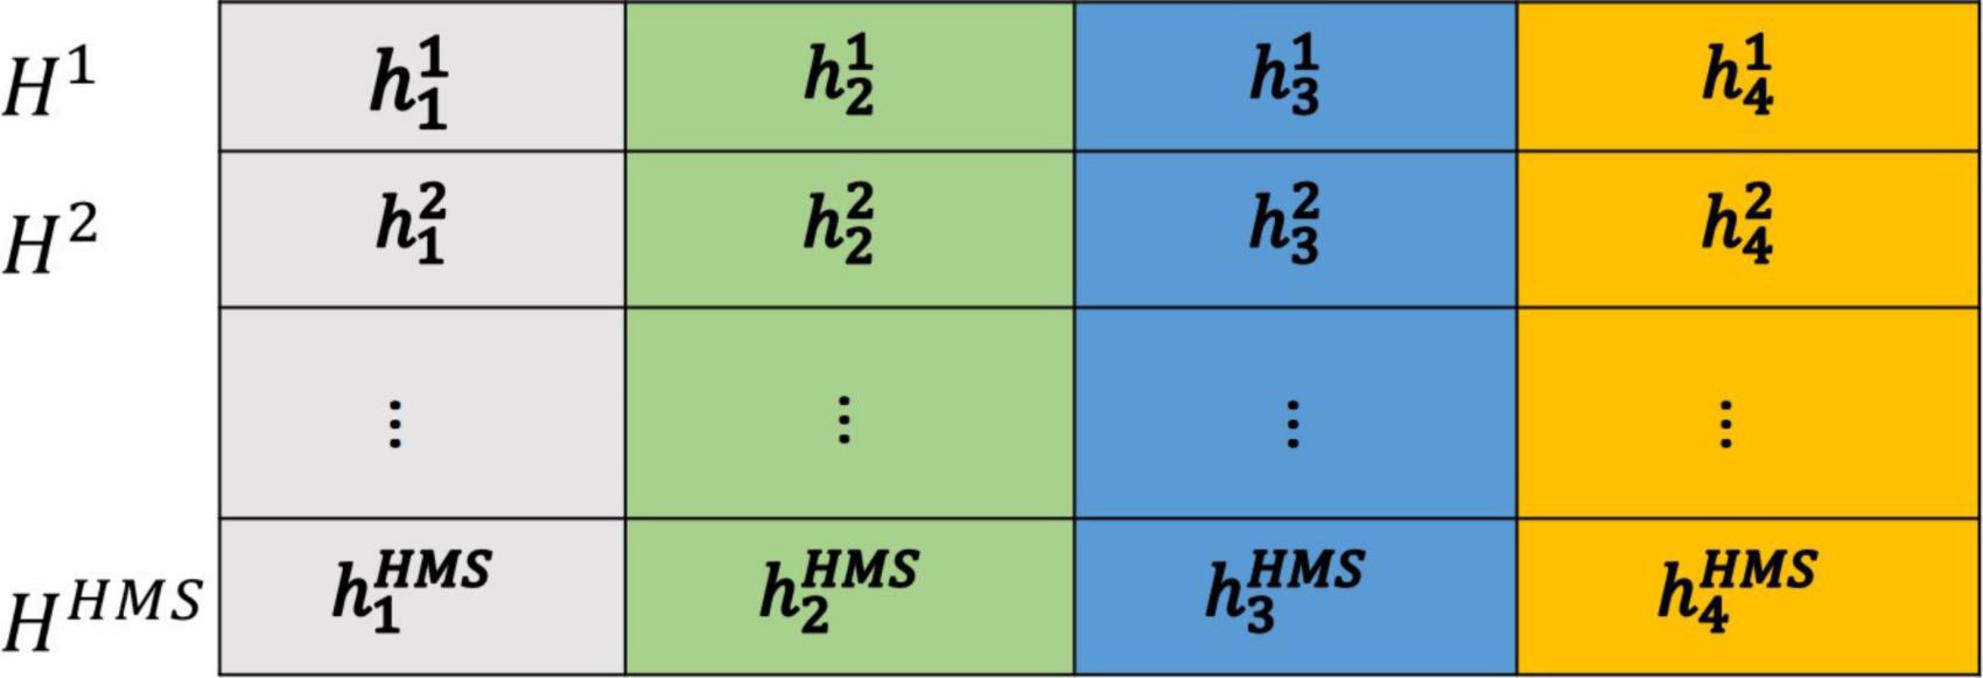
Figure 4. Initialize the harmony memory.
(3) Improvise a new harmony.
According to Step 3 of the INGHS algorithm to improvise a new harmony and calculate the fitness value.
(4) Update HM and (5) Stopping criterion are the same as the INGHS algorithm. Finally, the optimal frequency band and time interval are derived. Meanwhile, the test data sets are processed by the optimal frequency band {fstart, fstart + fwidth} and time interval {tstart, tstart + tlength}. Features are extracted by the CSP filters from the INGHS algorithm. Furthermore, the LDA (or SVM) classifier is utilized to recognize the MI task.
To remove the irrelevant and redundant channels and enhance the classification accuracy and reduce the computational complexity, channel selection methods for MI-based BCI have been widely studied (Miao et al., 2017a; Jin et al., 2019, 2020). Compared with other channel selection methods, the FDC method is widely used and has low complexity, the FDC is selected for channel selection. We investigated the effect of the change of the number of selected channels (K) on the test accuracy. The CSP algorithm is used as feature extract method and is not executed frequency-time parameters optimization. The frequency band is 5–40 Hz and time interval is MI time (paradigm setting). The LDA method is utilized to the classification. K is tuned from 8 to 59 for Data 1. For Data 2, K is tuned from 8 to 118. Figure 5 presents the test classification accuracies of subjects from Data 1 and Data 2 with the change of K. The test accuracy obtained by each K is the average of 10-fold cross validation. According to the results in Figure 5, the test accuracies are different for subjects of Data 1 and Data 2 with the increasing of the K. However, we note that the average test accuracies are higher when K is 16. Therefore, we choose K to be 16 in this study.
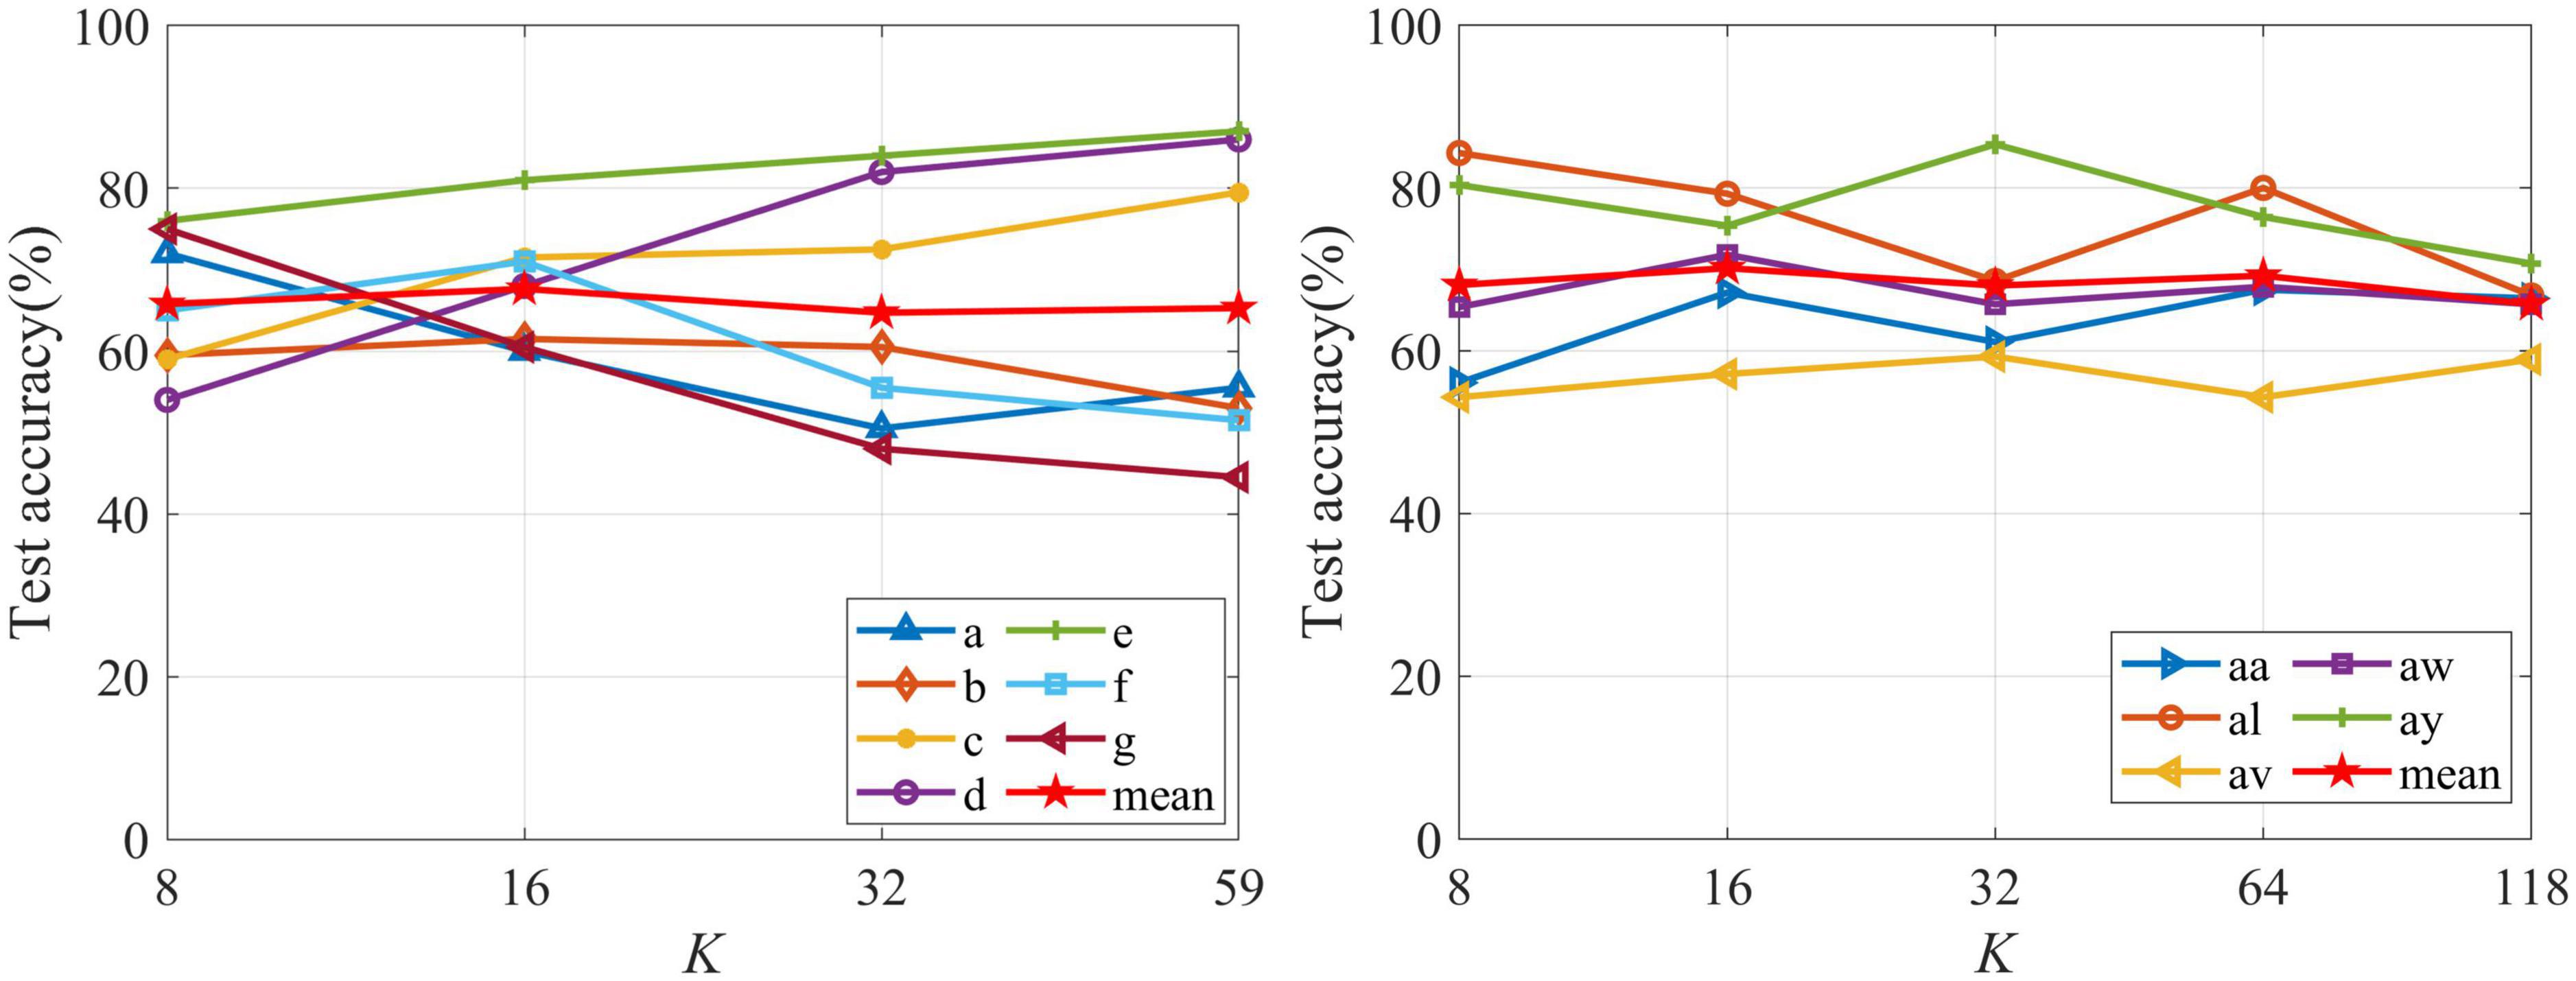
Figure 5. Test classification accuracies of subjects from Data 1 and Data 2 with the change of K.
Parameter analysis of improved novel global harmony search
The selection of HMS depends on the specific problem. The bigger HMS cause that the search space of the algorithm is larger, which is easier to find the global optimal solution. However, a larger HMS will inevitably bring about an increase in the running time of the algorithm. Therefore, considering the efficiency and diversity of the algorithm, an appropriate HMS value for the INGHS algorithm is very vital. Mutation in INGHS is an auxiliary search operation whose main purpose is to preserve the diversity of group. Generally, a small Pm value may lead to rapid convergence of the algorithm, which will easily generate local optimization solutions. However, a higher Pm value will make INGHS algorithm tend to be purely random search, resulting in slow convergence of the algorithm and greatly affecting the efficiency of problem solving. Therefore, an appropriate Pm value can not only prevent the algorithm from falling into local optimum and keep the diversity of solutions, but also make the algorithm timely converge. To select the optimal HMS and Pm, this study analyzed the effects of different HMS and Pm on three data sets, and HMS values are set as 5, 10, 20, and 30. If the total number of variables 1 ≤ xn ≤ 4, Pm is reasonably selected from the range region of [0.2 × (1 − 50%), 0.2 × (1 + 50%)]. Otherwise, Pm is selected from the region of [(1 − 50%) / xn, (1 + 50%) / xn] (Zou et al., 2010). The Pm value in this study is most reasonable between 0.1 and 0.3, so the Pm value is set to 0.1, 0.15, 0.2, 0.25, and 0.3. Set the number of channels to K = 16. The classifier uses LDA.
Table 2 shows the mean test accuracy of all subjects for Data 1 under different HMS and Pm. It can be seen from the table that when HMS = 10 and Pm = 0.15, the average test accuracy is up to 78.43%. Therefore, for Data 1, the HMS and Pm are set to 10 and 0.15, respectively. Table 3 shows the mean test accuracy of all subjects for Data 2 under different HMS and Pm. It can be seen that when HMS = 10 and Pm = 0.2, the average test accuracy is the highest, reaching 87.78%. Therefore, for Data 2, parameters HMS and Pm are selected as 10 and 0.2, respectively. Table 4 shows the mean test accuracy of all subjects for Data 3 under different HMS and Pm values. It can be seen that the average test accuracy is up to 81.76%. Therefore, for Data 3, HMS and Pm were selected as 20 and 0.25, respectively.
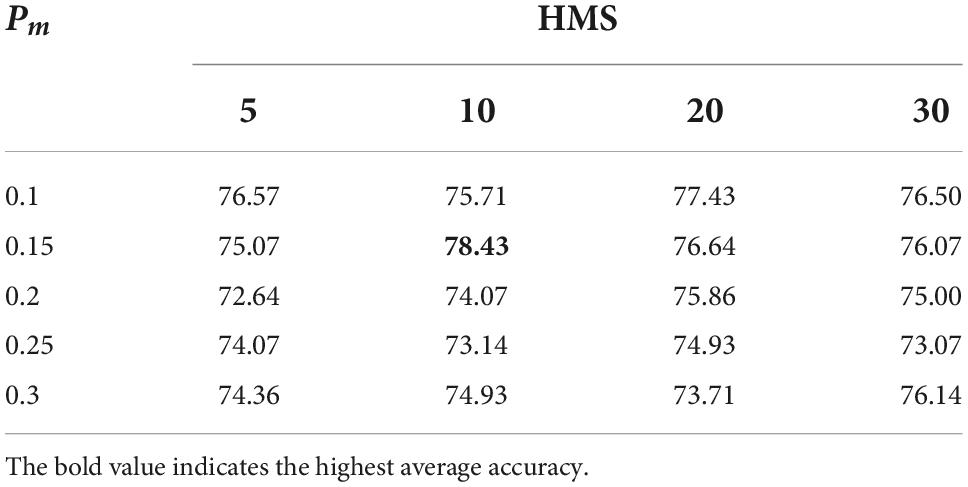
Table 2. Mean test accuracy (%) of HMS and Pm changes of INGHS of all subjects for Data 1.

Table 3. Mean test accuracy (%) of HMS and Pm changes of INGHS of all subjects for Data 2.
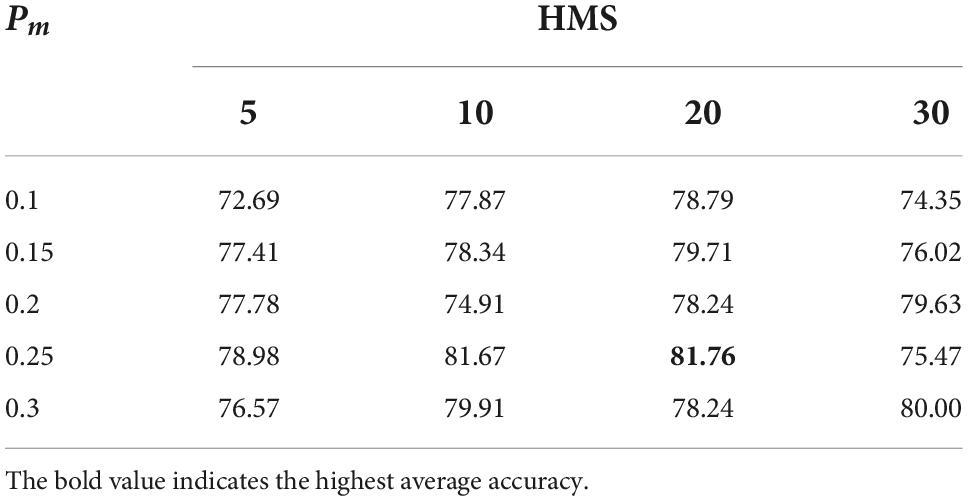
Table 4. Test accuracy (%) of HMS and Pm changes of INGHS of all subjects for Data 3.
In this study, all experimental simulations are implemented by using MATLABR2019b on a Windows personal computer with Core i5-9500H 3.00 GHz CPU and RAM 8.00 GB. For fair comparisons, PSO (Xu et al., 2014), and the ABC (Miao et al., 2017a) with the recommended parameter setting were also employed to find the optimal frequency-temporal parameters. Moreover, the training data, test data, and the prepossessing methods are consistent. The parameter values of all the algorithms are listed in Table 5. Similarly, the number of iterations (Ni) for the all of algorithm is 100.
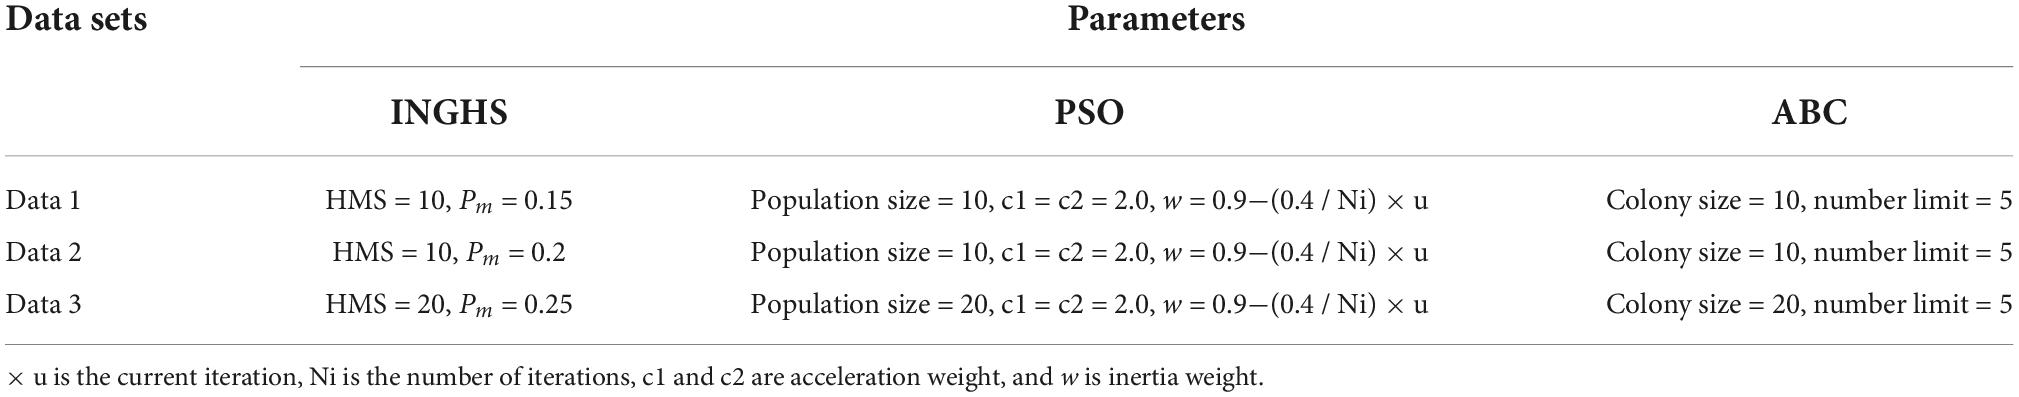
Table 5. The parameters of PSO, ABC, and INGHS.
Results and discussion
Channel selection
Figure 6 depicts channels’ discriminative power distributions and the selected channels for all subjects. The darker yellow indicates the greater the FDC value of this channel, on the contrary, the lighter blue indicates the smaller the FDC value of corresponding channel. As shown in Figure 6, for subjects of Data 2, the selected channel sets distributed in the left motor cortex area. Moreover, for subjects b, c, d, e, and g, the selected channels mainly located in right and left motor cortex area, which corresponds to MI of left hand and right hand. For subjects a and f, selected channels tend to locate in the right and central motor cortex area. It is consistent with the neurophysiological principle which is MI of the left hand and foot corresponding to the right and central motor cortex area. Furthermore, for subjects k3b to l1b, the channels correspond to higher FDC values are distributed in the adjacent area at C3 and C4 positions. However, the selected channels for each subject are distinguishing each other due to individual differences.
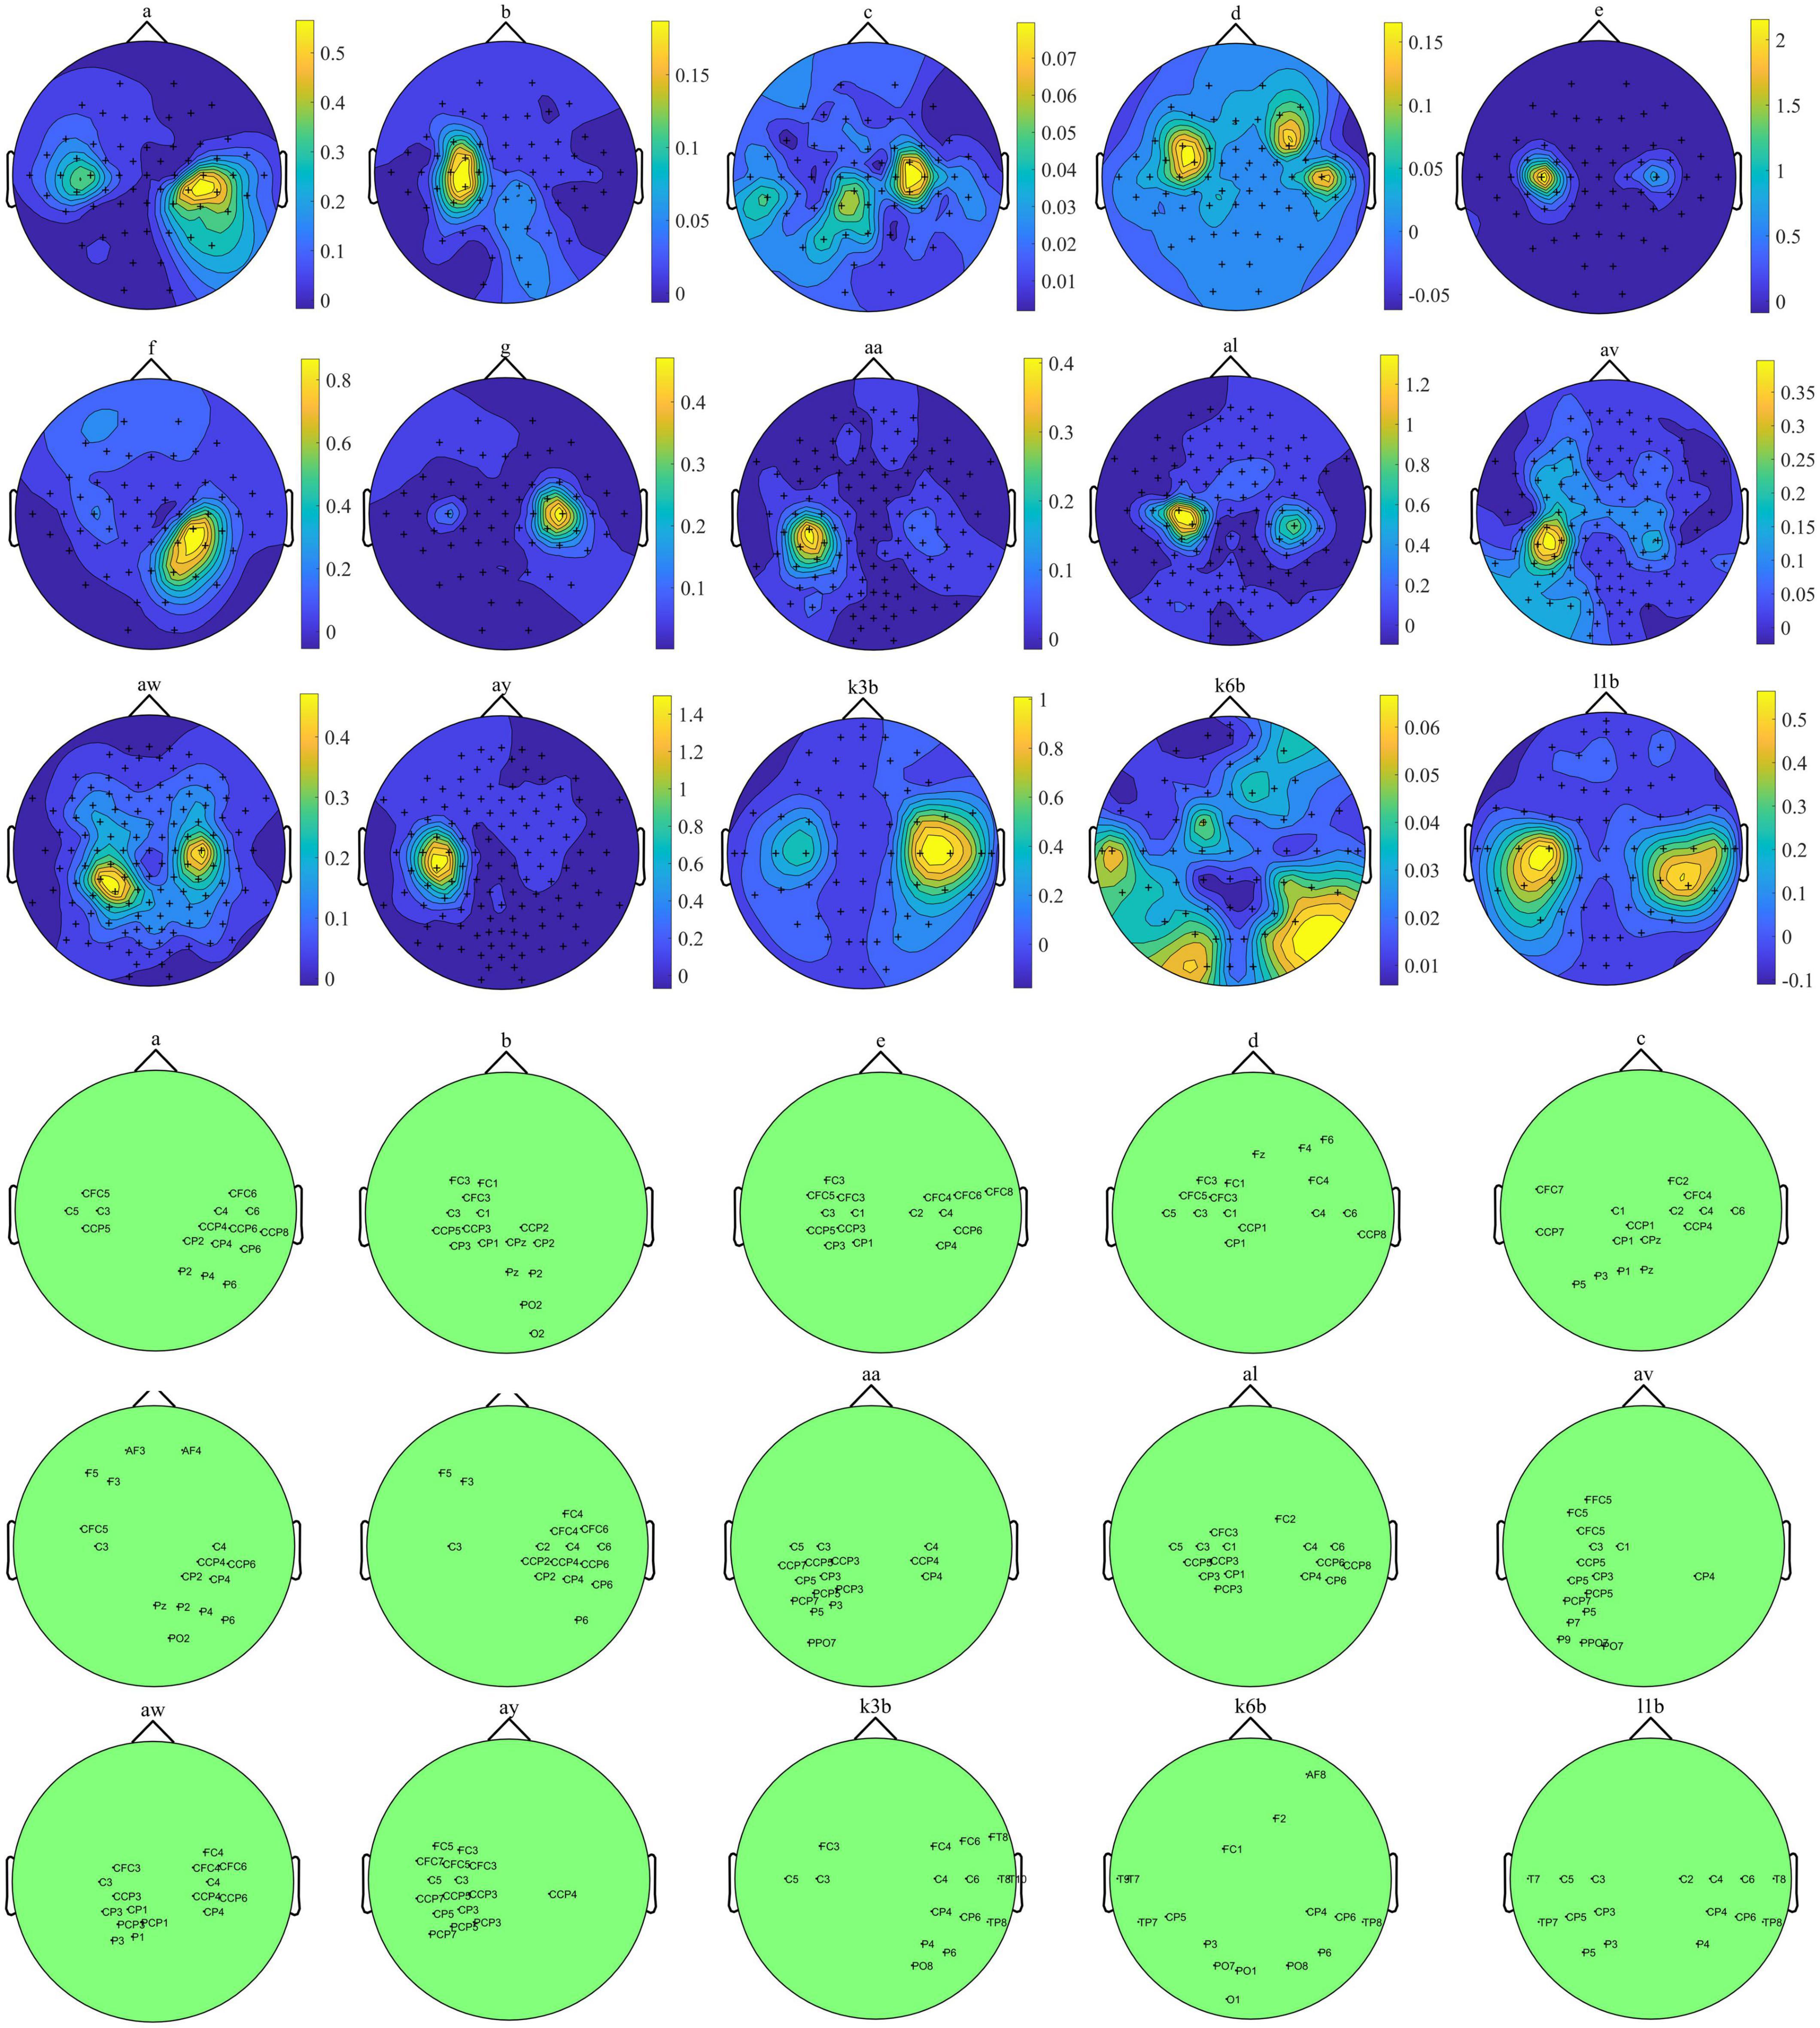
Figure 6. The topographic map of channels’ discriminative power distributions of each subject.
Test classification comparison
Aiming to evaluate the effectiveness of the proposed INGHS method for optimizing frequency-time selection, we compared the test classification between the proposed INGHS method and ABC, PSO, and the traditional CSP method in Table 6. For PSO, ABC, and INGHS feature optimization methods, the number of channels K is 16. Furthermore, the CSP method with 16-channels employed the fixed time windows (0–4 s for data set 1 and IIIa, and 0–3.5 s for data set IVa) and the frequency band selected 5–40 Hz. Note that all the methods in Table 6 are evaluated by standard competition procedure. Each value in Table 6 is the 10-fold cross-validation mean test accuracy. Table 6 shows that for LDA and SVM classifiers, the average accuracy rate improvement achieved by INGHS was 12.9 and 11.6% in comparison with the classical CSP method. Thus, the proposed INGHS method achieved higher average classification accuracies compared to the traditional CSP method. In addition, the average accuracy rate improvements achieved by INGHS based on LDA were 1.6 and 4.1% in comparison with the ABC and PSO methods. Meanwhile, for the SVM classifier, the average classification accuracy obtained by the proposed INGHS method is higher than 0.1% (ABC) and 3.9% (PSO). The average test accuracy for INGHS is found to be slightly higher as compared to the accuracy achieved by ABC and PSO based on two classifiers. Furthermore, the Wilcoxon signed-rank test was used to analyze the statistical differences between the CSP method and the proposed INGHS method. The classification result of INGHS was significantly better than that of the CSP method (p < 0.001).
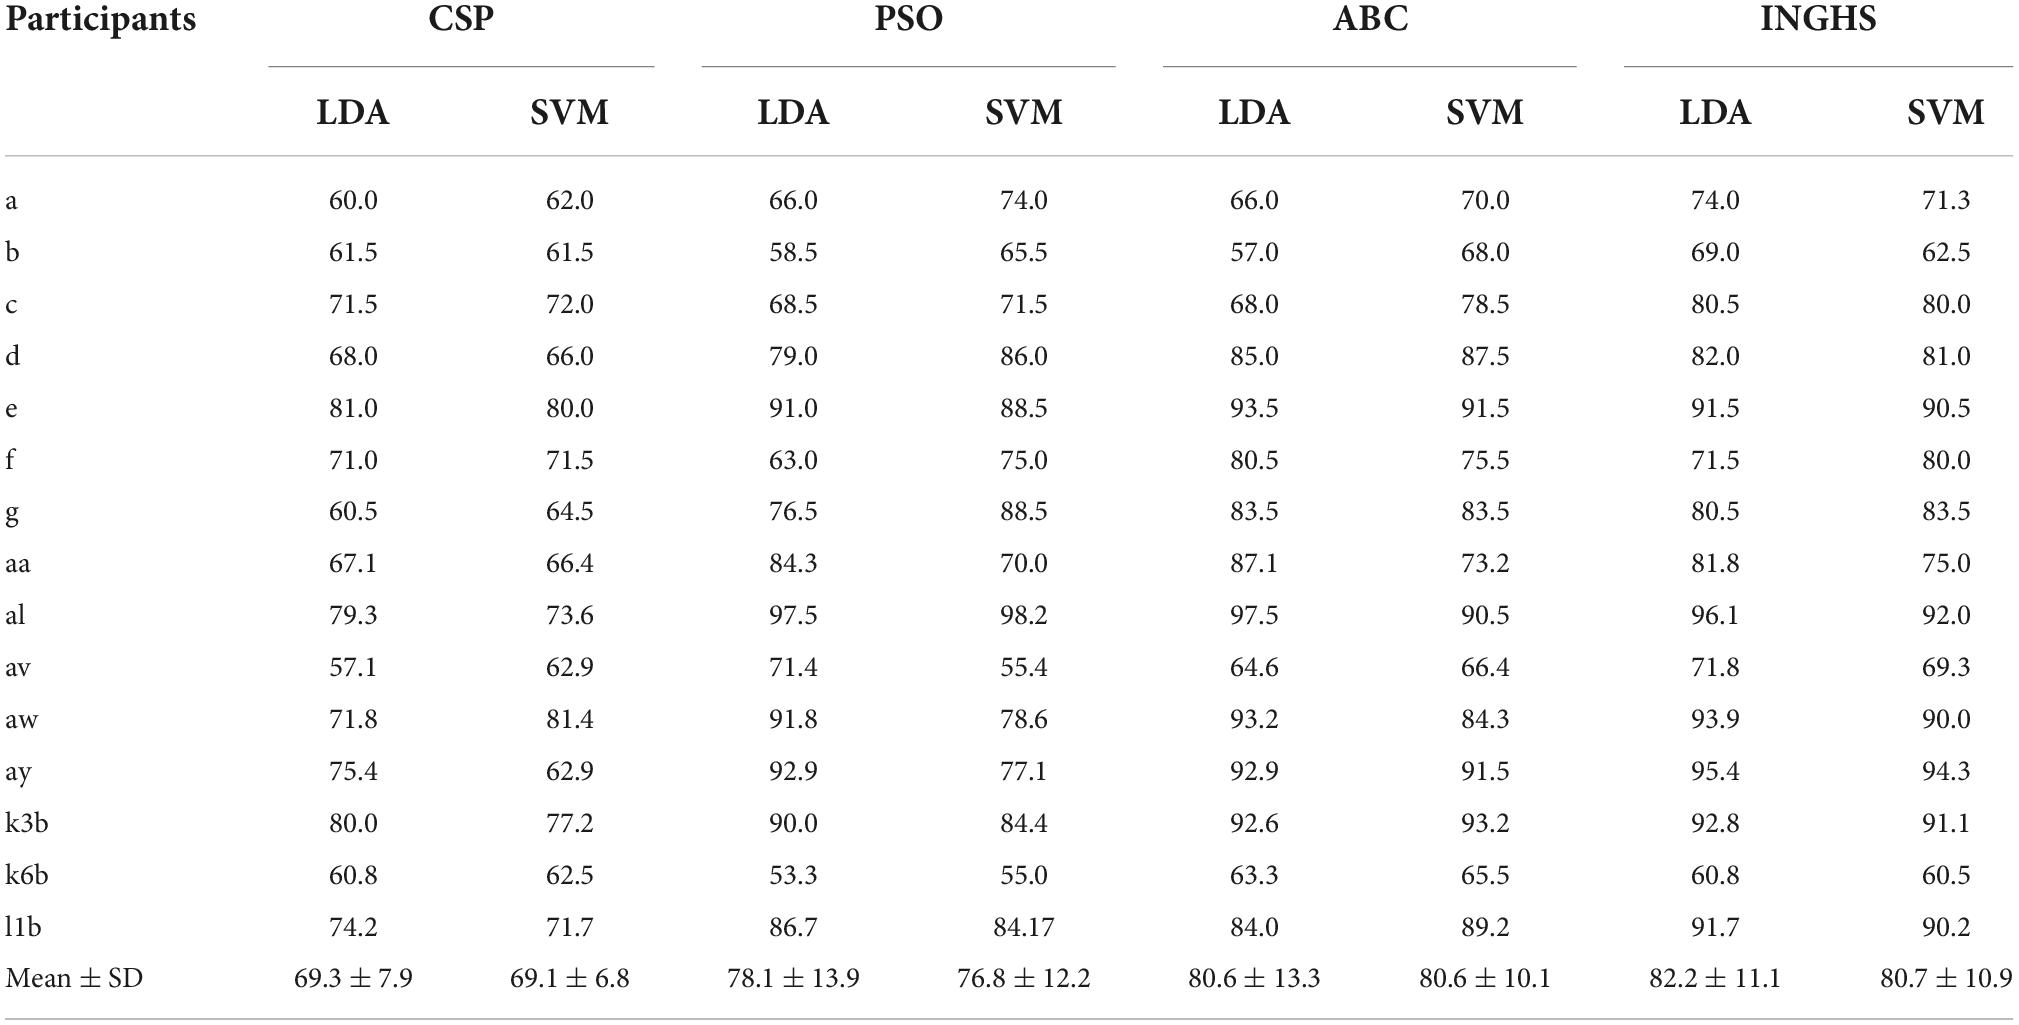
Table 6. Test classification accuracy (%) of different methods applied on datasets 1–3.
For the swarm intelligence optimization algorithm, PSO adjusts all variables of each solution during each iteration and the ABC algorithm adjusts one variable of each solution, whereas the INGHS algorithm adjusts each variable independently based on all of the existing vectors. This feature could increase the flexibility of the algorithm and produce better solutions. In addition, the steps and the structure of the INGHS algorithm are relatively simple. In summary, on the one hand, the proposed INGHS method could effectively optimize the time and frequency parameters and achieve better test accuracy compared with the CSP method. On the other hand, the test accuracy that is obtained by the time-frequency parameters selected by the proposed INGHS algorithm is slightly better than that obtained by ABC and PSO.
Frequency-time analysis
The optimal frequency-time zone optimized by the INGHS method based on LDA for Data 1 is shown in Figure 7. The figure shows the optimal frequency-time parameters corresponding to the highest test accuracy in the 10-fold cross-validation for each subject. It should be noted that, for all subjects, the optimal frequency band covers the μ (8–12 Hz) and β rhythms (13–30 Hz). However, they still vary a lot. Furthermore, we observe that the starting time are different in a small range for all the subjects and the optimal time lengths are different. Meanwhile, the optimal time segment of most subjects starts at 0.5 s after the visual cue which is consistent with the starting time point used in most literature (Thomas et al., 2009).
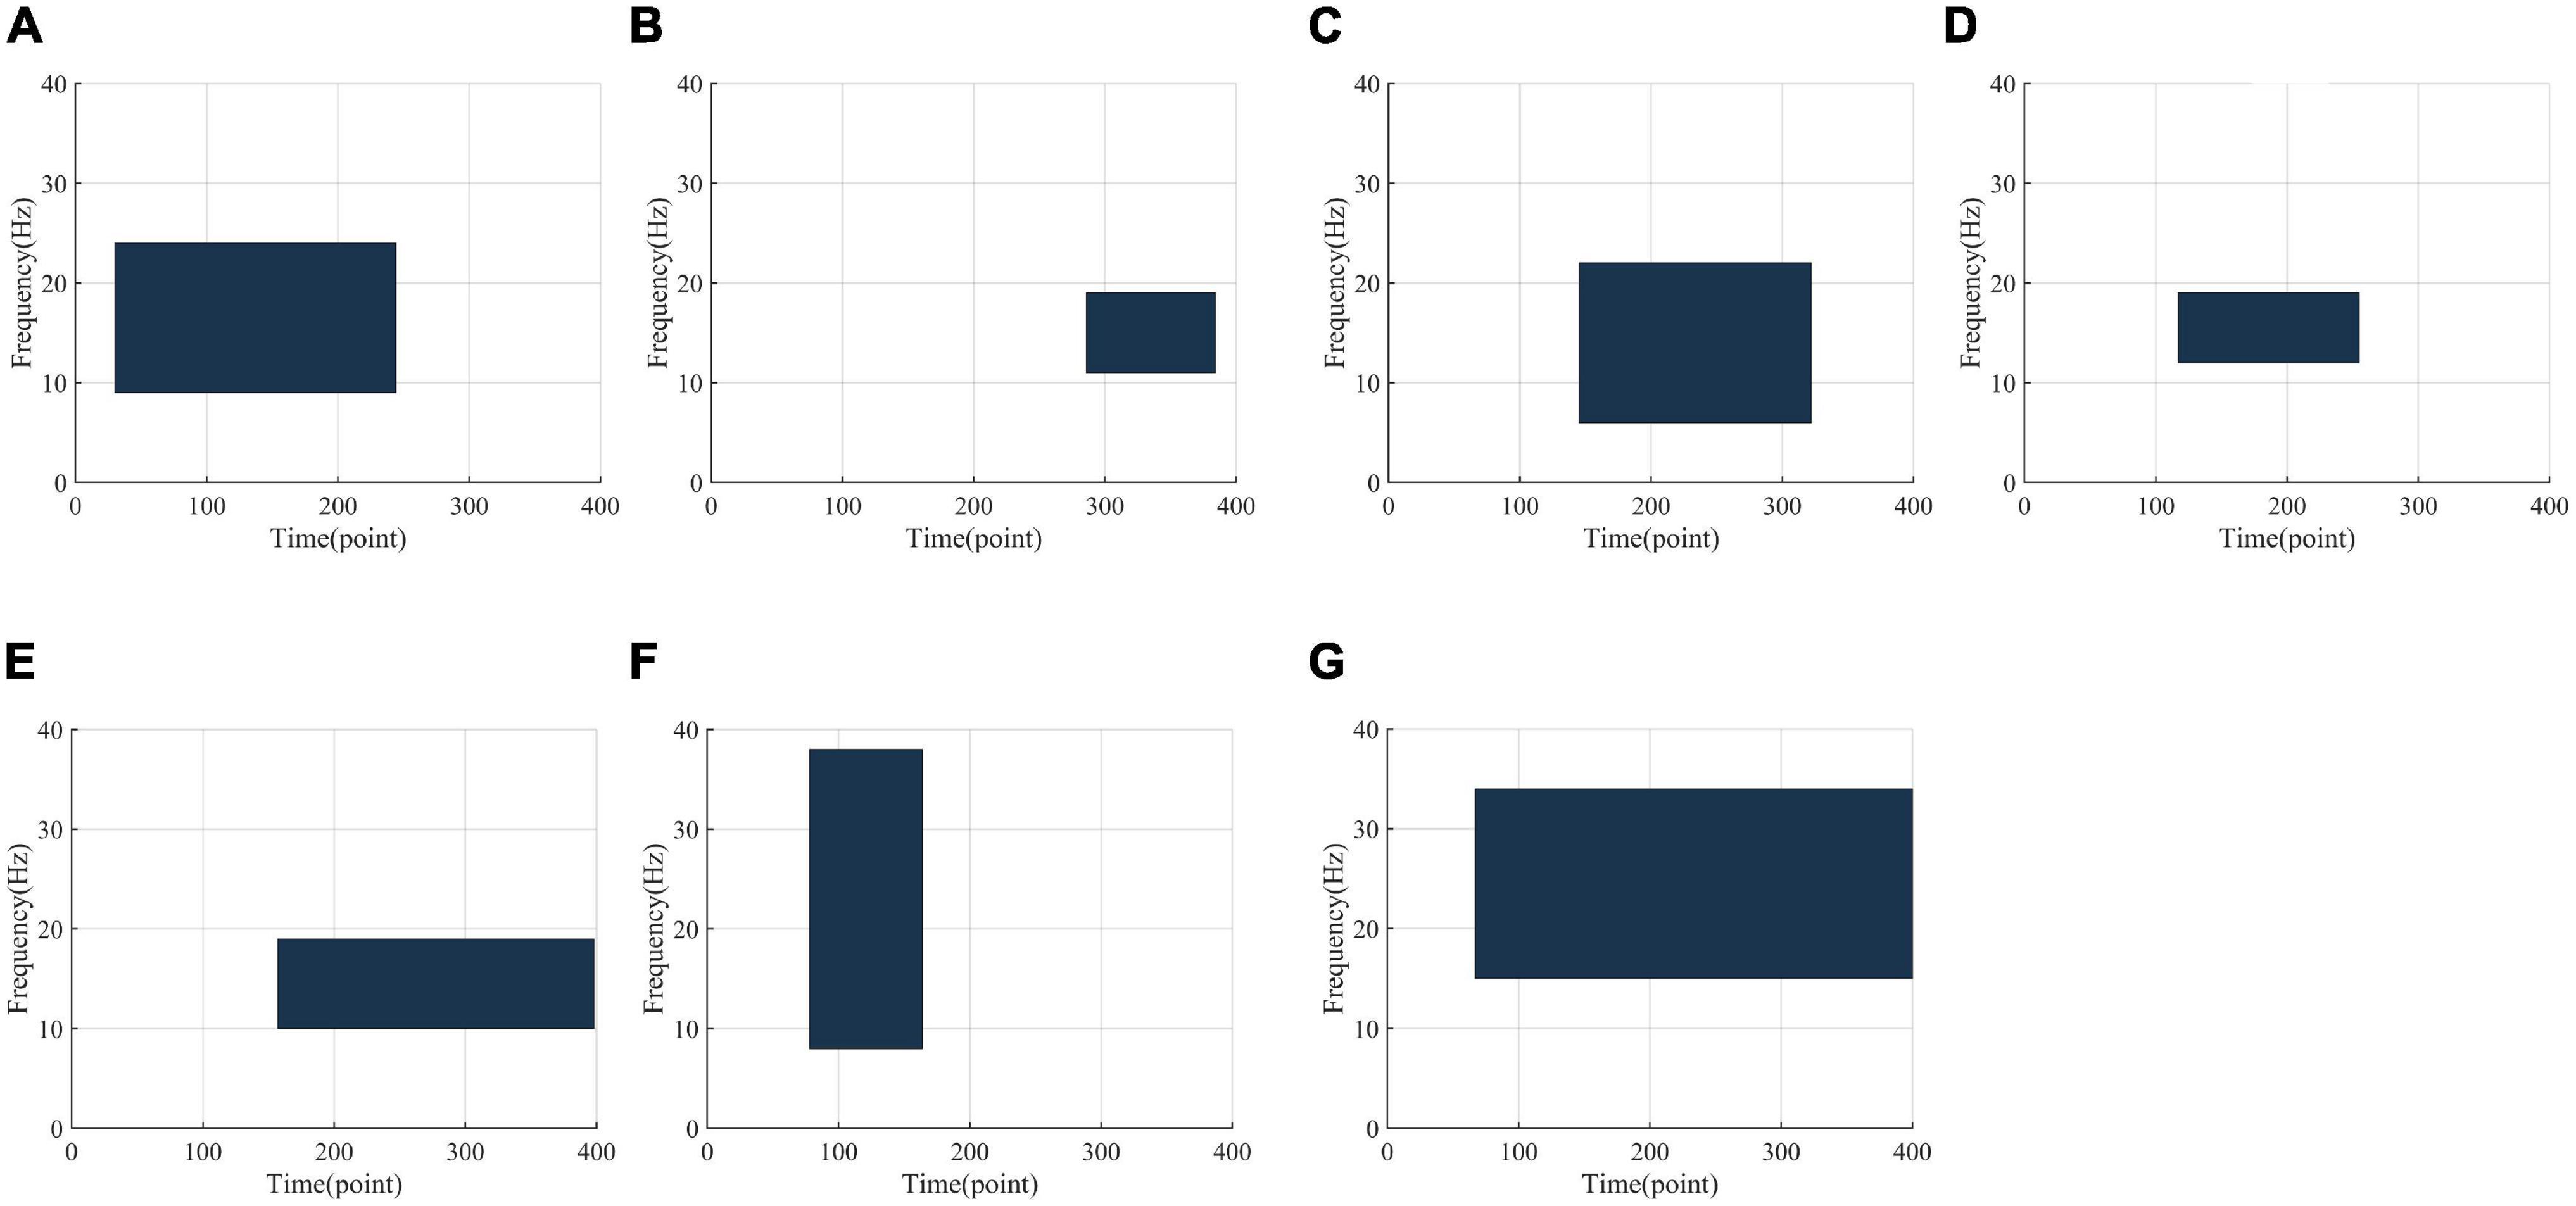
Figure 7. The optimal frequency-time region found by the INGHS approach based on LDA for subject (A–G).
For brain signal analysis, some common frequency bands including 8–30 Hz, μ (8–12 Hz), and β (13–30 Hz) have been popularly used in various EEG studies. Here, we also investigate the classification performance between the commonly used frequency band configuration and the frequency band and time configuration optimized by the INGHS method. The time segment was 0–4 s, and the classifier was LDA. It should be emphasized that all the comparisons were made when the number of channels K was 16. Figure 8 presents the comparison of classification accuracies obtained by standard competition procedure with INGHS and common frequency settings for Data 1. The results show that the optimal frequency-time parameter based on INGHS achieved a better average test accuracy in comparison with the common frequency band setting. Specifically, the average test accuracy of INGHS is 78.43%, which is higher than 10.79, 10.43, 10.72, and 12.72% of the CSP method with 5–40, 8–30, 8–12, and 13–30 Hz, respectively. Therefore, it is suggested that INGHS could adaptively select the optimal time-frequency parameters and achieve the better classification performance.
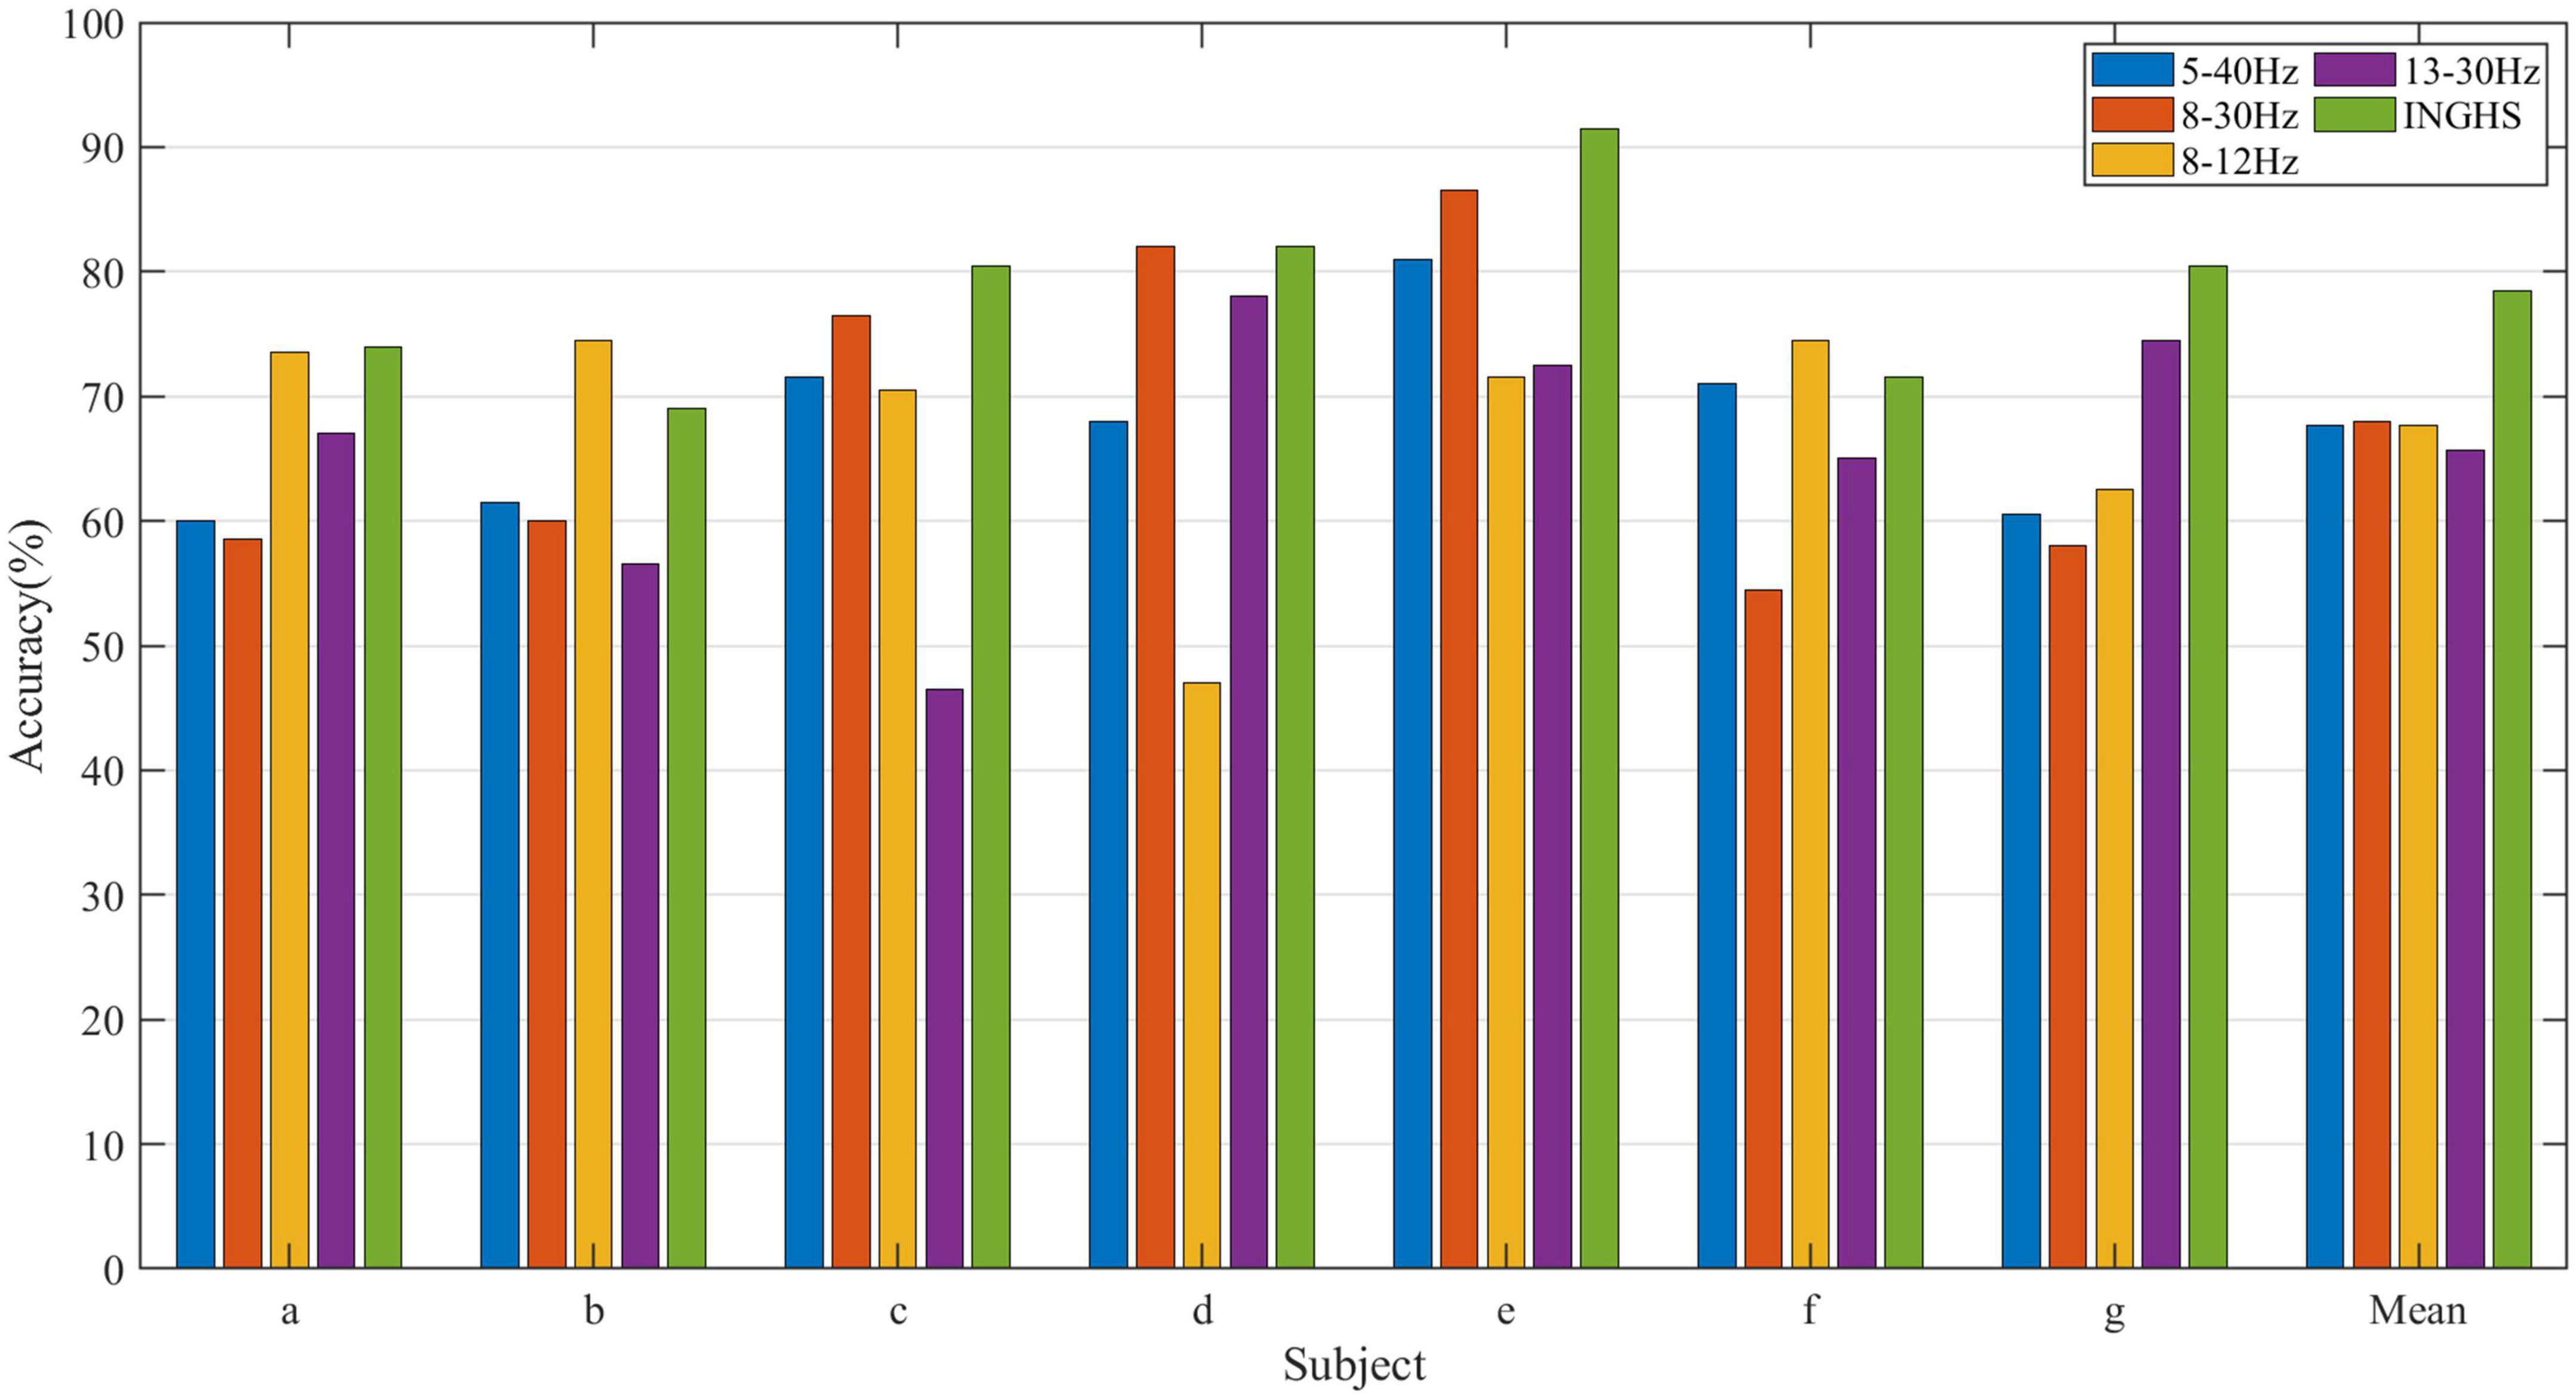
Figure 8. Comparison of classification accuracies obtained by INGHS and common frequency settings for Data 1.
Comparison of spatial patterns
To better interpret the experimental results, we visualized the spatial pattern derived by the traditional CSP method and the INGHS-based method. A pair of spatial patterns is composed of the first and last columns of W−1 (W is the spatial filter as in section “Feature extraction and classification”). For the traditional CSP method, the fixed frequency band (5–40 Hz) and time segment (0–4 s) are applied to the training data to obtain the spatial filter W. Meanwhile, the based-INGHS method applies the optimized frequency band and time period to the training data to obtain the spatial filter W. The channel used by INGHS and CSP method is the optimal 16-channel mode after channel selection approach. It should be noted that the training data used by CSP and INGHS are consistent. In Figure 9, a comparison of spatial patterns between the traditional CSP method with 16-channels and the INGHS-based method for “l1b” are displayed. The results indicated that compared with the traditional CSP method, the spatial pattern based on the INGHS method had significant ERD, which is concentrated around C3 and C4. When the unilateral MI, there was significant ERD in SMR at the contralateral hemisphere (Pfurtscheller et al., 2006). Moreover, the information features of sensorimotor areas are closely related to ERD, which provides important discriminant information for the decoding of motor imagination tasks (Blankertz et al., 2007). The obvious ERD in SMR derived by the INGHS-based method leads to better decoding accuracy in Table 6. Additionally, these analyses provide explicit evidence for the superior decoding performance of our proposed INGHS method over the traditional CSP method.
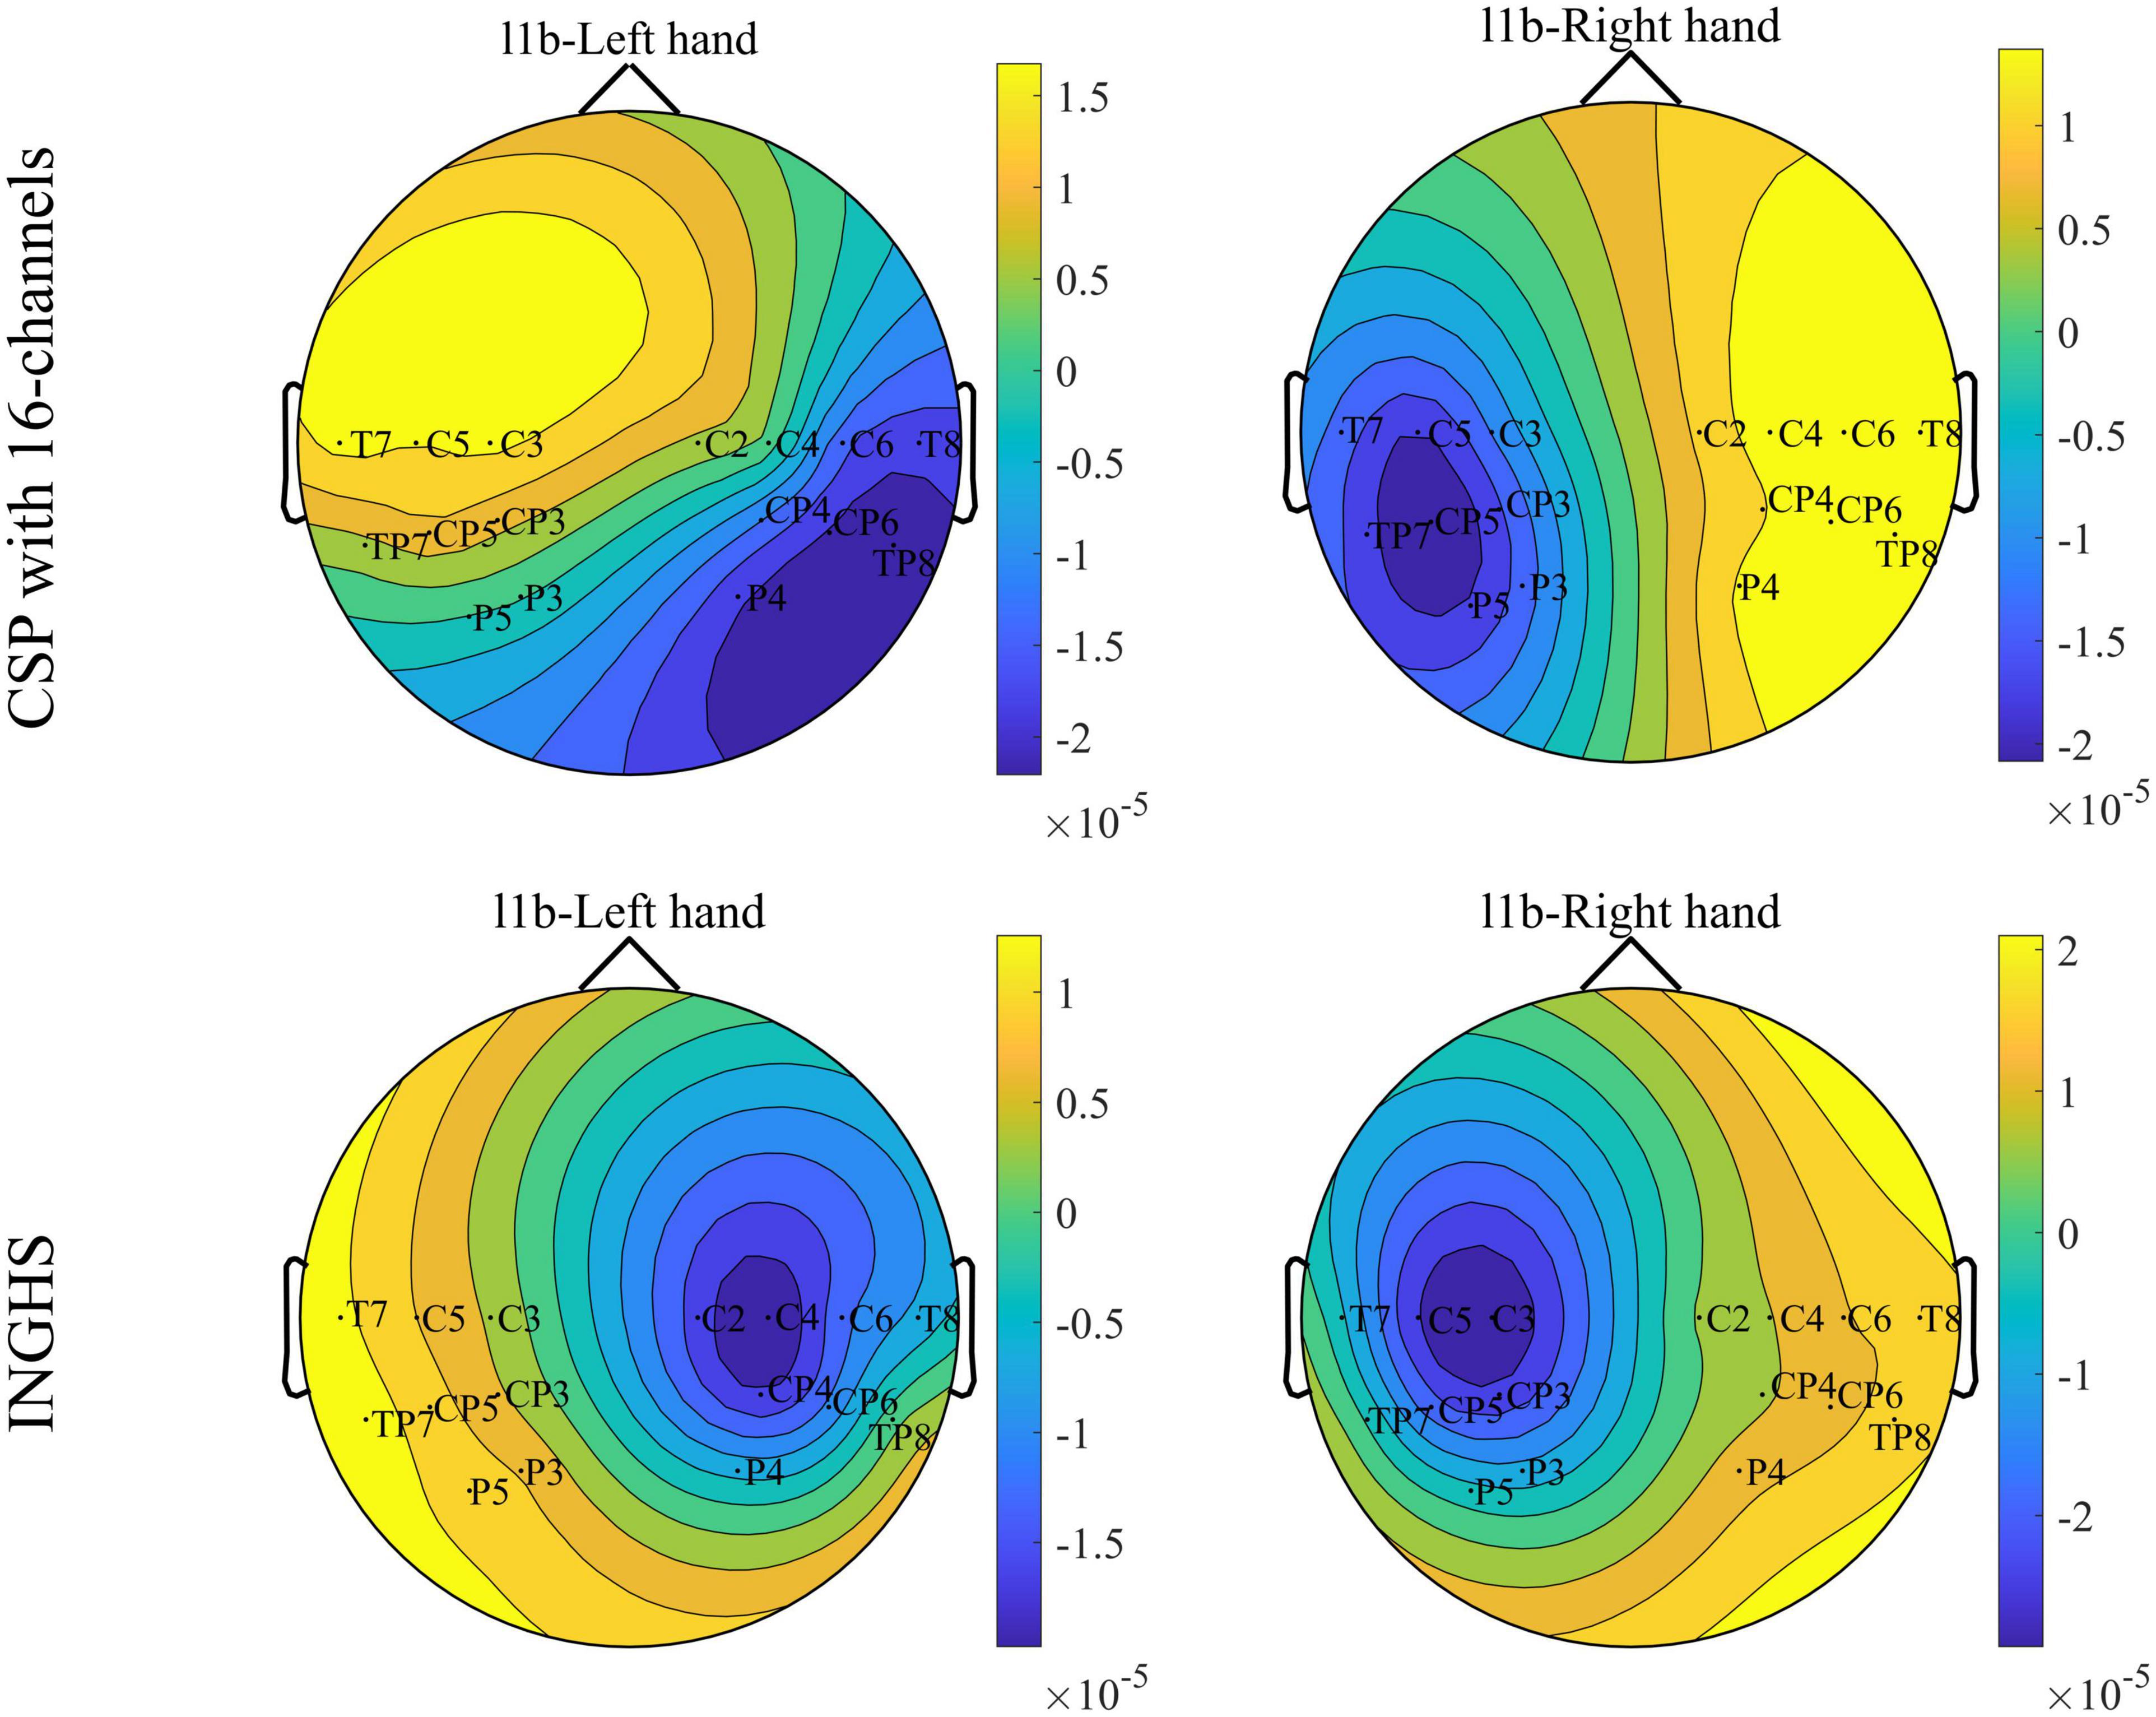
Figure 9. Comparison of spatial patterns for the subject “l1b.”
Computational cost comparison
The computational time of the different methods for three data sets is shown in Table 7. The running time mainly refers to the iteration time of the algorithm, excluding preprocessing and channel selection. The computational time denotes the average running time of all subjects in a single data set. As shown in Table 7, compared with PSO and ABC, the average time spent by the LDA-based INGHS method for all of the data was reduced by 78.2 and 85.2%, respectively. The results show that the proposed method in our study takes less time than PSO and ABC. The main reason is that in contrast to INGHS algorithms in which a unique solution is generated at each iteration, population-based meta-heuristic algorithms (PSO and ABC) take more time to maintain a set of solutions that evolve at each iteration. Although our proposed INGHS method takes less time than other methods, we expect to dramatically reduce the computational cost to speed up the training phase.
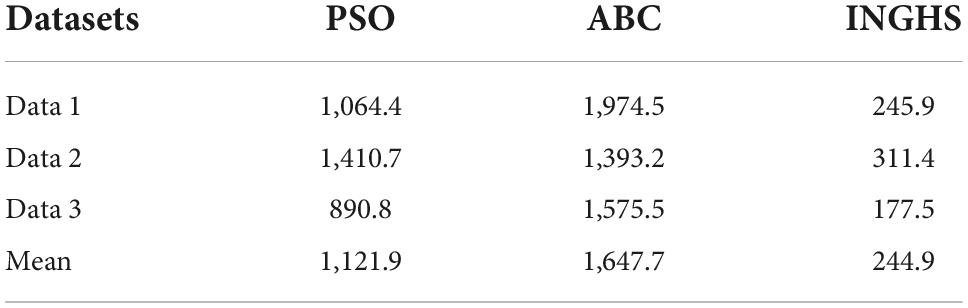
Table 7. Computational time (s) comparisons of different methods for three data sets.
Comparison of the existed methods
Table 8 shows the test classification accuracy between the proposed INGHS method and the existed methods (FBCSP and SFBCSP). The time length was 0–3.5 s for Data 2 on the FBCSP and SFBCSP. For the FBCSP, the sub-frequency bands are divided into 4–8, 6–10, 8–12…, 36–40 Hz. CSP features are extracted for the whole time window in each sub-frequency band, and then the Mutual Information based Best Individual Feature (MIBIF) selection algorithm is used. CSP features of the frequency band are automatically selected. Based on the mutual information value of a single feature, the features corresponding to the first four sub-frequency bands are selected for subsequent training and testing. For SFBCSP method, sub-band division are the same as FBCSP, the LASSO is used for feature optimization. The 16-channel mode for the FBCSP and SFBCSP is the same as INGHS. Each value in Table 8 is the fivefold cross-validation mean test accuracy. The LDA is used as classification method. The proposed INGHS method achieved higher average classification accuracies compared to the FBCSP and SFBCSP methods. In addition, the average accuracy rate improvements achieved by INGHS were 3.5 and 2.5% in comparison with the FBCSP and SFBCSP methods.
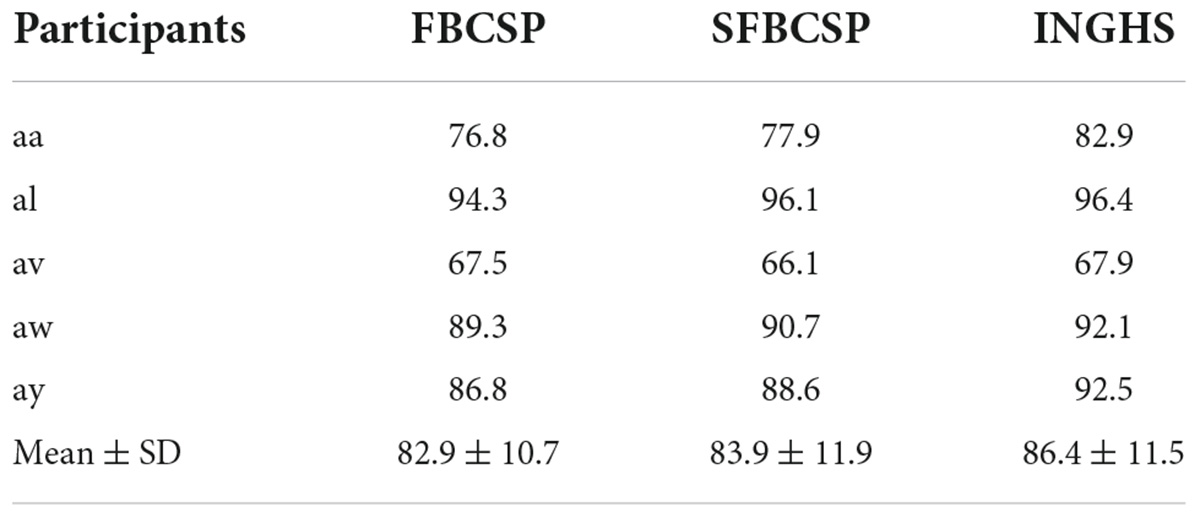
Table 8. Test classification accuracy (%) of the INGHS and existed methods.
Limitations and extensions
The proposed frequency-temporal parameters optimization method based on INGHS could yield better test accuracy compared with the traditional CSP method. Furthermore, compared with PSO and ABC, the proposed method takes less computation time because of the simple iterative principle of the INGHS algorithm which can quickly converge to the global optimal value. However, the channel selection step precedes time-frequency optimization, and we will further explore the impact of spatial-frequency-time domain simultaneous optimization on classification performance in the future. Moreover, the proposed INGHS method only validates the binary classification performance of MI-BCI systems, and further research is needed to apply the proposed time-frequency parameter optimization algorithm to multi-classification problems.
Conclusion
In this study, an approach of frequency-time feature optimization based on the INGHS is proposed for MI EEG decoding. Three EEG datasets are used to verify the effectiveness of proposed INGHS method. The proposed method could improve classification accuracy in comparison to the classical CSP method. Moreover, the average test accuracy achieved by the INGHS is slightly better than that obtained by ABC and PSO based on LDA and SVM. Furthermore, the INGHS algorithm is superior to PSO and ABC in running time. The results demonstrate that the optimal frequency band and time interval provided by the INGHS algorithm could indeed improve the classification accuracy. Future studies will investigate the performance of our proposed INGHS method on other types of BCI systems.
Data availability statement
The original contributions presented in this study are included in the article/supplementary material, further inquiries can be directed to the corresponding authors.
Author contributions
BS performed the study, analyzed the data, and was responsible for drafting the manuscript. XC, ZY, and SY helped to perform the study and revised the manuscript. FZ, BW, and JW analyzed and discussed the results. All authors read and approved the final manuscript.
Funding
This work was supported by the Key Research and Development Plan of Shaanxi Program (grant number: 2019SF-109). BS thanks the China Scholarship Council (CSC) for financial support (grant number: 202006280405). This work was also supported by Shenzhen Longgang District Economic and Technological Development Special Plan (grant numbers: LGKCYLWS2021000014 and 2021001814).
Conflict of interest
The authors declare that the research was conducted in the absence of any commercial or financial relationships that could be construed as a potential conflict of interest.
Publisher’s note
All claims expressed in this article are solely those of the authors and do not necessarily represent those of their affiliated organizations, or those of the publisher, the editors and the reviewers. Any product that may be evaluated in this article, or claim that may be made by its manufacturer, is not guaranteed or endorsed by the publisher.
References
Alvarez-Meza, A. M., Velasquez-Martinez, L. F., and Castellanos-Dominguez, G. (2015). Time-series discrimination using feature relevance analysis in motor imagery classification. Neurocomputing 151, 122–129. doi: 10.1016/j.neucom.2014.07.077
Blankertz, B., Tomioka, R., Lemm, S., Kawanabe, M., and Muller, K. R. (2007). Optimizing spatial filters for robust EEG single-trial analysis. IEEE Signal Process. Mag. 25, 41–56. doi: 10.1109/MSP.2008.4408441
Cervera, M. A., Soekadar, S. R., Ushiba, J., Millán, J., and Garipelli, G. (2018). Brain-computer interfaces for post-stroke motor rehabilitation: A meta-analysis. Ann. Clin. Transl. Neurol. 5, 651–663. doi: 10.1002/acn3.544
Chang, C. C., and Lin, C. J. (2011). LIBSVM: A library for support vector machines[J]. ACM Trans. Intell. Syst. Technol. (TIST) 2, 1–27. doi: 10.1145/1961189.1961199
Chaudhary, S., Taran, S., Bajaj, V., and Sengur, A. (2019). Convolutional neural network based approach towards motor imagery tasks EEG signals classification. IEEE Sens. J. 19, 4494–4500. doi: 10.1088/1741-2552/ab0ab5
Feng, J., Yin, E., Jin, J., Saab, R., Daly, I., Wang, X., et al. (2018). Towards correlation-based time window selection method for motor imagery BCIs. Neural Netw. 102, 87–95. doi: 10.1016/j.neunet.2018.02.011
Geem, Z. W., Kim, J., and Loganathan, G. (2001). Music-inspired optimization algorithm harmony search. Simulation 76, 60–68.
Hamedi, M., Salleh, S.-H., and Noor, A. M. (2016). Electroencephalographic motor imagery brain connectivity analysis for BCI: A review. Neural Comput. 28, 999–1041. doi: 10.1162/NECO_a_00838
He, L., Gu, Z., Li, Y., and Yu, Z. (2010). “Classifying motor imagery EEG signals by iterative channel elimination according to compound weight,” in International conference on artificial intelligence and computational intelligence, (Berlin: Springer), 71–78. doi: 10.1007/978-3-642-16527-6_11
He, L., Hu, Y., Li, Y., and Li, D. (2013). Channel selection by Rayleigh coefficient maximization based genetic algorithm for classifying single-trial motor imagery EEG. Neurocomputing 121, 423–433. doi: 10.1016/j.neucom.2013.05.005
Ince, N. F., Goksu, F., Tewfik, A. H., and Arica, S. (2009). Adapting subject specific motor imagery EEG patterns in space–time–frequency for a brain computer interface. Biomed. Signal Process. Control 4, 236–246. doi: 10.1109/IEMBS.2006.260052
Ince, N. F., Tewfik, A. H., and Arica, S. (2007). Extraction subject-specific motor imagery time–frequency patterns for single trial EEG classification. Comput. Biol. Med. 37, 499–508. doi: 10.1016/j.compbiomed.2006.08.014
Jiao, Y., Zhou, T., Yao, L., Zhou, G., and Zhang, Y. (2020). Multi-view multi-scale optimization of feature representation for EEG classification improvement. IEEE Trans. Neural Syst. Rehabil. Eng. 28, 2589–2597.
Jin, J., Liu, C., Daly, I., Miao, Y., Li, S., Wang, X., et al. (2020). Bispectrum-based channel selection for motor imagery based brain-computer interfacing. IEEE Trans. Neural Syst. Rehabil. Eng. 28, 2153–2163. doi: 10.1109/TNSRE.2020.3020975
Jin, J., Miao, Y., Daly, I., Zuo, C., Hu, D., and Cichocki, A. (2019). Correlation-based channel selection and regularized feature optimization for MI-based BCI. Neural Netw. 118, 262–270. doi: 10.1016/j.neunet.2019.07.008
Jin, J., Xiao, R., Daly, I., Miao, Y., Wang, X., and Cichocki, A. (2021). Internal feature selection method of CSP based on L1-norm and dempster-shafer theory. IEEE Trans. Neural Netw. Learn Syst. 32, 4814–4825. doi: 10.1109/TNNLS.2020.3015505
Kai, K. A., Zhang, Y. C., Zhang, H., and Guan, C. (2008). “Filter bank common spatial pattern (FBCSP) in brain-computer interface,” in Proceedings of the IEEE international joint conference on neural networks, Hong Kong, 2390–2397.
Lazarou, I., Nikolopoulos, S., Petrantonakis, P. C., Kompatsiaris, I., and Tsolaki, M. (2018). EEG-based brain-computer interfaces for communication and rehabilitation of people with motor impairment: A novel approach of the 21 (st) century. Front. Hum. Neurosci. 12:14. doi: 10.3389/fnhum.2018.00014
Li, L., Xu, G., Xie, J., and Li, M. (2019). Classification of single-trial motor imagery EEG by complexity regularization. Neural Comput. Appl. 31, 1959–1965. doi: 10.1007/s00521-017-3174-6
Mahdavi, M., Fesanghary, M., and Damangir, E. (2007). An improved harmony search algorithm for solving optimization problems. Appl. Math. Comput. 188, 1567–1579. doi: 10.1016/j.amc.2006.11.033
Mcfarland, D. J., Mccane, L. M., David, S. V., and Wolpaw, J. R. (1997). Spatial filter selection for EEG-based communication. Electroencephalogr. Clin. Neurophysiol. 103, 386–394. doi: 10.1016/S0013-4694(97)00022-2
Miao, M., Wang, A., and Liu, F. (2017a). Application of artificial bee colony algorithm in feature optimization for motor imagery EEG classification. Neural Comput. Appl. 30, 3677–3691. doi: 10.3233/BME-201081
Miao, M., Zeng, H., Wang, A., Zhao, C., and Liu, F. (2017b). Discriminative spatial-frequency-temporal feature extraction and classification of motor imagery EEG: An sparse regression and weighted naive bayesian classifier-based approach. J. Neurosci. Methods 278, 13–24. doi: 10.1016/j.jneumeth.2016.12.010
Mirzaei, S., and Ghasemi, P. (2021). EEG motor imagery classification using dynamic connectivity patterns and convolutional autoencoder. Biomed. Signal Process. Control 68, 102584. doi: 10.1016/j.bspc.2021.102584
Mladenović, J., Frey, J., Pramij, S., Mattout, J., and Lotte, F. (2022). Towards identifying optimal biased feedback for various user states and traits in motor imagery BCI. IEEE Trans. Biomed. Eng. 69, 1101–1110. doi: 10.1109/TBME.2021.3113854
Mudgal, S. K., Sharma, S., Chaturvedi, I., and Sharma, A. (2020). Brain Computer Interface advancement in neurosciences: Applications and issues. Interdiscip. Neurosurg. 20:100694. doi: 10.1016/j.inat.2020.100694
Nicolas-Alonso, L. F., and Gomez-Gil, J. (2012). Brain computer interfaces, a review. Sensors 12, 1211–1279. doi: 10.3390/s120201211
Nicolas-Alonso, L. F., Corralejo, R., Gomez-Pilar, J., Alvarez, D., and Hornero, R. (2015). Adaptive semi-supervised classification to reduce intersession non-stationarity in multiclass motor imagery-based brain-computer interfaces. Neurocomputing 159, 186–196. doi: 10.1016/j.neucom.2015.02.005
Omran, M., and Mahdavi, M. (2008). Global-best harmony search. Appl. Math. Comput. 198, 643–656. doi: 10.1016/j.amc.2007.09.004
Ouyang, H. B., Gao, L. Q., Li, S., and Kong, X. Y. (2015). Improved novel global harmony search with a new relaxation method for reliability optimization problems. Inf. Sci. 305, 14–55. doi: 10.1016/j.ins.2015.01.020
Ouyang, H., Wu, W., Zhang, C., Li, S., Zou, D., and Liu, G. (2018). Improved harmony search with general iteration models for engineering design optimization problems. Soft Comput. 23, 1–36.
Pfurtscheller, G., Brunner, C., Schlögl, A., and Silva, F. (2006). Mu rhythm (de)synchronization and EEG single-trial classification of different motor imagery tasks. Neuroimage 31, 153–159. doi: 10.1016/j.neuroimage.2005.12.003
Pfurtscheller, G., Flotzinger, D., and Kalcher, J. (1993). Brain-computer interface—a new communication device for handicapped persons. J. Microcomputer Appl. 16, 293–299.
Quadrianto, N., Cuntai, G., Dat, T. H., and Xue, P. (2007). “Sub-band common spatial pattern (SBCSP) for brain-computer interface,” in Proceedings of the International IEEE/EMBS conference on neural engineering, Kohala Coast, HI, 204–207. doi: 10.1016/j.cmpb.2021.106150
Ramoser, H., and Muller-Gerking, J. (2000). Optimal spatial filtering of single trial EEG during imagined hand movement. IEEE Trans. Rehabil. Eng. 8, 441–446. doi: 10.1109/86.895946
Rasheed, S. (2021). A review of the role of machine learning techniques towards brain–computer interface applications. Mach. Learn. Knowl. Extraction 3, 835–862. doi: 10.3390/make3040042
Rashid, M., Sulaiman, N., Majeed, A., Musa, R. M., and Khatun, S. (2020). Current Status, challenges, and possible solutions of EEG-based brain-computer interface: A comprehensive review. Front. Neurorobot. 14:25. doi: 10.3389/fnbot.2020.00025
Siuly, S., and Li, Y. (2015). Discriminating the brain activities for brain–computer interface applications through the optimal allocation-based approach. Neural Comput. Appl. 26, 799–811. doi: 10.1007/s00521-014-1753-3
Sreeja, S. R., Rabha, J., Nagarjuna, K. Y., Samanta, D., Mitra, P., and Sarma, M. (2017). Motor imagery EEG signal processing and classification using machine learning approach. Amman: IEEE, 61–66. doi: 10.1109/ICTCS.2017.15
Talaei, K., Rahati, A., and Idoumghar, L. (2020). A novel harmony search algorithm and its application to data clustering. Appl. Soft Comput. 92:106273. doi: 10.6026/97320630009084
Tao, W., Jie, D., and He, B. (2004). Classifying EEG-based motor imagery tasks by means of time–frequency synthesized spatial patterns. Clin. Neurophysiol. 115, 2744–2753. doi: 10.1016/j.clinph.2004.06.022
Thomas, K. P., Guan, C., Lau, C. T., Vinod, A. P., and Kai, K. A. (2009). A new discriminative common spatial pattern method for motor imagery brain–computer interfaces. IEEE Trans. Biomed. Eng. 56, 2730–2733. doi: 10.1109/TBME.2009.2026181
Wang, K., Xu, M., Wang, Y., Zhang, S., Chen, L., and Ming, D. (2020). Enhance decoding of pre-movement EEG patterns for brain–computer interfaces. J. Neural Eng. 17:016033. doi: 10.1088/1741-2552/ab598f
Wolpaw, J. R. (2002). Brain-computer interfaces for communication and control. Clin. Neurophysiol. 113, 767–791. doi: 10.1016/S1388-2457(02)00057-3
Xu, M., He, F., Jung, T.-P., Gu, X., and Ming, D. (2021). Current challenges for the practical application of electroencephalography-based brain–computer interfaces. Engineering 12, 1710–1712. doi: 10.1088/1741-2552/ac494f
Xu, M., Xiao, X., Wang, Y., Qi, H., Jung, T. P., and Ming, D. (2018). A brain-computer interface based on miniature-event-related potentials induced by very small lateral visual stimuli. IEEE Trans Biomed. Eng. 65, 1166–1175. doi: 10.1109/TBME.2018.2799661
Xu, P., Liu, T., Zhang, R., Zhang, Y., and Yao, D. (2014). Using particle swarm to select frequency band and time interval for feature extraction of EEG based BCI. Biomed. Signal Process. Control 10, 289–295. doi: 10.1016/j.bspc.2013.08.012
Yang, Y., Chevallier, S., Wiart, J., and Bloch, I. (2017). Subject-specific time-frequency selection for multi-class motor imagery-based BCIs using few Laplacian EEG channels. Biomed. Signal Process. Control 38, 302–311. doi: 10.1016/j.bspc.2017.06.016
Zhang, Y., Zhou, G., Jin, J., Wang, X., and Cichocki, A. (2015). Optimizing spatial patterns with sparse filter bands for motor-imagery based brain–computer interface. J. Neurosci. Methods 255, 85–91. doi: 10.1016/j.jneumeth.2015.08.004
Keywords: brain-computer interface (BCI), common spatial pattern (CSP), frequency band, time interval, improved novel global harmony search (INGHS), electroencephalogram (EEG)
Citation: Shi B, Chen X, Yue Z, Zeng F, Yin S, Wang B and Wang J (2022) Feature optimization based on improved novel global harmony search algorithm for motor imagery electroencephalogram classification. Front. Comput. Neurosci. 16:1004301. doi: 10.3389/fncom.2022.1004301
Received: 27 July 2022; Accepted: 23 November 2022;
Published: 16 December 2022.
Edited by:
Tien-Loc Le, Sejong University, South KoreaReviewed by:
Jing Jin, East China University of Science and Technology, ChinaSouvik Phadikar, The University of Wisconsin–Madison, United States
Minpeng Xu, Tianjin University, China
Copyright © 2022 Shi, Chen, Yue, Zeng, Yin, Wang and Wang. This is an open-access article distributed under the terms of the Creative Commons Attribution License (CC BY). The use, distribution or reproduction in other forums is permitted, provided the original author(s) and the copyright owner(s) are credited and that the original publication in this journal is cited, in accordance with accepted academic practice. No use, distribution or reproduction is permitted which does not comply with these terms.
*Correspondence: Benguo Wang, wbg2001qq@126.com; Jing Wang, wangpele@gmail.com