Deuteron Chemical Exchange Saturation Transfer for the Detection of Slow Motions in Rotating Solids
 Liliya Vugmeyster
 Dmitry Ostrovsky2
 - 1Department of Chemistry, University of Colorado Denver, Denver, CO, United States
- 2Department of Mathematics, University of Colorado Denver, Denver, CO, United States
- 3Department of Chemistry, University of Cincinnati, Cincinnati, OH, United States
- 4National High Field Magnetic Laboratory, Tallahassee, FL, United States
We utilized the 2H Chemical Exchange Saturation Transfer (CEST) technique under magic angle spinning (MAS) conditions to demonstrate the feasibility of the method for studies of slow motions in the solid state. For the quadrupolar anisotropic interaction, the essence of CEST is to scan the saturation pattern over a range of offsets corresponding to the entire spectral region(s) for all conformational states involved, which translates into a range of −60–+ 60 kHz for methyl groups. Rotary resonances occur when the offsets are at half-and full-integer of the MAS rates. The choice of the optimal MAS rate is governed by the condition to reduce the number of rotary resonances in the CEST profile patterns and retain a sufficiently large quadrupolar interaction active under MAS to maintain sensitivity to motions. As examples, we applied this technique to a well-known model compound dimethyl-sulfone (DMS) as well as amyloid-β fibrils selectively deuterated at a single methyl group of A2 belonging to the disordered domain. It is demonstrated that the obtained exchange rate between the two rotameric states of DMS at elevated temperatures fell within known ranges and the fitted model parameters for the fibrils agree well with the previously obtained value using static 2H NMR techniques. Additionally, for the fibrils we have observed characteristic broadening of rotary resonances in the presence of conformational exchange, which provides implications for model selection and refinement. This work sets the stage for future potential extensions of the 2H CEST under MAS technique to multiple-labeled samples in small molecules and proteins.
Introduction
Chemical Exchange Saturation Transfer (CEST) experiments provide insights into the molecular dynamics in solution and solid-state NMR studies (Siemer et al., 2010; Bouvignies and Kay, 2012; Vallurupalli et al., 2012; Palmer, 2014; Rovó and Linser, 2018; Palmer and Koss, 2019). They employ weak RF fields for the saturation of selected frequencies as a function of resonance offsets. In most cases, the fluctuations of the isotropic chemical shift interaction is probed when the conformational states have inequivalent chemical shifts. However, anisotropic interactions can also be targeted in the solid state. These measurements are expected to be useful for probing molecular dynamics in a variety of biological systems, including protein fibrils, aggregates and microcrystals. They can elucidate the presence of minor conformational states exchanging with the major state at a slow timescale with the rate constant in the 5⋅102–5⋅106 s−1 range, with the highest sensitivity around 1⋅104–5⋅105 s−1. Local motional modes of protein side chains, such as rotameric exchange of methyl-bearing side chains, as well as aromatic ring flips can also be probed with the use of this technique. In addition, backbone motions of Cα deuterons can be elucidated for mobile sites such as loop regions.
We recently demonstrated the effectiveness of the technique for fluctuations of the anisotropic quadrupolar tensor of 2H nuclei under static conditions in the solid state (Vugmeyster et al., 2020). The goal of this work is to expand the methodology for magic angle spinning (MAS) conditions. MAS has proven to be indispensable for dynamic studies of many biomolecular samples with multiple labels (Krushelnitsky et al., 2014; van der Wel, 2017; Rovó, 2020). In this work, we use a single-labeled sample to demonstrate the effectiveness of the 2H CEST experiment, which encourages follow-up studies employing polarization transfer approaches to achieve site-specific resolution (Grey et al., 1993; Bjerring et al., 2012; Akbey et al., 2014; Jain et al., 2014; Matlahov and van der Wel, 2018).
In particular, we apply the experiment to the model compound dimethyl-sulfone (DMS) deuterated at its two methyl groups that undergo 2-site rotameric exchange (Frydman et al., 1994; Brown et al., 1996; Gerardy-Montouillout et al., 1996; Favre et al., 1998; Quinn and McDermott, 2012) and to amyloid-β fibrils (Aβ1-40) with the deuterium label at a mobile methyl group of the A2 residue belonging to the disordered N-terminal domain, for which we previously determined the dynamics using static 2H solid-state NMR techniques (Au et al., 2019; Vugmeyster et al., 2019; Vugmeyster et al., 2020). The experimental work is complemented with theoretical considerations using the Liouvillian formalism (Bain and Berno, 2011) and insights into the main features of the CEST profiles resulting from simple 2-site exchange simulations. Our combined experimental and theoretical/modeling analysis allows us to outline consideration for optimization of the technique and define the ranges of its sensitivity to motions.
Experimental
Materials
DMS-D6 and hexamethyl-benzene-D18 were purchased from Cambridge Isotope Laboratories, Inc. (MA) and packed as a powder into rotors. The Aβ1-40 fibrils labeled at the A2-CD3 site were prepared as previously described in the 3-fold symmetric toxic polymorph (Au et al., 2019; Vugmeyster et al., 2020). The monomeric sequence of the Aβ1-40 peptide is D(A-CD3)EFRHDSGYEVHHQKLVFFAEDVGSNKGAIIGLMVGGVV. The lyophilized powder was hydrated to 200% by weight with deuterium-depleted water using direct pipetting and equilibrating at room temperature for 5 days. The hydrated sample was then packed into a 2.5 mm rotor.
NMR Spectroscopy
The measurements for 10 and 25 kHz MAS frequency were performed at 17.6 T Bruker Avance I spectrometer equipped with a Bruker 2.5 mm HXY probe. The measurements at 60 kHz MAS were performed at 14.1 T Bruker neo console spectrometer equipped with a Bruker 1.3 mm HXY probe. The high-power 90° RF pulses corresponded to 2 μs The number of scans for the acquisition was between 32 and 64 for DMS and between 2048 and 3072 for the protein sample. The inter-scan delay was set between 0.5 and 2 s. Because one potential source of systematic error in the 2H CEST intensities is probe detuning, data collection is optimized when the order of the offsets is randomized.
DMS longitudinal relaxation times (T1) are very sensitive to temperatures in around 40–85°C range, and thus we have used it as an internal calibrations standard to obtain the actual temperature in the samples (Vugmeyster and Ostrovsky, 2019). For the 60 kHz MAS rate, the effect of MAS on T1 for a given methyl 3-site jump rate was simulated. We also confirmed that the weak-amplitude RF field does not contribute to heating with the chosen relaxation delay value. The longitudinal relaxation times were measured using the inversion recovery experiment, which included a heat compensation block to match the temperature conditions of the sample in the CEST measurements.
Modeling
The simulations were performed on a cluster comprising six x86_64 computer nodes. Each node had 16 Intel Xenon Silver dual core CPUs and 16 GB of memory. The procedures closely followed those developed for static conditions in prior work (Vugmeyster et al., 2020). Here, we focus on the details pertinent to MAS conditions.
The evolution of the coherences under MAS was modeled by the direct numerical integration of the Liouville–von Neumann equation (Supplementary Equation. S1; all the notations used are elaborated in the Theory section of the Supplementary Material SI1). The coherent time-dependent values of the quadrupolar frequency
The detection block was performed starting with the approach described for the static case. As usual, the value of
For the fibrils, longitudinal relaxation was taken into account phenomenologically (with T1 = 50 ms) by including an additional term in the Liouvillian evolution matrix, which was identical for all eight coherences. This approach was tested for DMS for which the inclusion of the 3-site jumps mode explicitly yielded the same results. To model the effects of the RF inhomogeneity on the CEST profiles, we included five values of
The RF inhomogeneity profiles (Figure 1B) were discretized by selecting a grid of either six points (for resonance offset values outside the −2–2 kHz region) or 30 points (in the −2–2 kHz region). A larger number of points for the central region was needed due to the enhanced coherent oscillations. The six grid points of the RF inhomogeneity profiles corresponded to the RF field values at 0.25, 0.5, 0.75, 1, 1.25, and 1.5 multiples of the average frequency with the respective relative weights (0.084, 0.143, 0.126, 0.176, 0.285, 0.187 and 0.065, 0.097, 0.103, 0.236, 0.499, 0) for the 1.3 and 2.5 mm probes, respectively. The 30-point grids were obtained by the interpolation of the six-point grids.
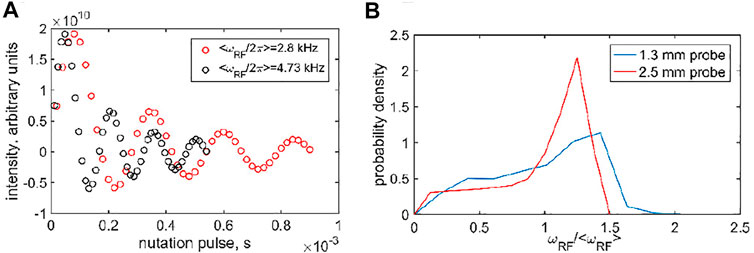
FIGURE 1. (A) Examples of the 2H nutation measurements used to determine RF inhomogeneity, shown for the 1.3 mm Bruker HXY probe using the DMS-D6 central band intensity at the 60 kHz MAS rate at 14.1 T. (B) Resulting inhomogeneity profiles, obtained as the Fourier analysis of the nutation data, as a function of ωRF/<ωRF > obtained for a <ωRF > range of 2.8–20 kHz for the 1.3 mm Bruker HX probe using DMS-D6 (at 14.1 T) and 5–31 kHz for the 2.5 mm Bruker HXY probe using HMB-D18 (at 17.6 T).
Results and Discussion
Details on the Systems and Known Motional Models
DMS has been widely used as a model system for solid-state NMR technique development and, in particular, for deuteron NMR. Its methyl group undergoes a 2-site rotameric exchange with an angle of rotation of 180° around the C2 axis of the molecule (Frydman et al., 1994; Brown et al., 1996; Gerardy-Montouillout et al., 1996; Favre et al., 1998; Quinn and McDermott, 2012). These motions are the most pronounced above around 45°C. We have previously utilized this system to develop a deuteron CEST measurement under static conditions and extend it in this work to MAS conditions (Vugmeyster and Ostrovsky, 2019). The 2H spectra under static and MAS conditions (at spinning rates of 10, 25, and 60 kHz) are shown in Figure 2. Although there are some spectral distortions due to the motions in the regime in which the flip rate is of the order of the effective value of the quadrupolar constant, the overall width of the pattern remains largely unchanged by the motions. The quadrupolar coupling constant is 55 kHz after averaging over fast methyl rotations.
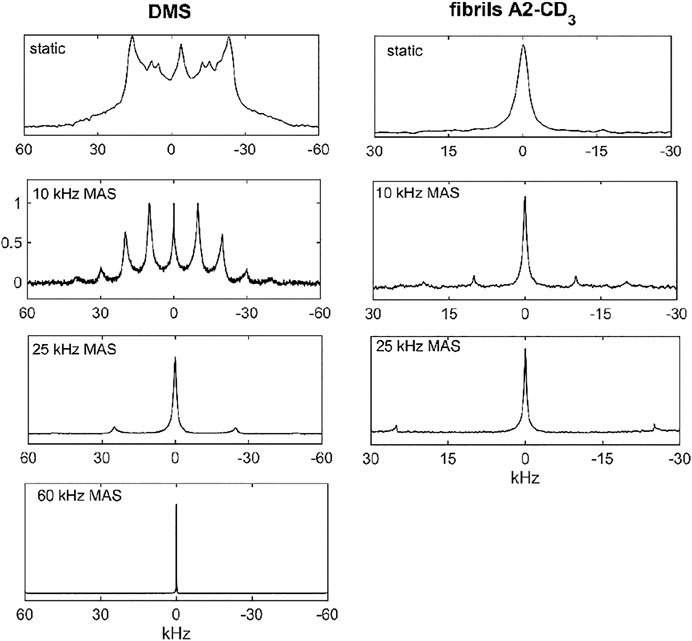
FIGURE 2. Spectra for DMS-D6 (left column) and hydrated Aβ1-40 fibrils in the 3-fold symmetric polymorph labeled at the A2-CD3 site (right column). The following conditions applied: static data–14.1 T and 76°C for DMS and 37°C for the fibrils; 10 and 25 kHz MAS rates–17.6 T and 76°C for DMS and 37°C for the fibrils; 60 kHz MAS rate for DMS only–14.1 T and 55°C. The number of scans and processing parameters are listed in Supplementary Table S1.
Our second system is designed to test the applicability of the methods to protein samples with much lower sensitivities than small molecule compounds and with complex motional models. In particular, we employ amyloid fibril systems with monomers consisting of Aβ1-40 labeled at a single methyl group: the CD3 side chain of the A2 residue located in the beginning of the flexible N-terminal domain (spanning residues 1–16). We have previously characterized the motions of this domain at the A2-CD3 site using static solid-state NMR techniques (Au et al., 2019; Vugmeyster et al., 2019; Vugmeyster et al., 2020). In the hydrated state, the μs-ms motions at this site can be described by two essential processes. The main state (labeled as “free” in Figure 3B) is characterized by the pronounced large-scale fluctuations of the domain, approximated as isotropic diffusion with the diffusion coefficient D. They dramatically narrow the static linewidth (Figure 2) with an effective quadrupolar coupling constant of around 3 kHz. This value should be compared with the 53–55 kHz quadrupolar coupling constant expected for the methyl group without large-scale motions (Vold and Vold, 1991). There is also a minor state of the domain at around 8% of the population for the A2-CD3 site, in which this diffusive motion is quenched. The two states are in the conformational exchange process, with the rate constant (kex) ranges as determined previously. The presence of the chemical exchange process was particularly evident from the dispersion pattern of 2H R1ρ profiles under static conditions. (Au et al., 2019). The combined analysis of the 2H static rotating frame relaxation rates R1ρ, quadrupolar CPMG, and CEST calls for a more complicated model in which there is an ensemble of free states with a range of diffusion coefficients that are in conformational exchange with a single rigid bound state. Our strategy to extend the experiment to MAS conditions is to employ the simplest 2-state model of Figure 3B and assess if the fitted values of D and kex fall within the boundaries found by previous 2H static NMR techniques.
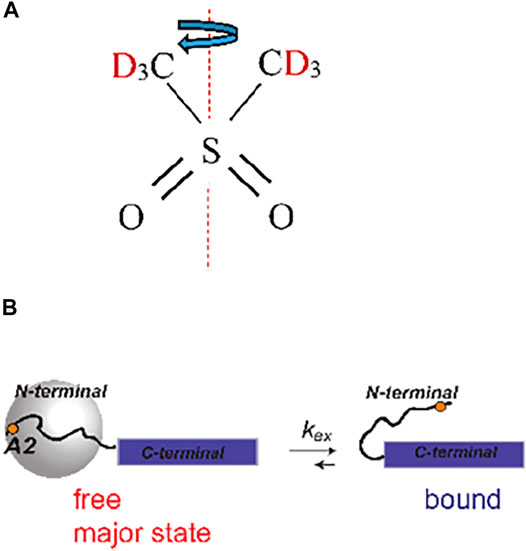
FIGURE 3. (A) Structure of DMS indicating the 180° flipping motion around the C2 axis. (B) Slow time-scale motional modes of the A2-CD3 methyl group of the N-terminal domain of Aβ1-40 fibrils (Au et al., 2019). The disordered N-terminal domain (residues 1–16, curved line) transiently interacts with the structured C-terminal domain (blue rectangle). In the free state, the N-terminal domain undergoes large-scale diffusive motion, as represented by the gray sphere, which is absent in the bound state. The position of the A2 residue is shown as an orange dot.
Quadrupolar Chemical Exchange Saturation Transfer Experiment and RF Field Strength Calibrations
A simple quadrupolar CEST pulse sequence (Supplementary Figure S1) consists of the low-amplitude saturation pulse ωRF (T, Ω) that acts on the longitudinal magnetization, followed by a non-selective 90° pulse with the same phase that brings the magnetization to the transverse plane for detection. The essence of the quadrupolar CEST is to scan the resonance offset values Ω corresponding to the entire spectral region(s) for all conformational states involved, which often falls into the −60–+60 kHz range for methyl groups. The saturation time T is chosen to optimize the efficiency of the conformational exchange and competing longitudinal relaxation. For deuteron in the methyl groups, typical values of T are expected to be between 1 and 40 ms. To determine the motional parameters, the RF field strength should be lower than the typical value of the quadrupolar frequencies (defined in Eq. 4 in the Theory section) in the two exchanging states. For methyl groups, the 1–5 kHz range is likely to represent the optimal conditions for most samples.
Precise calibrations of the RF field strength using the nutation experiment is complicated by two factors: the evolution of quadrupolar coupling during the nutation pulse and presence of RF inhomogeneity. The evolution of quadrupolar coupling is stronger for larger quadrupolar coupling constants and lower MAS rates (Supplementary Figure S2). The effective width of the DMS quadrupolar tensor after averaging over methyl rotations is around 55 kHz. Thus, for the 60 kHz MAS rate, the nutation experiment can be performed on the DMS central band directly with a slight correction for quadrupolar evolution. However, for the 10 and 25 kHz MAS rates, quadrupolar evolution during the nutation pulse is too pronounced and nutation can instead be performed on compounds with naturally narrower tensors. One option is to use liquid D2O under static conditions, utilizing the same probe as used for the compound of interest. If a solid powder sample is desirable, a good choice is hexamethyl-benzene-D18, whose six methyl groups participate in fast methyl jumps and 6-site jumps about the ring axis, (Vold, 1994; Gupta et al., 2015), leading to an effective quadrupolar coupling constant of about 23 kHz with an asymmetry parameter of 0.07 (Vold et al., 2009). In principle, it is also possible to perform nutation measurements directly on the fibrils sample labeled at the A2-CD3 site due to the narrow effective tensor in the dominant state of the fibrils at the A2 site (Figure 2B).
The RF inhomogeneity profiles can also be assessed using the nutation experiment (Figure 1A) (Gupta et al., 2015) For the 2.5 mm Bruker probe used for the 10 and 25 kHz MAS rates, powder HMB-D18 is the sample of choice with the sample in the rotor having a comparable length to that of DMS in the same probe. DMS is used for the 1.3 mm Bruker probe at the 60 kHz MAS rate. The RF inhomogeneity profiles (i.e., the shape of the distribution of the RF frequencies detected by the nutation experiment) are approximately proportional to the average RF frequency for a number of nominal applied RF powers. This allows us to construct a combined profile as a function of ωRF/<ωRF > (Figure 1B), in which <ωRF > is the weighted average over the distribution. We report <ωRF > as the RF field strength for the CEST measurements. The inhomogeneity is rather significant and roughly comparable with the profiles reported by Gupta et al. for the 2.5 mm probe focusing on 13C frequency (Gupta et al., 2015). The inhomogeneity can be expected to affect the CEST measurements. Thus, the modeling procedures for the simulations of the dynamics also need to include these distributions.
Insights From Theory and Simulations
The following matrices (plus the identity matrix) constitute a basis of the density matrix for the spin-1 system, as well as operators acting in this space: (Grey et al., 1993)
The first row represents the single-quantum coherences, followed by the two double-quantum coherences,
During the saturation period and in the frame rotating with the Larmor frequency, the secular part of the Hamiltonian is given by
where
The quadrupolar coupling constant is given by
Under MAS rotation and with
where β and α are the polar and azimuthal angles with respect to the axis of rotation.
In the frame with an additional rotation with frequency Ω around the z-axis, the Hamiltonian of Eq. 2 can be transformed into the tilted frame:
Analogous to the off-resonance rotating frame relaxation case considered in detail for homonuclear interactions, (Rovó and Linser, 2017; Krushelnitsky et al., 2018; Rovó et al., 2019), the effect of the last two terms of Eq. 5 can be considered as an action of the effective field given by
For the small values of
Figure 4 demonstrates several examples of 2H CEST profiles corresponding to coherent contributions in the absence of motions for axially symmetric tensors with three values of Cq (20, 55, and 180 kHz), MAS rates of 25, 60, and 120 kHz, and ωRF = 1.3 kHz. The rotary resonances are evident at the values of the offsets equal to integer and half-integer values of the MAS frequency. Their intensities are modulated by the interplay between the MAS rates and Cq. The intensity of the resonances depends on the spectral intensity at
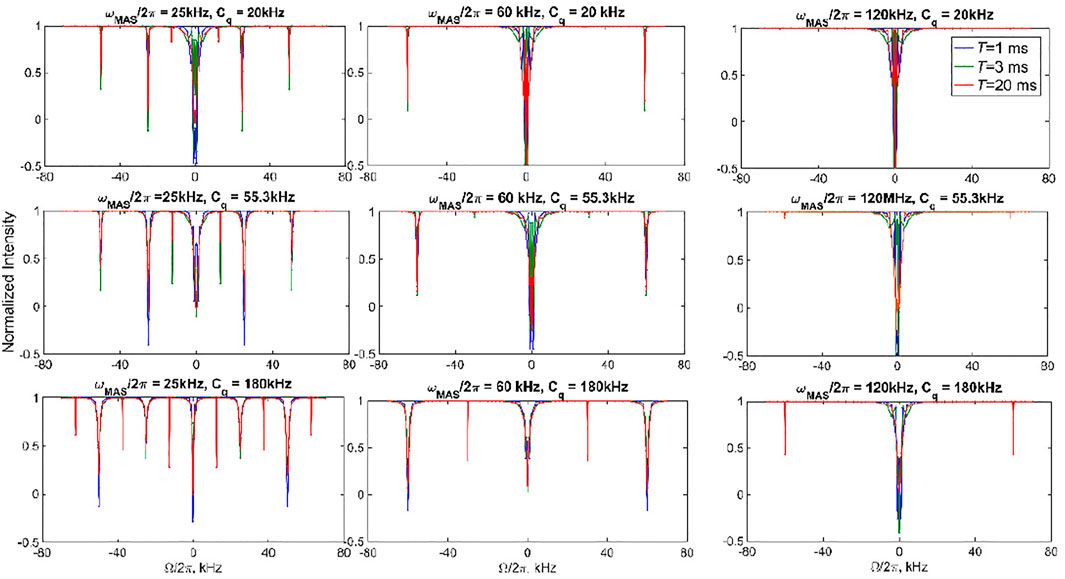
FIGURE 4. Simulated 2H CEST profiles in the absence of motions. The integrated intensity of all the spectral side bands normalized to intensity at T = 0 versus offsets
As usual, motions are introduced into the Liouvillian equation by expanding the density matrix ρ into a direct product of the coherences (Eq. 1) and the sites corresponding to either different intra-molecular orientations of the quadrupolar tensor or changes in the value of Cq or η (Vold and Vold, 1991). In this direct product, the coherent evolution acts on the coherences confined to the same site, but with the site-dependent value of
The motions induce the relaxation of the coherences. To gain insights into the effect of motions on the 2H CEST profiles and interplay between the values of the rate constants and MAS rate, we consider the relaxation behavior according to a simple 2-site exchange model with two axially symmetric tensors. The geometry of the motions is chosen as in Figure 3A (i.e., a jump angle of 106°) and three Cq values are considered (Figure 5). We select several resonance offset values, several MAS rates in the 10–120 kHz range, and saturation times T in 0.25–128 ms range for
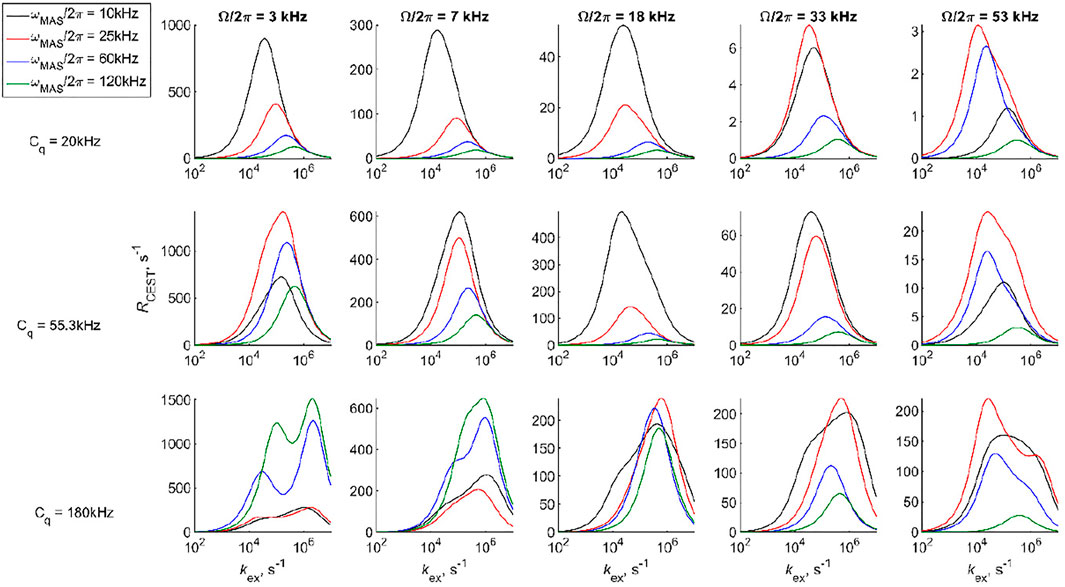
FIGURE 5. Simulated values of RCEST versus kex shown for several selected offsets for the 2-site jump model with equivalent axially symmetric tensors, an equal population of sites, and a jump angle of 106°. The RCEST values were obtained for integrated spectral band intensities with a single exponential approximation to the decay curves for T in the 0.25–128 ms range.
The sensitivity to kex can be seen directly from the simulated CEST profiles of the 2-site exchange model for two axially symmetric tensors, which display characteristic line broadening when the time scale of the exchange processes falls within the range CEST sensitivity (Figure 6). The calculations in Figure 6 are performed with the DMS tensor parameters and geometry of Figure 3A (i.e., Cq values of 55.3 kHz at both sites and a jump angle of 106°) and a fixed MAS rate of 30 kHz. The overall line broadening of the profiles falls into the 104–106 s−1 rate constant range, as expected from the analysis in Figure 5. While ample broadening is observed in the center of this range for all the resonance offset values, at the edges of the sensitivity ranges, the center region for which
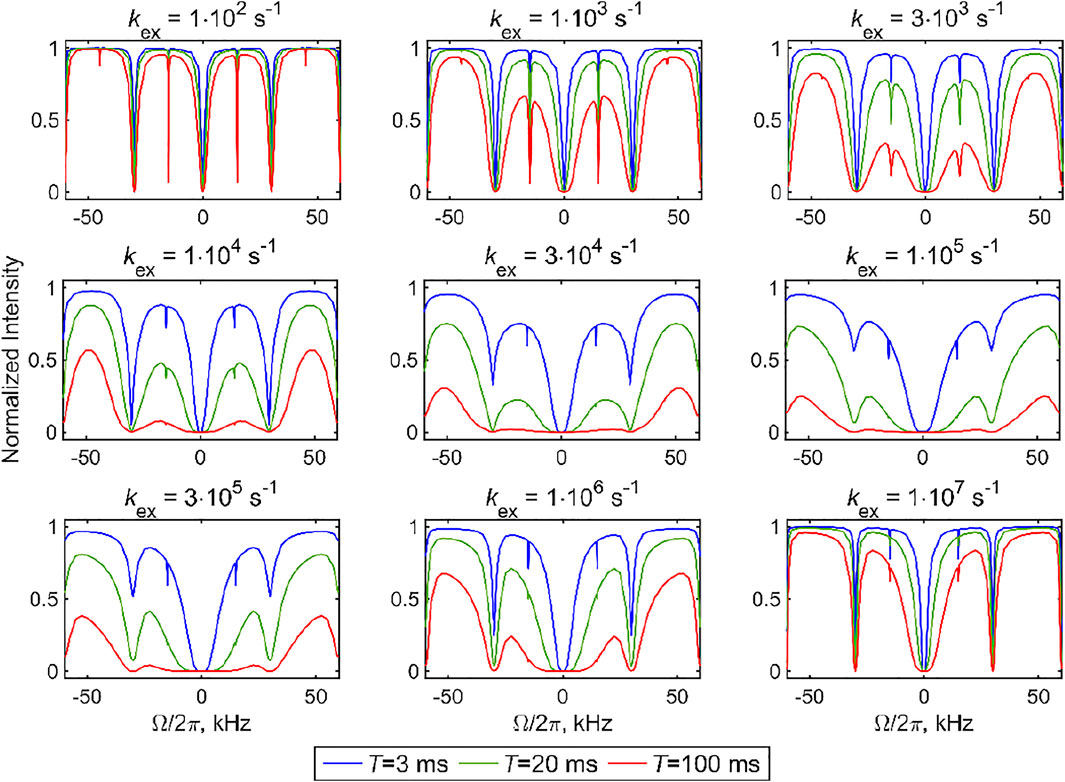
FIGURE 6. Simulated 2H CEST profiles for the 2-site exchange model using two axially symmetric tensors with the quadrupolar coupling constants of Cq = 55.3 kHz in both sites, equal populations, a jump angle of 106°, and values of the kex rate constant between 1⋅102 and 1⋅107 s−1. The integrated intensity of all the spectral side bands normalized to intensity at T = 0 versus offsets
Dimethyl-Sulfone Results
Before evaluating the effect of the motions on the CEST profiles of DMS-D6 at high temperatures at which the motions are most pronounced, we first performed the measurements at a low temperature at which the flip motion is essentially frozen. These measurements were done to confirm the effect of coherent contributions, i.e., the presence of resonances at
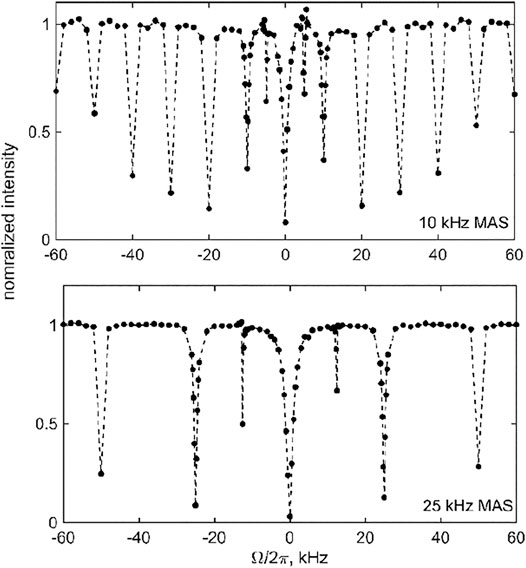
FIGURE 7. Experimental 2H MAS CEST profiles for DMS-D6 at 270 K and 17.6 T for the 1.3 kHz RF field strength and T = 3 ms. Normalized integrated central band intensity versus resonance offset
The presence of multiple resonances (i.e., the coherent contributions shown in Figures 4, 7) in the CEST profiles at low MAS rates precludes the quantitative interpretation of the motional contributions of these profiles. In most cases, a compromise needs to be found between an MAS rate high enough not to render extensive resonance patterns and low enough to retain a sufficient magnitude of the unaveraged quadrupolar interaction. For DMS, we collect high temperature data at the 25 kHz MAS rate (at 76°C, 17.6 T, 2.5 mm probe) and 60 kHz MAS rate (at 55°C, 14.1 T, 1.3 mm probe) to analyze the sensitivity of the profiles to the flipping motion, which is characterized by the rate constant kflip (Figure 3). The overall strategy is to fit the experimental data to simulations as a function of kflip to assess whether the resulting fitted values fall within the range determined by other NMR techniques as well as evaluate the general sensitivity of the technique.
As follows from the theoretical discussion of the 2-site jump model results (Figure 6), it is desirable to obtain the data at more than one combination of RF field strength and saturation time to cross-validate the fits and models. With high sensitivity samples such as DMS, this task is relatively easy to accomplish. We collect the data at the 25 kHz MAS rate at RF field strengths of 1.3 and 2.5 kHz and saturation times of 3 and 20 ms, with the experimental ranges of the spin-locking fields and saturation times mimicking those used to develop the CEST technique under static conditions. For the faster 60 kHz MAS rate, we utilize RF fields in the range of 1.5–4.7 kHz and saturation times between 3 and 20 ms. Figures 8, 9 present the experimental results corresponding to the central band. There is a negligible difference in the profiles when the central band results are compared with the sum of all the bands (Supplementary Figure S5).
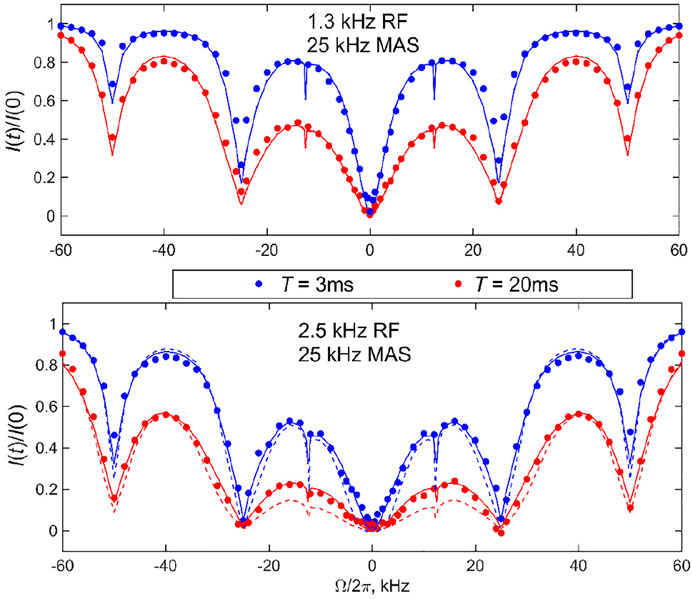
FIGURE 8. 2H CEST center band profiles for DMS at the 25 kHz MAS rate. Experimental normalized integrated central band intensities I(t)/I (0) versus resonance offsets
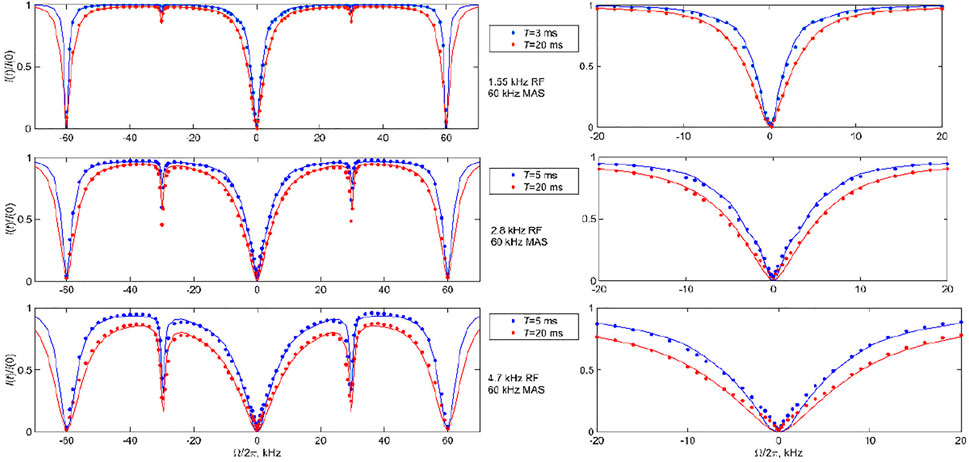
FIGURE 9. 2H CEST central band profiles for DMS at the 60 kHz MAS rate. Experimental normalized integrated central band intensities I(t)/I (0) versus resonance offsets
The data were then fitted with the two-mode motional model: the slow 106o flip mode between two equally populated rotamers with the corresponding rate constant kflip (Figure 3A) and fast time-scale methyl 3-site jumps with the rate constant k3. The kflip rate was varied and k3 value was fixed from the fits to the longitudinal relaxation times T1. The T1 times were measured with the inversion recovery pulse sequence and were 41 ms for 76°C and the 25 kHz MAS rate and 26 ms for 55°C and the 60 kHz MAS rate, corresponding to 3-site jump rate constants of 4.9⋅109 s−1 and 3.2⋅109 s−1, respectively. The best-fit kflip value for the 76°C data was between 9,000 and 10,000 s−1, whereas it was 2,100 s−1 for the 55°C data (shown in Figure 8 as solid lines). These are in the range found by other techniques, particularly static 2H CEST (Au et al., 2019; Vugmeyster et al., 2019; Vugmeyster et al., 2020). All the simulations of the profiles included the effect of the RF inhomogeneity of the coil with the profiles of Figure 1B the CEST profiles simulated without the effect of RF inhomogeneity overestimated the saturation for offsets for which the saturation extent was significant, thus also affecting the overall shape of the profile, not only the resulting fitted rate constant. An example of one such profile simulated without inhomogeneity for
The sensitivity of the fits to kflip is shown in Supplementary Figures S6–S8, which allow us to assess the quality of the fits using the mean absolute difference between the experimental and simulated profiles. They demonstrate that a careful choice of RF field and saturation time delay is needed to determine the motional rate constant precisely. This is especially evident for the 60 kHz MAS data for which a wider range or RF fields are considered. At
The data also confirm the effect of the motions on broadening the rotary resonances: the width of the full-integer rotary resonance widths is consistent between the experiment and simulations at both MAS rates. The half-integer resonances at the high temperature of 76°C at which the flipping motions are most pronounced are completely broadened for the 25 kHz MAS rate results, in accordance with the theory. The simulations show residual first half-integer rotary resonance peaks but these are too small to detect in the experiment. At the lower temperature of 55°C and high MAS rate, the first half-integer resonance is clearly visible in the data. In general, RF inhomogeneity can affect the apparent width of the rotary resonances.
Additional insights can be obtained by focusing on the intensities of selected offsets for several values of
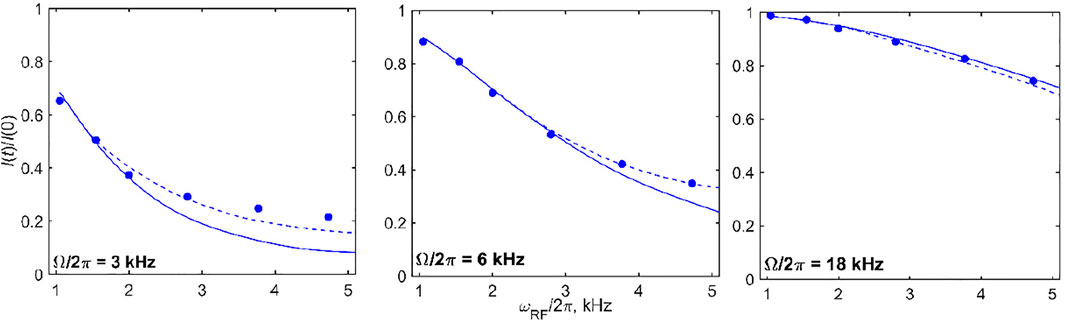
FIGURE 10. 2H CEST DMS central band intensities I(t)/I (0) for selected values of offsets (shown directly on the panels) as a function of
Overall, the analysis of the DMS profiles demonstrates that when the appropriate saturation conditions are satisfied, 2H CEST under MAS is a sensitive technique for the detection of slow time-scale motions. In comparison to methyl groups, for aromatic rings sites and backbone Cα sites, which generally correspond to
Aβ Fibril Results
For the Aβ fibrils labeled at the A2-CD3 site, due to the significant narrowing of the static linewidth in the free state of the fibrils (see the spectra in Figure 2), we choose the 10 and 25 kHz MAS conditions. The measurements were performed at a 17.6 T field strength using a 2.5 mm diameter probe and at 37°C. With significantly longer data acquisition times than for DMS, the single RF field strength of 1.3 kHz and two saturation times of 3 and 20 ms suffice (Figure 11). The overall data collection time was 5.5 days. The profiles clearly display the presence of coherent rotary resonances. The half-integer resonances are difficult to observe due to the need to implement the detailed sampling schedules necessary to catch these relatively narrow dips. We include enough offsets to observe the n = 1 half-integer resonances at
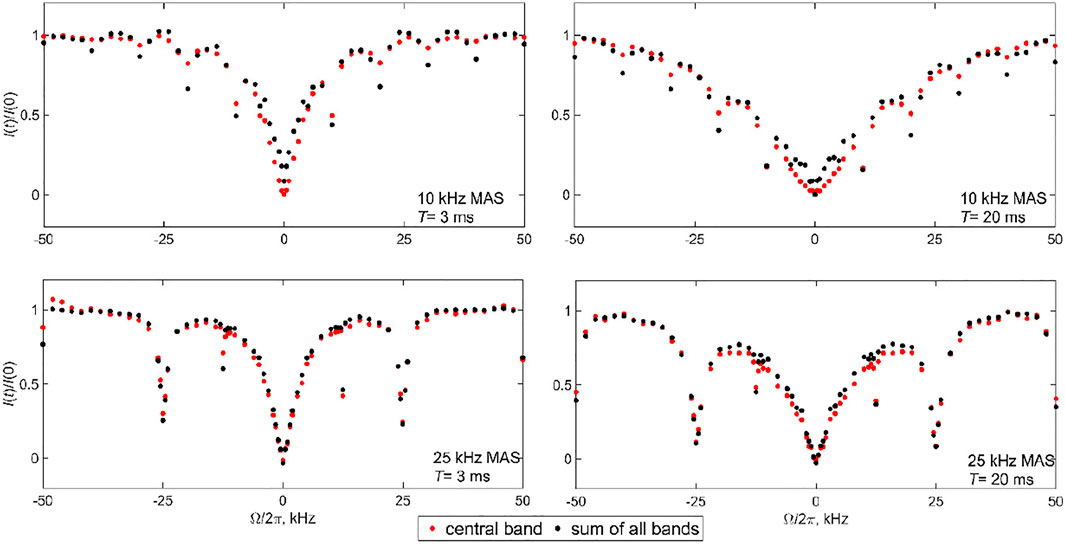
FIGURE 11. Experimental 2H CEST profiles of the Aβ1-40 fibrils labeled at the A2-CD3 side chain. The normalized integrated intensities I(t)/I (0) of the central band (red circles) are compared with the intensities of all the spectra bands shown in the spectra of Figure 2 (black circles) and are plotted as a function of the offsets
The modeling was performed according to the 2-state model of Figure 3B. The diffusive motion of the N-terminal domain in the free state is incorporated via a matrix of 192 neighboring sites on the surface of a sphere, (Au et al., 2019), with one additional site representing the bound state. To optimize the simulation time for the system with many exchanging sites, the additional mode of fast methyl 3-site jumps can be included as a phenomenological R1 term, (Vugmeyster et al., 2020), rather than introducing an additional explicit motional frame that would triple the total number of sites. Including 20 steps in each MAS period and using the model of Figure 3B are computationally demanding tasks (the details are listed in the Modeling section). The simulations took 96 h with our computational system for each MAS rate condition and a single set of the D and kex values with the inclusion of the RF inhomogeneity effect of Figure 1B.
Thus, rather than calculating a comprehensive (D, kex) grid, we retained within the main range found previously using the static CEST and R1ρ methods: the value of D varied from 1⋅106 to 6⋅106 rad2/s, while kex varied from 1⋅104 to 2⋅105 s−1. Further, instead of calculating all the profiles for the best-fit analysis, we focused on a range of characteristic offset values that can capture the widths of the pattern and resonance positions. The values were (±2, ±4, ±6, ±8, ±14, ±16, ±24, ±26 and ±10, ±20, ±30 kHz) for the 10 kHz MAS rate and (±2, ±4, ±6, ±8, ±10, ±16, ±18, ±20, and ±12.5, ±25, ±50 kHz) for the25 kHz MAS rate.
The mean absolute differences of these searches are shown in Supplementary Figure S9. There are shallow minima around the best-fit parameters as follows: for the 10 kHz MAS rate, the values are D= 1.7⋅106 rad2/s and kex = 5⋅104 s−1 for T = 3 ms and D = 1.7⋅106 rad2/s and kex = 1⋅105 s−1 for T = 20 ms, while for the 25 kHz MAS rate, the values are D = 1.0⋅106 rad2/s and kex = 2⋅104 s−1 for T = 3 ms and D = 1.7⋅106 rad2/s and kex = 3⋅104 s−1 for T = 20 ms. These fits are demonstrated in Figure 12 by the solid lines. There is a positive correlation between the D and kex values, which can be rationalized by the fact that fast diffusion narrows the overall CEST pattern, whereas relatively slow conformational exchange widens it. This correlation, which was also noted and analyzed in more detail for the static case, (Vugmeyster et al., 2020), leads to the whole subset of relatively comparable (D, kex) pairs in terms of the quality of the fits. The shallow minima chosen for the profiles in Figure 12 are the result of the compromise between matching the overall width of the pattern across all the offsets and the intensities at the coherent resonances. We have performed fits for individual data sets rather than the combined fit in order to determine the ranges of acceptable parameters within the limitation of the model and correlations between the fitted value of D and kex. If the global fit is performed (Supplementary Material S10), the best-fit parameters are D = 1.7⋅106 rad2/s, kex = 3⋅104 s−1.
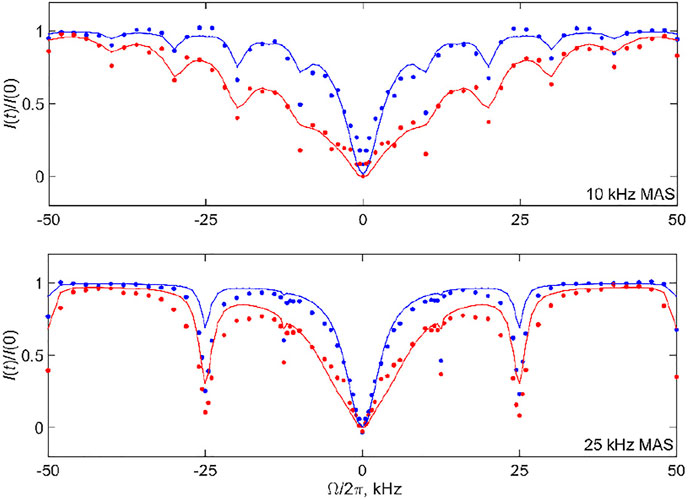
FIGURE 12. 2H CEST profiles of the Aβ1-40 fibrils labeled at the A2-CD3 side chain corresponding to the intensities of all the bands (shown in the spectra of Figure 2) at the 10 and 25 kHz MAS rates. The experimental normalized integrated summed intensities of all the bands I(t)/I (0) versus resonance offsets
The presence of rotary resonances in the data is not trivial, as it confirms from another angle the existence of the slow conformational exchange between the free and bound states of the fibrils. As demonstrated in Supplementray Figure S11, the diffusion mode alone can match the width of the narrow central region in the −6–+6 kHz range. However, it not only misses the overall outer width and shape of the pattern [which was also observed for the static data, see Supplementray Figure S5 of prior work (Vugmeyster et al., 2020)], but also broadens any traces of the coherent resonances. Supplementray Figure S12 demonstrates the alternative fits for the 10 kHz MAS rate, T= 20 ms profile using three (D, kex) pairs, including the best-fit profile of Figure 12. The parameters (D = 6.0⋅106 rad2/s, kex = 2⋅105 s−1) lead to a comparable quality of the overall fit judging by the grid search. However, the dips in intensities at the resonance positions are underestimated compared with the best fit results of Figure 12. By contrast, the parameters (D = 1.0⋅106 rad2/s, kex = 5⋅104 s−1) capture the intensities at the resonances somewhat better at the expense of matching the overall width of the pattern. Thus, the optimal values of kex for observing the existence of coherent resonances fall into the 3–5⋅104 s−1 range. For the 25 kHz MAS rate and T= 20 ms profile, Supplementray Figure S12B shows how the intensity at the first resonance varies for different pairs of (D, kex). While none of them capture the experimental intensity directly, the closest match is seen for kex in the 2–5⋅104 s−1 range, while there is relatively weak dependence on the value of D. As half-integer rotary resonances could be difficult to observe, for most cases of low sensitivity samples the observation of the first full-integer resonance’s intensity and width will be sufficient for constraining the model and its parameters.
Our fits clarify that the model is far from perfect in catching the exact intensities at the resonances. The first half-integer resonances evident in the experimental data are completely absent for both MAS conditions and the first integer resonance is underestimated. This implies that the exchange processes in the fibrils are likely to be more complex than in the simplified model of Figure 3B. Nonetheless, within the precision of the analysis, we confirm the qualitative presence of the conformational exchange and its time scale. Another hint that our model is an oversimplification is suggested by the slight discrepancy between the CEST profiles of the central band and profiles for the sum of all the bands in the 10 kHz MAS data of Figure 6. These discrepancies may reflect the existence of more complex ensembles of free and bound states of the N-terminal subdomain of the fibrils. A previous combined analysis of static 2H NMR CEST, rotating frame R1ρ rates, and QCPMG data of the N-terminal subdomain indicated a complex conformational space, corresponding to an ensemble of conformations for the free state in exchange with a single bound state (Au et al., 2019; Vugmeyster et al., 2019; Vugmeyster et al., 2020). The ensemble is characterized by clusters of D values around 1–3⋅106 rad2/s, and 1⋅108 rad2/s, with corresponding kex values clustered in 0.1–1⋅105 and 1–3⋅106 s−1. The values from the new MAS measurements are in line with these previously determined ranges.
The overall strategies presented for DMS and Aβ fibrils will hold for a variety of biological systems including protein aggregates, complexes, and crystals. Simpler NMR measurements such as line shape analysis can serve as a complementary tool to narrow some of the expected time scale ranges. The determination of the models for this complex systems should start with the simplest scenarios of limited number of exchanging sites, and increase in the level of complexity when governed by the experimental data. Future improvements in the speed of computations are expected to greatly benefit model selection procedures.
Conclusion
The analyses of the results of DMS-D6 with a simple 2-site rotameric flip model with known parameters as well as the Aβ1−40 fibril sample with a complex model previously assessed by other techniques indicated that the 2H CEST experiment can quantify the slow motional modes in rotating solids. For the best precision and motional model development, it is desirable to perform the measurements for more than one combination of the saturation fields and saturation times. Special attention should be paid to the examination of the experimental and simulated intensities at rotary resonance positions, as they can pinpoint to details of motional regimes and mechanisms. This is an additional strength of rotating versus static approach. Assessing probe RF inhomogeneity can be important for improving the accuracy of the results. For low sensitivity protein samples with complex models, MAS rates, saturation field strength, and saturation times must be selected carefully to optimize data collection strategies. Further, the explicit modeling procedures for complex models have to be computationally optimized to render them friendly for model and parameter selection. Once these strategies are in place, the 2H CEST technique can be a powerful tool for studies of protein dynamics.
Data Availability Statement
The raw data supporting the conclusions of this article will be made available by the authors, without undue reservation.
Author Contributions
LV conceived experiments, designed experiments and models, samples, pulse sequence, wrote the manuscript; DO wrote computer modeling program, conceived strategies and performed computational modeling, participated in data analysis and draft writing; AG assisted with data collection at 17.6T spectrometer; RF assisted with data collection at 14.1T spectrometer, participated in draft editing.
Funding
This work was supported by a National Institutes of Health Grant 1R15-GM111681. Several experiments were performed at the National High Magnetic Field Laboratory, which is supported by NSF Cooperative Agreement NSF/DMR-1644779, the State of Florida and the U.S. Department of Energy.
Conflict of Interest
The authors declare that the research was conducted in the absence of any commercial or financial relationships that could be construed as a potential conflict of interest.
Publisher’s Note
All claims expressed in this article are solely those of the authors and do not necessarily represent those of their affiliated organizations, or those of the publisher, the editors and the reviewers. Any product that may be evaluated in this article, or claim that may be made by its manufacturer, is not guaranteed or endorsed by the publisher.
Supplementary Material
The Supplementary Material for this article can be found online at: https://www.frontiersin.org/articles/10.3389/fmolb.2021.705572/full#supplementary-material.
References
Akbey, Ü., Nieuwkoop, A. J., Wegner, S., Voreck, A., Kunert, B., Bandara, P., et al. (2014). Quadruple-resonance Magic-Angle Spinning NMR Spectroscopy of Deuterated Solid Proteins. Angew. Chem. Int. Ed. 53, 2438–2442. doi:10.1002/anie.201308927
Al-Mohy, A. H., and Higham, N. J. (2010). A New Scaling and Squaring Algorithm for the Matrix Exponential. SIAM J. Matrix Anal. Appl. 31, 970–989. doi:10.1137/09074721x
Au, D. F., Ostrovsky, D., Fu, R., and Vugmeyster, L. (2019). Solid-state NMR Reveals a Comprehensive View of the Dynamics of the Flexible, Disordered N-Terminal Domain of Amyloid-β Fibrils. J. Biol. Chem. 294, 5840–5853. doi:10.1074/jbc.ra118.006559
Bain, A. D., and Berno, B. (2011). Liouvillians in NMR: the Direct Method Revisited. Prog. Nucl. Magn. Reson. Spectrosc. 59, 223–244. doi:10.1016/j.pnmrs.2010.12.002
Bjerring, M., Paaske, B., Oschkinat, H., Akbey, Ü., and Nielsen, N. C. (2012). Rapid Solid-State NMR of Deuterated Proteins by Interleaved Cross-Polarization from 1H and 2H Nuclei. J. Magn. Reson. 214, 324–328. doi:10.1016/j.jmr.2011.10.020
Bouvignies, G., and Kay, L. E. (2012). Measurement of Proton Chemical Shifts in Invisible States of Slowly Exchanging Protein Systems by Chemical Exchange Saturation Transfer. J. Phys. Chem. B 116, 14311–14317. doi:10.1021/jp311109u
Brown, M. J., Void, R. L., and Hoatson, G. L. (1996). Selective Inversion Investigations of Slow Molecular Motion in Solid State Deuteron NMR Spectroscopy. Solid State. Nucl. Magn. Reson. 6, 167–185. doi:10.1016/0926-2040(95)01213-3
Favre, D. E., Schaefer, D. J., and Chmelka, B. F. (1998). Direct Determination of Motional Correlation Times by 1D MAS and 2D Exchange NMR Techniques. J. Magn. Reson. 134, 261–279. doi:10.1006/jmre.1998.1506
Frydman, L., Vallabhaneni, S., Lee, Y. K., and Emsley, L. (1994). Solid‐State Dynamic Processes in Complex Systems Analyzed by Two‐dimensional Isotropic-Anisotropic Correlation Nuclear Magnetic Resonance. J. Chem. Phys. 101, 111–117. doi:10.1063/1.468185
Gérardy-Montouillout, V., Malveau, C., Tekely, P., Olender, Z., and Luz, Z. (1996). ODESSA, a New 1D NMR Exchange experiment for Chemically Equivalent Nuclei in Rotating Solids. J. Magn. Reson. Ser. A 123, 7–15. doi:10.1006/jmra.1996.0208
Grey, C. P., Veeman, W. S. W., and Vega, A. J. A. (1993). Rotational echo14N/13C/1H Triple Resonance Solid‐state Nuclear Magnetic Resonance: A Probe of13C-14N Internuclear Distances. J. Chem. Phys. 98, 7711–7724. doi:10.1063/1.464579
Gupta, R., Hou, G., Polenova, T., and Vega, A. J. (2015). RF Inhomogeneity and How it Controls CPMAS. Solid State. Nucl. Magn. Reson. 72, 17–26. doi:10.1016/j.ssnmr.2015.09.005
Higham, N. J. (2005). The Scaling and Squaring Method for the Matrix Exponential Revisited. SIAM J. Matrix Anal. Appl. 26, 1179–1193. doi:10.1137/04061101x
Jain, S. K., Nielsen, A. B., Hiller, M., Handel, L., Ernst, M., Oschkinat, H., et al. (2014). Low-power Polarization Transfer Between Deuterons and Spin-1/2 Nuclei Using Adiabatic RESPIRATIONCP in Solid-State NMR. Phys. Chem. Chem. Phys. 16, 2827–2830. doi:10.1039/c3cp54419b
Krushelnitsky, A., Zinkevich, T., Reif, B., and Saalwächter, K. (2014). Slow Motions in Microcrystalline Proteins as Observed by MAS-Dependent 15N Rotating-Frame NMR Relaxation. J. Magn. Reson. 248, 8–12. doi:10.1016/j.jmr.2014.09.007
Krushelnitsky, A., Gauto, D., Rodriguez Camargo, D. C., Schanda, P., and Saalwächter, K. (2018). Microsecond Motions Probed by Near-Rotary-Resonance R1ρ 15N MAS NMR Experiments: the Model Case of Protein Overall-Rocking in Crystals. J. Biomol. NMR 71, 53–67. doi:10.1007/s10858-018-0191-4
Kurauskas, V., Izmailov, S. A., Rogacheva, O. N., Hessel, A., Ayala, I., Woodhouse, J., et al. (2017). Slow Conformational Exchange and Overall Rocking Motion in Ubiquitin Protein Crystals. Nat. Commun. 8, 145. doi:10.1038/s41467-017-00165-8
Matlahov, I., and Van der Wel, P. C. A. (2018). Hidden Motions and Motion-Induced Invisibility: Dynamics-Based Spectral Editing in Solid-State NMR. Methods 148, 123–135. doi:10.1016/j.ymeth.2018.04.015
Nielsen, N. C., Bildso/E, H., Jakobsen, H. J., and Levitt, M. H. (1994). Double‐quantum Homonuclear Rotary Resonance: Efficient Dipolar Recovery in Magic‐Angle Spinning Nuclear Magnetic Resonance. J. Chem. Phys. 101, 1805–1812. doi:10.1063/1.467759
Palmer, A. G., and Koss, H. (2019). “Chemical Exchange,” in Methods in Enzymology. Editor A. J. Wand (Academic Press), 177–236. doi:10.1016/bs.mie.2018.09.028
Palmer, A. G. (2014). Chemical Exchange in Biomacromolecules: Past, Present, and Future. J. Magn. Reson. 241, 3–17. doi:10.1016/j.jmr.2014.01.008
Quinn, C. M., and McDermott, A. E. (2012). Quantifying Conformational Dynamics Using Solid-State R1ρ Experiments. J. Magn. Reson. 222, 1–7. doi:10.1016/j.jmr.2012.05.014
Rovó, P. (2020). Recent Advances in Solid-State Relaxation Dispersion Techniques. Solid State. Nucl. Magn. Reson. 108, 101665. doi:10.1016/j.ssnmr.2020.101665
Rovó, P., and Linser, R. (2017). Microsecond Time Scale Proton Rotating-Frame Relaxation under Magic Angle Spinning. J. Phys. Chem. B 121, 6117–6130. doi:10.1021/acs.jpcb.7b03333
Rovó, P., and Linser, R. (2018). Microsecond Timescale Protein Dynamics: a Combined Solid-State NMR Approach. ChemPhysChem 19, 34–39. doi:10.1002/cphc.201701238
Rovó, P., Smith, C. A., Gauto, D., De Groot, B. L., Schanda, P., and Linser, R. (2019). Mechanistic Insights into Microsecond Time-Scale Motion of Solid Proteins Using Complementary 15N and 1H Relaxation Dispersion Techniques. J. Am. Chem. Soc. 141, 858–869. doi:10.1021/jacs.8b09258
Saalwächter, K., and Fischbach, I. (2002). The Application of MAS Recoupling Methods in the Intermediate Motional Regime. J. Magn. Reson. 157, 17–30. doi:10.1006/jmre.2002.2552
Siemer, A. B., Huang, K.-Y., and Mcdermott, A. E. (2010). Protein-Ice Interaction of an Antifreeze Protein Observed With Solid-State NMR. Proc. Natl. Acad. Sci. USA 107, 17580–17585. doi:10.1073/pnas.1009369107
Tošner, Z., Purea, A., Struppe, J. O., Wegner, S., Engelke, F., Glaser, S. J., et al. (2017). Radiofrequency Fields in MAS Solid State NMR Probes. J. Magn. Reson. 284, 20–32. doi:10.1016/j.jmr.2017.09.002
Vallurupalli, P., Bouvignies, G., and Kay, L. E. (2012). Studying "invisible" Excited Protein States in Slow Exchange With a Major State Conformation. J. Am. Chem. Soc. 134, 8148–8161. doi:10.1021/ja3001419
Van der Wel, P. C. A. (2017). Insights into Protein Misfolding and Aggregation Enabled by Solid-State NMR Spectroscopy. Solid State. Nucl. Magn. Reson. 88, 1–14. doi:10.1016/j.ssnmr.2017.10.001
Vold, R. R., and Vold, R. L. (1991). “Deuterium Relaxation in Molecular Solids,” in Advances in Magnetic and Optical Resonance. Editor W. Warren (San Diego: Acadenic Press), 85–171. doi:10.1016/b978-0-12-025516-0.50006-1
Vold, R. L., Hoatson, G. L., Vugmeyster, L., Ostrovsky, D., and De Castro, P. J. (2009). Solid State Deuteron Relaxation Time Anisotropy Measured with Multiple echo Acquisition. Phys. Chem. Chem. Phys. 11, 7008–7012. doi:10.1039/b907343d
Vold, R. R. (1994). “Deuterium NMR Studies of Dynamics in Solids and Liquid Crystals,” in Nuclear Magnetic Resonance Probes of Molecular Dynamics. Editor R. Tycko (Dordrecht: Kluwer academic Publishers), 27–112. doi:10.1007/978-94-011-1410-3_2
Vugmeyster, L., and Ostrovsky, D. (2019). Deuterium Rotating Frame NMR Relaxation Measurements in the Solid State under Static Conditions for Quantification of Dynamics. Chemphyschem 20, 333–342. doi:10.1002/cphc.201800454
Vugmeyster, L., Au, D. F., Ostrovsky, D., and Fu, R. (2019). Deuteron Solid‐State NMR Relaxation Measurements Reveal Two Distinct Conformational Exchange Processes in the Disordered N‐Terminal Domain of Amyloid‐β Fibrils. ChemPhysChem 20, 1680–1689. doi:10.1002/cphc.201900363
Keywords: CEST (chemical exchange dependent saturation transfer), deuterium, solids-state NMR, biomolecular dynamics, conformational exchange
Citation: Vugmeyster L, Ostrovsky D, Greenwood A and Fu R (2021) Deuteron Chemical Exchange Saturation Transfer for the Detection of Slow Motions in Rotating Solids. Front. Mol. Biosci. 8:705572. doi: 10.3389/fmolb.2021.705572
Received: 05 May 2021; Accepted: 12 July 2021;
Published: 27 July 2021.
Edited by:
Józef Romuald Lewandowski, University of Warwick, United KingdomReviewed by:
Rachel Wagner Martin, University of California, United StatesFabien Ferrage, UMR7203 Laboratoire des Biomolécules, France
Petra Rovo, Ludwig Maximilian University of Munich, Germany
Copyright © 2021 Vugmeyster, Ostrovsky, Greenwood and Fu. This is an open-access article distributed under the terms of the Creative Commons Attribution License (CC BY). The use, distribution or reproduction in other forums is permitted, provided the original author(s) and the copyright owner(s) are credited and that the original publication in this journal is cited, in accordance with accepted academic practice. No use, distribution or reproduction is permitted which does not comply with these terms.
*Correspondence: Liliya Vugmeyster, liliya.vugmeyster@ucdenver.edu