Corrigendum: The intricate role of Sir2 in oxidative stress response during the post-diauxic phase in Saccharomyces cerevisiae
 Yeong Hyeock Kim
 Ji-In Ryu
 Mayur Nimbadas Devare
 Juhye Jung
 Jeong-Yoon Kim
- Department of Microbiology and Molecular Biology, College of Bioscience and Biotechnology, Chungnam National University, Daejeon, Republic of Korea
Silent information regulator 2 (Sir2) is a conserved NAD+-dependent histone deacetylase crucial for regulating cellular stress response and the aging process in Saccharomyces cerevisiae. In this study, we investigated the molecular mechanism underlying how the absence of Sir2 can lead to altered stress susceptibilities in S. cerevisiae under different environmental and physiological conditions. In a glucose-complex medium, the sir2Δ strain showed increased sensitivity to H2O2 compared to the wild-type strain during the post-diauxic phase. In contrast, it displayed increased resistance during the exponential growth phase. Transcriptome analysis of yeast cells in the post-diauxic phase indicated that the sir2Δ mutant expressed several oxidative defense genes at lower levels than the wild-type, potentially accounting for its increased susceptibility to H2O2. Interestingly, however, the sir2Δras2Δ double mutant exhibited greater resistance to H2O2 than the ras2Δ single mutant counterpart. We found that the expression regulation of the cytoplasmic catalase encoded by CTT1 was critical for the increased resistance to H2O2 in the sir2Δras2Δ strain. The expression of the CTT1 gene was influenced by the combined effect of RAS2 deletion and the transcription factor Azf1, whose level was modulated by Sir2. These findings provide insights into the importance of understanding the intricate interactions among various factors contributing to cellular stress response.
Introduction
Oxidative stress is caused by an imbalance between the production of reactive oxygen species (ROS) and the capacity for oxidative stress resistance. ROS, such as superoxide radicals, hydrogen peroxide, and hydroxyl radicals are generated during normal cellular metabolism in addition to ATP generation in mitochondria (Finkel and Holbrook, 2000). While ROS can be beneficial in cell signaling and host defense in small amounts, excessive levels can cause oxidative damage to nucleic acids, proteins, and lipids (Finkel and Holbrook, 2000; Bartosz, 2009; Barry and Gutteridge, 2015). Over time, cumulative damage can contribute to aging and a wide range of diseases, including neurodegenerative disorders, cardiovascular disease, and cancer (Finkel and Holbrook, 2000; Schieber and Chandel, 2014). To counteract the harmful impact of ROS, cells have evolved intricate antioxidant defenses, which consist of enzymes like superoxide dismutase, catalase, and glutathione peroxidase, as well as small molecule antioxidants such as vitamins C and E (Finkel and Holbrook, 2000; de la Torre-Ruiz et al., 2015). The coordinated cellular processes activated in response to oxidative stress include the upregulation of antioxidant defenses, repair of damaged molecules, and removal of damaged proteins and organelles (Barry and Gutteridge, 2015; de la Torre-Ruiz et al., 2015).
Saccharomyces cerevisiae has been widely used as a model organism in oxidative stress research. When subjected to oxidative stress, S. cerevisiae activates a complex network of mechanisms involving MAPK pathways, such as Hog1, Slt2, and Fus3/Kss1, which respond dynamically to a range of stress conditions (Morano et al., 2012; de la Torre-Ruiz et al., 2015). S. cerevisiae modulates the activities of key transcription factors that control the expression of antioxidant enzymes. These enzymes serve as the first line of defense against oxidative stress by neutralizing ROS and mitigating oxidative damage. Transcription factors such as Yap1, Skn7, and Msn2/4 are crucial in S. cerevisiae’s response to oxidative stress (He and Fassler, 2005; Morano et al., 2012). Yap1 is crucial for regulating the expression of several antioxidant enzymes, such as catalase and superoxide dismutase. Skn7 cooperates with Yap1 in regulating some oxidative stress genes, while Msn2/4 is responsible for the general stress response (Hasan et al., 2002; He and Fassler, 2005; de la Torre-Ruiz et al., 2015). This highly coordinated response underscores S. cerevisiae’s ability to adapt to changing environmental conditions and stresses.
Silent information regulator (Sir2), a conserved NAD-dependent histone deacetylase, is a well-established regulator of aging in various organisms, including yeast, flies, and mammals (Tissenbaum and Guarente, 2001; Rogina and Helfand, 2004; Satoh et al., 2013). Apart from its role in extending replicative lifespan (RLS) by preventing the formation of extrachromosomal rDNA circles (Kaeberlein et al., 1999) and deacetylating histone H4 lysine 16 (H4K16) at subtelomeric regions (Dang et al., 2009), Sir2 has been shown to reduce ROS levels and the accumulation of oxidative damage in daughter cells (Aguilaniu et al., 2003; Erjavec et al., 2007). Additionally, Sir2 has been observed to modulate the transcription of antioxidant genes in a growth phase-dependent manner (Kang et al., 2014). However, the precise molecular mechanisms by which Sir2 participates in oxidative stress response still need to be fully understood due to the complex influence of other signaling pathways and genetic factors.
The Ras/cAMP/PKA signaling pathway is widely recognized as a crucial component in the cellular response to oxidative stress (Fabrizio et al., 2005; Creamer et al., 2022). Strains with a deletion of RAS2 have been shown to exhibit increased resistance to H2O2 and extended chronological lifespan, pointing to a negative correlation between Ras2 activity and oxidative stress/longevity (Fabrizio et al., 2001; Mirisola and Longo, 2022). Although these findings underscore the significance of the Ras/cAMP/PKA pathway in regulating oxidative stress, the potential involvement of the sirtuin protein, Sir2, in Ras2’s regulatory mechanisms has largely remained unexplored. Our study illuminates the molecular mechanisms underlying the varied role of Sir2 in oxidative stress regulation during the post-diauxic phase. Specifically, we demonstrate that Ras2, whose activity is regulated by pH, determines Sir2’s role in H2O2 resistance by regulating CTT1 gene expression during the post-diauxic phase.
Materials and methods
Yeast strains and media
Unless otherwise stated, all the experiments were performed using DBY746 (MATα leu2-3, 112 his3D trp1-289 ura3-52 GAL+) cells. Cells were grown in a standard liquid YPD medium containing yeast extract (10 g/L, Becton Dickinson), peptone (20 g/L, Becton Dickinson), and glucose (20 g/L, Junsei), with pH adjusted to 6.0 for all experiments. A synthetic drop-out medium was prepared by adding 0.67 g/L yeast nitrogen base without amino acids (Becton Dickinson) and amino acids, except uracil or histidine, to select transformant cells. When required, transformant cells were plated onto a solid medium containing 5′-fluoroorotic acid (1 mg/mL) to select for the loss of the URA3 marker.
Stress resistance test
Unless otherwise stated, all stress resistance tests were conducted on cells in the post-diauxic phase, grown in YPD medium with a pH of 6.0. For the H2O2 resistance assay, cells were diluted to an OD600 of 1 in 0.1 M potassium phosphate buffer (pH 6.0) and treated with the appropriate concentration of H2O2 for 30 min. Heat stress resistance assays were performed by diluting cells to an OD600 of 1 in distilled water and incubating them at 55°C (heat-shocked) or 30°C (control) for 60–120 min. SDC medium was used for the H2O2 resistance assay, prepared by adding yeast nitrogen base without amino acids (0.67 g/L), glucose (20 g/L), and supplemented with amino acids as well as a 4-fold excess of leucine, histidine, tryptophan, and uracil. After stress exposure, cells were serially diluted, spotted onto YPD plates, and incubated at 30°C for 2–3 days.
Western blotting
Cell extracts were prepared using the trichloroacetic acid (TCA) method, and the pellet was resuspended in a sample loading buffer. For Ahp1, cells were lysed in lysis buffer (50 mM HEPES, 140 mM NaCl, 1 mM EDTA, 1% Triton X-100, 1 mM PMSF). Supernatants were collected after centrifugation and resuspended in a sample loading buffer. Protein samples were separated on 8%–12% SDS-polyacrylamide gel electrophoresis gels and transferred to polyvinylidene fluoride membrane (Millipore, Billerica). The membrane was probed with specific antibodies and detected using HRP-conjugated secondary antibodies. Primary antibodies used were anti-Flag (1:2000; Sigma), anti-GFP (1:1000; Santa Cruz Biotechnology), and anti-GAPDH (1:20000; Acris). Band density was quantified using ImageJ software (National Institutes of Health).
Measurement of the cytosolic pHc
The cytosolic pH was measured following a previously described method (Devare et al., 2020). To generate pH calibration curves, yeast cells expressing SEP (kindly provided by Daniel E. Gottschling) under the control of the TEF1 promoter were cultivated in baffled flasks until an OD600 of approximately 1.0 in YPD medium. Subsequently, the cells were centrifuged at 3,000 rpm for 5 min, washed twice with PBS, and resuspended in PBS supplemented with 5 μg/mL digitonin (Sigma). After an incubation period of 5 min, the cells were washed again with PBS and resuspended in citric acid/Na2HPO4 buffer with pH values ranging from 5.5 to 8.0. The cytosolic pH values of viable single cells during the exponential, post-diauxic, or buffered post-diauxic growth phase were determined. Imaging was carried out using an Olympus BX51 microscope, and ImageJ software was utilized for the analysis. Mean pHluorin intensity was quantified from three different regions of images using a 1-pixel straight-line tool. The pH values were always presented as mean ± SD. The pH determination experiments were performed three times (biological repeats), and the figures show one representative experimental result, where the error bars represent the standard deviation of at least three replicates.
Measurement of Ras2 activity
To measure Ras2 activity, cells expressing EGFP-3x RBD were grown in YPD medium with or without citrate phosphate buffer and harvested at either the exponential phase (6 h) or the post-diauxic phase (24 h). The localization of EGFP-3x RBD was analyzed using an Olympus BX51 microscope. SC-URA medium with or without glucose was used as a control to test whether the localization of EGFP-3x RBD was affected by the presence of glucose.
Chronological lifespan
The chronological lifespan of cells incubated in YPD medium was monitored by measuring colony-forming units (CFUs) every 2–3 days. The number of CFUs on day 3 was considered the initial survival (100%) and was used to determine the age-dependent mortality.
RNA isolation, cDNA synthesis, and real-time PCR analysis
Total RNA was isolated using the NucleoSpin RNA kit (Macherey-Nagel) and quantified by measuring absorbance at 260 nm. From 1 μg of RNA sample, cDNA was synthesized using the ReverTra Ace qPCR RT kit (Toyobo) according to the manufacturer’s recommendations and analyzed by quantitative RT-PCR. RT-PCR was performed using SYBR green PCR mix and CFX connect system (Bio-Rad). The relative expression levels normalized to ACT1 were determined using the comparative CT method. For RNA sequencing analysis, post-diauxic phase DBY746 and sir2∆ cells at 6 h for the exponential phase or 24 h for the post-diauxic phase were harvested, and total RNA was isolated and purified as described above before being sent for sequencing.
Immunoprecipitation
Post-diauxic phase cells were harvested, washed one time with cold distilled water, and resuspended in the lysis buffer containing 50 mM HEPES, 140 mM NaCl, 1 mM EDTA, 1% Triton X-100, 1 mM PMSF, 10 mM NaF and 2 mM Na3VO4. The lysate was collected by centrifugation, and the supernatant was immunoprecipitated using anti-Flag or anti-Sir2 antibody (Santa Cruz Biotechnology) pre-conjugated with protein A/G beads overnight. The immunoprecipitates were washed five times with lysis buffer and then eluted by boiling in sample loading buffer. The protein samples were separated by 8% SDS-PAGE and transferred onto PVDF membrane for western blotting analysis using appropriate antibodies.
Results
The role of Sir2 in oxidative stress response varies depending on culture condition
In a previous study, we reported that Sir2 has positive and negative roles in oxidative stress response and lifespan extension (Kang et al., 2014). To further understand the underlying mechanisms, we investigated the oxidative stress sensitivity of the sir2Δ strain under two different culture conditions: the glucose-complex YPD medium and glucose-minimal SDC medium. In the YPD medium, the sir2Δ strain exhibited greater sensitivity to H2O2 than the wild-type during the post-diauxic phase, consistent with previous findings. Conversely, during the exponential growth phase, the sir2Δ strain showed increased resistance to H2O2 compared to the wild-type (Figure 1A). However, in the SDC medium, even during the post-diauxic phase, the sir2Δ strain was less sensitive to H2O2 than the wild-type (Figure 1A). Furthermore, cells expressing the enzymatically inactive variant of Sir2 (Sir2-H364Y) displayed a phenotype similar to that of the sir2Δ strain, indicating that the deacetylase activity of Sir2 is required for its sensitivity to H2O2 in the post-diauxic phase (Figure 1B). Additionally, during the post-diauxic phase in the YPD medium, we observed that sir2Δ mutants derived from various S. cerevisiae strains were more sensitive to H2O2 than their wild-type counterparts (Figure 1C), suggesting that the negative role of Sir2 in H2O2 sensitivity during the post-diauxic phase is generalizable across diverse S. cerevisiae strains.
FIGURE 1
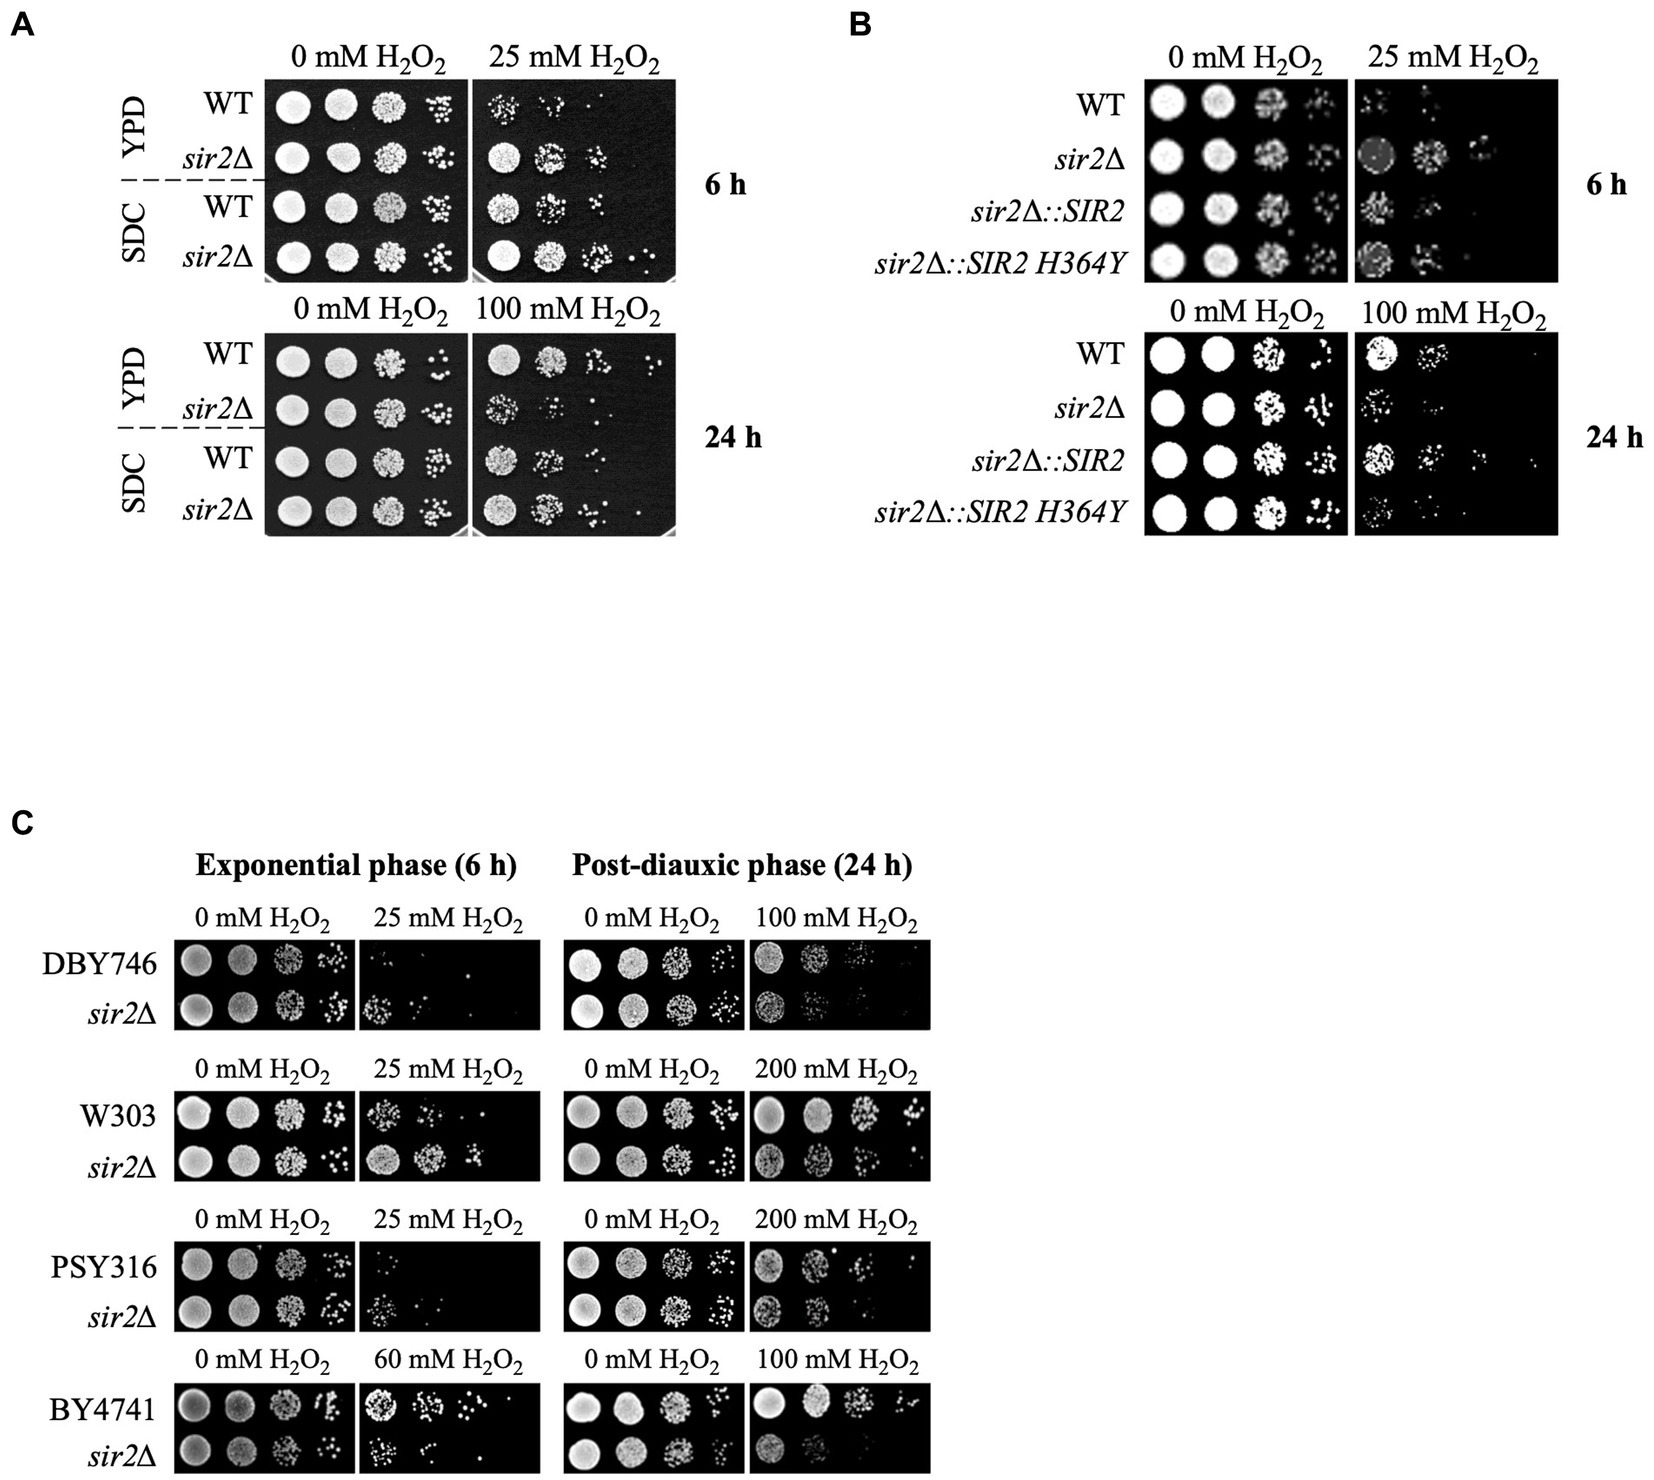
Figure 1. Context-dependent role of Sir2 in H2O2 resistance. (A) H2O2 resistance was assessed in the wild-type (DBY746) and sir2∆ mutant in SDC and YPD media during the exponential or post-diauxic phase was tested. (B) H2O2 resistance was measured in DBY746, sir2∆, and sir2∆ carrying either the wild-type SIR2 or enzymatically inactive SIR2 H364Y allele in the exponential and post-diauxic growth phases. (C) H2O2 resistance was tested in DBY746, W303, PSY316, and BY4741 strains and their respective sir2∆ mutants in the exponential and post-diauxic growth phases. Cells were treated with the indicated amount of H2O2 for 30 min in potassium phosphate buffer (pH 6.0) at 30°C, spotted onto YPD plates, and incubated at 30°C for 2–3 days.
Sir2 affects the expression of oxidative stress resistance genes during the post-diauxic phase
To understand why the role of Sir2 in oxidative stress resistance changes during the post-diauxic phase in the YPD complex medium, we conducted transcriptome analyses comparing gene expression patterns between the wild-type and sir2Δ strains during the post-diauxic phase in the YPD medium. We found that the absence of Sir2 affected the expression of 549 out of 6,692 genes analyzed (p < 0.05, 1.5-fold), with 17 genes upregulated and 532 genes downregulated in the sir2Δ strain compared to the wild-type (Figure 2A). Among the 17 upregulated genes, none were associated with oxidative stress resistance or other significant biological processes. Interestingly, many downregulated genes belonged to oxidative stress resistance and chaperone functions, in addition to the categories of “response to chemical,” “DNA recombination,” and “transcription by RNA polymerase II” (Figures 2B,C). We confirmed the decreased expression of oxidative stress resistance genes, such as AHP1, GCY1, GPX2, GRX1, and GSH1, by qRT-PCR (Figure 2D) and further demonstrated that the decreased mRNA level of the AHP1 gene encoding thioredoxin peroxidase was reflected in the amount of the Ahp1 protein (Figure 2E). These data strongly suggest that the absence of Sir2 results in decreased expression of oxidative stress resistance genes during the post-diauxic phase in the YPD medium, consequently making yeast cells more susceptible to oxidative stress.
FIGURE 2
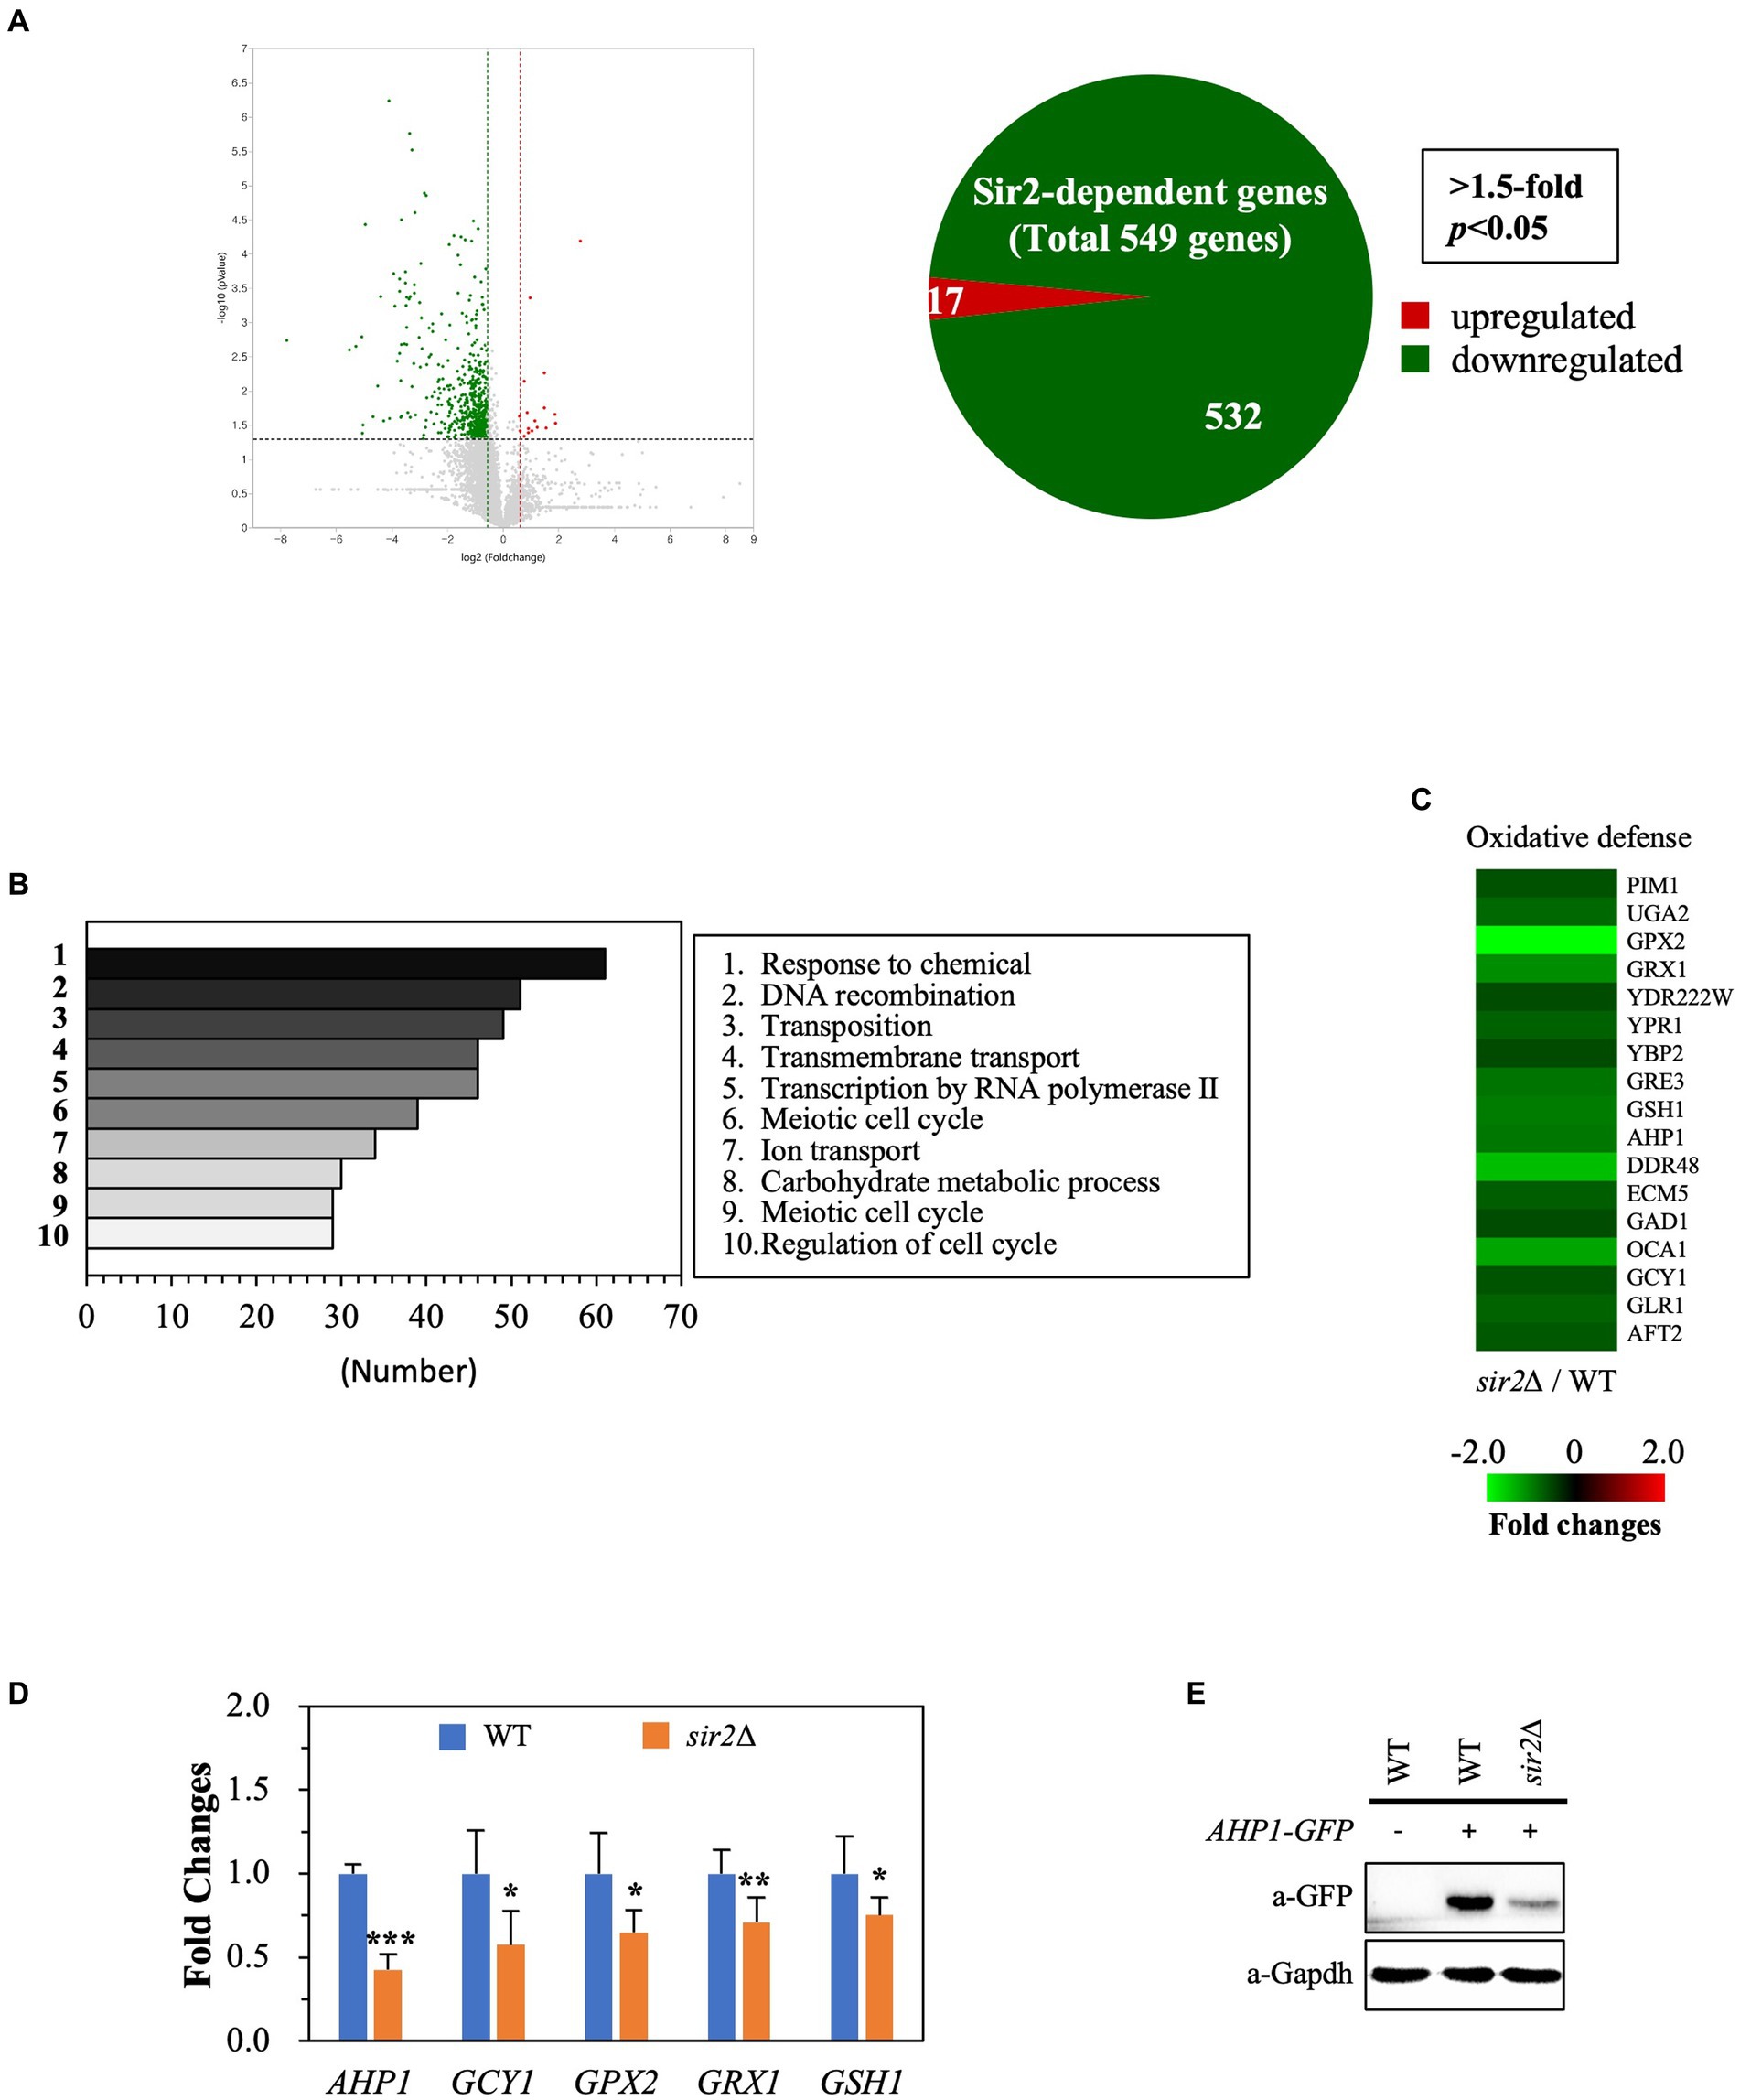
Figure 2. Sir2 regulates the expression of genes involved in oxidative stress resistance. Total RNA was extracted from DBY746 and sir2∆ strains in the post-diauxic phase (24 h), subjected to RNA sequencing, and verified by qRT-PCR and western blot. (A) Volcano plot and Venn diagram show the number of genes upregulated or downregulated in the sir2∆ strain compared to the wild-type (DBY746) strain, with a fold change greater than 1.5 and p < 0.05. The RNA sequencing data set is available on figshare at https://doi.org/10.6084/m9.figshare.24055566.v1. (B) The top 10 categories identified by Gene Ontology (GO) analysis, representing genes downregulated in the sir2∆ strain compared to the wild-type strain, are presented. (C) Heat maps depict the relative mRNA levels of genes involved in oxidative stress, with fold changes greater than 1.5 and p < 0.05. (D) qRT-PCR analysis of selected genes related to oxidative stress resistance in the wild-type and sir2∆ strains is presented. (E) Western blot analysis shows the Ahp1 protein levels in the wild-type and sir2∆ strains. GAPDH was used as a loading control. The reported values are the average of at least three independent experiments (±SD), and p-values were calculated using a t-test (*p < 0.05, **p < 0.01, and ***p < 0.005).
Altered cytosolic pH affects Sir2’s role in H2O2 resistance during the post-diauxic phase
Small cytosolic pH (pHc) changes can significantly affect cellular physiology (Orij et al., 2011). The pHc in yeast cells is not constant; it varies during growth and is influenced by external acidity levels. During the post-diauxic phase, the pHc is generally lower than in the exponential phase (Figure 3A), consistent with earlier findings (Dolz-Edo et al., 2019; Devare et al., 2020). To investigate whether this lowered pHc in the post-diauxic phase affects the sensitivity to oxidative stress, we increased the pHc by treating yeast cells in the post-diauxic phase with spent medium that contained 0.1 M citrate phosphate buffer (pH 6.0) (Figure 3A). Interestingly, the sir2Δ cells exposed to the buffered spent medium were more resistant to H2O2 than the control (Figure 3B), suggesting that a low pHc may contribute to the increased H2O2 sensitivity of the sir2Δ cells compared to the wild-type in the post-diauxic phase.
FIGURE 3
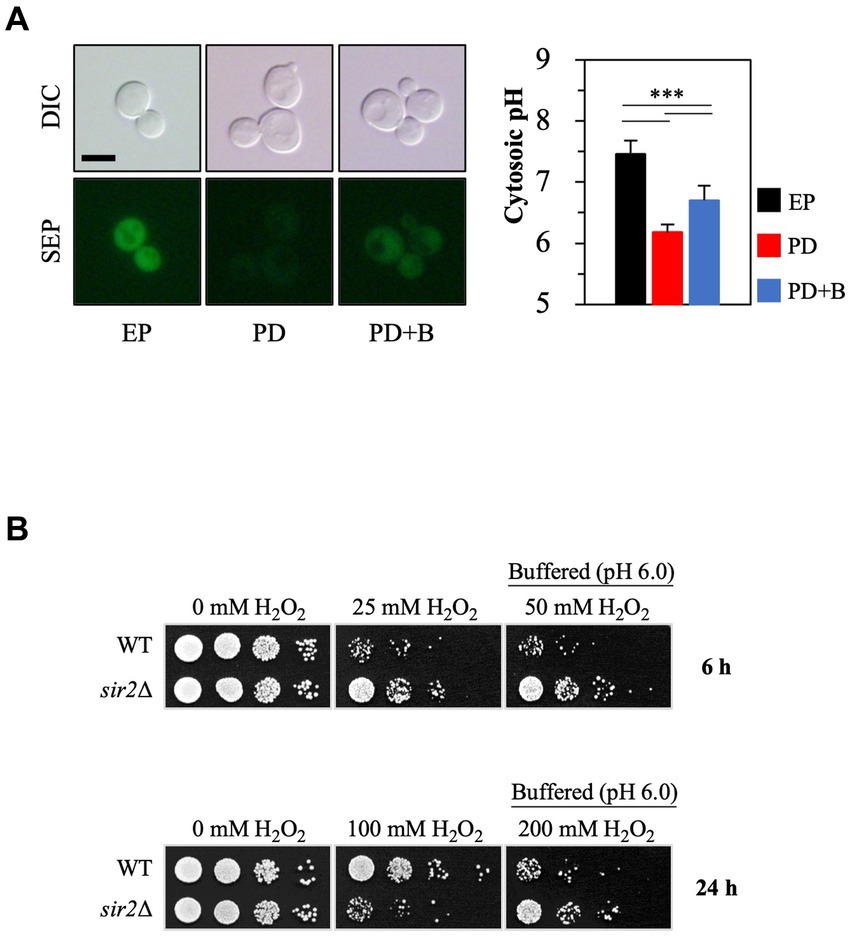
Figure 3. Increasing cytosolic pH by manipulating extracellular pH conditions changes Sir2’s role in H2O2 resistance during the post-diauxic phase. (A) Cytosolic pH was measured using cells expressing Super Ecliptic pHluorin (SEP) under the control of the TEF1 promoter. Cells were prepared from the exponential phase (EP), post-diauxic phase (PD), and post-diauxic phase buffered with 0.1 M citrate phosphate buffer (pH 6.0, PD + B). DIC, differential interference contrast. The reported values are the average of at least three independent experiments (±SD), and p-values were calculated using a t-test (***p < 0.005). (B) H2O2 resistance was tested with the wild-type and sir2∆ cells growing under the indicated conditions.
Ras2 is responsible for different responses to H2O2 stress during the post-diauxic phase
Since low pHc activates Ras2, a critical player in stress resistance, by inhibiting Ira1/2 (Tamanoi, 2011), we hypothesized that Ras2 might be involved in the altered sensitivity of the sir2Δ strain to oxidative stress during the post-diauxic phase. To visualize Ras2 activation, we fused the Ras binding domain (RBD) of human Raf1 with EGFP. In the presence of glucose, EGFP-RBD localized to the plasma membrane, indicating active Ras2. In contrast, in the absence of glucose, it dispersed into the cytoplasm, indicating inactive Ras2 (Supplementary Figure S1). During the post-diauxic phase, EGFP-RBD was localized to the plasma membrane. However, treatment with buffered medium displaced EGFP-RBD to the cytoplasm (Figure 4A), suggesting that buffering to pH 6.0 may result in Ras2 inactivation by increasing pHc.
FIGURE 4
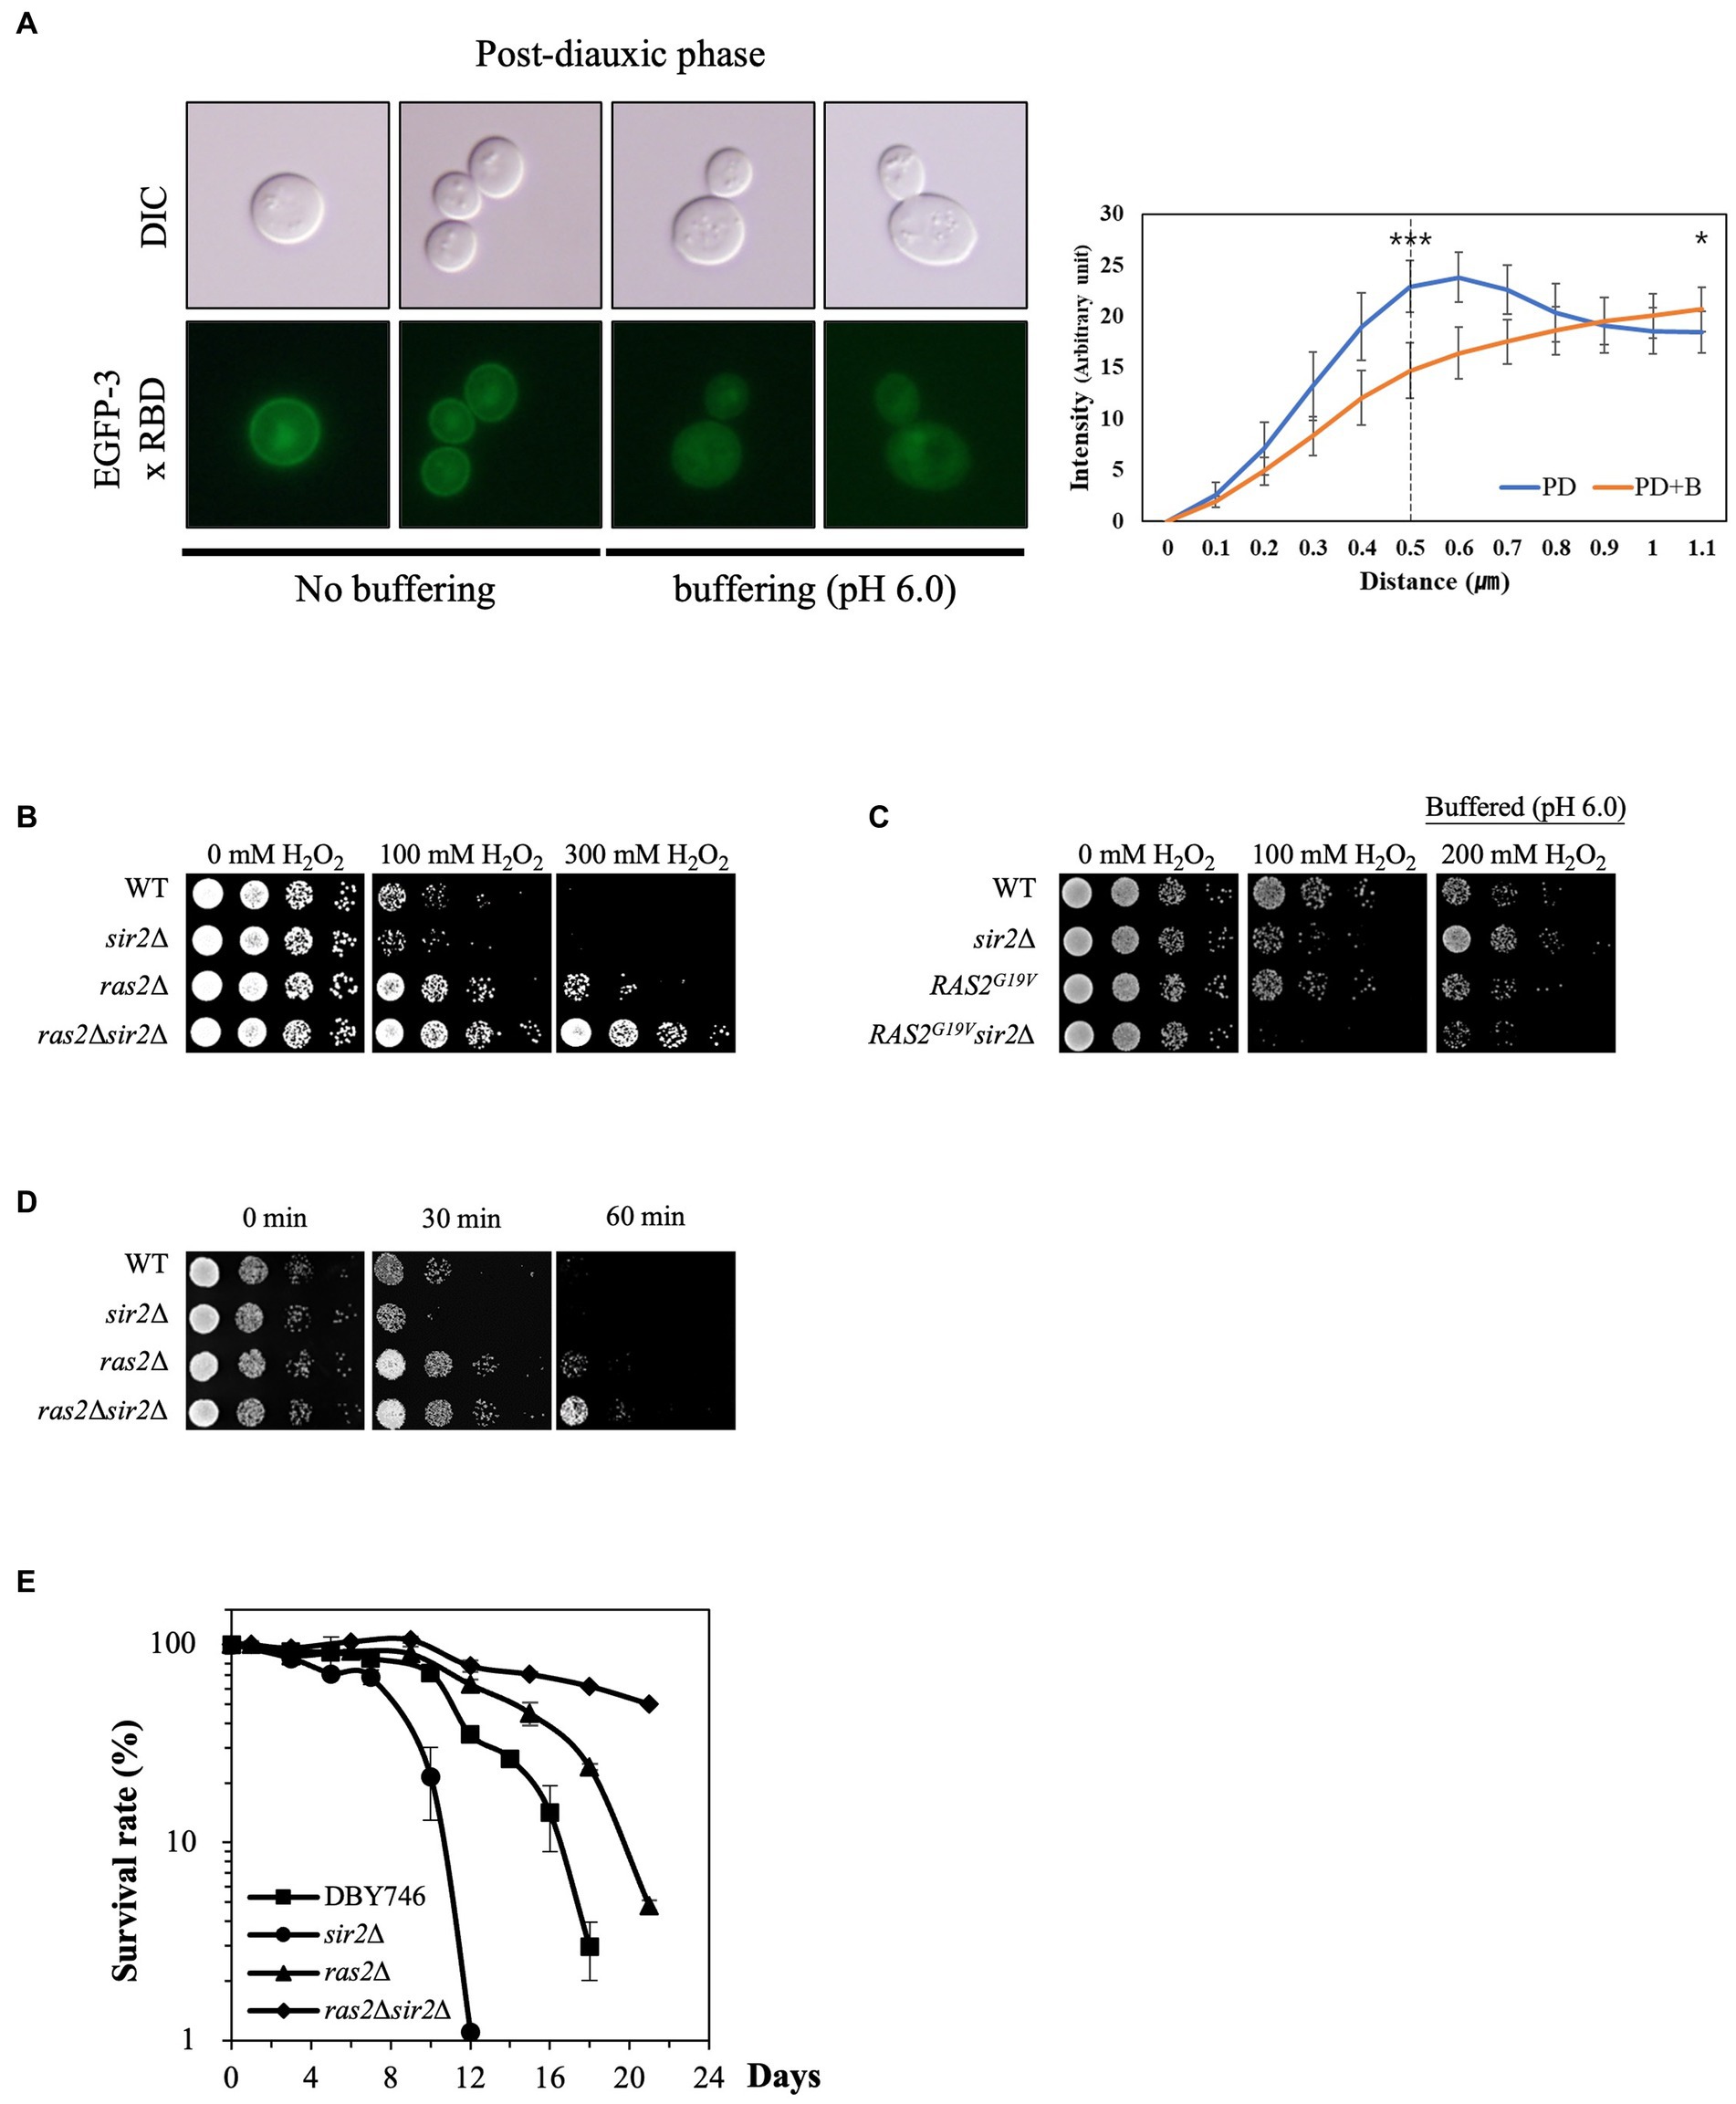
Figure 4. Ras2 activity is involved in the altered effect of SIR2 deletion on H2O2 resistance during post-diauxic growth phases. (A) (Left panel) Ras2 activity was analyzed using EGFP-3x RBD in the wild-type strains treated with or without buffer (pH 6.0). (Right panel) The fluorescence intensity was assessed using ImageJ and expressed in arbitrary units (n = 10 cells for each strain). The distance is measured starting from a point outside the cell and traversing through the cell membrane. The dotted line at 0.5 μm serves as indicator of the approximate boundary between the interior and exterior of the membrane. p-values were calculated using a t-test (*p < 0.05 and ***p < 0.005). (B) H2O2 resistance was evaluated in the wild-type, sir2Δ, ras2Δ, and ras2Δsir2Δ cells during the post-diauxic phase. (C) H2O2 resistance was tested in the wild-type, sir2Δ, RAS2G19V, and RAS2G19Vsir2Δ strains during the post-diauxic phase. Note that RAS2G19V is a constitutively active form of RAS2. (D) Heat stress resistance was evaluated in the wild-type, sir2Δ, ras2Δ, and ras2Δsir2Δ cells during the post-diauxic phase. (E) The chronological lifespan of the wild-type, sir2Δ, ras2Δ, and ras2Δsir2Δ strains grown in YPD medium was monitored by counting colony-forming units every 2 or 3 days. Experiments were repeated three times. Error bars indicate the mean ± SD.
To further investigate Ras2’s role in the greater H2O2 stress resistance of the sir2Δ cells than the wild-type during the post-diauxic phase, we deleted RAS2 from the wild-type and sir2Δ mutant strains and assessed their H2O2 stress resistance. Remarkably, RAS2 deletion reversed the effect of the sir2 mutation on H2O2 stress resistance, similar to what was observed with buffered medium treatment. The sir2Δ ras2Δ double mutant displayed greater resistance to H2O2 than the ras2Δ single mutant (Figure 4B). In addition, we found that the expression of a constitutively active form of RAS2 (RAS2G19V) increased the sensitivity of the sir2Δ cells to H2O2 stress (Figure 4C). Since oxidative stress is known to be involved in heat-induced cell death in yeast (Davidson et al., 1996), we compared the strains’ resistance to heat stress and found results consistent with those observed for H2O2 stress resistance (Figure 4D). These results collectively suggest that Ras2 activity is associated with the changes in the effects of SIR2 deletion on oxidative stress resistance during different growth phases. However, the reason for the significant increase in stress resistance in the sir2Δ compared to the wild-type upon Ras2 inactivation remains unclear. Lastly, the chronological lifespan (CLS) of the strains was assessed. Consistent with previous results (Fabrizio et al., 2003), the ras2Δ strain exhibited an increased chronological lifespan, which was further enhanced in the ras2Δsir2Δ strain (Figure 4E).
SIR2 deletion affects the expression of CTT1 in the absence of Ras2, but not in the presence of Ras2, during the post-diauxic phase
Catalase is essential in oxidative stress resistance by breaking H2O2 into oxygen and water molecules. Previous studies suggested that the Ras2 signaling pathway negatively influences CTT1 expression (Bissinger et al., 1989; Belazzi et al., 1991). Based on the studies, we hypothesized that intracellular acidification could activate Ras2 signaling during the post-diauxic phase, thus leading to decreased CTT1 expression. To test this hypothesis, we analyzed CTT1 expression in WT, sir2Δ, ras2Δ, and sir2Δ ras2Δ strains. As expected, we observed that CTT1 expression was increased in the ras2Δ strain compared to the WT and sir2Δ strains. However, it was surprising that CTT1 expression was significantly higher in the sir2Δ ras2Δ strain than in the ras2Δ strain (Figure 5A). The relative mRNA levels of the CTT1 gene matched with the amounts of the Ctt1 protein in the strains (Figure 5B). To see whether the amount of the Ctt1 protein in the strains is related to the different oxidative stress resistance, we deleted the CTT1 gene from WT, sir2Δ, ras2Δ, and sir2Δ ras2Δ strains and spotted them on plates after treating them with H2O2. We found that the resistance displayed by ras2Δ and sir2Δ ras2Δ strains was eliminated by CTT1 deletion (Figures 5C,D). These results support our hypothesis that reduced pHc during the post-diauxic phase activates Ras2 signaling, which in turn suppresses CTT1 expression and amplifies oxidative damage. These findings explain why Ras inactivation resulted in much higher stress resistance in the sir2Δ mutant than in the wild-type.
FIGURE 5
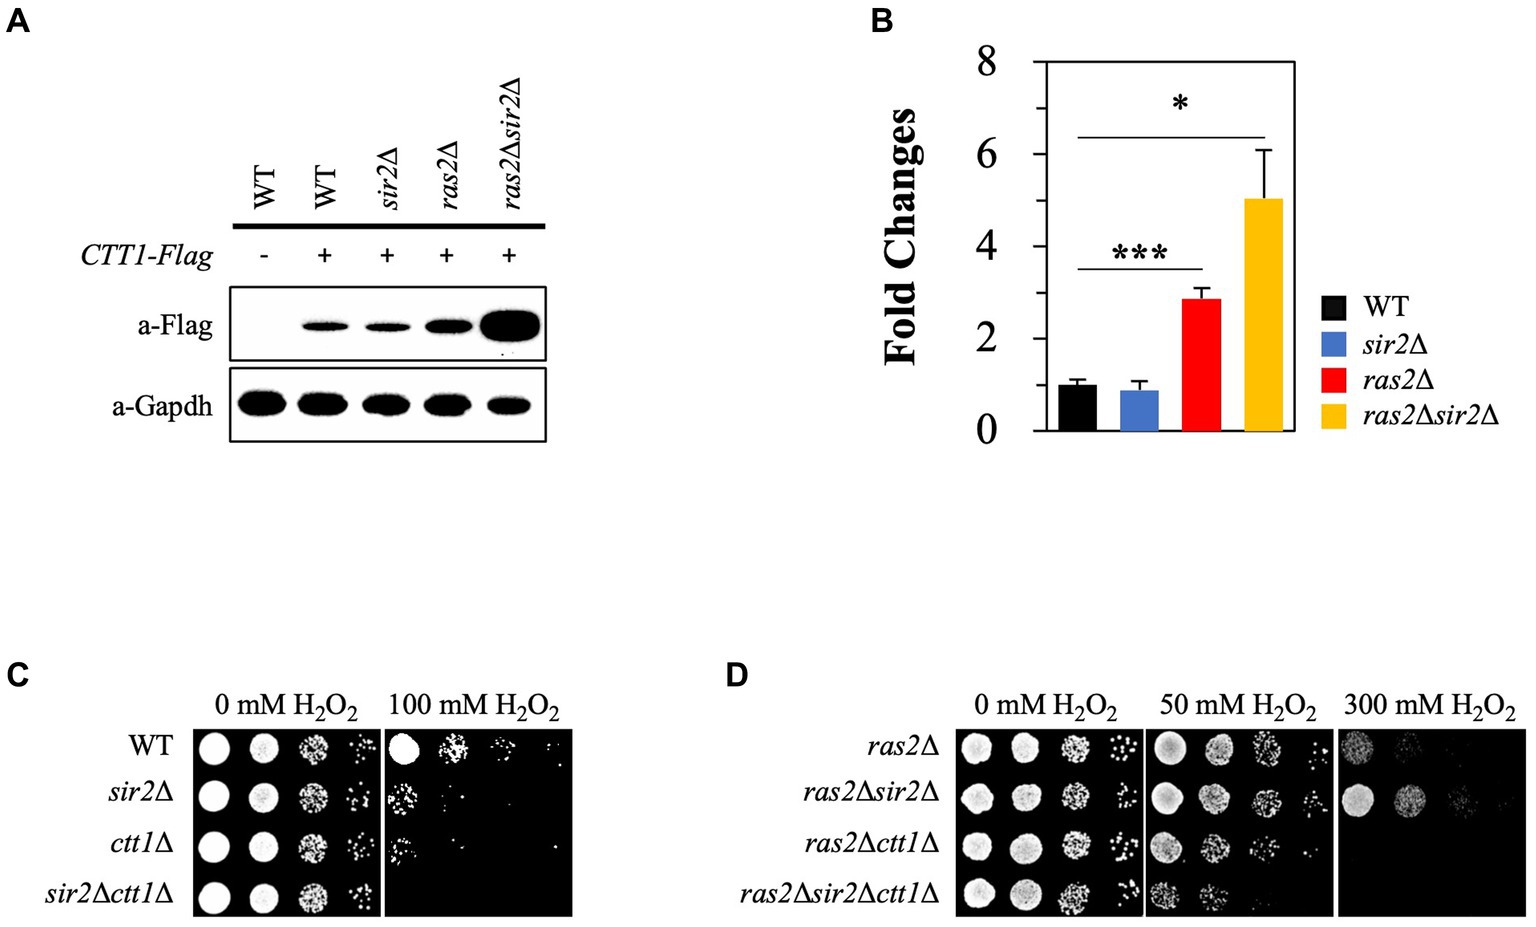
Figure 5. Sir2 affects the expression of CTT1 in the absence of Ras2 but not in its presence. (A) Ctt1 protein levels in the wild-type, sir2Δ, ras2Δ, and ras2Δsir2Δ strains were measured by western blot. GAPDH was used as a loading control. (B) qRT-PCR was performed to assess CTT1 mRNA levels in the wild-type, sir2Δ, ras2Δ, and ras2Δsir2Δ. The data represent the average of at least three independent experiments (±SD), and p-values were calculated using a t-test (*p < 0.05 and ***p < 0.005). (C) H2O2 resistance was tested in the wild-type, sir2∆, ctt1∆, and sir2∆ctt1∆ strains. (D) H2O2 resistance was also tested in the ras2∆, ras2∆sir2∆, ras2∆ctt1∆, and ras2∆sir2∆ctt1∆ strains during the post-diauxic phase.
Azf1 is involved in the regulation of CTT1 expression
To investigate how SIR2 deletion increases CTT1 expression only in the absence of Ras2, we examined whether Msn2/4 transcription factors and Rim15 kinase play a role in the varied effects of SIR2 deletion on CTT1 expression, given their pivotal roles in linking Ras-PKA signaling to CTT1 expression (Bissinger et al., 1989; Belazzi et al., 1991; Plank, 2022). We found that the deletion of RIM15 has no effect on CTT1 expression in the ras2Δ and sir2Δras2Δ strains (Supplementary Figure S2A). Deletion of MSN2/4 significantly reduced CTT1 expression in the ras2∆ and ras2∆sir2∆ mutants. However, CTT1 expression was higher in the ras2∆msn2∆msn4∆sir2∆ strain than in the ras2∆msn2∆msn4∆ strain (Supplementary Figures S2B,C). Additionally, the ras2∆msn2∆msn4∆sir2∆ strain was slightly more resistant to H2O2 than the ras2∆msn2∆msn4∆ strain (Supplementary Figure S2D). These data indicate that while Msn2/4 are crucial for CTT1 expression, they are not involved in the varied effect of SIR2 deletion on CTT1 expression in the ras2∆ strain.
We conducted an in-silico analysis of the CTT1 promoter region (~1.0 kb) to identify potential transcription factor binding sites. The results revealed numerous binding sites for a range of transcription factors, including Azf1, Cst6, Asg1, and Atf1, as well as well-known ones such as Mns2/4, Skn7, Yap1, and Hsf1 (Lee et al., 1999; Hasan et al., 2002; He and Fassler, 2005) (Supplementary Figure S3). Among these, we paid particular attention to Azf1 because the deletion of AZF1 compromised cell wall integrity (Slattery et al., 2006), which inhibits PKA signaling (Garcia et al., 2017). Additionally, it was reported that the deletion of AZF1 further enhanced the increased chronological lifespan of ras2∆ (Choi et al., 2013). In this study, we assessed the effect of AZF1 deletion on H2O2 resistance in both the wild-type and ras2∆ strains. Interestingly, the azf1∆ strain showed increased resistance to H2O2 stress compared to the wild-type strain, and the ras2∆azf1∆ strain exhibited higher resistance to H2O2 than the ras2∆ strain (Figure 6A). Moreover, the observed H2O2 resistance phenotypes of the strains corresponded to the levels of the Ctt1 mRNA and protein (Figures 6B,C). Next, we examined the effect of AZF1 deletion or overexpression on CTT1 expression in the ras2∆sir2∆ strain. Deletion of AZF1 further increased CTT1 expression, which is already being expressed at a high level in the ras2∆sir2∆ strain, and overexpression of AZF1 significantly reduced CTT1 expression in the ras2∆sir2∆ strain (Figure 6D). These findings imply that the Azf1 transcription factor may function as a repressor inhibiting the activity of the CTT1 promoter.
FIGURE 6
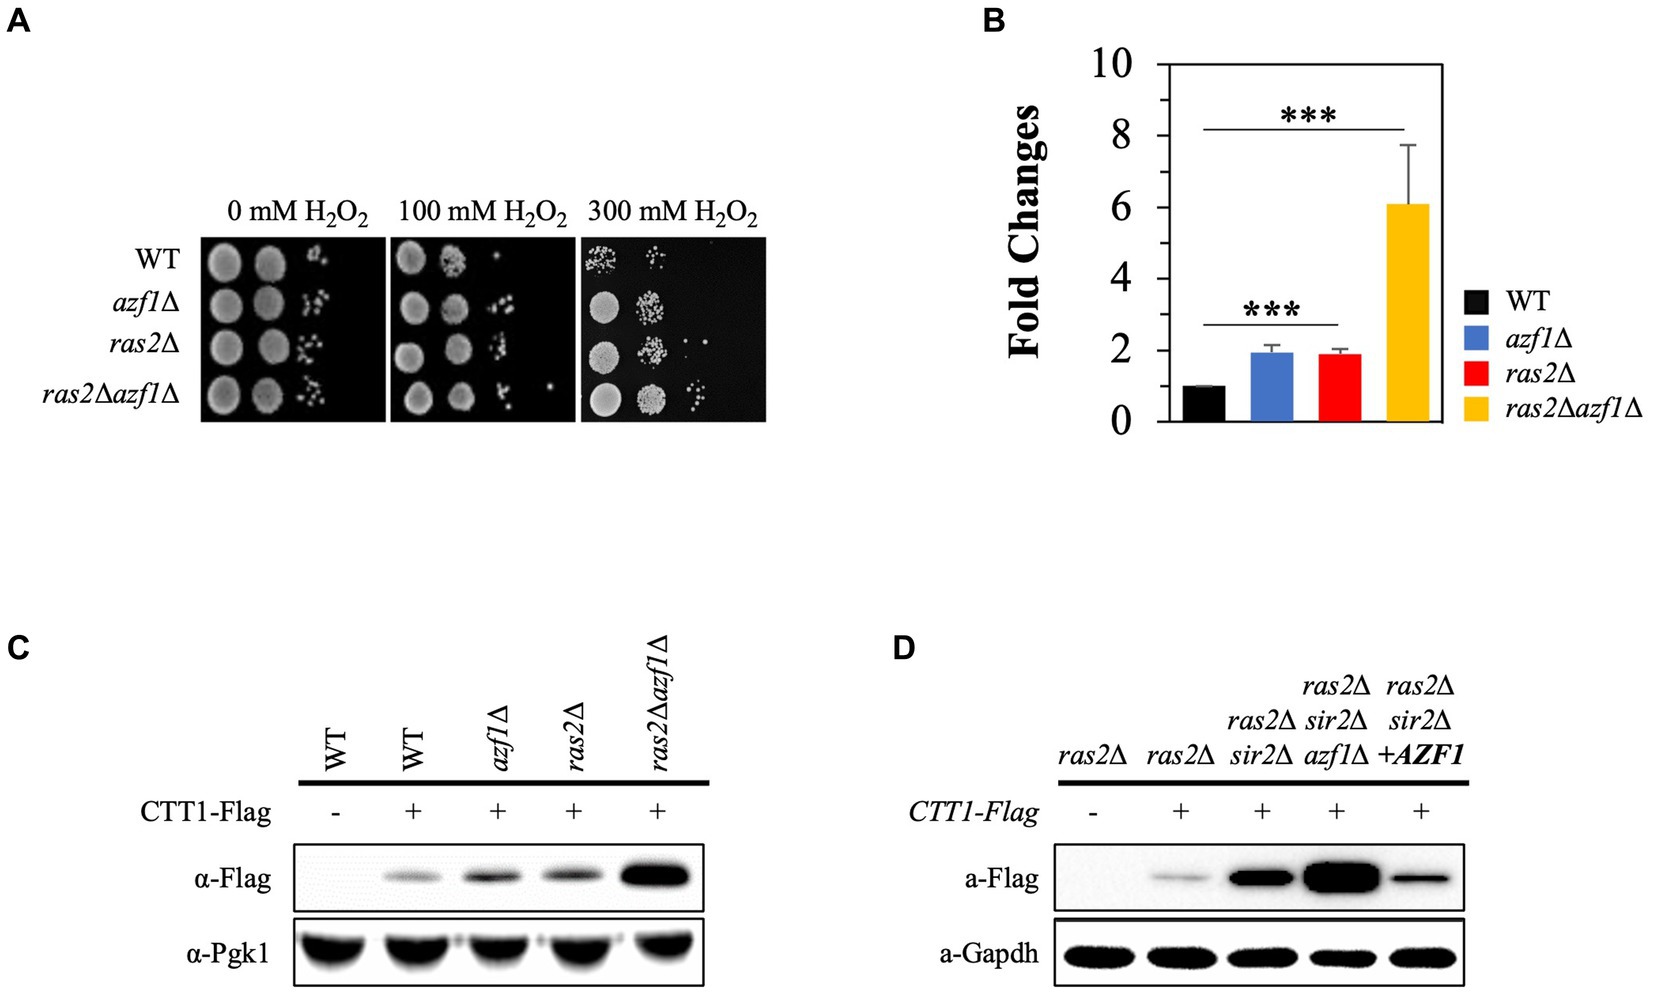
Figure 6. The Azf1 transcription factor represses CTT1 expression. (A) H2O2 resistance was assessed in the wild-type, azf1∆, ras2Δ, and ras2Δazf1 cells in the post-diauxic phase. (B) The mRNA levels of CTT1 were measured by qRT-PCR. The data represent the average of at least three independent experiments (±SD), and p-values were calculated using a t-test (***p < 0.005). (C) Ctt1 protein levels in the wild-type, azf1∆, ras2Δ, and ras2Δazf1 strains in the post-diauxic phase were measured by western blot. Pgk1 was used as a loading control. (D) Azf1 overexpression significantly reduced CTT1 expression in the ras2Δsir2Δ strain. Ctt1 protein levels in ras2Δ, ras2Δsir2Δ, ras2Δsir2Δazf1Δ, ras2Δsir2ΔAZF1(o/e) strains in the post-diauxic phase were measured by western blot. GAPDH was used as a loading control.
Sir2 is responsible for maintaining the amount of Azf1
To further investigate the association between Azf1 and Sir2 in regulating CTT1 expression, we examined the levels of Azf1 in the wild-type and sir2∆ stains. Because the transcription level of AZF1 was similar in the wild-type and sir2∆ strains (data not shown), we analyzed the amount of Azf1 protein in these strains. Surprisingly, the flag-tagged Azf1 protein level was significantly lower in the sir2∆ mutant (Figure 7A). To confirm this observation, we measured the amount of the Azf1-EGFP fusion protein expressed under the ADH1 promoter and its presence in the nucleus (Figures 7B,C). Additionally, treatment with nicotinamide, a Sir2 inhibitor, also led to a reduction in Azf1 protein levels (Figure 7D). These findings suggest that the interaction between Azf1 and Sir2 may be specific and play a role in regulating the Azf1 protein level.
FIGURE 7

Figure 7. SIR2 deletion reduces Azf1 protein level. (A) The expression level of flag-tagged Azf1 driven by the AZF1 promoter was analyzed in the wild-type and sir2∆ cells. (B) The expression level of EFGP-tagged Azf1 driven by the ADH1 promoter was analyzed in the wild-type and sir2∆ cells. GAPDH was used as a loading control. (C) Fluorescence images of the wild-type and sir2∆ strains expressing AZF1-EGFP driven by the ADH1 promoter. Fluorescence intensity was quantified using ImageJ software. p-value was calculated using a t-test (***p < 0.005). (D) Treatment with the Sir2 inhibitor nicotinamide (20 mM) decreased the expression level of Flag-tagged Azf1. (E) A schematic diagram illustrating how the absence of Sir2 can result in different levels of oxidative stress resistance during the post-diauxic phase. The red color represents the repression of CTT1 expression, while blue signifies increased expression of CTT1 or oxidative stress resistance genes.
Discussion
The regulatory function of Sir2 in cellular metabolism and genomic stability is conserved across diverse organisms (Smith et al., 2007; Schwer and Verdin, 2008). In this study, we found that the deletion of the SIR2 gene resulted in a differential response of S. cerevisiae to oxidative stress, with variations dependent upon the presence of Ras2 during the post-diauxic phase. In the presence of Ras2, the diminished expression of oxidative stress resistance genes in the sir2Δ mutant led to an increased sensitivity to oxidative stress. However, in the absence of Ras2, the substantial upregulation of CTT1 in the sir2Δ mutant conferred a strong resistance to oxidative stress on yeast cells in the post-diauxic phase. Our data suggest that the transcription factor Azf1 may act as a repressor in regulating CTT1 expression, and its abundance appears to decrease in the sir2Δ mutant. These findings underscore the significance of metabolic states and environmental conditions in shaping stress response dynamics and show the intricate interplay between Sir2 and other phase-dependent regulatory factors.
During the exponential growth phase, the sir2Δ strain exhibited increased resistance to H2O2 compared to the wild-type in the complex YPD medium and synthetic SDC medium. However, during the post-diauxic phase, the sir2Δ strain showed decreased resistance to H2O2 compared to the wild-type in the YPD medium but not in the SDC medium (Figure 1). The differences in nutrient composition and concentrations between YPD and SDC media could result in alterations in cellular processes, potentially affecting how Sir2 regulates the oxidative stress response (Wierman and Smith, 2014). We analyzed the transcriptomes of the wild-type and sir2Δ cells in the exponential or post-diauxic phase. In cells in the exponential phase, when the absence of Sir2 increased resistance to oxidative stress, none of the 47 genes with increased expression were found to be related to oxidative stress. Moreover, the GO analysis of the 130 genes exhibiting decreased expression did not show any characteristics associated with oxidative stress resistance (Supplementary Figure S4). Transcriptome analysis of cells in the post-diauxic phase revealed that several genes associated with oxidative stress resistance, such as AHP1, GCY1, and GRX1, were among the 532 genes downregulated in the sir2Δ strain. This change in the sir2Δ strain during the post-diauxic phase appears to contribute to the decreased H2O2 resistance. However, the downregulation of a significant number of genes in the sir2Δ mutant does not easily align with the gene-silencing function of Sir2 (Imai et al., 2000; Wierman and Smith, 2014). Further research is needed to elucidate the molecular mechanisms underlying this downregulation in the sir2Δ mutant.
The cytosolic pH (pHc) plays a crucial role in oxidative stress resistance during the post-diauxic phase (Figure 3). The relationship between Ras2 activity and pHc suggests that pHc is not simply a passive outcome but an active player in the cellular response, as suggested previously (Orij et al., 2011, 2012). During the post-diauxic phase in the YPD medium, Ras2 activity may be necessary for yeast cells to grow on ethanol before entering the stationary phase. In this context, stress resistance genes such as MSN2/4 are not expressed due to the active Ras2-cAMP/PKA signaling. When we either increased the cytosolic pH to inhibit Ras2 activity or deleted RAS2, Msn2/4 transcription factors were activated, leading to upregulated CTT1 expression. However, deletion of MSN2/4 in both ras2Δ and ras2Δsir2Δ mutants indicated that, while Msn2/4 play a significant role in CTT1 expression (Supplementary Figure S3), they do not fully account for the dramatic increase of CTT1 expression in the absence of Sir2. This finding implies the existence of additional regulatory elements or pathways influencing CTT1 expression. A previous study identified a region within the CTT1 promoter associated with the negative regulation of CTT1 expression (Belazzi et al., 1991), raising the possibility that a repressor may be involved in this regulation.
One of the notable findings of this study is the role of Azf1 in the intricate interactions among Ras2, Sir2, and CTT1 expression. Our discovery that the CTT1 promoter region contains Azf1 targeting sequences, specifically AAAAGAAA (A4GA3), from positions-779 to-791, when coupled with a previous study showing that deletion of AZF1 significantly enhanced the chronological lifespan (CLS) of ras2 mutants, led us to hypothesize that Azf1 could be closely linked to CTT1 expression. Azf1 transcription factor belongs to the C2H2 zinc finger class and has a largely distinct set of target genes during growth in fermentable and non-fermentable carbon sources (Stein et al., 1998; Newcomb et al., 2002; Slattery et al., 2006). In the presence of glucose, Azf1 activates the transcription of genes involved in growth and carbon metabolism, such as SIP4 and VID24. Conversely, during growth in non-fermentable carbon sources, the deletion of AZF1 was shown to increase the transcription of genes related to cell wall biogenesis and organization, including GAS1 and GAS3 (Slattery et al., 2006). Intriguingly, our study suggests that Azf1 may function as a repressor in the context of CTT1 expression (Figure 6), underscoring the multifaceted roles of Azf1 as both an activator and a repressor in cellular growth and stress responses.
The differential protein levels of Azf1 between the wild-type and sir2Δ strains in the absence of transcriptional differences suggest a post-transcriptional regulatory role for Sir2 in regulating Azf1 (Figure 7). This regulation could involve mechanisms related to protein stabilization or the regulation of degradation pathways. Indeed, previous studies have indicated that Sir2 is associated with the stability of non-histone proteins (Lin et al., 2009; Howie et al., 2019). A critical challenge for future research will be to unravel the nature of this relationship—specifically, whether Sir2 interacts directly with Azf1 or modulates its levels through intermediary proteins or pathways.
In conclusion, this study has advanced the understanding of Sir2’s complex roles in the oxidative stress response and provided valuable insights into the intricate regulatory interactions among Sir2, Azf1, and CTT1 expression in yeast. Future research could aim to delineate the molecular mechanisms underpinning these observations, including the role of physiological state and environmental factors like nutrient availability in modulating Sir2’s functions. Additional studies are essential for elucidating the precise mechanisms behind these interactions and understanding their implications for cellular physiology and adaptation.
Data availability statement
The datasets presented in this study can be found in online repositories. The names of the repository/repositories and accession number(s) can be found at: https://figshare.com/, doi.org/10.6084/m9.figshare.24055566.v1.
Author contributions
YHK: Investigation, Writing – original draft. J-IR: Investigation, Validation, Visualization, Writing – review & editing. MD: Investigation, Writing – review & editing. JJ: Investigation, Writing – review & editing. J-YK: Conceptualization, Funding acquisition, Resources, Supervision, Writing – original draft, Writing – review & editing.
Funding
The author(s) declare financial support was received for the research, authorship, and/or publication of this article. This research was supported by grants from NRF-2016R1A2B4014529 and NRF-2020R1A2C1010254 and Chungnam National University.
Conflict of interest
The authors declare that the research was conducted in the absence of any commercial or financial relationships that could be construed as a potential conflict of interest.
Publisher’s note
All claims expressed in this article are solely those of the authors and do not necessarily represent those of their affiliated organizations, or those of the publisher, the editors and the reviewers. Any product that may be evaluated in this article, or claim that may be made by its manufacturer, is not guaranteed or endorsed by the publisher.
Supplementary material
The Supplementary material for this article can be found online at: https://www.frontiersin.org/articles/10.3389/fmicb.2023.1285559/full#supplementary-material
References
Aguilaniu, H., Gustafsson, L., Rigoulet, M., and Nystrom, T. (2003). Asymmetric inheritance of oxidatively damaged proteins during cytokinesis. Science 299, 1751–1753. doi: 10.1126/science.1080418
Barry, H., and Gutteridge, J. M. C.. (2015). Free radicals in biology and medicine. Oxford: Oxford University Press.
Bartosz, G. (2009). Reactive oxygen species: destroyers or messengers? Biochem. Pharmacol. 77, 1303–1315. doi: 10.1016/j.bcp.2008.11.009
Belazzi, T., Wagner, A., Wieser, R., Schanz, M., Adam, G., Hartig, A., et al. (1991). Negative regulation of transcription of the Saccharomyces cerevisiae catalase T (CTT1) gene by cAMP is mediated by a positive control element. EMBO J. 10, 585–592. doi: 10.1002/j.1460-2075.1991.tb07985.x
Bissinger, P. H., Wieser, R., Hamilton, B., and Ruis, H. (1989). Control of Saccharomyces cerevisiae catalase T gene (CTT1) expression by nutrient supply via the RAS-cyclic AMP pathway. Mol. Cell. Biol. 9, 1309–1315.
Choi, K. M., Kwon, Y. Y., and Lee, C. K. (2013). Characterization of global gene expression during assurance of lifespan extension by caloric restriction in budding yeast. Exp. Gerontol. 48, 1455–1468. doi: 10.1016/j.exger.2013.10.001
Creamer, D. R., Hubbard, S. J., Ashe, M. P., and Grant, C. M. (2022). Yeast protein kinase a isoforms: a means of encoding specificity in the response to diverse stress conditions? Biomol. Ther. 12:958. doi: 10.3390/biom12070958
Dang, W., Steffen, K. K., Perry, R., Dorsey, J. A., Johnson, F. B., Shilatifard, A., et al. (2009). Histone H4 lysine 16 acetylation regulates cellular lifespan. Nature 459, 802–807. doi: 10.1038/nature08085
Davidson, J. F., Whyte, B., Bissinger, P. H., and Schiestl, R. H. (1996). Oxidative stress is involved in heat-induced cell death in Saccharomyces cerevisiae. Proc. Natl. Acad. Sci. U. S. A. 93, 5116–5121. doi: 10.1073/pnas.93.10.5116
de la Torre-Ruiz, M. A., Pujol, N., and Sundaran, V. (2015). Coping with oxidative stress. The yeast model. Curr. Drug Targets 16, 2–12. doi: 10.2174/1389450115666141020160105
Devare, M. N., Kim, Y. H., Jung, J., Kang, W. K., Kwon, K. S., and Kim, J. Y. (2020). TORC1 signaling regulates cytoplasmic pH through Sir2 in yeast. Aging Cell 19:e13151. doi: 10.1111/acel.13151
Dolz-Edo, L., van der Deen, M., Brul, S., and Smits, G. J. (2019). Caloric restriction controls stationary phase survival through protein kinase a (PKA) and cytosolic pH. Aging Cell 18:e12921. doi: 10.1111/acel.12921
Erjavec, N., Larsson, L., Grantham, J., and Nystrom, T. (2007). Accelerated aging and failure to segregate damaged proteins in Sir2 mutants can be suppressed by overproducing the protein aggregation-remodeling factor Hsp104p. Genes Dev. 21, 2410–2421. doi: 10.1101/gad.439307
Fabrizio, P., Gattazzo, C., Battistella, L., Wei, M., Cheng, C., Mcgrew, K., et al. (2005). Sir2 blocks extreme life-span extension. Cells 123, 655–667. doi: 10.1016/j.cell.2005.08.042
Fabrizio, P., Liou, L. L., Moy, V. N., Diaspro, A., Valentine, J. S., Gralla, E. B., et al. (2003). SOD2 functions downstream of Sch9 to extend longevity in yeast. Genetics 163, 35–46. doi: 10.1093/genetics/163.1.35
Fabrizio, P., Pozza, F., Pletcher, S. D., Gendron, C. M., and Longo, V. D. (2001). Regulation of longevity and stress resistance by Sch9 in yeast. Science 292, 288–290. doi: 10.1126/science.1059497
Finkel, T., and Holbrook, N. J. (2000). Oxidants, oxidative stress and the biology of ageing. Nature 408, 239–247. doi: 10.1038/35041687
Garcia, R., Bravo, E., Diez-Muniz, S., Nombela, C., Rodriguez-Pena, J. M., and Arroyo, J. (2017). A novel connection between the cell wall integrity and the PKA pathways regulates cell wall stress response in yeast. Sci. Rep. 7:5703. doi: 10.1038/s41598-017-06001-9
Hasan, R., Leroy, C., Isnard, A. D., Labarre, J., Boy-Marcotte, E., and Toledano, M. B. (2002). The control of the yeast H2O2 response by the Msn2/4 transcription factors. Mol. Microbiol. 45, 233–241. doi: 10.1046/j.1365-2958.2002.03011.x
He, X. J., and Fassler, J. S. (2005). Identification of novel Yap1p and Skn7p binding sites involved in the oxidative stress response of Saccharomyces cerevisiae. Mol. Microbiol. 58, 1454–1467. doi: 10.1111/j.1365-2958.2005.04917.x
Howie, R. L., Jay-Garcia, L. M., Kiktev, D. A., Faber, Q. L., Murphy, M., Rees, K. A., et al. (2019). Role of the cell asymmetry apparatus and ribosome-associated chaperones in the destabilization of a Saccharomyces cerevisiae prion by heat shock. Genetics 212, 757–771. doi: 10.1534/genetics.119.302237
Imai, S., Armstrong, C. M., Kaeberlein, M., and Guarente, L. (2000). Transcriptional silencing and longevity protein Sir2 is an NAD-dependent histone deacetylase. Nature 403, 795–800. doi: 10.1038/35001622
Kaeberlein, M., Mcvey, M., and Guarente, L. (1999). The SIR2/3/4 complex and SIR2 alone promote longevity in Saccharomyces cerevisiae by two different mechanisms. Genes Dev. 13, 2570–2580. doi: 10.1101/gad.13.19.2570
Kang, W. K., Kim, Y. H., Kim, B. S., and Kim, J. Y. (2014). Growth phase-dependent roles of Sir2 in oxidative stress resistance and chronological lifespan in yeast. J. Microbiol. 52, 652–658. doi: 10.1007/s12275-014-4173-2
Lee, J., Godon, C., Lagniel, G., Spector, D., Garin, J., Labarre, J., et al. (1999). Yap1 and Skn7 control two specialized oxidative stress response regulons in yeast. J. Biol. Chem. 274, 16040–16046. doi: 10.1074/jbc.274.23.16040
Lin, Y. Y., Lu, J. Y., Zhang, J., Walter, W., Dang, W., Wan, J., et al. (2009). Protein acetylation microarray reveals that NuA4 controls key metabolic target regulating gluconeogenesis. Cells 136, 1073–1084. doi: 10.1016/j.cell.2009.01.033
Mirisola, M. G., and Longo, V. D. (2022). Yeast chronological lifespan: longevity regulatory genes and mechanisms. Cells 11:1714. doi: 10.3390/cells11101714
Morano, K. A., Grant, C. M., and Moye-Rowley, W. S. (2012). The response to heat shock and oxidative stress in Saccharomyces cerevisiae. Genetics 190, 1157–1195. doi: 10.1534/genetics.111.128033
Newcomb, L. L., Hall, D. D., and Heideman, W. (2002). AZF1 is a glucose-dependent positive regulator of CLN3 transcription in Saccharomyces cerevisiae. Mol. Cell. Biol. 22, 1607–1614. doi: 10.1128/MCB.22.5.1607-1614.2002
Orij, R., Brul, S., and Smits, G. J. (2011). Intracellular pH is a tightly controlled signal in yeast. Biochim. Biophys. Acta 1810, 933–944. doi: 10.1016/j.bbagen.2011.03.011
Orij, R., Urbanus, M. L., Vizeacoumar, F. J., Giaever, G., Boone, C., Nislow, C., et al. (2012). Genome-wide analysis of intracellular pH reveals quantitative control of cell division rate by pH(c) in Saccharomyces cerevisiae. Genome Biol. 13:R80. doi: 10.1186/gb-2012-13-9-r80
Plank, M. (2022). Interaction of TOR and PKA signaling in S. cerevisiae. Biomol. Ther. 12:210. doi: 10.3390/biom12020210
Rogina, B., and Helfand, S. L. (2004). Sir2 mediates longevity in the fly through a pathway related to calorie restriction. Proc. Natl. Acad. Sci. U. S. A. 101, 15998–16003. doi: 10.1073/pnas.0404184101
Satoh, A., Brace, C. S., Rensing, N., Cliften, P., Wozniak, D. F., Herzog, E. D., et al. (2013). Sirt1 extends life span and delays aging in mice through the regulation of Nk2 homeobox 1 in the DMH and LH. Cell Metab. 18, 416–430. doi: 10.1016/j.cmet.2013.07.013
Schieber, M., and Chandel, N. S. (2014). ROS function in redox signaling and oxidative stress. Curr. Biol. 24, R453–R462. doi: 10.1016/j.cub.2014.03.034
Schwer, B., and Verdin, E. (2008). Conserved metabolic regulatory functions of sirtuins. Cell Metab. 7, 104–112. doi: 10.1016/j.cmet.2007.11.006
Slattery, M. G., Liko, D., and Heideman, W. (2006). The function and properties of the Azf1 transcriptional regulator change with growth conditions in Saccharomyces cerevisiae. Eukaryot. Cell 5, 313–320. doi: 10.1128/EC.5.2.313-320.2006
Smith, D. L., Mcclure, J. M., Matecic, M., and Smith, J. S. (2007). Calorie restriction extends the chronological lifespan of Saccharomyces cerevisiae independently of the sirtuins. Aging Cell 6, 649–662. doi: 10.1111/j.1474-9726.2007.00326.x
Stein, T., Kricke, J., Becher, D., and Lisowsky, T. (1998). Azf1p is a nuclear-localized zinc-finger protein that is preferentially expressed under non-fermentative growth conditions in Saccharomyces cerevisiae. Curr. Genet. 34, 287–296. doi: 10.1007/s002940050398
Tissenbaum, H. A., and Guarente, L. (2001). Increased dosage of a sir-2 gene extends lifespan in Caenorhabditis elegans. Nature 410, 227–230. doi: 10.1038/35065638
Keywords: Saccharomyces cerevisiae, Sir2, oxidative stress, Ras2, cytosolic pH, Azf1
Citation: Kim YH, Ryu J-I, Devare MN, Jung J and Kim J-Y (2023) The intricate role of Sir2 in oxidative stress response during the post-diauxic phase in Saccharomyces cerevisiae. Front. Microbiol. 14:1285559. doi: 10.3389/fmicb.2023.1285559
Edited by:
You-Hee Cho, CHA University, Republic of KoreaReviewed by:
Woo-Hyun Chung, Duksung Women’s University, Republic of KoreaClaudia Segal, National Autonomous University of Mexico, Mexico
Copyright © 2023 Kim, Ryu, Devare, Jung and Kim. This is an open-access article distributed under the terms of the Creative Commons Attribution License (CC BY). The use, distribution or reproduction in other forums is permitted, provided the original author(s) and the copyright owner(s) are credited and that the original publication in this journal is cited, in accordance with accepted academic practice. No use, distribution or reproduction is permitted which does not comply with these terms.
*Correspondence: Jeong-Yoon Kim, jykim@cnu.ac.kr
†These authors have contributed equally to this work