 Hui Wang1
 Zhifeng Yan
 Jinbo Zhang
 Siliang Li
- 1School of Earth System Science, Institute of Surface-Earth System Science, Tianjin University, Tianjin, China
- 2Critical Zone Observatory of Bohai Coastal Region, Tianjin Key Laboratory of Earth Critical Zone Science and Sustainable Development in Bohai Rim, Tianjin University, Tianjin, China
- 3College of Tropical Crops, Hainan University, Haikou, China
- 4State Key Laboratory of Urban and Regional Ecology, Research Center for Eco-Environmental Sciences, Chinese Academy of Sciences, Beijing, China
- 5School of Geography Sciences, Nanjing Normal University, Nanjing, China
- 6Department of Soil Science, University of Wisconsin-Madison, Madison, WI, United States
Biogenic nitrous oxide (N2O) from nitrification and denitrification in agricultural soils is a major source of N2O in the atmosphere, and its flux changes significantly with soil moisture condition. However, the quantitative relationship between N2O production from different pathways (i.e., nitrification vs. denitrification) and soil moisture content remains elusive, limiting our ability of predicting future agricultural N2O emissions under changing environment. This study quantified N2O production rates from nitrification and denitrification under various soil moisture conditions using laboratory incubation combined with literature synthesis. 15N labeling approach was used to differentiate the N2O production from nitrification and denitrification under eight different soil moisture contents ranging from 40 to 120% water-filled pore space (WFPS) in the laboratory study, while 80 groups of data from 17 studies across global agricultural soils were collected in the literature synthesis. Results showed that as soil moisture increased, N2O production rates of nitrification and denitrification first increased and then decreased, with the peak rates occurring between 80 and 95% WFPS. By contrast, the dominant N2O production pathway switched from nitrification to denitrification between 60 and 70% WFPS. Furthermore, the synthetic data elucidated that moisture content was the major driver controlling the relative contributions of nitrification and denitrification to N2O production, while NH4+ and NO3− concentrations mainly determined the N2O production rates from each pathway. The moisture treatments with broad contents and narrow gradient were required to capture the comprehensive response of soil N2O production rate to moisture change, and the response is essential for accurately predicting N2O emission from agricultural soils under climate change scenarios.
1. Introduction
Nitrous oxide (N2O) is a potent long-lived greenhouse gas, with global warming potential 296 times higher than carbon dioxide (CO2; Tian et al., 2020). Agricultural soil has been identified as a major source of atmospheric N2O, accounting for approximately 60% of the global anthropogenic N2O emissions (Reay et al., 2012; Cui et al., 2021). Soil moisture content is a primary regulator to control N2O emissions from agricultural systems (Congreves et al., 2019). Particularly, the N2O emissions from the soils under high moisture conditions (e.g., after rainfall or irrigation events) can constitute more than 30% of the annual emission (Trost et al., 2013; Ju and Zhang, 2017); this proportion will likely increase with the intensive use of irrigation under droughts and the increase in the frequency of heavy rainfalls, both of which were projected as a consequence of climate change (Reichstein et al., 2013; Siebert et al., 2015). However, the quantitative relationships between soil N2O emissions from various biological processes, including nitrification, dentification, dissimilatory nitrate reduction to ammonium (DNRA) and anaerobic ammonia oxidation, and soil moisture content remain understudied (Castellano et al., 2010; Hall et al., 2018; Li et al., 2022), impeding our ability to predict the future N2O emission from agricultural systems.
Nitrification and denitrification are two of the most important biological processes to produce N2O (Butterbach-Bahl et al., 2013), and soil moisture content substantially controls the relative contributions of these two pathways and their production rates of N2O (Ciarlo et al., 2007; Congreves et al., 2019). Therefore, how to accurately describe the relationships between N2O production rates of nitrification and denitrification and moisture content in mathematical models is crucial for estimating and predicting the N2O emission from soils (Yue et al., 2019). Current models, such as DNDC (Li et al., 2000) and DayCent (Parton et al., 1996), have used various types of relationships, including linear, parabolic, and exponential ones, to depict the response of N2O production rate to moisture change (Wang et al., 2021), regardless of the fact that the N2O production rates from nitrification and denitrification were theoretically expected to first increase and then decrease as moisture content increases (Davidson et al., 2000). These divergent relationships inevitably result in large uncertainty in simulating soil N2O emission (Gaillard et al., 2018), and accurately quantifying the relationships between N2O production rate and moisture content is urgently required.
Although many studies have measured the response of total N2O production rate to changes in moisture content (Dobbie and Smith, 2001; Schaufler et al., 2010; Cheng et al., 2014; Hall et al., 2018; Kuang et al., 2019), only a few quantified the N2O production rates of nitrification and denitrification under different moisture conditions (Pihlatie et al., 2004; Bateman and Baggs, 2005). In these studies, unidirectional increases in the N2O production rates of denitrification and nitrification were often reported as moisture increased, which contrasted with the classic hole-in-pipe model (Davidson et al., 2000). This inconsistency can be attributed to many factors such as soil physicochemical properties and measurement approaches (Liu et al., 2018; Qin et al., 2021). Among these factors, moisture treatments used in different studies should be the primary driver, since the majority of these studies adopted insufficient gradients and inadequate levels of soil moisture (Bateman and Baggs, 2005; Chen et al., 2014), which failed to capture the comprehensive change in N2O production rates in response to varied moisture conditions (Smith, 2017). Therefore, sufficient moisture treatments with broad range and narrow gradient are required to fill the gap between measurements and expectations.
This study hypothesizes that the production rates of N2O from both nitrification and denitrification first increase and then decrease as moisture content increases. We tested this hypothesis by using both laboratory incubation and literature synthesis. In the laboratory study, a 15N-labeled technique was applied to distinguish the nitrification and denitrification under eight moisture levels in the agricultural soils from the North China Plain. For the literature synthesis, data derived from different differentiation approaches under various moisture conditions across global agricultural soils were analyzed. The results refined the quantitative relationships between N2O production rate and moisture content from both nitrification and denitrification, and laid a foundation to improve the modeling of N2O emissions from agricultural soils.
2. Materials and methods
2.1. Site description and soil sampling
Soil samples (0–15 cm) were collected from agricultural fields in two locations: Shang Zhuang (SZ), Beijing (39°48′N, 116°28′E) and Luan Cheng (LC), Hebei (37°53′ N, 114°41′E), North China Plain, in October 2020. The annual average temperature is 12.5°C, and the annual precipitation is 500–700 mm with high variation among different years. The cropping system in this region is winter wheat-summer maize rotation. The fertilizer application rates were 280 and 600 kg N ha−1 year−1 in SZ and LC soils, respectively. Collected soils were air-dried and sieved to 2 mm. Visible roots and leaves were removed with tweezers and the soil was immediately stored at 4°C until the beginning of laboratory experiment. The soils are both classified as silt loam, with 36.1% sand, 56.4% silt, and 7.5% clay for the SZ soil and 29.2% sand, 64.1% silt, and 6.7% clay for the LC soil. For the SZ soil, pH was 7.89, bulk density was 1.02 g cm−3, soil organic carbon was 10.93 g kg−1, total N was 1.13 g kg−1, NH4+-N was 3.07 mg kg−1, and NO3−-N was 22.5 mg kg−1. For the LC soil, pH was 7.92, bulk density was 1.00 g cm−3, soil organic carbon was 19.82 g kg−1, total N was 2.11 g kg−1, NH4+-N was 2.08 mg kg−1, and NO3−-N was 30.49 mg kg−1.
2.2. 15N tracing incubation experiment
Soils (20 g oven-dry equivalent) were placed into 120 ml incubation flasks and distilled water was added to the soils to below the target moisture contents [i.e., 40, 60, 70, 80, 90, 95, 100, and 120% water-filled pore space (WFPS)]. The microcosms were then pre-incubated at 25°C for 7 days to initiate microbial activity. For each moisture content treatment, 15NH4Cl (10.08 atom%) + KNO3 or K15NO3 (10.16 atom%) + NH4Cl were applied at a rate of 50 mg NH4+-N kg−1 and 50 mg NO3−-N kg−1 after pre-incubation. To assure uniform distribution, 2 ml of 15N solution was applied in water solution and sprayed onto the soils to obtain the target moisture content. The experimental design and treatment application were set up as completely randomized blocks and incubated in dark for 48 h at 25°C after 15N application.
Each treatment was replicated three times for gas analyses, with gas samples collected at 12, 24, and 48 h. Before sampling, the flasks were flushed with ambient air using a multiport vacuum manifold, and the N2O concentration in the headspace was then measured. Thereafter, the flasks were immediately sealed for 12 h and N2O concentration was measured again. The difference between the two N2O concentrations was used to calculate the N2O production rate. The concentrations of N2O and CO2 were determined using gas chromatography (Agilent 7,890, Santa Clara, CA, United States) and the 15N signature of N2O was determined using a Thermo Finnigan MAT-253 spectrometer (Thermo Fisher Scientific, Waltham, MA, United States). Another group of flasks, also replicated three times, were used for soil sampling at 0.5, 12, 24, and 48 h after N application. Soils were extracted with 1 M KCl (20 g soil to 100 ml KCl solution), shaken for 1 h, and filtered. The concentrations of NH4+-N and NO3−-N in the extracts were measured using a continuous-flow analyzer (Skalar Analytical, Breda, Netherlands). Isotope analysis of NH4+-N and NO3−-N were performed on aliquots of the extracts using a diffusion technique (Brooks et al., 1989) and the 15N isotopic signature was measured by isotope ratio mass spectrometry (IRMS 20–22, Sercon, Crewe, United Kingdom).
2.3. Calculation
Nitrous oxide and CO2 fluxes (F, μg N kg−1 h−1 or mg C kg−1 h−1) were determined from the concentrations at each sampling time, using the background N2O and CO2 concentrations in the ambient air as the initial time point, which were calculated as follows:
where ρ is the density of gas under standard conditions (kg m−3), ΔC is the variation in gas concentration during the flask-covering period (the units of N2O and CO2 are ppbv and ppmv, respectively), and V is the effective volume of a given flask (m3), T is the incubation temperature (°C), Δt is the incubation time (h), and W is the weight of soil (oven-dried basis, kg).
The contributions of denitrification, , and nitrification, to the production of N2O were calculated using the following equation (Stevens et al., 1997):
where aN2O is the 15N atom% enrichment of the N2O produced by both processes, and aNO3 and aNH4 are the 15N atom% enrichment of soil NO3− and NH4+ at the time of gas sampling.
Rates of N2O production from nitrification (N2On) and denitrification (N2Od) were calculated as follows:
where N2OT is the total N2O production rate from the soils, N2OT = N2On + N2Od.
Since the concentrations and abundances of NH4+ at 48 h could not be reliably determined in most treatments, the average , , and over the first 24 h incubation were used to analyze the rates of N2O production from nitrification and denitrification.
2.4. Literature synthesis
Data on the N2O production rates of nitrification and denitrification were collected from published peer-reviewed journal articles. The following criteria were used for data collection: (1) incubation experiments used agricultural soils solely; (2) soil moisture metric was expressed as WFPS. Meanwhile, soil characteristics and incubation conditions, including pH, BD, clay content, SOC content, concentrations of TN, NH4+, and NO3−, incubation temperature and WFPS, were collected. GetData Graph Digitizer 2.26 was used when data were only graphically shown. The autotrophic nitrification and heterotrophic nitrification were summed and treated as nitrification during the data analysis if they were reported as individual pathways in the literature. In total, 80 groups of data from 17 studies were obtained (Supplementary Table S1).
2.5. Statistical analysis
All statistical analyses were evaluated by one-way analysis of variance (ANOVA) for comparisons among multiple factors and t-test for contrasts between two factors, followed by the least significant difference test at P<0.05. The relationships between the contributions of nitrification and denitrification to N2O production or their rates and the controlling factors were examined by correlation and regression analysis. All statistical analyses were carried out in SPSS v25.0 software for Windows (SPSS Inc., Chicago, United States).
3. Results
3.1. Changes in concentrations of NH4+ and NO3− and production rate of nitrous oxide
The concentration of soil NH4+ decreased over the incubation course in all moisture treatments (Figures 1A,B). For both SZ and LC soils, the declining rates of NH4+ over the first 24 h were nearly twice larger in the treatments of WFPS ≤80% than in the treatments of WFPS ≥90%. After the first 24 h, the declining rate slowed down clearly when WFPS ≤80%, especially for the LC soil (Figure 1B), while it nearly kept constant under WFPS ≥90%. Among all the WFPS treatments, the largest consumption rate of NH4+ occurred at 60% WFPS for both SZ and LC soils.
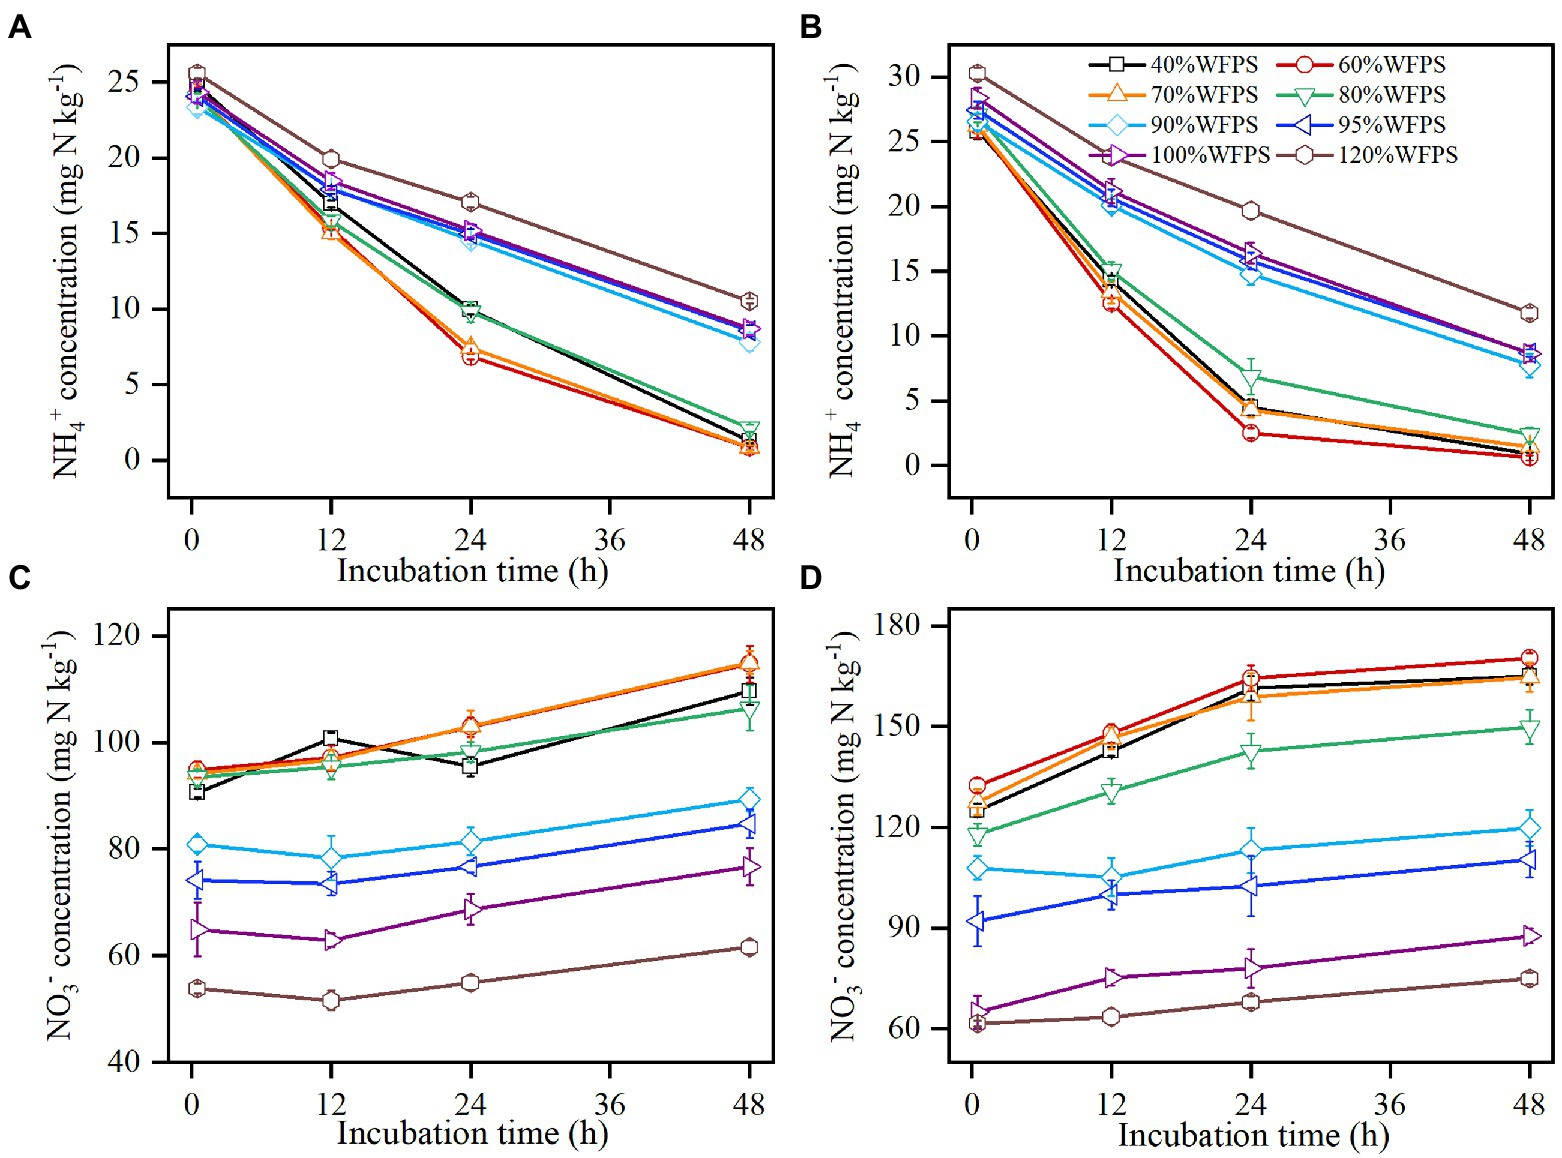
Figure 1. Changes in concentrations of ammonium (NH4+) and nitrate (NO3−) over 48 h of incubations in SZ (A,C) and LC (B,D) soils. Vertical bars are standard deviations of the means (n = 6).
The concentration of soil NO3− increased as NH4+ was nitrified (Figures 1C,D). In correspondence to the changes in NH4+ concentration, NO3− concentration increased faster when WFPS ≤80% than when WFPS ≥90%, especially for the LC soil during the first 24 h. The initial NO3− concentration exhibited large variances for different moisture contents, since nitrification increased NO3− concentration under low moisture content while denitrification reduced NO3− concentration under high moisture during the pre-incubation period. As the initial NO3− concentration markedly reduced as WFPS increased, the NO3− concentration varied largely at the end of incubation especially for the LC soil, changing from 170.3 to 75.0 mg N kg−1 as WFPS increased from 60 to 120%.
The N2O production rate changed substantially with moisture content and time (Figure 2). At the beginning of incubation, high N2O production rates (> 5 μg N kg−1 h−1) occurred under 80% ≤ WFPS ≤100% in the SZ soil and under 70% ≤ WFPS ≤100% in the LC soil, whereas the rates remained low under the lower or higher moisture conditions. As the incubation proceeded, the N2O production rate first increased and then decreased under the intermediate moisture conditions (e.g., WFPS = 70, 90, and 95%) in the SZ soil, but consistently reduced under all moisture conditions in the LC soil. Finally, the N2O production rates declined to below 5 μg N kg−1 h−1 under all moisture contents for both soils at the end of incubation. By contrast, CO2 production rates were higher at WFPS ≥90% than at WFPS <90% for both soils, except for 95% WFPS in the LC soil (P<0.05; Supplementary Figure S1).
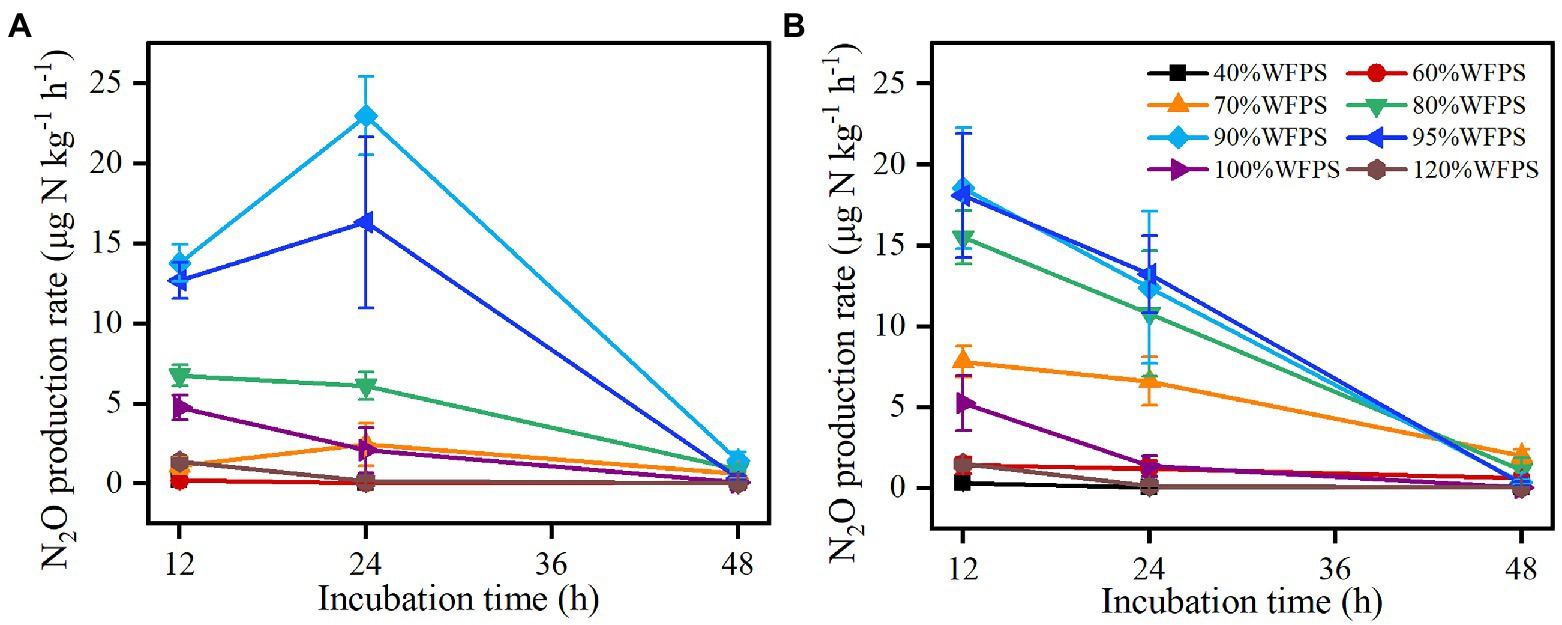
Figure 2. Changes in N2O production rate over 48 h of incubations from SZ (A) and LC (B) soils. Vertical bars are the standard deviations of the means (n = 6).
3.2. Nitrous oxide production from nitrification and denitrification
The 15N enrichment of N2O remained between the 15N enrichments of NH4+ and NO3− during the first 24 h, illustrating that N2O was derived from both nitrification and denitrification (Supplementary Figure S2). The average contribution of denitrification to N2O production, , increased with moisture content in the SZ and LC soils up to 100 and 95% WFPS, respectively, after which declined significantly (Figure 3). In both soils, nitrification was the main pathway producing N2O under low moisture conditions while denitrification dominated N2O production under high moisture conditions, with the threshold occurred at 70 and 60% WFPS for the SZ and LC soils, respectively. Denitrification contributed more than 65% of the total N2O production when WFPS ≥70%, and this percentage promoted as the incubation proceeded (Supplementary Table S2).
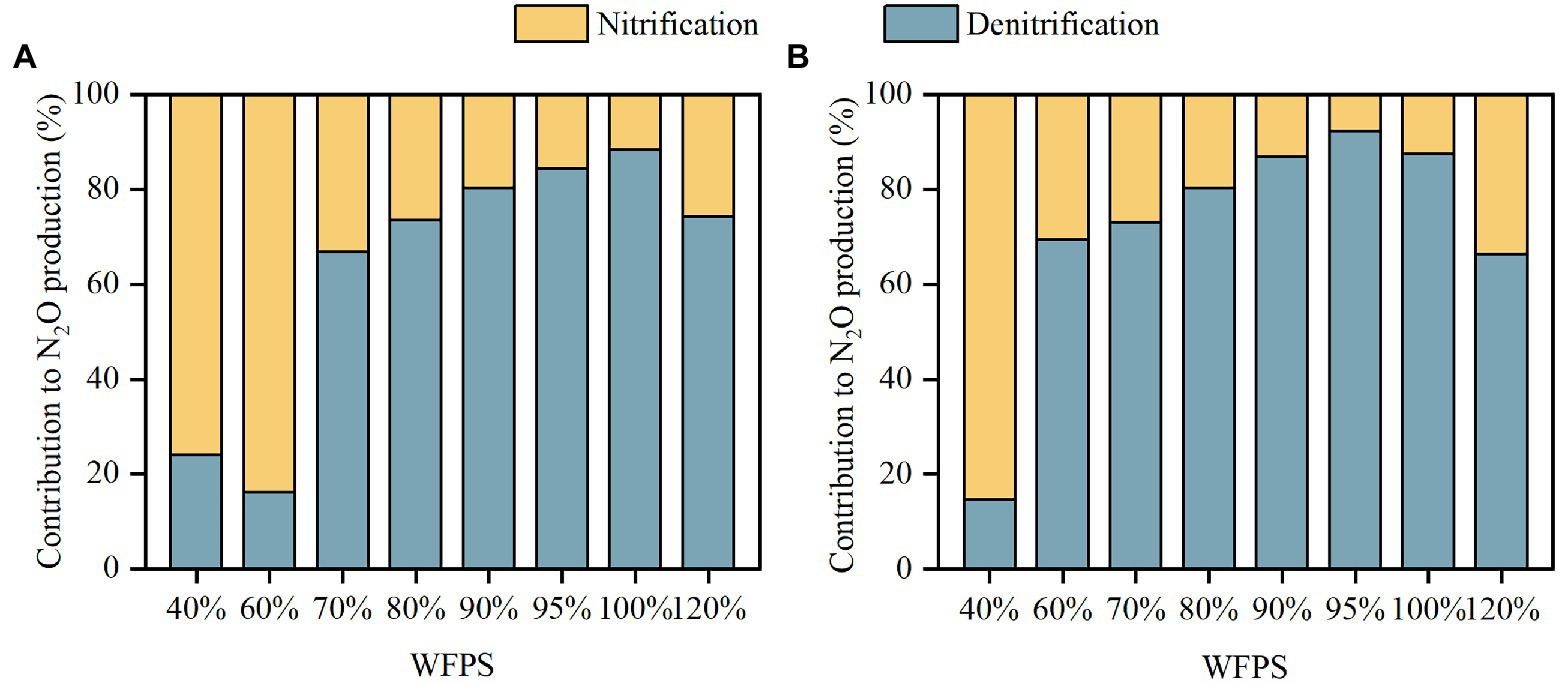
Figure 3. The contributions of nitrification and denitrification to N2O production in SZ (A) and LC (B) soils.
Nitrous oxide production rates derived from nitrification (N2On), denitrification (N2Od) and the combined processes (N2OT) responded to moisture change in a pattern similar to Gaussian function in both SZ and LC soils (Figure 4). As moisture increased, the N2On increased slowly, reaching peaks around 2.5 μg N kg−1 h−1 in both SZ and LC soils, while the N2Od increased steeply, reaching peaks of 10.1 and 12.5 μg N kg−1 h−1 in the SZ and LC soils, respectively. Correspondingly, the optimal WFPS with respect to the peak rates were the same for the nitrification and denitrification processes (90% WFPS) in the SZ soil, but diverged for the two pathways (80 and 95% WFPS, respectively) in the LC soil. The N2O production rates remained below 3 μg N kg−1 h−1 under either low or flooded moisture condition.
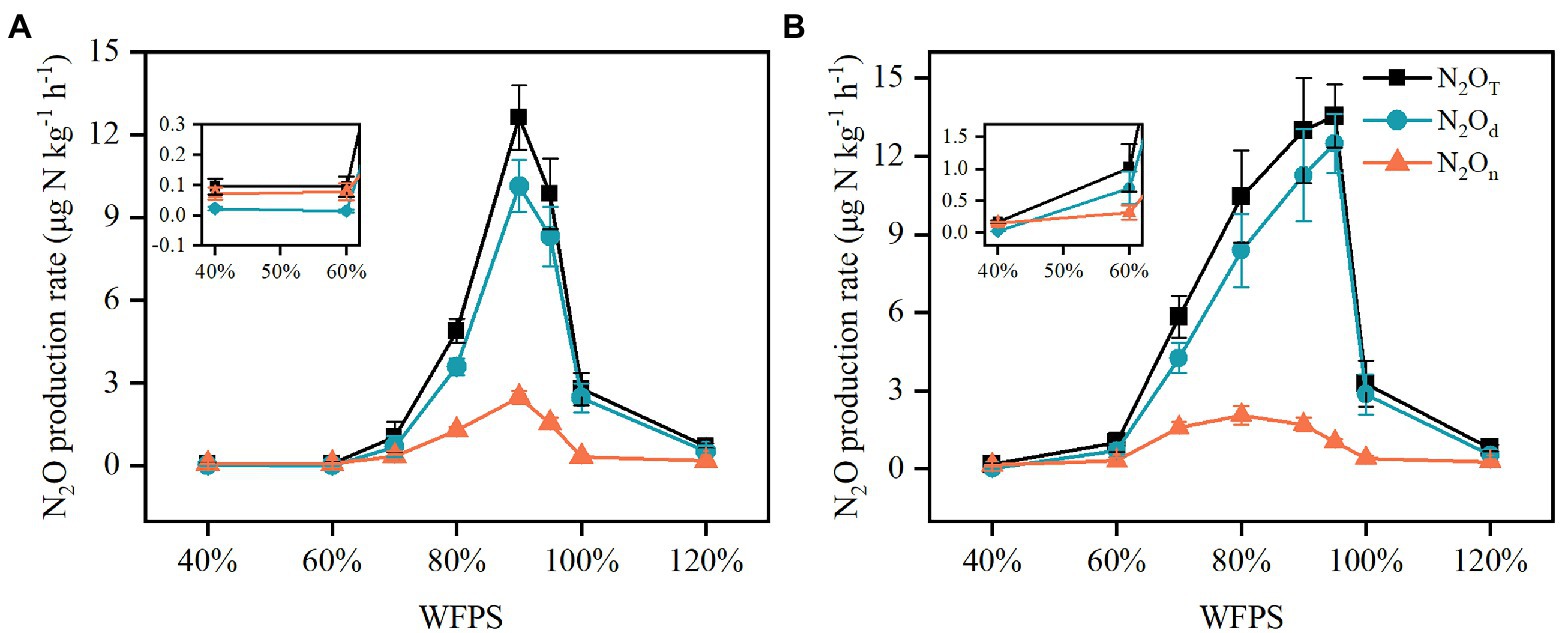
Figure 4. The N2O production rates derived from nitrification (N2On), denitrification (N2Od) and the combined processes (N2OT) in the SZ (A) and LC (B) soils under different WFPS.
3.3. Literature synthesis: Nitrous oxide production from nitrification and denitrification across agricultural soils
By synthesizing literature data across global agricultural soils, moisture (WFPS) and incubation temperature (T) were found to be the most significant factors controlling the contributions of nitrification and denitrification to N2O production (Table 1), with WFPS exerting a stronger correlation (R = 0.45) than T (R = 0.37; Figure 5; Supplementary Figure S3). Compared with the literature data (R = 0.36), the measured data in this study exhibited a stronger positive correlation between and WFPS (R = 0.73; Figure 5). Furthermore, a stronger correlation between and WFPS occurred in alkaline soils than in acidic soils (Supplementary Figure S4A). Similarly, compared with carbon-rich soils with SOC ≥ 4%, mineral soils with SOC < 4% showed a stronger correlation (Supplementary Figure S4B).
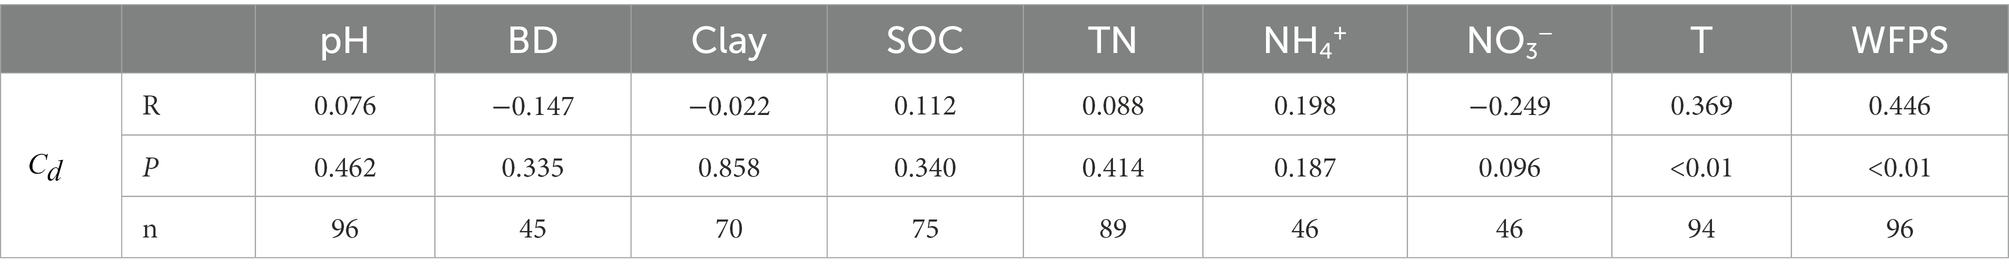
Table 1. Correlations between the contribution of denitrification () and soil properties as well as environmental conditions, which include soil pH, bulk density (BD), clay content, soil organic carbon (SOC), total nitrogen (TN) concentrations, NH4+ and NO3− concentrations, incubation temperature (T) and water-filled pore space (WFPS), across agricultural soils.
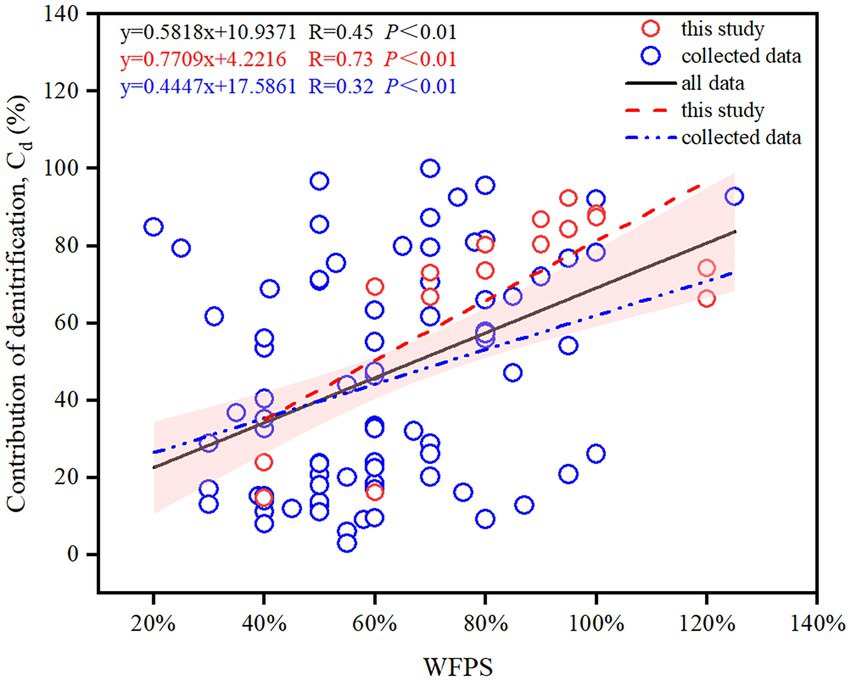
Figure 5. Changes in the contribution of denitrification to N2O production () with WFPS across global agricultural soils. The shaded region represents the 95% confidence interval for all data.
Based on the literature synthesis, the N2On and N2Od generally first increased and then decreased as WFPS increased (Figure 6). The relationships between the N2O production rates of nitrification and denitrification and WFPS were fitted by Gaussian function. Compared with nitrification (Figure 6A), denitrification (Figure 6B) showed a smaller standard deviation, 5% vs. 14%, and a higher maximum rate, 106 vs. 12 μg N kg−1 h−1, though both of their peak rates occurred at around 85% WFPS. The correlations between N2O production rates and various soil properties were also analyzed (Supplementary Table S3). The results indicated that NH4+ and NO3− concentrations were the most powerful drivers to explain the changes in N2On and N2Od. Both N2On and N2Od increased positively with the increases in NH4+ (P<0.05; Supplementary Figures S5A,C) and NO3− concentrations (P<0.01; Supplementary Figures S5B,D), though the variances of rates were large as the concentrations were high.
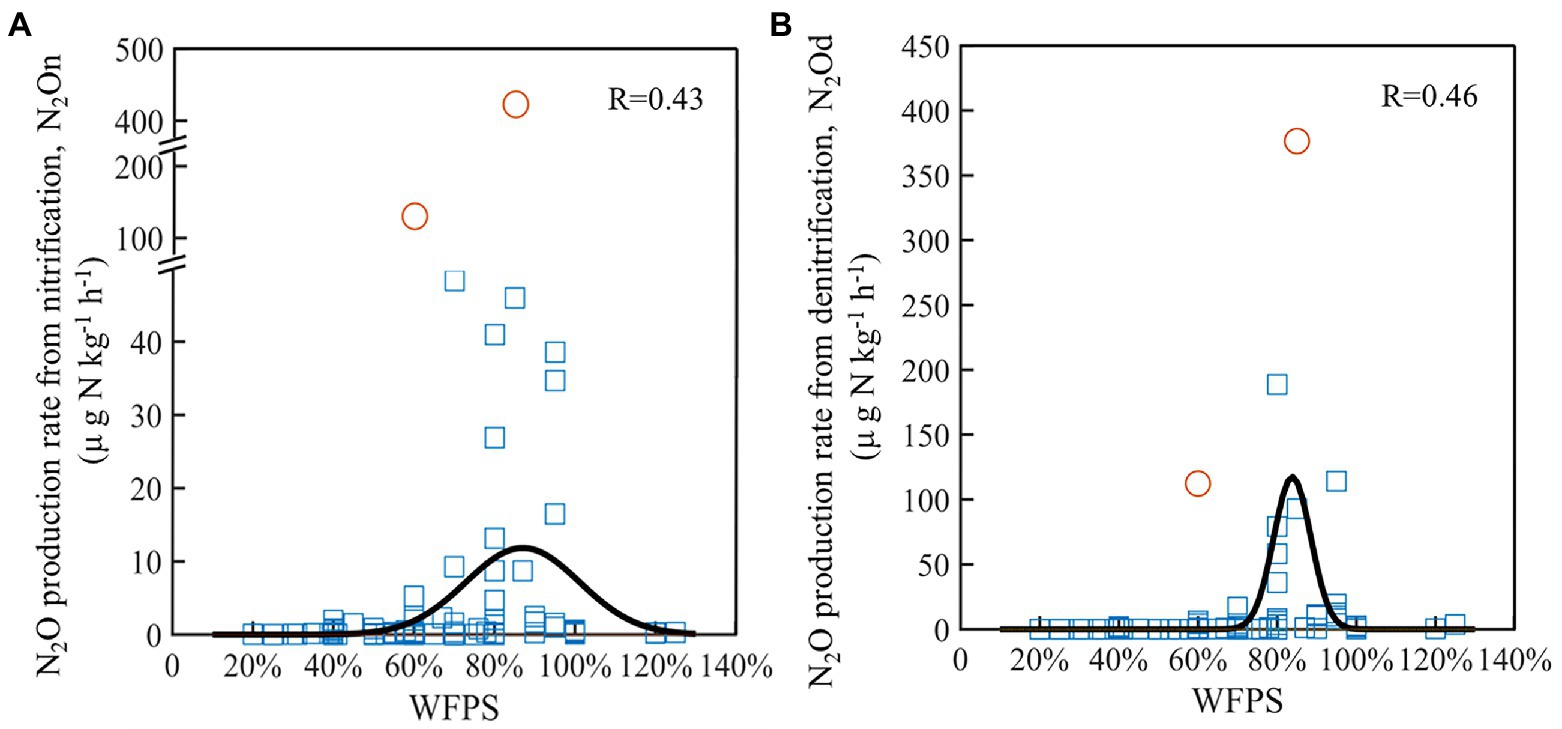
Figure 6. Changes in N2O production rates from nitrification (A) and denitrification (B) under different WFPS across agricultural soils. The black lines were the fitted curves using Gaussian function after excluding the abnormal values (the circles).
4. Discussion
4.1. Contributions of nitrification and denitrification to nitrous oxide production
Both laboratory incubation and literature synthesis showed that nitrification and denitrification dominated N2O production under low and high moisture conditions, respectively. Under high moisture conditions as soil oxygen availability was constrained, denitrification outcompeted nitrification as the main source of N2O production (Smith, 2017; Song et al., 2019; Chang et al., 2022), which was aligned with other experiments (Pihlatie et al., 2004; Friedl et al., 2021). The dominant pathway of N2O production switched between 60 and 70% WFPS (Figure 5), depending on soil properties and climatic conditions. For instance, the thresholds for SZ and LC soil were 70 and 60% WFPS (Figure 3), respectively. This is because the SOC content was higher in the LC soil (19.82 g kg−1) than in the SZ soil (10.93 g kg−1), stimulating N2O production by promoting denitrification process (Ruser et al., 2006; Chantigny et al., 2013). Besides, the N2O production rate in the LC soil (1.02 μg N kg−1 h−1) was almost 10 times that in SZ soil (0.1 μg N kg−1 h−1) under 60% WFPS, further indicating the dominating effects of denitrification in the N2O production in the LC soil. The literature synthesis also confirmed that large SOC content increased the contribution of denitrification to N2O production under relatively low soil moisture content (Supplementary Figure S4B). Besides SOC, other factors such as BD, NH4+ and NO3− concentrations, and especially incubation temperature, also modulated the contributions of nitrification and denitrification to N2O production (Table 1), which might explain why the contribution proportions between nitrification and denitrification varied significantly among different soils even though the soil moisture status were similar (Figure 5).
Accurately determining the contributions of nitrification and denitrification to N2O production is crucial to evaluate N2O emissions from agricultural soils (Zhu et al., 2013). Currently, different approaches were used to quantify these contributions, including 15N site preference (Thilakarathna and Hernandez-Ramirez, 2021), acetylene inhibition (Pihlatie et al., 2004), and 15N tracing techniques (Friedl et al., 2021). The applications of these approaches often caused large discrepancies in quantifying and under different moisture conditions (Butterbach-Bahl et al., 2013), and likely resulted in different contribution proportions even though the experimental setup and the operating conditions were the same (Zhu et al., 2013). Therefore, a careful comparison among different approaches and developing a guideline or protocol for using these approaches merit further investigations. Although certain factors such as pH value and N concentrations exerted insignificant impacts on the contribution of different pathways to N2O production (Table 1), their integrative impacts remain unclear (Hu et al., 2015). In addition, factors such as moisture and temperature, often changed synchronously in fields (Song et al., 2018), and studying their integrative impacts will significantly improve our understanding of N2O emission dynamics and facilitate N2O abatement (Mathieu et al., 2006).
4.2. Nitrous oxide production rates of nitrification and denitrification
Both laboratory study and literature synthesis validated the hypothesis that the rates of N2O production from both nitrification and denitrification first increased and then decreased as soil moisture increased (Figures 4, 6). The relationships between N2O production rate and moisture content followed the classic hole-in-pipe model (Davidson et al., 2000), though the rates changed with soil properties (Figure 4). For instance, the LC soil produced generally larger N2Od than the SZ soil, since it contained more NO3− and SOC, which stimulated N2O production from denitrification under high moisture content (Smith, 2017). By comparison, the two soils exhibited approximate N2On due to the similar NH4+ concentrations. The literature synthesis further confirmed that NO3− and NH4+ were the two most important factors to determine N2O production rates (Supplementary Table S3). Interestingly, NO3− concentration was the most powerful driver to explain the changes in N2O derived from nitrification, although its explaining power was close to that of NH4+ concentration. This result might be caused by the large N2O production rates from nitrification under high NO3− concentrations and large soil moisture contents (Supplementary Figure S5) and warrant further investigations. However, the rates of N2Od and N2On depended on not only the above factors but also moisture content, and their interactions control N2O emission from soils (Zhu et al., 2013). Therefore, higher substrate concentration unnecessarily resulted in larger N2O emissions, as being observed in many laboratory and field experiments (Senbayram et al., 2012; Liu et al., 2018).
In contrast to the first increased and then decreased N2O production rates in response to increase in soil moisture content from the laboratory incubation in this study, the studies in the collected literatures presented divergent consequences among different experiments (Supplementary Table S1). Among the 17 collected studies, as moisture increased, only five reported a decline in N2O production rate for nitrification and no study found a decline for denitrification. The underrepresented decline in the rates can be mainly attributed to the insufficient gradients and inadequate levels of moisture content applied in these studies, which commonly used soil moisture containing less than four levels and below 90% WFPS (Supplementary Table S1). Such sparse moisture levels likely did not capture the inflection point of N2O production rate (Barton et al., 2015), while the low moisture condition might not be adequate to capture the turning point (Bateman and Baggs, 2005; Liu et al., 2016). Therefore, N2O emission under relatively high moisture conditions with sufficient moisture treatments deserves further investigations. The interactions of soil moisture with other factors such as SOC content (Qin et al., 2017), nutrient availability (Senbayram et al., 2012), and pH value (Zhang et al., 2015) together determine the relationship between N2O emission rates and moisture contents (Zhu et al., 2020).
4.3. Implications and looking forward
Both laboratory study and literature synthesis illustrated that N2O emissions declined as moisture content exceeded certain threshold. Current models using linear or exponential relationships between N2O production rate and moisture content could significantly overestimate N2O emissions from agricultural systems (Yue et al., 2019; Wang et al., 2021), especially as the intensive irrigation and extreme rainfall are projected to increase under climate change scenarios (Smith et al., 2017). Therefore, comprehensive relationships that can capture the first increased and then decreased N2O production rates in response to elevated soil moisture content are required. However, the large variances in N2O production rates of both nitrification and denitrification among different studies induce great challenges to develop such a relationship. One potential breakthrough can be to quantify this relationship for different types of soils by incorporating intense moisture treatments similar to this study. Meanwhile, additional experiments are required to quantify the impacts of other key factors, such as temperature, NO3− and NH4+ concentrations and their interactions, on the relationship. Once sufficient data measured using the same experimental protocol are collected, it will be possible to derive quantitative relationships between N2O production rate and moisture content across different soils by using a general function, such as Gaussian function, with parameters depending on key edaphic and climatic drivers (Yan et al., 2018).
5. Conclusion
This study quantified the response of soil N2O production rates from nitrification and denitrification to changes in a broad range of moisture contents using both laboratory study and literature synthesis. The results showed that the N2O production rates of nitrification and denitrification first increased and then decreased as moisture increased for both particular and global agricultural soils, following the classic hole-in-pipe model. The inflection points of moisture content, under which the N2O production rate maximized, for the two pathways occurred between 80 and 95% WFPS, which value depended on incubation temperature and soil properties. By contrast, the switching point of soil moisture from nitrification-dominating to denitrification-dominating occurred between 60 and 70% WFPS. The unidirectional increase in N2O production rates reported in most literatures should be attributed to the insufficient gradients and inadequate levels of moisture content applied in the incubation experiments, and moisture treatments containing broad moisture contents with narrow gradient are required to obtain the comprehensive relationship between soil N2O production rate and moisture content, which is crucial to accurately predict future N2O emission from global agricultural soils in response to climate change.
Data availability statement
The raw data supporting the conclusions of this article will be made available by the authors, without undue reservation.
Author contributions
HW conducted the experiments and wrote the first draft. ZY guided the experiments and completed the final draft. XZ-B, XJ, XS, JZ, and SL helped to improve the manuscript. All authors contributed to the article and approved the submitted version.
Funding
This work was financially supported by the National Key Research and development Program of China (No. 2022YFF1301002), National Natural Science Foundation of China (No. 42077009), and Haihe Laboratory of Sustainable Chemical Transformations.
Acknowledgments
We would like to thank Zengming Chen from Institute of Soil Science, Chinese Academy of Sciences and Yi Cheng from Nanjing Normal University for their selfless support.
Conflict of interest
The authors declare that the research was conducted in the absence of any commercial or financial relationships that could be construed as a potential conflict of interest.
Publisher’s note
All claims expressed in this article are solely those of the authors and do not necessarily represent those of their affiliated organizations, or those of the publisher, the editors and the reviewers. Any product that may be evaluated in this article, or claim that may be made by its manufacturer, is not guaranteed or endorsed by the publisher.
Supplementary material
The Supplementary material for this article can be found online at: https://www.frontiersin.org/articles/10.3389/fmicb.2022.1110151/full#supplementary-material
References
Barton, L., Wolf, B., Rowlings, D., Scheer, C., Kiese, R., Grace, P., et al. (2015). Sampling frequency affects estimates of annual nitrous oxide fluxes. Sci. Rep. 5, 1–9. doi: 10.1038/srep15912
Bateman, E. J., and Baggs, E. M. (2005). Contributions of nitrification and denitrification to N2O emissions from soils at different water-filled pore space. Biol. Fert. Soils 41, 379–388. doi: 10.1007/s00374-005-0858-3
Brooks, P., Stark, J. M., McInteer, B., and Preston, T. (1989). Diffusion method to prepare soil extracts for automated nitrogen-15 analysis. Soil Sci. Soc. Am. J. 53, 1707–1711. doi: 10.2136/sssaj1989.03615995005300060016x
Butterbach-Bahl, K., Baggs, E. M., Dannenmann, M., Kiese, R., and Zechmeister-Boltenstern, S. (2013). Nitrous oxide emissions from soils: how well do we understand the processes and their controls? Philos. Soc. B. 368, 20130122–20130197. doi: 10.1098/rstb.2013.0122
Castellano, M. J., Schmidt, J. P., Kaye, J. P., Walker, C., Graham, C. B., Lin, H., et al. (2010). Hydrological and biogeochemical controls on the timing and magnitude of nitrous oxide flux across an agricultural landscape. Glob. Chang. Biol. 16, 2711–2720. doi: 10.1111/j.1365-2486.2009.02116.x
Chang, B., Yan, Z., Ju, X., Song, X., Li, Y., Li, S., et al. (2022). Quantifying biological processes producing nitrous oxide in soil using a mechanistic model. Biogeochemistry 159, 1–14. doi: 10.1007/s10533-022-00912-0
Chantigny, M. H., Pelster, D. E., Perron, M. H., Rochette, P., Angers, D. A., Parent, L. É., et al. (2013). Nitrous oxide emissions from clayey soils amended with paper sludges and biosolids of separated pig slurry. J. Environ. Qual. 42, 30–39. doi: 10.2134/jeq2012.0196
Chen, Z., Ding, W., Luo, Y., Yu, H., Xu, Y., Müller, C., et al. (2014). Nitrous oxide emissions from cultivated black soil: a case study in Northeast China and global estimates using empirical model. Glob. Biogeochem. Cycle 28, 1311–1326. doi: 10.1002/2014GB004871
Cheng, Y., Wang, J., Wang, S., Zhang, J., and Cai, Z. (2014). Effects of soil moisture on gross N transformations and N2O emission in acid subtropical forest soils. Biol. Fert. Soils 50, 1099–1108. doi: 10.1007/s00374-014-0930-y
Ciarlo, E., Conti, M., Bartoloni, N., and Rubio, G. (2007). The effect of moisture on nitrous oxide emissions from soil and the N2O/(N2O+N2) ratio under laboratory conditions. Biol. Fert. Soils 43, 675–681. doi: 10.1007/s00374-006-0147-9
Congreves, K. A., Phan, T., and Farrell, R. E. (2019). A new look at an old concept: using 15N2O isotopomers to understand the relationship between soil moisture and N2O production pathways. Soil 5, 265–274. doi: 10.5194/soil-5-265-2019
Cui, X., Zhou, F., Ciais, P., Davidson, E. A., Tubiello, F. N., Niu, X., et al. (2021). Global mapping of crop-specific emission factors highlights hotspots of nitrous oxide mitigation. Nat. Food. 2, 886–893. doi: 10.1038/s43016-021-00384-9
Davidson, E. A., Keller, M., Erickson, H. E., Verchot, L. V., and Veldkamp, E. (2000). Testing a conceptual model of soil emissions of nitrous and nitric oxides. Bio Sci. 50, 667–680. doi: 10.1641/0006-3568(2000)050[0667:TACMOS]2.0.CO;2
Dobbie, K. E., and Smith, K. A. (2001). The effects of temperature, water-filled pore space and land use on N2O emissions from an imperfectly drained gleysol. Eur. J. Soil Sci. 52, 667–673. doi: 10.1046/j.1365-2389.2001.00395.x
Friedl, J., Scheer, C., De Rosa, D., Müller, C., Grace, P. R., and Rowlings, D. W. (2021). Sources of nitrous oxide from intensively managed pasture soils: the hole in the pipe. Environ. Res. Lett. 16:065004. doi: 10.1088/1748-9326/abfde7
Gaillard, R. K., Jones, C. D., Ingraham, P., Collier, S., Izaurralde, R. C., Jokela, W., et al. (2018). Underestimation of N2O emissions in a comparison of the DayCent, DNDC, and EPIC models. Ecol. Appl. 28, 694–708. doi: 10.1002/eap.1674
Hall, S., Reyes, L., Huang, W., and Homyak, P. (2018). Wet spots as hotspots: moisture responses of nitric and nitrous oxide emissions from poorly drained agricultural soils. J. Geophys. Res. Biogeo. 123, 3589–3602. doi: 10.1029/2018JG004629
Hu, H., Chen, D., and He, J. (2015). Microbial regulation of terrestrial nitrous oxide formation: understanding the biological pathways for prediction of emission rates. FEMS Microbiol. Rev. 39, 729–749. doi: 10.1093/femsre/fuv021
Ju, X., and Zhang, C. (2017). Nitrogen cycling and environmental impacts in upland agricultural soils in North China: a review. J. Integr. Agric. 16, 2848–2862. doi: 10.1016/S2095-3119(17)61743-X
Kuang, W., Gao, X., Tenuta, M., Gui, D., and Zeng, F. (2019). Relationship between soil profile accumulation and surface emission of N2O: effects of soil moisture and fertilizer nitrogen. Biol. Fert. Soils 55, 97–107. doi: 10.1007/s00374-018-01337-4
Li, C., Aber, J., Stange, F., Butterbach-Bahl, K., and Papen, H. (2000). A process-oriented model of N2O and NO emissions from forest soils: 1 Model development. J. Geophys. Res. Atmos. 105, 4369–4384. doi: 10.1029/1999JD900949
Li, S., Liu, X., Yue, F., Yan, Z., Wang, T., Li, S., et al. (2022). Nitrogen dynamics in the critical zones of China. Prog. Phys. Geogr. 46, 869–888. doi: 10.1177/03091333221114732
Liu, H., Ding, Y., Zhang, Q., Liu, X., Xu, J., Li, Y., et al. (2018). Heterotrophic nitrification and denitrification are the main sources of nitrous oxide in two paddy soils. Plant Soil 445, 39–53. doi: 10.1007/s11104-018-3860-x
Liu, R., Hayden, H. L., Suter, H., Hu, H., Lam, S. K., He, J., et al. (2016). The effect of temperature and moisture on the source of N2O and contributions from ammonia oxidizers in an agricultural soil. Biol. Fert. Soils 53, 141–152. doi: 10.1007/s00374-016-1167-8
Mathieu, O., Hénault, C., Lévêque, J., Baujard, E., Milloux, M. J., and Andreux, F. (2006). Quantifying the contribution of nitrification and denitrification to the nitrous oxide flux using 15N tracers. Environ. Pollut. 144, 933–940. doi: 10.1016/j.envpol.2006.02.005
Parton, W. J., Mosier, A. R., Ojima, D. S., Valentine, D. W., Schimel, D. S., Weier, K., et al. (1996). Generalized model for N2 and N2O production from nitrification and denitrification. Glob. Biogeochem. Cycle 10, 401–412. doi: 10.1029/96gb01455
Pihlatie, M., Syvasalo, E., Simojoki, A., Esala, M., and Regina, K. (2004). Contribution of nitrification and denitrification to N2O production in peat, clay and loamy sand soils under different soil moisture conditions. Nutr. Cycl. Agroecosystems 70, 135–141. doi: 10.1023/B:FRES.0000048475.81211.3c
Qin, S., Hu, C., Clough, T. J., Luo, J., Oenema, O., and Zhou, S. (2017). Irrigation of DOC-rich liquid promotes potential denitrification rate and decreases N2O/(N2O+N2) product ratio in a 0–2 m soil profile. Soil Biol. Biochem. 106, 1–8. doi: 10.1016/j.soilbio.2016.12.001
Qin, H., Wang, D., Xing, X., Tang, Y., Wei, X., Chen, X., et al. (2021). A few key nirK-and nosZ-denitrifier taxa play a dominant role in moisture-enhanced N2O emissions in acidic paddy soil. Geoderma 385:114917. doi: 10.1016/j.geoderma.2020.114917
Reay, D. S., Davidson, E. A., Smith, K. A., Smith, P., Melillo, J. M., Dentener, F., et al. (2012). Global agriculture and nitrous oxide emissions. Nat. Clim. Chang. 2, 410–416. doi: 10.1038/nclimate1458
Reichstein, M., Bahn, M., Ciais, P., Frank, D., Mahecha, M. D., Seneviratne, S. I., et al. (2013). Climate extremes and the carbon cycle. Nature 500, 287–295. doi: 10.1038/nature12350
Ruser, R., Flessa, H., Russow, R., Schmidt, G., Buegger, F., and Munch, J. C. (2006). Emission of N2O, N2 and CO2 from soil fertilized with nitrate: effect of compaction, soil moisture and rewetting. Soil Biol. Biochem. 38, 263–274. doi: 10.1016/j.soilbio.2005.05.005
Schaufler, G., Kitzler, B., Schindlbacher, A., Skiba, U., Sutton, M., and Zechmeister-Boltenstern, S. (2010). Greenhouse gas emissions from European soils under different land use: effects of soil moisture and temperature. Eur. J. Soil Sci. 61, 683–696. doi: 10.1111/j.1365-2389.2010.01277.x
Senbayram, M., Chen, R., Budai, A., Bakken, L., and Dittert, K. (2012). N2O emission and the N2O/(N2O + N2) product ratio of denitrification as controlled by available carbon substrates and nitrate concentrations. Agric. Ecosyst. Environ. 147, 4–12. doi: 10.1016/j.agee.2011.06.022
Siebert, S., Kummu, M., Porkka, M., Döll, P., Ramankutty, N., and Scanlon, B. R. (2015). A global data set of the extent of irrigated land from 1900 to 2005. Hydrol. Earth Syst. Sci. 19, 1521–1545. doi: 10.5194/hess-19-1521-2015
Smith, K. A. (2017). Changing views of nitrous oxide emissions from agricultural soil: key controlling processes and assessment at different spatial scales. Eur. J. Soil Sci. 68, 137–155. doi: 10.1111/ejss.12409
Smith, A. P., Bond-Lamberty, B., Benscoter, B. W., Tfaily, M. M., Hinkle, C. R., Liu, C., et al. (2017). Shifts in pore connectivity from precipitation versus groundwater rewetting increases soil carbon loss after drought. Nat. Commun. 8:1335. doi: 10.1038/s41467-017-01320-x
Song, X., Ju, X., Topp, C. F. E., and Rees, R. M. (2019). Oxygen regulates nitrous oxide production directly in agricultural soils. Environ. Sci. Technol. 53, 12539–12547. doi: 10.1021/acs.est.9b03089
Song, X., Liu, M., Ju, X., Gao, B., Su, F., Chen, X., et al. (2018). Nitrous oxide emissions increase exponentially when optimum nitrogen fertilizer rates are exceeded in the North China plain. Environ. Sci. Technol. 52, 12504–12513. doi: 10.1021/acs.est.8b03931
Stevens, R., Laughlin, R., Burns, L., Arah, J., and Hood, R. (1997). Measuring the contributions of nitrification and denitrification to the flux of nitrous oxide from soil. Soil Biol. Biochem. 29, 139–151. doi: 10.1016/S0038-0717(96)00303-3
Thilakarathna, S. K., and Hernandez-Ramirez, G. (2021). Primings of soil organic matter and denitrification mediate the effects of moisture on nitrous oxide production. Soil Biol. Biochem. 155:108166. doi: 10.1016/j.soilbio.2021.108166
Tian, H., Xu, R., Canadell, J. G., Thompson, R. L., Winiwarter, W., Suntharalingam, P., et al. (2020). A comprehensive quantification of global nitrous oxide sources and sinks. Nature 586, 248–256. doi: 10.1038/s41586-020-2780-0
Trost, B., Prochnow, A., Drastig, K., Meyer-Aurich, A., Ellmer, F., and Baumecker, M. (2013). Irrigation, soil organic carbon and N2O emissions: A review. Agron. Sustain. Dev. 33, 733–749. doi: 10.1007/s13593-013-0134-0
Wang, C., Amon, B., Schulz, K., and Mehdi, B. (2021). Factors that influence nitrous oxide emissions from agricultural soils as well as their representation in simulation models: a review. Agronomy 11:770. doi: 10.3390/agronomy11040770
Yan, Z., Bond-Lamberty, B., Todd-Brown, K. E., Bailey, V. L., Li, S., Liu, C., et al. (2018). A moisture function of soil heterotrophic respiration that incorporates microscale processes. Nat. Commun. 9:2562. doi: 10.1038/s41467-018-04971-6
Yue, Q., Cheng, K., Ogle, S., Hillier, J., Smith, P., Abdalla, M., et al. (2019). Evaluation of four modelling approaches to estimate nitrous oxide emissions in China’s cropland. Sci. Total Environ. 652, 1279–1289. doi: 10.1016/j.scitotenv.2018.10.336
Zhang, J., Müller, C., and Cai, Z. (2015). Heterotrophic nitrification of organic N and its contribution to nitrous oxide emissions in soils. Soil Biol. Biochem. 84, 199–209. doi: 10.1016/j.soilbio.2015.02.028
Zhu, X., Burger, M., Doane, T. A., and Horwath, W. R. (2013). Ammonia oxidation pathways and nitrifier denitrification are significant sources of N2O and NO under low oxygen availability. Proc. Natl. Acad. Sci. U. S. A. 110, 6328–6333. doi: 10.1073/pnas.1219993110
Keywords: nitrous oxide, soil moisture, nitrification, denitrification, 15 N-labeled technique
Citation: Wang H, Yan Z, Ju X, Song X, Zhang J, Li S and Zhu-Barker X (2023) Quantifying nitrous oxide production rates from nitrification and denitrification under various moisture conditions in agricultural soils: Laboratory study and literature synthesis. Front. Microbiol. 13:1110151. doi: 10.3389/fmicb.2022.1110151
Edited by:
Yong Li, Zhejiang University, ChinaReviewed by:
Pengpeng Duan, Institute of Subtropical Agriculture (CAS), ChinaXiuzhen Shi, Fujian Normal University, China
Copyright © 2023 Wang, Yan, Ju, Song, Zhang, Li and Zhu-Barker. This is an open-access article distributed under the terms of the Creative Commons Attribution License (CC BY). The use, distribution or reproduction in other forums is permitted, provided the original author(s) and the copyright owner(s) are credited and that the original publication in this journal is cited, in accordance with accepted academic practice. No use, distribution or reproduction is permitted which does not comply with these terms.
*Correspondence: Zhifeng Yan, ✉ yanzf17@tju.edu.cn