 Tobias Busche1,2*
 Hana Dostálová3
 Lenka Rucká3
 Jiří Holátko3
 Ivan Barvík4
 Václav Štěpánek3
 Miroslav Pátek3*
 Jörn Kalinowski1
- 1Microbial Genomics and Biotechnology, Center for Biotechnology, Bielefeld University, Bielefeld, Germany
- 2Medical School East Westphalia-Lippe, Bielefeld University, Bielefeld, Germany
- 3Institute of Microbiology, Academy of Sciences of the Czech Republic (ASCR), Prague, Czechia
- 4Faculty of Mathematics and Physics, Institute of Physics, Charles University, Prague, Czechia
The sigma H (σΗ) and sigma E (σE) subunits of Corynebacterium glutamicum RNA polymerase belong to Group 4 of sigma factors, also called extracytoplasmic function (ECF) sigma factors. Genes of the C. glutamicum σΗ regulon that are involved in heat and oxidative stress response have already been defined, whereas the genes of the σE regulon, which is involved in cell surface stress response, have not been explored until now. Using the C. glutamicum RES167 strain and its derivative C. glutamicum ΔcseE with a deletion in the anti-σΕ gene, differential gene expression was analyzed by RNA sequencing. We found 296 upregulated and 398 downregulated genes in C. glutamicum ΔcseE compared to C. glutamicum RES167. To confirm the functional link between σΕ and the corresponding promoters, we tested selected promoters using the in vivo two-plasmid system with gfpuv as a reporter gene and by in vitro transcription. Analyses with RNAP+σΗ and RNAP+σΕ, which were previously shown to recognize similar promoters, proved that the σΗ and σE regulons significantly overlap. The σE-controlled genes were found to be involved for example in protein quality control (dnaK, dnaJ2, clpB, and clpC), the regulation of Clp proteases (clgR), and membrane integrity maintenance. The single-promoter analyses with σΗ and σΕ revealed that there are two groups of promoters: those which are exclusively σΗ-specific, and the other group of promoters, which are σΗ/σE-dependent. No exclusively σE-dependent promoter was detected. We defined the consensus sequences of exclusively σΗ-regulated promotors to be −35 GGAAt and − 10 GTT and σΗ/σE-regulated promoters to be −35 GGAAC and − 10 cGTT. Fifteen genes were found to belong to the σΗ/σΕ regulon. Homology modeling showed that there is a specific interaction between Met170 in σΗ and the nucleotides −31 and − 30 within the non-coding strand (AT or CT) of the σΗ-dependent promoters. In σE, Arg185 was found to interact with the nucleotides GA at the same positions in the σE-dependent promoters.
Introduction
Most bacterial genes are transcribed by the RNA polymerase (RNAP) holoenzyme that includes a primary sigma subunit (σ factor referred to as RpoD/σ70 in Escherichia coli and SigA/σA in many other bacteria) that is responsible for the transcription of housekeeping genes. Transcription of the genes involved in starvation, stationary phase, and general stress response largely depends on the presence of the primary-like σ factor usually named σΒ in Gram-positive bacteria. The stress-responsive genes, which are active during various adverse environmental conditions, are in many cases transcribed by RNAP with an ECF (extracytoplasmic function) sigma factor. This group of σ factors is the most numerous and variable. The ECF sigma factors σH and σE are responsible for the transcription of large gene groups in Actinobacteria. These σ factors share some significant features in streptomycetes, mycobacteria, and corynebacteria, and probably also in rhodococci (Blumenstein et al., 2022; Štěpánek et al., 2022).
σΗ controls a wide range of stress response genes in Mycobacterium tuberculosis, which has a portfolio of 10 ECF sigma factors. These σΗ-dependent genes are involved in oxidative and heat stress response, the repair of DNA damage, recovery of ribosome function, sulfur transport, and synthesis of sulfur-containing amino acids (Sharp et al., 2016). Moreover, it is required for full virulence in mice and primates (Mehra et al., 2012). In Streptomyces coelicolor, SigR (named R according to the redox stress), encoded by an ortholog of M. tuberculosis SigH, is responsible for many stress response functions, e.g., thiol homeostasis (redox control), antibiotic stress response, sulfur metabolism, ribosome modulation, energy metabolism, DNA repair, and protein turnover (Park et al., 2019). σΗ in C. glutamicum, another member of the Actinobacteria phylum, controls similar functions: heat and oxidative stress response and DNA repair (Ehira et al., 2009; Busche et al., 2012; Toyoda et al., 2015). Genes regulated by σΗ were analyzed by using the sigH-overexpressing C. glutamicum R strain and sigH deletion strain. In total, 37 genes which were downregulated in the sigH-deletion strain and/or upregulated in sigH-overexpressing strain were considered to be under the control of σΗ (Ehira et al., 2009). Ten transcriptional start sites (TSSs) were determined by 5’RACE PCR, and the σΗ-dependent promoters were localized. Using the sequences of previously determined C. glutamicum R σΗ-controlled promoters, a consensus sequence was deduced: −35 gGGAAta and −10 t/cGTTgaa (Ehira et al., 2009). The set of σΗ-dependent promoters was widened in a study of C. glutamicum ATCC 13032 in which we used another approach: deletion of the gene encoding the supposed σΗ-specific anti-σ factor RshA (Busche et al., 2012). We proved that rshA deletion enhanced σΗ activity without influencing stress. In total, 45 σΗ-controlled promoters which were found in the two studies were analyzed and the consensus sequence −35 GGAAT/C and − 10 GTT was derived (Ehira et al., 2009; Busche et al., 2012). Considering the extent of the σΗ (in M. tuberculosis and C. glutamicum) and σR (in S. coelicolor) regulatory networks and the variety of their functions, these σ factors can be considered to be global regulators.
Another M. tuberculosis ECF sigma factor, σE, forms a regulatory network that has a role in heat, cell surface, and oxidative stress response. It is also essential for various virulence functions (Manganelli et al., 2001; Manganelli and Provvedi, 2010). The σE regulatory network in M. tuberculosis is controlled by a two-component system which involves MprA and MprB transcription factors (Manganelli and Provvedi, 2010).
A large number of genes of the S. coelicolor σE regulon were defined, which were directly driven from experimentally proven or deduced σE-dependent promoters (Tran et al., 2019). Expression of these genes is induced by various antibiotics which affect the cell envelope as a target. More than half of the genes of the regulon encode proteins implicated in cell envelope function. This stress response is coordinated by the two-component systems VanRS and CseBC, in addition to σE (Tran et al., 2019).
Recently, a basic regulatory network operated by σ factors was described in Rhodococcus erythropolis, another member of the Mycolata group, closely related to C. glutamicum (Štěpánek et al., 2022). The genes encoding four σ factors (σB, σE, σH, and σJ) were found to be most likely transcribed by either RNAP+σE or σH.
The σE-deficient C. glutamicum strain was shown to be sensitive to heat, SDS, EDTA, and lysozyme (Park et al., 2008). Expression of the sigE gene is low during the exponential growth phase and increases after heat and cell surface stress (Park et al., 2008) and under growth limitation (Brockmann-Gretza and Kalinowski, 2006). We have shown that the C. glutamicum genes dnaK (chaperone), dnaJ2 (chaperone), and clgR (transcriptional regulator) are under the control of σE (Dostálová et al., 2017). In addition, the gene encoding alternative sigma factor σΒ, which is involved in responses to various stress conditions, is also regulated by σE (Šilar et al., 2016). The deduced key sequences of these σΕ-dependent promoters (GGAAC–N18-19–GTT) were found to be closely similar to the consensus of C. glutamicum σΗ-dependent promoters (GGAAT–N18-19–GTT; Ehira et al., 2009; Busche et al., 2012) and identical to the consensus of the mycobacterial σE-dependent promoters (Rodrigue et al., 2006). We showed in previous studies that promoters of all these C. glutamicum genes are not only recognized by σE, but also by σΗ (Šilar et al., 2016; Dostálová et al., 2017). These results suggested that there is a certain overlap in the promoter recognition specificity of σΗand σE and that the two corresponding regulons probably overlap to some extent. However, the principal roles of σΗ and σE appear to be different in C. glutamicum: σΗ mainly directs the heat and oxidative stress response, whereas σE activity is especially associated with the cell envelope stress response (Park et al., 2008). The sigE gene is co-transcribed with the σE-specific anti-σΕ gene cseE. The interaction of σE and CseE was proven by in vitro assay (Park et al., 2008). No further study of CseE was performed and the mechanism of σE release from the inhibition is therefore not known. The protein CseE is homologous to the cognate anti-sigma factor of σΗ, named RshA in C. glutamicum. Both contain a zinc-associated motif HxxxCxxC that is typical for a class of anti-sigma factors. The structure of this motif was discovered in the crystal structure of the anti-sigma factor RslA in M. tuberculosis (Thakur et al., 2010). We may therefore consider the CseE protein as an anti-sigma factor.
We have decided to uncover σE-dependent genes by RNA sequencing analysis of the cseE deletion strain, C. glutamicum ΔcseE. Since several genes were shown to depend both on σΕ and σΗ (Šilar et al., 2016; Dostálová et al., 2017), we also used σΗ to compare the functions of σΕ and σΗ using in vivo and in vitro assays. The main aim was to define the recognition overlap of σΗ and σE regulons, reveal the differences between the specific promoter sequences and recognition specificities of the two σ factors, and make conclusions about the roles of σΕ and σΗ in various stress responses.
Materials and methods
Bacterial strains, plasmids, oligonucleotides, and growth conditions
Escherichia coli DH5α (Hanahan, 1985) was cultivated aerobically in 500-ml flasks containing 70–100 ml of 2xYT medium (Green and Sambrook, 2012) at 37°C. C. glutamicum RES167 (Tauch et al., 2002) and C. glutamicum RES167ΔcseE (named C. glutamicum ΔcseE here) were cultivated under the same conditions, but at 30°C. The defined chromosomal deletion ΔcseE in the C. glutamicum chromosome was constructed using the sacB gene as a conditionally lethal marker and a double-crossover event as described previously (Busche et al., 2012). The plasmid vectors used are listed in Table 1. The sequences of the oligonucleotides for PCR and DNA cloning are shown in Supplementary Table S1.
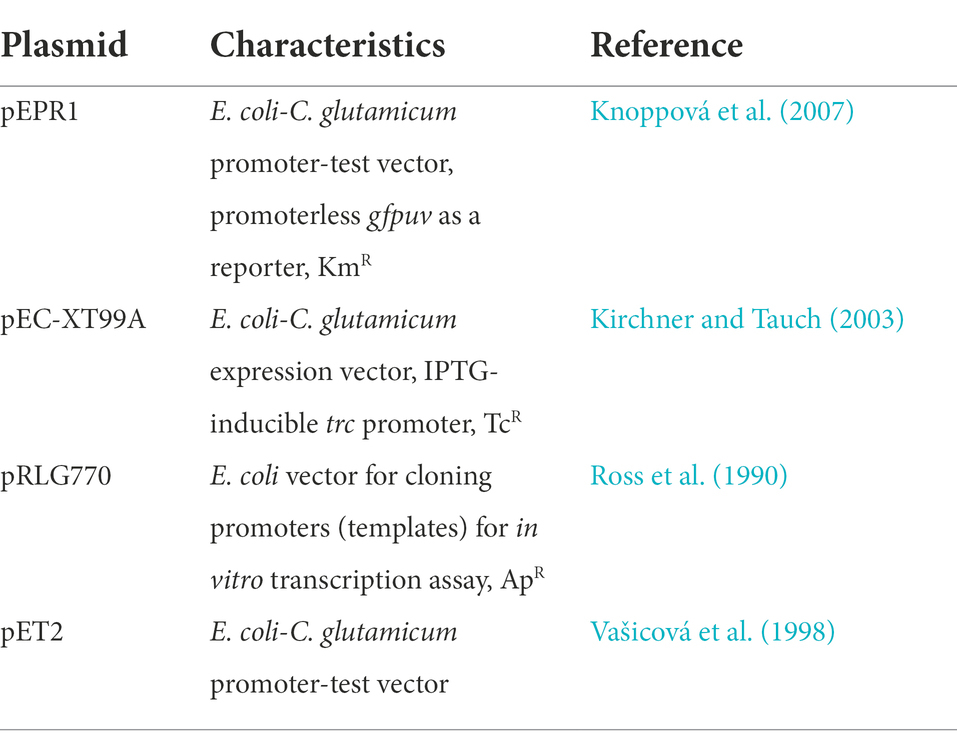
Table 1. Plasmid vectors used.
DNA manipulations
DNA isolation, PCR, cutting with restriction enzymes, ligation, and transformation of E. coli were done using the standard techniques (Green and Sambrook, 2012). Mutations in sigH and sigE were constructed with a Q5 Site-Directed Mutagenesis kit (New England BioLabs Inc.).
Primer extension analysis
Non-radioactive primer extension (PEX) analysis was carried out as described previously (Busche et al., 2012). C. glutamicum cells were cultivated in 2xYT medium at 30°C and disrupted with glass beads and a FastPrep FP120 (BIO101) disintegrator. The cell debris was removed by centrifugation, and total RNA was isolated from the extract using a High Pure RNA Isolation Kit (Roche Diagnostics). The primer extension analysis was essentially done using SuperScript III transcriptase (Invitrogen, Carlsbad, CA) with 30 μg RNA and 5 pmol Cy-5-labeled primer CM4 complementary to the vector pET2. The synthesized cDNA was run on PAA gel simultaneously with the DNA sequencing products generated with the same labeled primer in an A.L.F. Sequencer (GE Healthcare, Munich, Germany).
RNA isolation, cDNA library construction, and sequencing
The whole procedure was done in principle according to the protocols used previously (Albersmeier et al., 2017; Wittchen et al., 2018; Dostálová et al., 2019) with a few modifications. Corynebacterium glutamicum RES167 or C. glutamicum ∆cseE was cultivated in minimal medium CGXII (Keilhauer et al., 1993) supplemented with glucose 2% (w/v) instead of 4% and protocatechuic acid 30 mg/l instead of 0.03 mg/l. The cells were harvested in the exponential growth phase and frozen in liquid nitrogen.
Total RNA was isolated from 3 biological replicates of C. glutamicum cells by a Quick-RNA Miniprep Plus kit (Zymo Research). The samples were treated with DNase (Roche Diagnostics) and RNA was purified with an RNA Clean&Concentrator-5 kit (Zymo Research). Ribosomal rRNA was removed with a Ribo-Zero rRNA Removal Kit for bacteria (Illumina). The purity of RNA was then tested with an Agilent RNA Pico 6,000 kit and an Agilent 2,100 Bioanalyzer (Agilent Technologies). TruSeq Stranded mRNA Sample Preparation guide (Illumina) was then used to construct the cDNA library. The constructed cDNA library was then sequenced with Illumina HiSeq 1,500 using a read length of 70 bases.
Primary 5′-end-specific cDNA library sequencing
A primary 5′-end-specific cDNA library was constructed for sequencing with the aim of defining TSSs using the protocol described previously (Albersmeier et al., 2017; Wittchen et al., 2018) Briefly, rRNA was depleted and the RNA samples were treated with a terminator 5′-phosphate-dependent exonuclease (Illumina) to remove non-primary transcripts.
The primary 5′-triphosphate ends of the primary transcripts were treated with RNA 5′-polyphosphatase to convert them into 5′-mono phosphate ends, and the 5′-adapter was ligated to the produced 5′-ends. Then, reverse transcription with a stem-loop DNA adapter was carried out and the library was amplified. The primary 5′-end cDNA library was then purified and size-selected for fragments approximately 100–1,000 nt in size by gel electrophoresis and quantified. The fragments were finally sequenced with an Illumina MiSeq.
Read processing, mapping, and identification of transcription start sites
Paired-end reads were mapped to the C. glutamicum reference genome sequence accession number BX927147 as described previously (Dostálová et al., 2019). To visualize short read alignments, detect TSSs and analyze differential gene expression, Read Explorer v.2.2 (Hilker et al., 2014, 2016) was used. TSSs were detected as described previously (Wittchen et al., 2018). To detect the real TSSs (+1), the nucleotide was considered to be position +1 if the number of read starts was 10 times higher than at position −1. The false-positives in the candidate dataset of the predicted TSSs that were incorrectly classified automatically were examined and excluded manually.
Differential gene expression analysis
Differential gene expression analysis of C. glutamicum RES167 and ΔcseE was carried out with the whole transcriptome data and ReadXplorer v2.2 (Hilker et al., 2016), including the Bioconductor package DESeq2 (Love et al., 2014). The signal intensity value (a-value) was calculated by the log2 mean of normalized read counts, and the signal intensity ratio (m-value) by log2 fold change. The evaluation of the differential RNA-seq data was done with an adjusted value of p cutoff of p ≤ 0.01 and a signal intensity ratio (m-value) cutoff of ≥1 or ≤ −1.
Genes with upregulated or downregulated expression in C. glutamicum ∆cseE were included in the further analysis (FDR < 0.05, M-value>1 for upregulation, M-value<−1 for downregulation).
In vitro transcription
The in vitro transcription assay was carried out essentially as described previously (Holátko et al., 2012). The promoter fragments (56–70 nt; with the downstream end at position +3 to +6 relative to TSS) cloned in the vector pRLG770 (Ross et al., 1990) were used as the templates (Dostálová et al., 2017). The holo-RNAP was reconstituted from the RNAP core enzyme isolated from C. glutamicum and individual C. glutamicum σ factors isolated as His-tagged recombinant proteins from E. coli as described previously (Holátko et al., 2012). The RNAP core (100 nM) was mixed with the respective σ factor (σA, σB, σE, or σH) in a molar ratio of 1:15 (σA) or 1:30 (σB, σE, and σH) The holo-RNAP was assembled for 10 min at 37°C. The transcription mixture was incubated for 10 min at 37°C. The transcripts labeled with [α-32P]UTP were separated in 5.5% (w/v) polyacrylamide gel. In vitro transcription assays were done 2 or 3 times for each promoter, with essentially the same results.
Promoter activity measurements using a single- and two-plasmid assay
Sigma factors were assigned to individual promoters in vivo using the recently described two-plasmid system for C. glutamicum (Dostálová et al., 2017). In principle σ factors, which were overproduced from the expression vector pEC-XT99A, initiated transcription from the individual promoters. The activity of these promoters was then measured using the reporter gene gfpuv in the promoter-test vector pEPR1 (Dostálová et al., 2017, 2019). The fluorescence of the cell-free extracts was determined with a Safire2 microplate spectrophotometer (Tecan; excitation wavelength, 397 nm; emission wavelength 509 nm). Arbitrary units of the fluorescence intensity of cell extract (AU/mg protein) were normalized to protein concentration, which was determined by the Bradford assay as described previously in detail (Dostálová et al., 2017, 2019). To test the effects of stresses on the activity of promoters, C. glutamicum cells carrying pEPR1 with an analyzed promoter were used in a single-plasmid assay. The cells were cultivated in the same way as for the two-plasmid assay in 2xYT medium and when OD600 reached 1.0 (time point 0), stress (40°C for 1 h, 0.01% (w/v) SDS and 4% (v/v) ethanol, respectively) was applied. Promoter activity was measured as the fluorescence intensity of the reporter protein GFPuv.
Homology modeling and molecular dynamics simulations
The homology models of the σH and σE domains which recognize the −10 and − 35 sequences of the respective promoters were produced by using the Swiss-Model server (Waterhouse et al., 2018). The crystal structures of E. coli σE, PDBid: 4LUP (for −10 element GTC; Campagne et al., 2014) and PDBid: 2H27 (for −35 element GGAAC; Lane and Darst, 2006) were used as templates. The nucleotides within the E. coli σE consensus were replaced to match the consensus for C. glutamicum σH or σE, where necessary. Molecular dynamics simulations were done using the software package AMBER (Salomon-Ferrer et al., 2013) and Linux computer nodes with powerful NVIDIA GPUs that enable the accumulation of 50-ns MD trajectories at 280 K.
Results
Transcriptional pattern of the sigE-cseE-tatB operon
According to the previously published results of RNA sequencing (Albersmeier et al., 2017), the C. glutamicum gene encoding the sigma factor σE (sigE = cg1271) forms an operon with the downstream genes cseE (cg1272, encoding the corresponding anti-σ factor, anti-σΕ) and tatB (cg1273, twin-arginine translocation pathway protein; gene numbers are according to the genome sequence of C. glutamicum GenBank RefSeq BX927147). The sub-operon cseE-tatB was also detected (Albersmeier et al., 2017). We used primer extension (PEX) analysis to determine the respective sigE TSSs. DNA fragments (256 bp upstream of sigE and 227 bp upstream of cseE) were cloned in the vector pET2 and the constructs were used for PEX assay. Total RNA for PEX was isolated from C. glutamicum (pET2 carrying the sigE promoter region) and C. glutamicum (pET2 with-cseE promoter) cells, which were cultivated to the exponential growth phase. Three TSSs were found within the upstream region of sigE (data not shown). Two of them, TSS1 at A and TSS3 at G (Figure 1), were identical to the signals obtained by transcriptome sequencing in two studies (Pfeifer-Sancar et al., 2013; Albersmeier et al., 2017). This confirmed the −10 regions of P1sigE CAAAAT and P3sigE TATAGT. We additionally detected TSS2 at A, which positioned a weaker promoter with the potential −10 element TAATCT an appropriate distance upstream of TSS2. The putative −10 elements CAAAAT (P1sigE), TAATCT (P2sigE), and TATAGT (P3sigE; Figure 1) are similar to the C. glutamicum consensus sequence TANAAT of the σΑ-dependent (housekeeping) genes (Pátek and Nešvera, 2011; Albersmeier et al., 2017). Nevertheless, no TSS was detected, which might suggest the presence of a σΕ-dependent promoter. We therefore supposed that all 3 promoters are σΑ-dependent. The putative −35 regions were not very similar to the already published C. glutamicum − 35 consensus sequence TTGA/CCA (Pátek et al., 2013) or TTGNNN (Albersmeier et al., 2017), but this motif is known to be only weakly conserved in C. glutamicum promoters (Pátek et al., 2013; Albersmeier et al., 2017). Upstream of the cseE gene, PEX analysis revealed TSS2 at position A (Figures 2A,C), which was identical to the nucleotide found by transcriptome sequencing (Pfeifer-Sancar et al., 2013; Albersmeier et al., 2017). In addition, we detected a weak signal of TSS1 at G, which is 7 nt downstream of the appropriate −10 element TATCTT (Figures 2A,C). The signal at this position has also been previously detected by RNA-seq (Pfeifer-Sancar et al., 2013). The −10 hexamer TATCTT of the promoter P1cseE belonging to the weak signal looked again like a typical −10 motif of the σΑ-controlled promoters (Figure 2C). The P2cseE promoter motifs −35 and − 10, GGAAC–N18–GTT (Figure 2C), however, were identical to the sequences of the already described σΗ/σE-dependent promoters (Šilar et al., 2016; Dostálová et al., 2017). The strength of PEX signals corresponding to TSS2 promoted by the σE-dependent P2cseE was analyzed with RNA isolated from C. glutamicum cells afflicted with cell surface stress (addition of SDS). The signal of TSS2 corresponding to the C. glutamicum cells cultivated under standard conditions was weak, whereas the respective peak obtained with the cells cultivated with 0.01% (w/v) SDS was very large (Figure 2B). This is in agreement with the assumption that the P2cseE promoter is σE-dependent and that the role of σE is in cell surface stress response. It is noteworthy that the TSS1 peak corresponding to the transcript driven from the housekeeping promoter P1cseE was also much larger in response to SDS stress (Figure 2B). This suggests that there is a common regulation of cseE transcription from the two promoters, despite them being controlled by different σ factors.
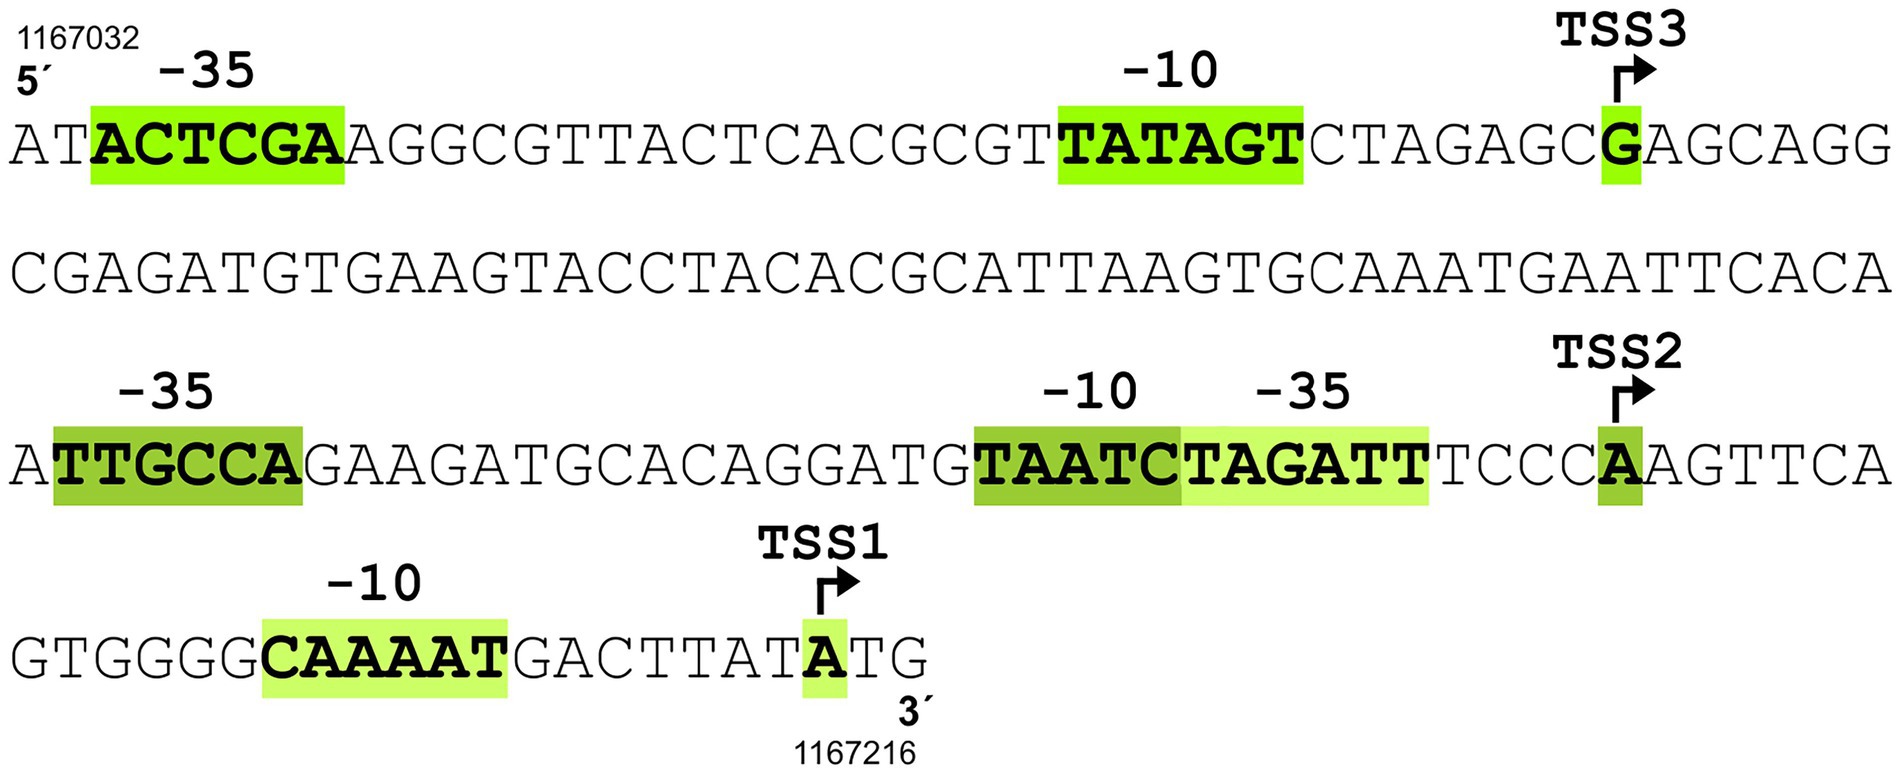
Figure 1. Upstream region of sigE gene containing three promoters (P1sigE, P2sigE, and P3sigE) driving transcription from transcriptional start sites TSS1, TSS2, and TSS3. The TSSs were detected by primer extension analysis. The sequences of the corresponding putative −10 elements CAAAAT (P1sigE), TAATCT (P2sigE), and TATAGT (P3sigE) suggest that all three promoters are controlled by σΑ. Of the three potential −35 hexamers, only TTGCCA belonging to P2sigE conforms to the −35 consensus TTGACA, whereas the other two share little similarity to the consensus. TSS are indicated by bent arrows. Genomic coordinates of the 5′-end and 3′-end of the C. glutamicum ATCC 13032 sequence according to GenBank RefSeq BX927147 are shown.
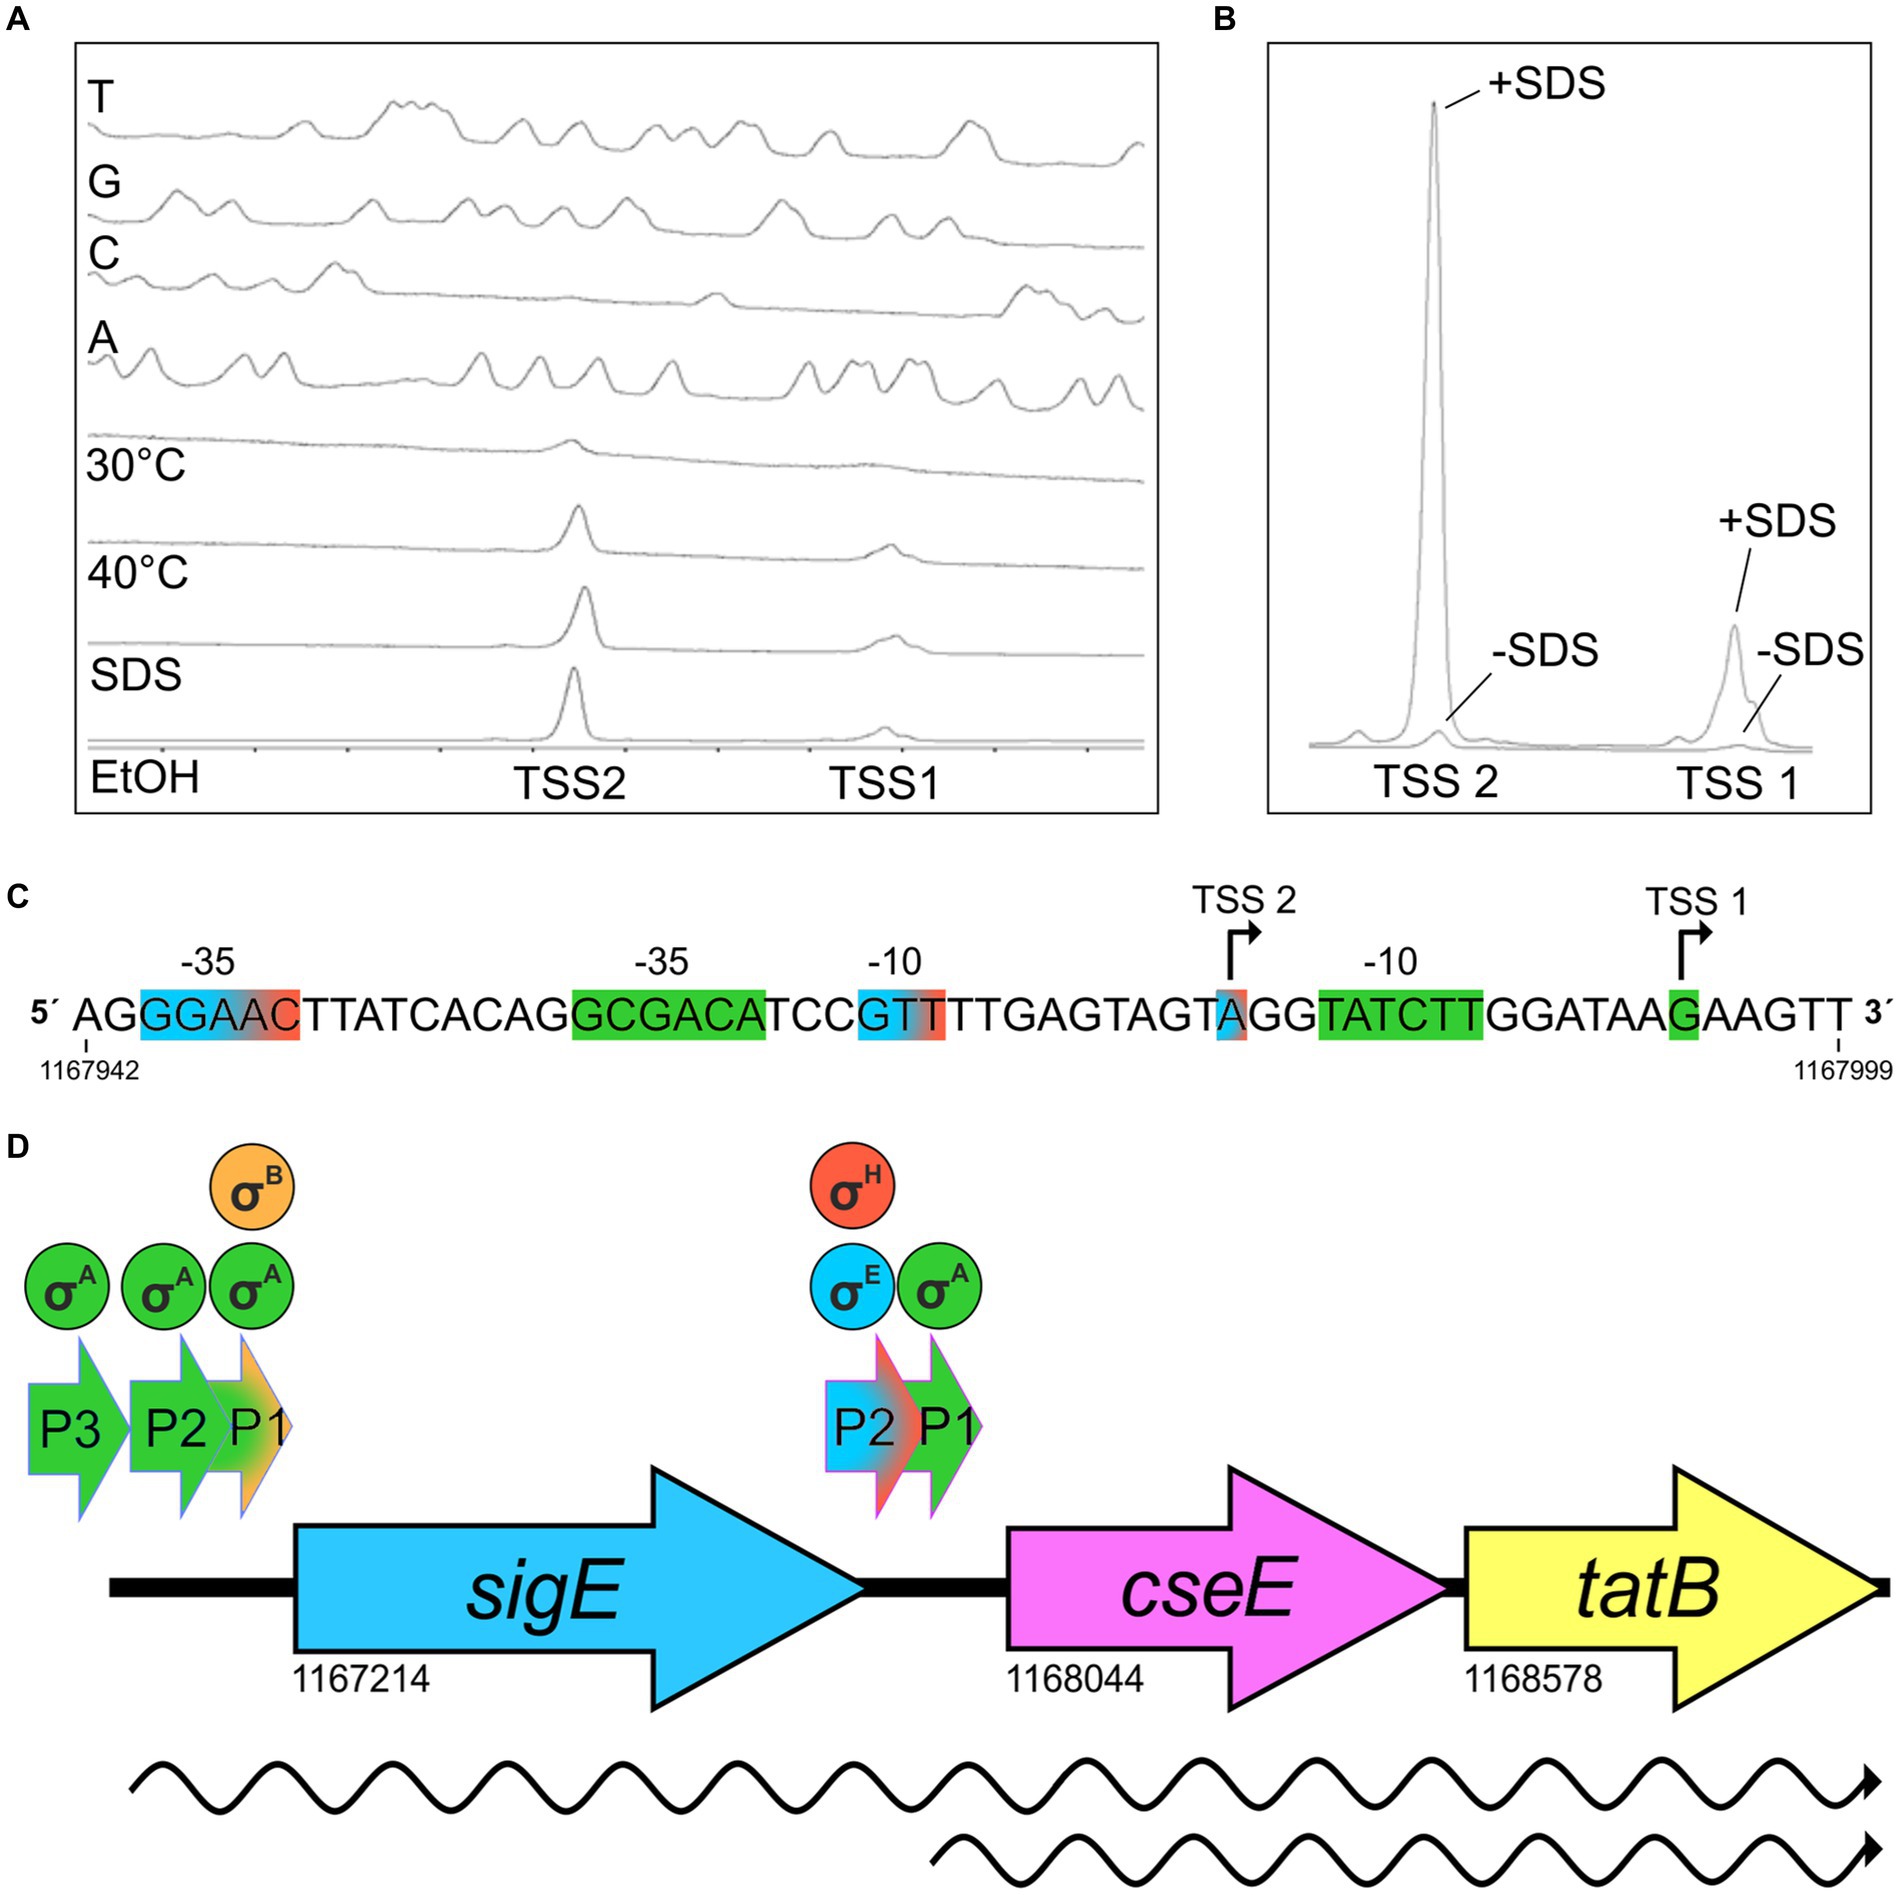
Figure 2. Determination of transcriptional start sites (TSS) of cseE gene by primer extension analysis (PEX), sequence of corresponding promoter region, and structure of the whole sigE-cseE-tatB operon. (A) Determination of cseE transcription start sites by PEX. The bottom peaks represent cDNA synthesized in reverse transcription using RNA from C. glutamicum (pET2PcseE) cultivated at 30°C or with stresses (40°C for 60 min; 0.01% (w/v) SDS; 4% (v/v) ethanol). The peaks (T, G, C, A) represent the products of sequencing reactions carried out with the same fluorescently labeled primer as that used for reverse transcription. The fluorograms are reversed and labeled complementarily to the respective sequences of the coding strand shown (C). (B) The same PEX reaction signals as in 2A (without/with SDS; -SDS/+SDS) shown in absolute size. To compare the strength of the signals, the absolute size of peaks marked -SDS and + SDS are shown. (C) Nucleotide sequence of cseE upstream region. Transcription start sites (TSS) detected by PEX are indicated by bent arrows. The proposed promoter motifs corresponding to the σΑ-controlled TSS1 are highlighted in green, the σH/σΕ-controlled TSS2 in blue/red. Genomic coordinates of the 5′ and 3’ends of the promoter sequence taken from GenBank RefSeq BX927147 are shown. (D) Scheme of sigE-cseE-tatB operon of C. glutamicum and location of promoters and transcripts. The promoters are indicated by short arrows above the operon structure. Transcripts are shown as wavy lines. Sigma factors which are active in transcription from individual promoters are shown in circles above the promoters. The scheme and the genomic coordinates of the initiation codons are based on the C. glutamicum ATCC 13032 genome sequence (GenBank RefSeq BX927147) and results of primer extension analyses.
The effects of the stress conditions on the activities of the main promoters of the operon (P1sigE and P2cseE) were further examined using a transcriptional fusion of these promoters with the gfpuv reporter gene in the promoter-test vector pEPR1 (Figure 3). The strongest effect on P1sigE was found with SDS, and a weaker increase in activity was observed with 4% (v/v) ethanol. The effects of these stresses on P2cseE activity were only weak and thus not completely convincing. (Figure 3). However, strong effects of 40°C, ethanol (Figure 2A), and especially SDS (Figure 2B) on the P2cseE activity were clearly visible in the results of PEX.
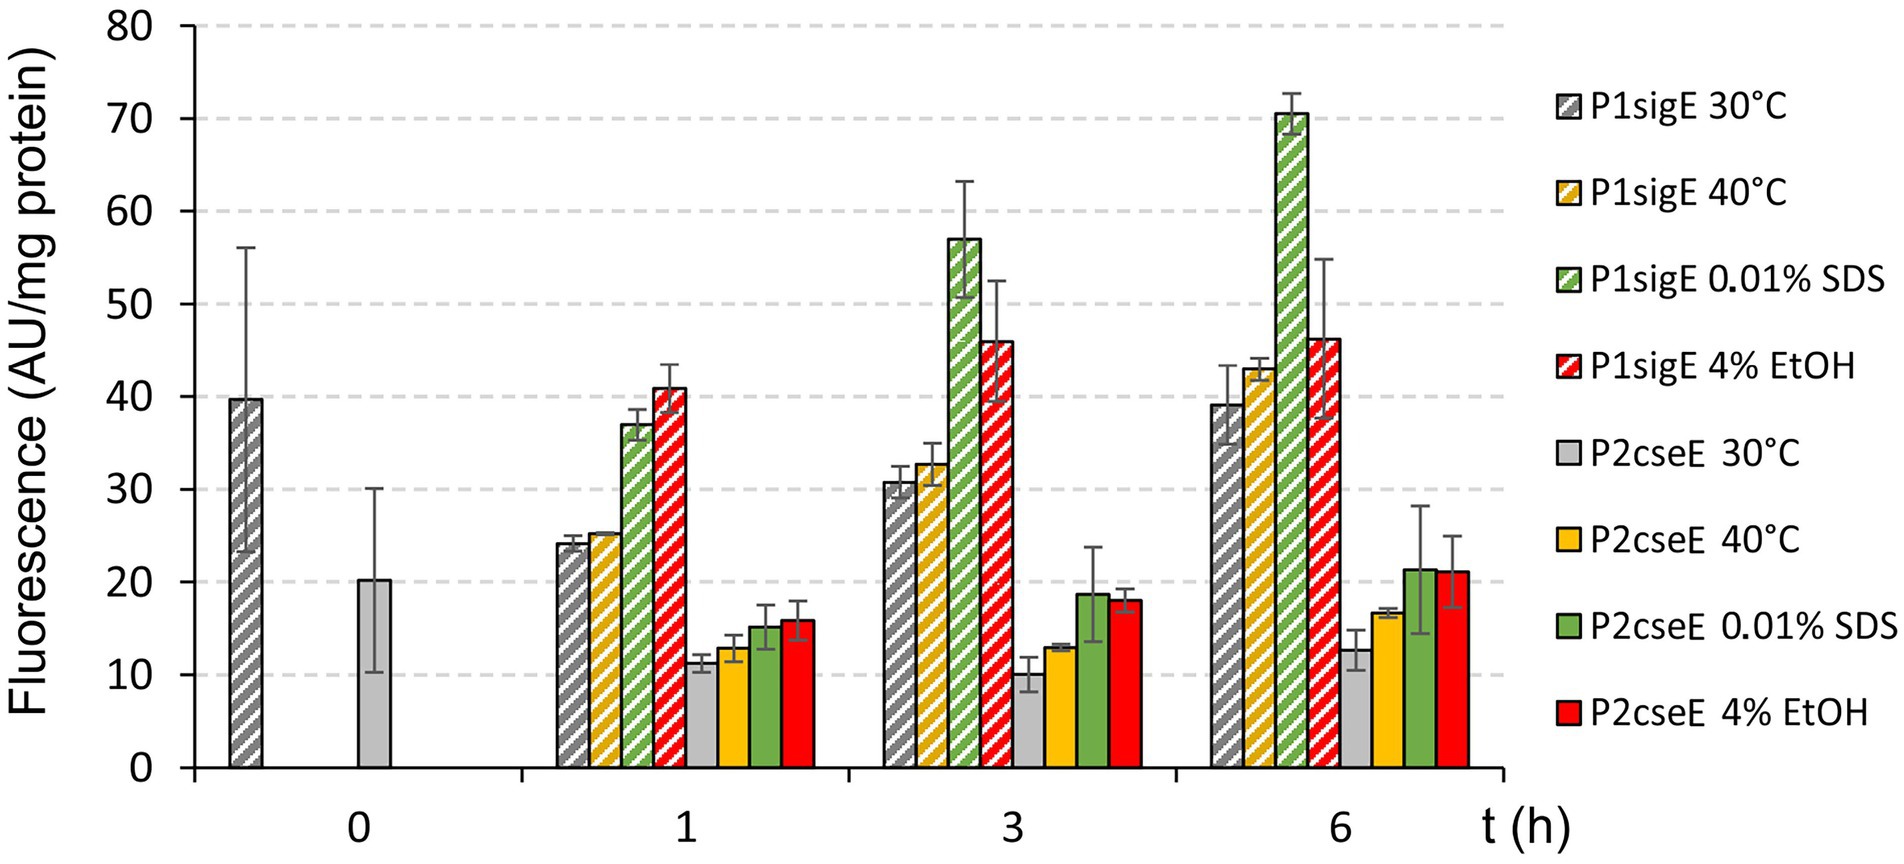
Figure 3. Effects of stresses on activity of P1sigE and P2cseE. The C. glutamicum cells carried the promoter-test vector pEPR1 with the promoter P1sigE or P2cseE. Promoter activity was measured as the GFPuv fluorescence intensity of cell extracts and is shown as bars representing the respective growth/stress conditions. Error bars depict the standard deviations of three biological replicates.
To test the roles of particular σ factors in the recognition of the two strong promoters of the operon by a different method, in vitro transcription assay with P1sigE and P2cseE was carried out using the σΑ, σΒ, σE, and σΗ factors and the promoters cloned in pRLG770. Signals with approximately the same strength were observed with σΑ and σΒ for P1sigE, whereas a strong signal with σE and a weaker signal with σΗ were detected for P2cseE (Figure 4). This result was in agreement with the sequences of the key promoter elements of the tested promoters.
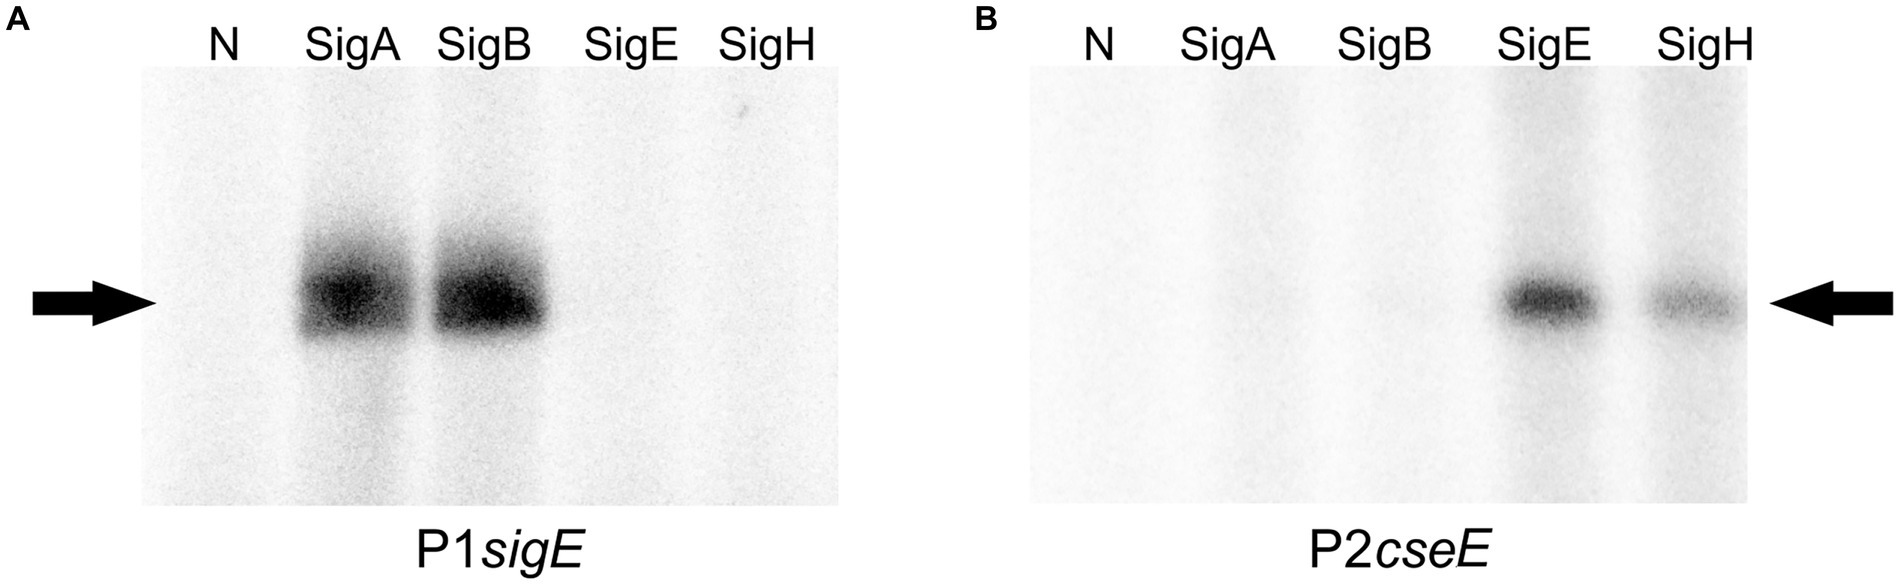
Figure 4. In vitro transcription with P1sigE (A) and P2cseE (B; the key promoters of the operon) used as templates. Individual sigma factors associated with the C. glutamicum RNAP core are shown at the top. N; no sigma factor protein was added to the RNAP core. The specific transcripts are indicated with arrows.
To further test the roles of σE and σΗ in the transcription from P2cseE that was suggested based on the results of in vitro transcription (Figure 4), a two-plasmid assay which was developed to prove interaction between σ factors and promoters in vivo (Dostálová et al., 2017), was carried out. Expression analysis in vivo indicated that P2cseE can drive transcription with σE and a little less also with σΗ (Figure 5). This is in agreement with the result of in vitro transcription analysis.
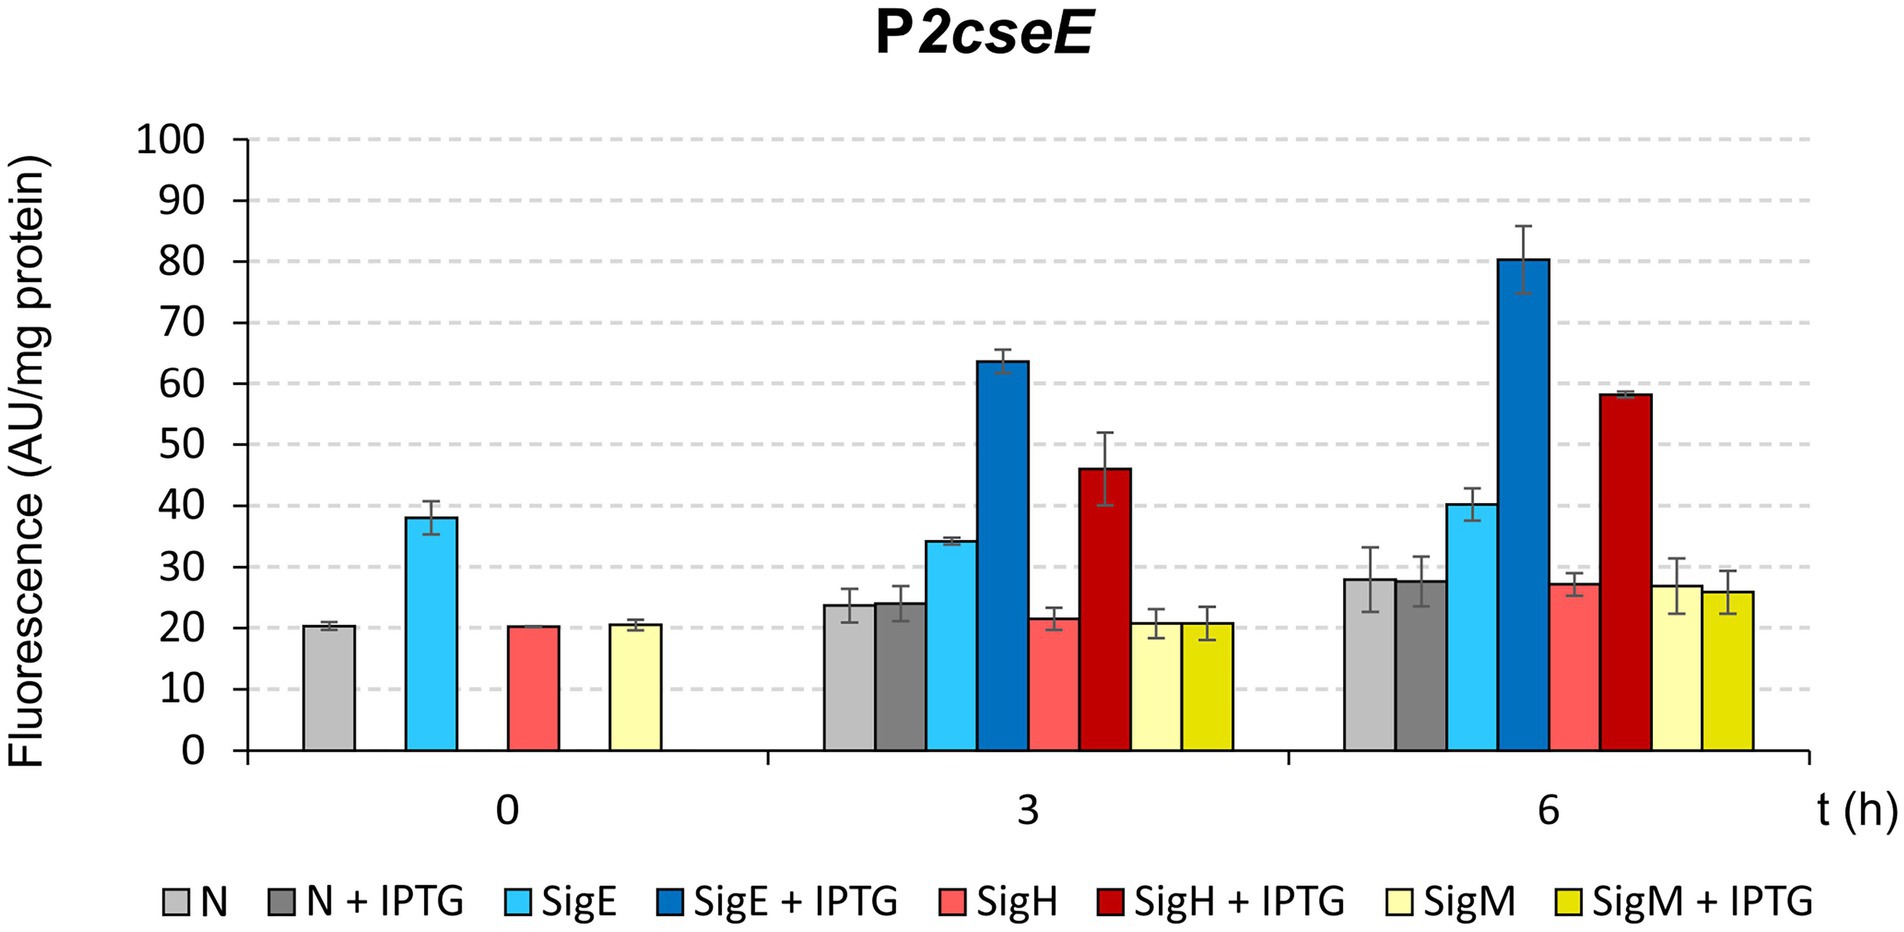
Figure 5. Determination of promoter P2cseE activity initiated by sigE, sigH, or sigM overexpression using in vivo two-plasmid assay. Promoter activity was measured as GFPuv fluorescence intensity of cell extracts, and is shown as bars representing the respective sigma factors. The C. glutamicum strains carried the pEC-XT99A constructs overexpressing sigE, sigH, or sigM after IPTG addition (added at time point 0) and the promoter-test vector pEPR1 carrying the promoterless reporter gfpuv gene downstream of the target promoter P2cseE. The strains harboring pEPR1 with the P2cseE promoter and empty pEC-XT99A (gray bars) or sigM (yellow bars) were used as controls. AU, arbitrary units. The standard deviations of three biological replicates are depicted as error bars.
The transcriptional pattern of the sigE-cseE-tatB operon, and the σ factors which control the respective promoters, are summarized in Figure 2D.
Global transcriptional profiling of the Corynebacterium glutamicum ΔcseE strain by RNA-seq (differential gene expression analysis)
To view the transcription initiated by σE at the genome level, we decided to use C. glutamicum RES167 and its derivative with a deleted cseE gene, respectively, to perform the differential gene expression analysis. Transcriptomes of these two strains were analyzed by RNA-seq. We supposed that σE, which the anti-σ factor CseE could not inhibit in the ΔcseE strain, would be active and initiate transcription of the σE-controlled genes even in the absence of a stress stimulus. These conditions are similar to the transcription by σH in the ΔrshA strain. A previous study (Busche et al., 2012) using the C. glutamicum ΔrshA strain (i.e., deletion of the gene encoding anti-σH) showed that in total 83 genes in 61 transcriptional units were directly or indirectly σΗ-dependent.
The ratio/intensity (M/A) plot deduced from RNA-seq results comparing the gene expression of C. glutamicum ΔcseE with that of C. glutamicum RES167 is shown in Figure 6. In total, 694 genes were differentially transcribed (296 upregulated and 398 downregulated) in C. glutamicum ΔcseE compared to C. glutamicum RES167. These genes may be considered as genes whose expression is directly or indirectly modulated by σE, i.e., σE modulon (Supplementary Tables S2, S3). Our aim was to define the σE regulon, i.e., the genes under direct control of σE (these genes are described below, in the section Genes of the σΗ/σE Regulon). We decided therefore to search for the σE-specific promoters upstream of the differentially transcribed genes.
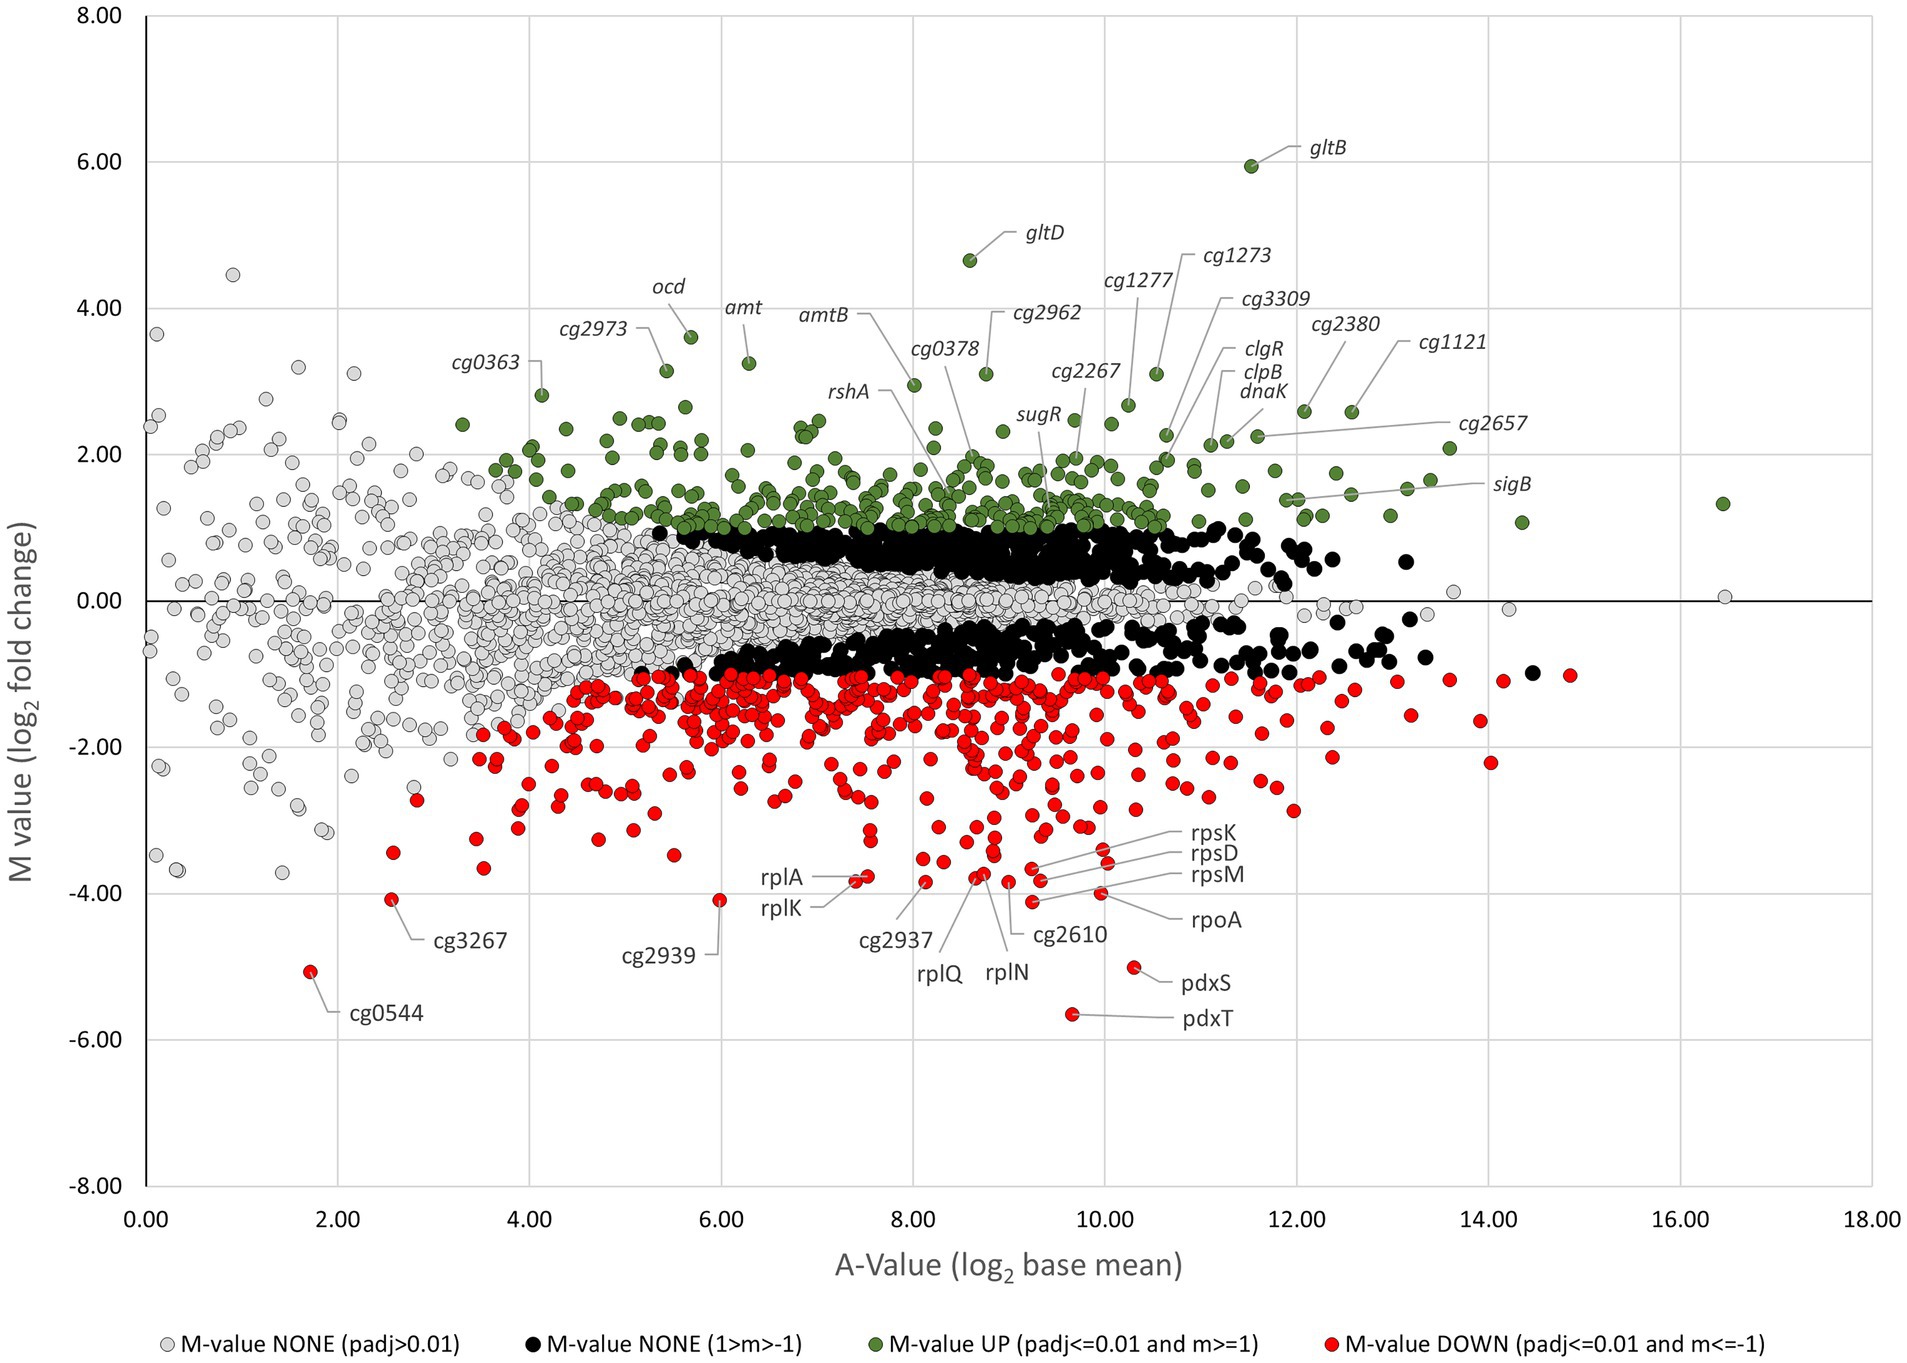
Figure 6. Ratio/intensity (M/A) plot derived from RNA-seq results comparing gene expression of the C. glutamicum ΔcseE strain with that of the C. glutamicum RES167 strain. The data were deduced from three RNA-seq analyses using total RNA probes from three biological replicates. Genes showing significantly increased or decreased transcription levels are marked with green and red circles, respectively. The A value represents the signal intensity, and the M value represents the signal intensity ratio, which corresponds to relative expression changes. The M value cutoff of 1 corresponds to relative expression changes equal to or greater than twofold. Genes were classified as being differentially expressed using the following cut-offs: M-value ≥1.0, upregulation; M-value ≤ −1.0, downregulation.
RNA-seq of the specific 5′-ends of the transcripts resulting in detection of transcription start sites
To localize promoters of the upregulated genes, TSSs were mapped using the results of the sequencing of primary 5′-end-specific cDNA library in the same way as recently with C. glutamicum σA-and σD-controlled genes, respectively (Albersmeier et al., 2017; Taniguchi et al., 2017). To detect the actual TSSs (+1), the nucleotide was considered to be position +1 if the number of read starts was 10 times higher than at position −1. Of the upregulated genes (i.e., those which are thought to be members of the σΕ stimulon), 157 genes were in operons and without TSSs (and therefore without closely located promoters). Upstream of the remaining 139 upregulated genes, 168 TSSs were detected. Some of the genes were transcribed from 2 or 3 or even as much as 4 TSSs. Closely upstream of the detected TSSs, we recognized 150 sequences similar to the consensus sequence of vegetative promoters (i.e., σA-dependent). Using the software Improbizer (Ao et al., 2004), a homogenous group of promoter sequences was detected which were different from the sequences typical for σA-dependent genes in C. glutamicum. The sequence GGAAC–N18-19–GTT (with a single exception GGAAA–N19–GTT in amtR), which was identical to the sequences of a few already found σΕ-dependent promoters (Šilar et al., 2016; Dostálová et al., 2017), was recognized in 16 sequences at an appropriate distance upstream of TSSs (Table 2). This group of potentially σE-controlled genes also included the four genes which were previously proved to be transcribed from promoters recognized by both σE and σΗ (dnaK, dnaJ2, clgR and sigB; Šilar et al., 2016; Dostálová et al., 2017). Their putative promoter sequences (approx. 70-bp DNA fragments) were then analyzed and promoter activities were confirmed by in vivo and in vitro assays. The same procedure for the downregulated genes did not reveal any possible σE-controlled genes and most genes seemed to be σA-controlled (Supplementary Table S3).
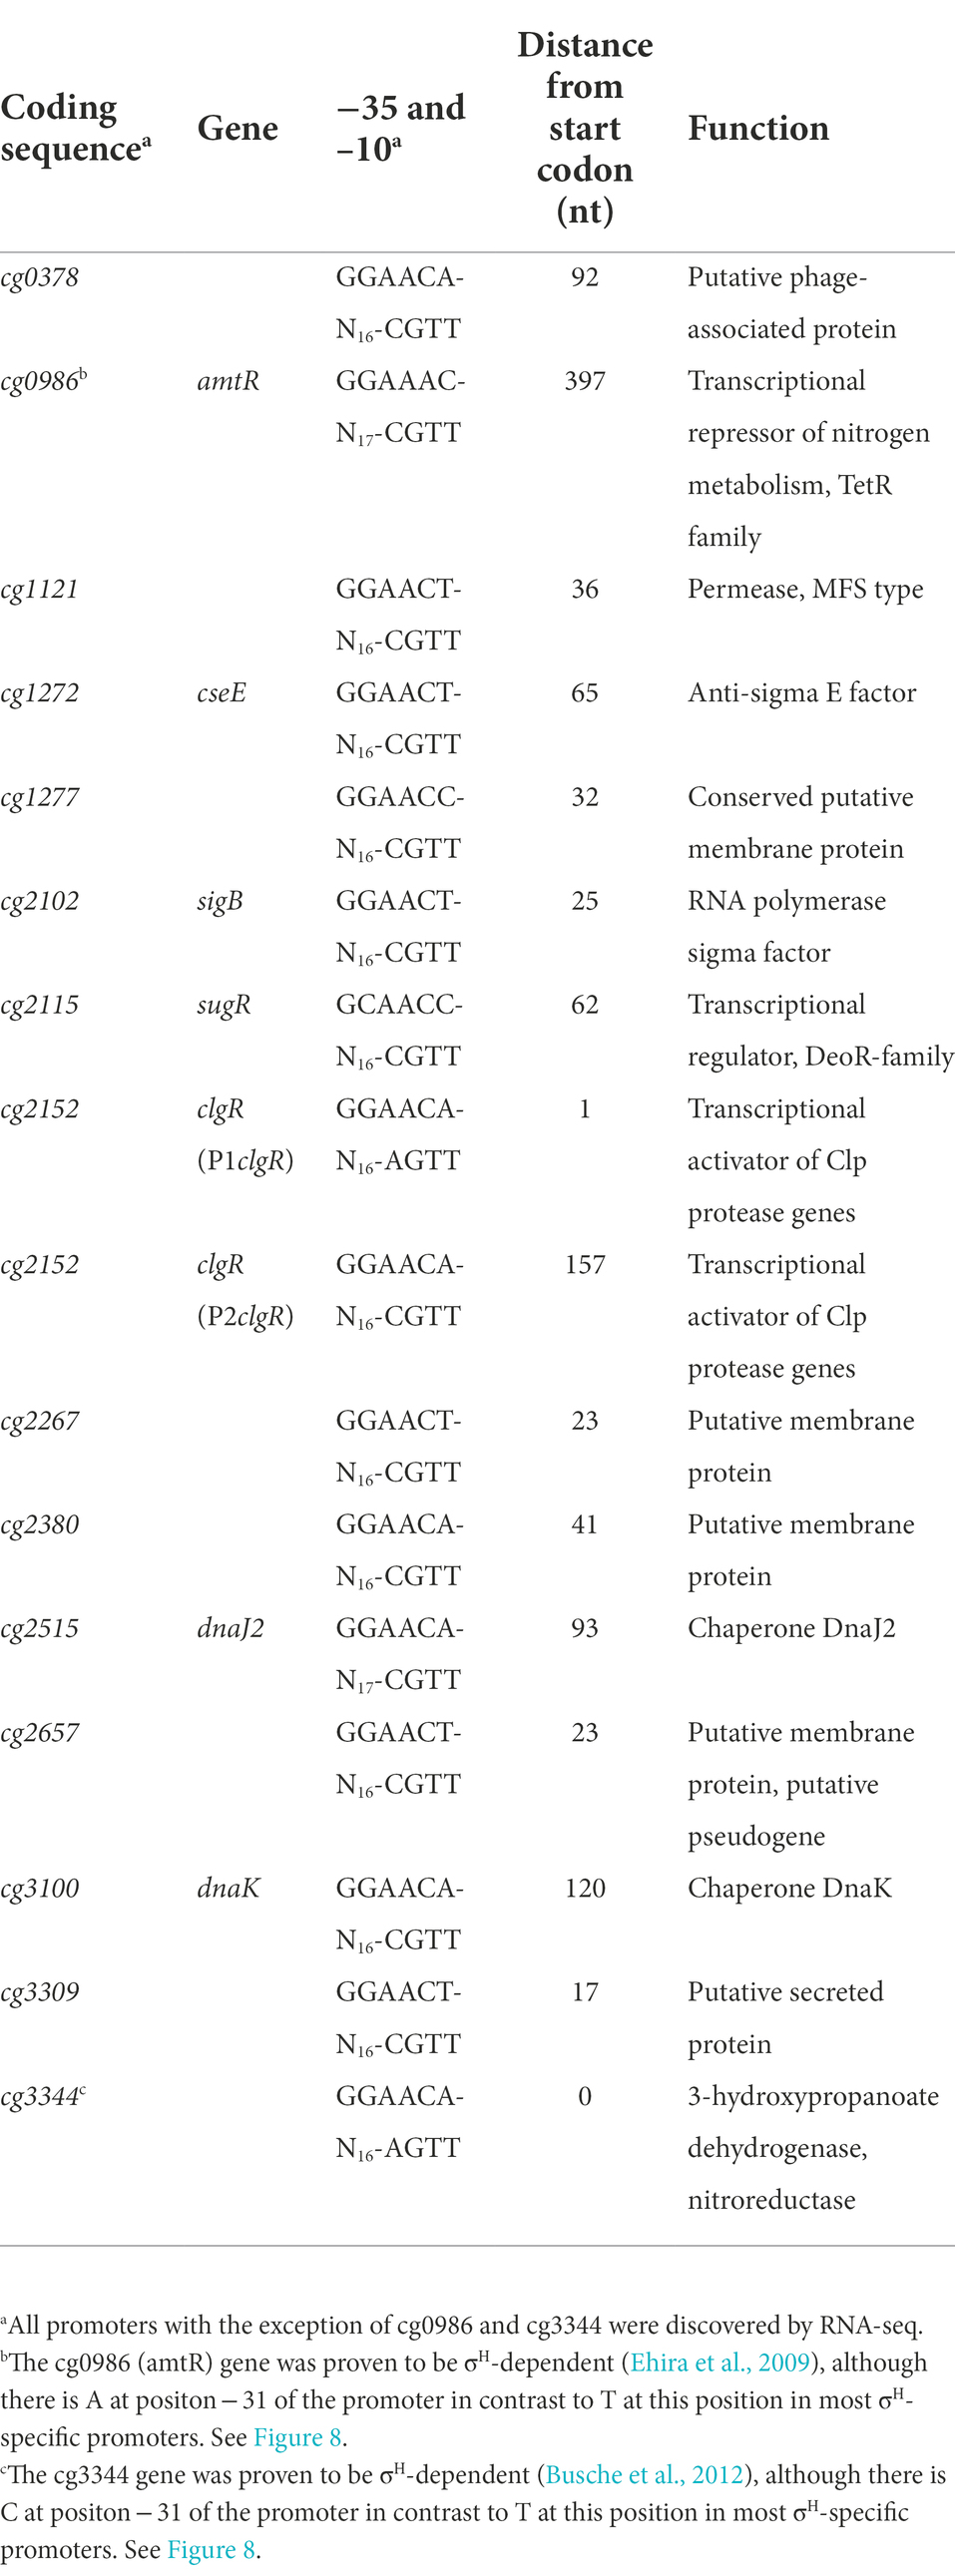
Table 2. Genes and corresponding promoter sequence motifs −35 and − 10 which were found to be both σH- and σΕ-controlled.
Activity of the promoters examined by in vitro transcription and in vivo two-plasmid system
The two techniques, which we developed for the analysis of individual C. glutamicum promoters (Dostálová et al., 2017), were applied to confirm the results of the RNA-seq and thus unequivocally assign specific σ factors to the promoters. This combining of the results of two techniques has already provided reliable results with the σD/σΗ-dependent promoters (Dostálová et al., 2019). The C. glutamicum RES167 cells harboring the expression vector pEC-XT99A with inserted C. glutamicum sigE or sigH gene and the vector pEPR1 carrying the tested promoter DNA fragment (approx. 70 nt) were used for the in vivo two-plasmid assay. The promoter activity was measured as a fluorescence intensity of the GFPuv reporter protein. The chosen promoters were further tested with the in vitro transcription system for C. glutamicum (Holátko et al., 2012) to confirm the classification of the target promoters.
In addition to the promoters, which were mapped by RNA-seq, we selected the promoter Pcg3344, which was previously found to be controlled by σΗ (Ehira et al., 2009; Busche et al., 2012) and possessed the GGAAC sequence in the −35 region. Moreover, the promoter of the amtR (cg0986) gene, which was also found to be σΗ-dependent (Ehira et al., 2009), and which possessed the atypical sequence GGAAA in the −35 region, was included. The most distinctive examples of σΕ-dependent promoters are shown in Figure 7. The promoters PamtR and Pcg3309 were highly active with σE, and weaker activity was also detected with σΗ, as measured by both techniques (Figures 7C,D,K,L), whereas the promoter Pcg1277 only exhibited predominant σE-dependent activity in vivo (Figures 7G,H). As for Pcg1121, it was clearly σΗ-dependent and very weakly σE-dependent by in vivo assay (Figure 7E), whereas an opposite relation was observed in the in vitro transcription (Figure 7F). All in all, none of the promoters (including the P2cseE promoter of the anti-σE factor gene, see Figures 4, 5) were found to be exclusively σE-specific in any analysis. Finally, all these σE-dependent promoters were generally active with both σE and σH in both in vivo and in vitro assays (Figure 7). According to the in vivo two-plasmid measurements, the most promoters were significantly weaker with overexpressed σE than σH, whereas the ratio of the strength with RNAP+σΗ and RNAP+σE in in vitro transcription was variable. Interestingly, all the discovered σE-controlled genes (the members of the σE regulon) thus constitute a gene group which is entirely contained in the σΗ regulon. All σE-dependent promoters (with a single exception of PamtR) contained the consensus sequence with the −35 and −10 sequences GGAAC–N18-19–GTT.
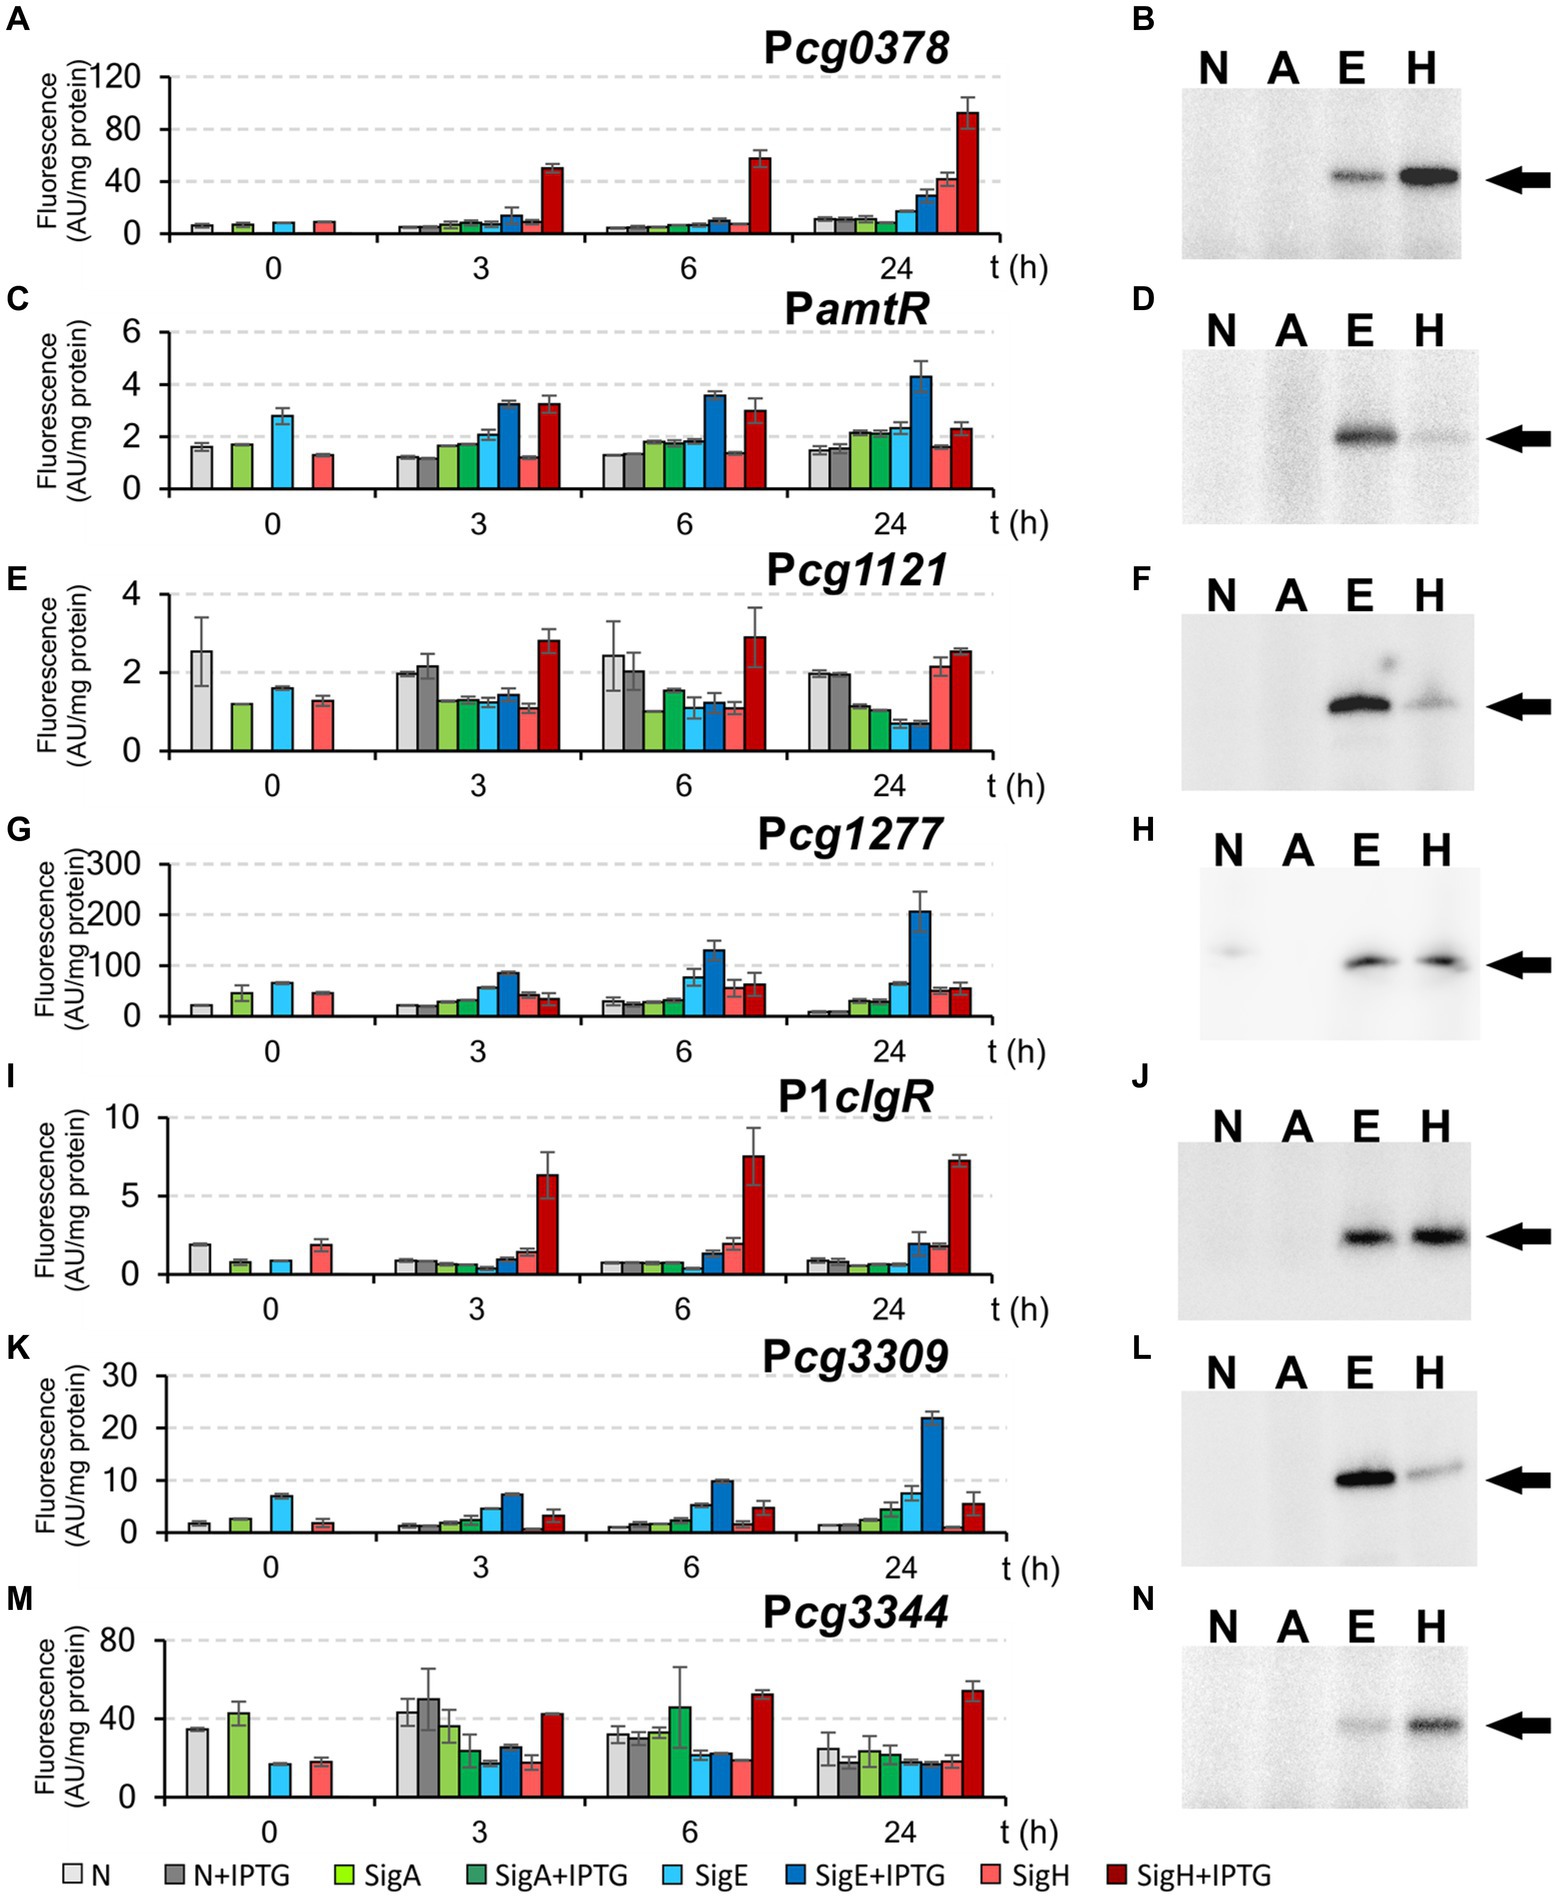
Figure 7. Activity of σΗ/ σE-dependent promoters Pcg0378, PamtR, Pcg1121, Pcg1277, P1clgR, Pcg3309, and Pcg3344 determined by in vivo two-plasmid system (A,C,E,G,I,K,M) and in vitro transcription (B,D,F,H,J,L,N). The two-plasmid C. glutamicum strains carried the pEC-XT99A constructs overexpressing sigA, sigE, or sigH after IPTG addition (at time point 0) and the promoter-test vector pEPR1 carrying the reporter gfpuv gene downstream of the tested promoters. The strains carrying pEPR1 with the tested promoters and empty pEC-XT99A were used as the controls (gray bars). The fluorescence intensity of cultures without IPTG is shown as light bars; the fluorescence intensity of cultures with IPTG induction is shown as dark bars. AU, arbitrary units. The standard deviations of three biological replicates are depicted as error bars. Sigma factors (A, E, H; N = no sigma) used for in vitro transcription are shown above the autoradiograms (B,D,F,H,J,L,N). The specific transcripts are indicated by arrows. The result of in vitro transcription with P1clgR shown in panel J (in vitro transcription with P1clgR) is the same as we published previously (Šilar et al., 2016).
As controls, the σΗ-dependent promoters Pmca, PuvrD3, PmshC, and PsufR with the −35 region GGAAT (Table 3) were also used for these assays. Both in vivo and in vitro techniques clearly confirmed that these 4 tested control promoters are exclusively σΗ-specific (Figure 8).
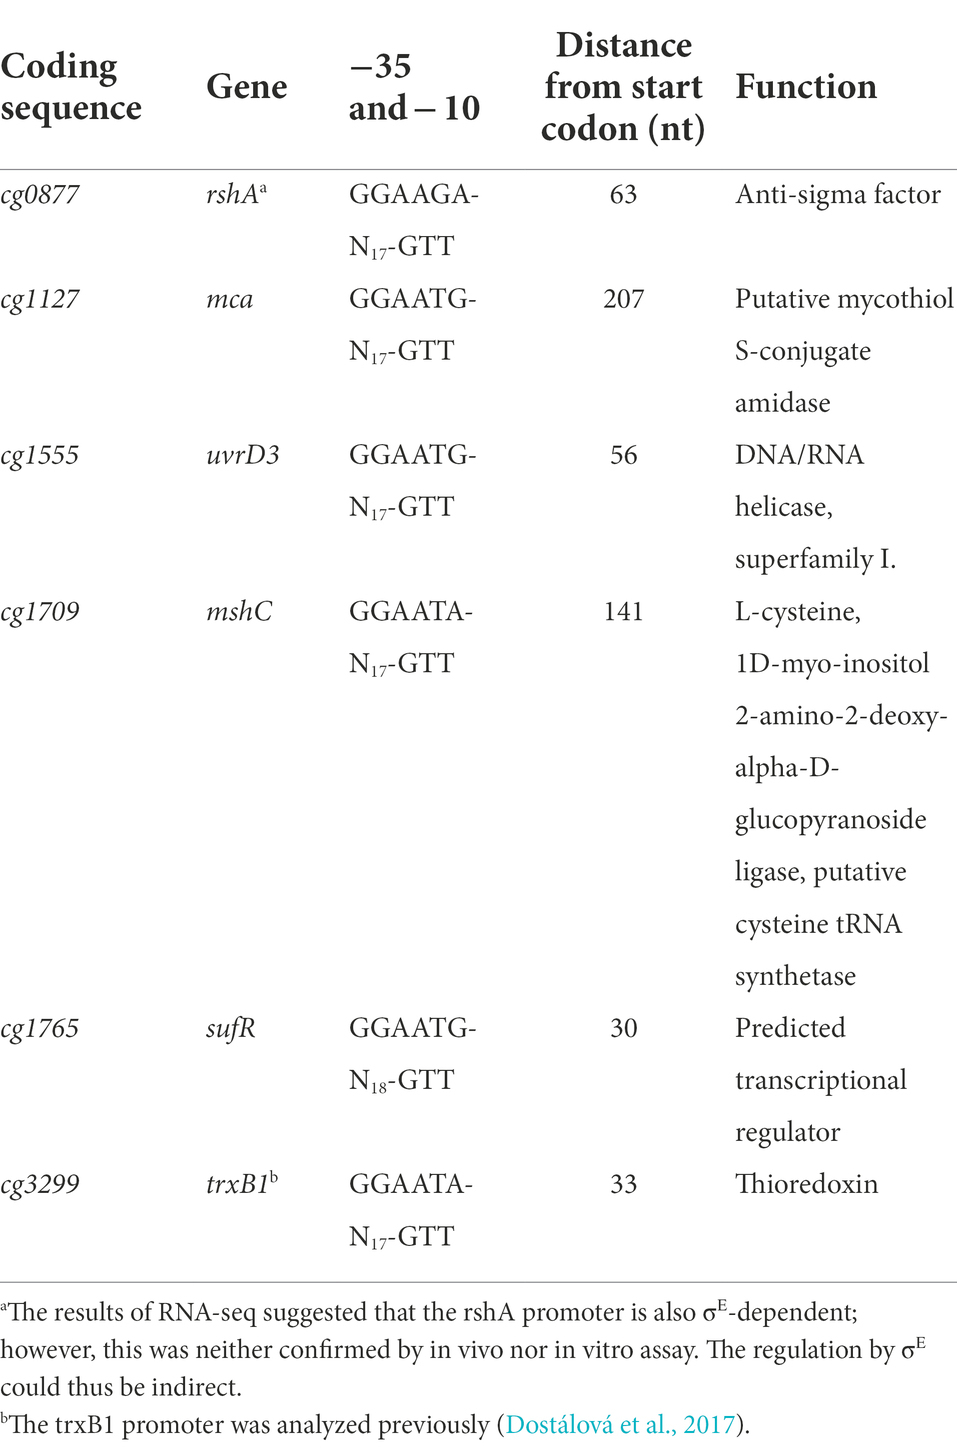
Table 3. Exclusively σH-specific genes and corresponding promoter sequence motifs −35 and −10 confirmed by in vivo and in vitro techniques.
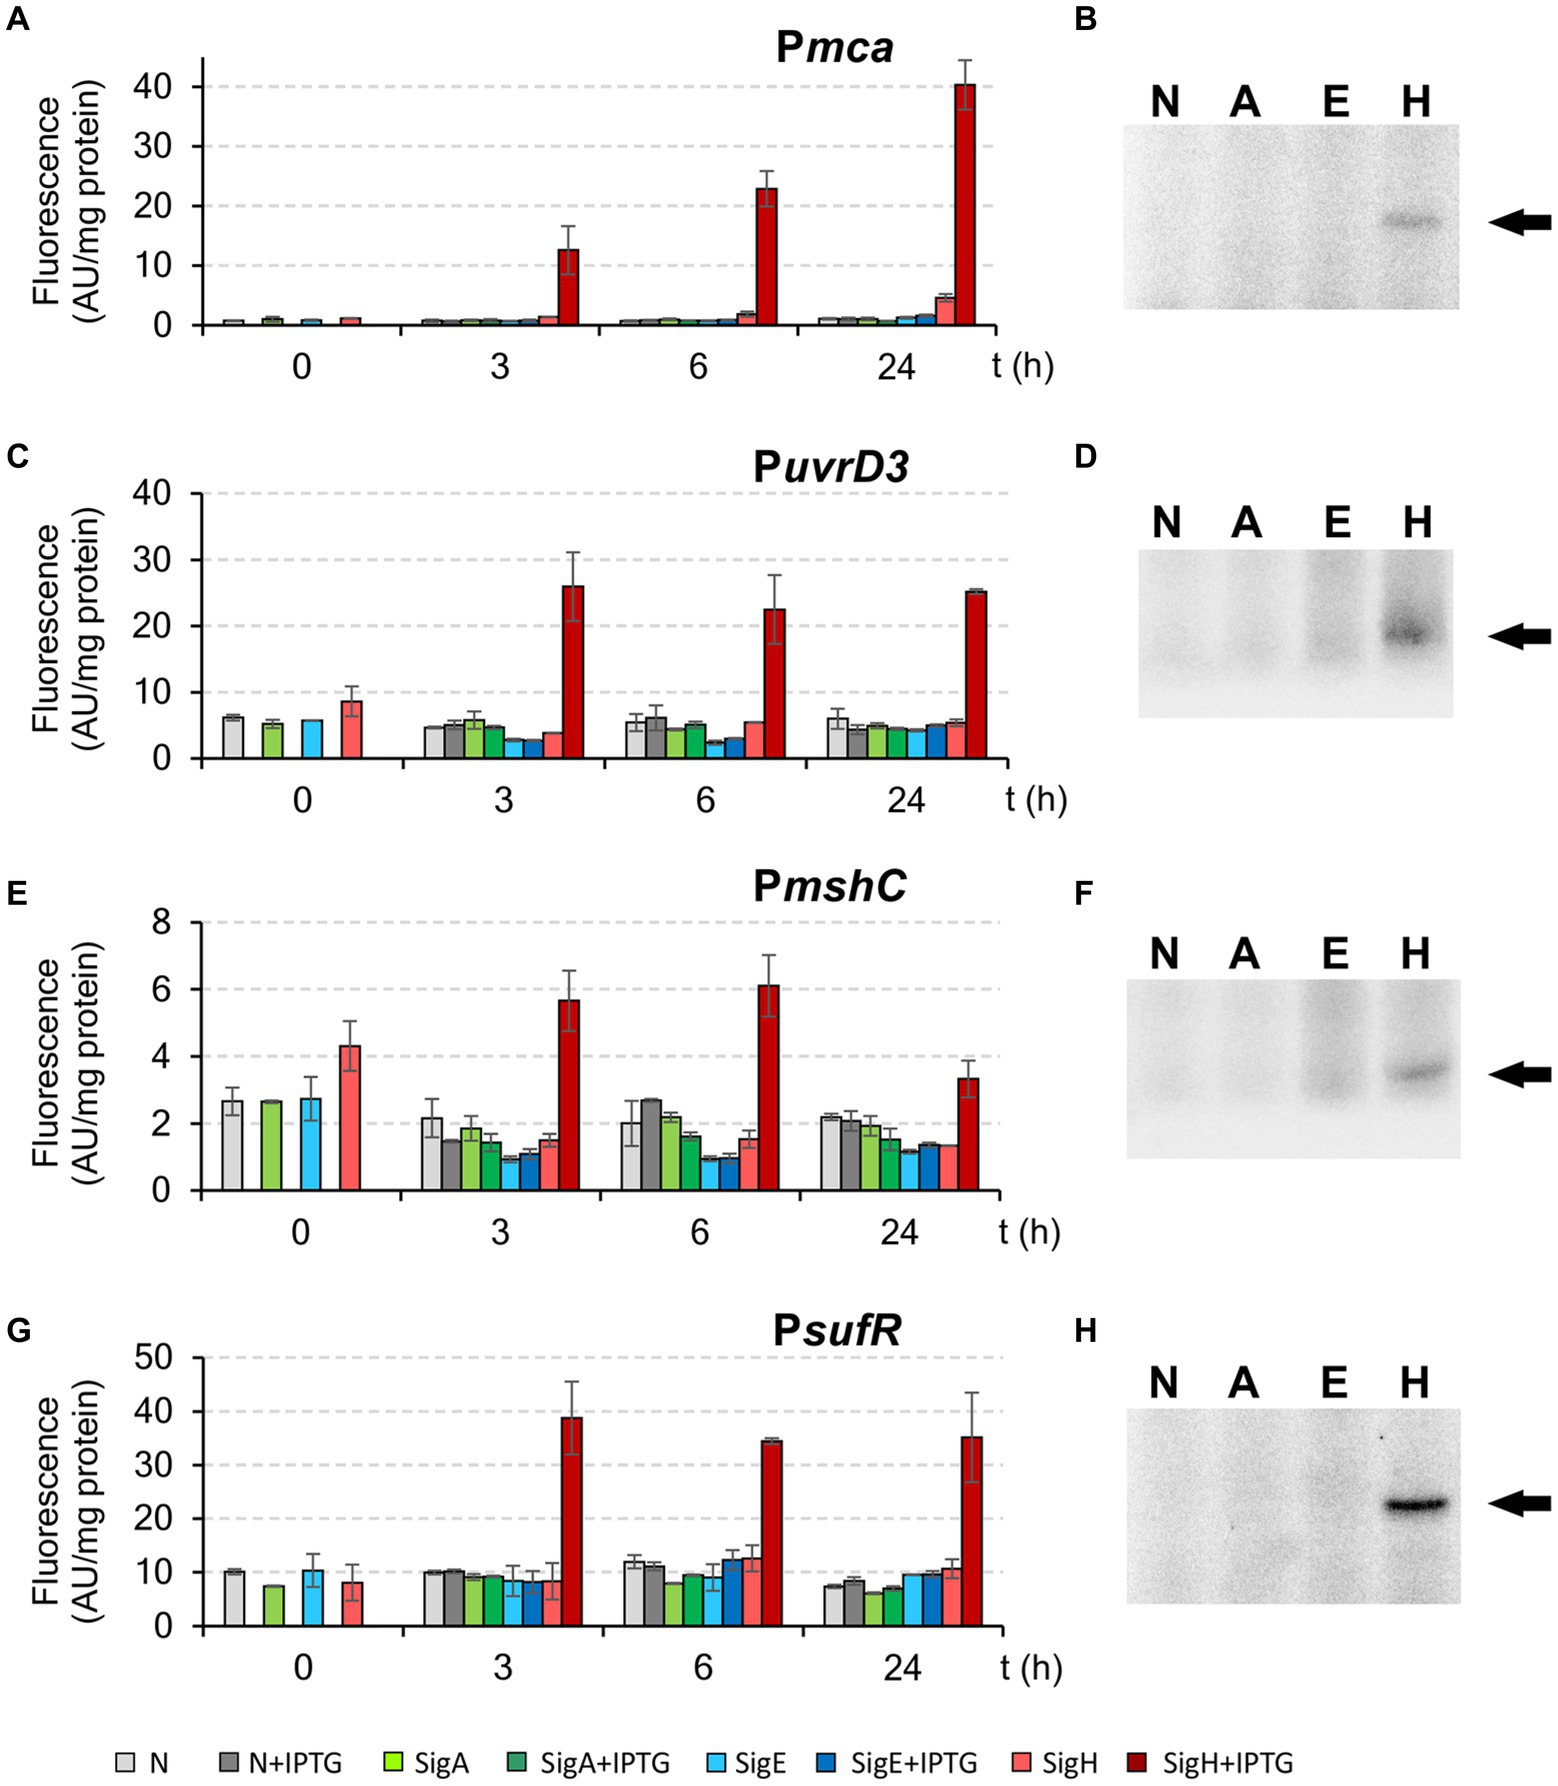
Figure 8. Activity of exclusively σΗ-specific promoters Pmca, PuvrD3, PmshC, and PsufR determined by in vivo two-plasmid system (A,C,E,G) and in vitro transcription (B,D,F,H). The two-plasmid C. glutamicum strains carried the pEC-XT99A constructs overexpressing sigA, sigE, or sigH after IPTG addition (at time point 0) and the promoter-test vector pEPR1 carrying the reporter gfpuv gene downstream of the tested promoter Pmca, PuvrD3, PmshC or PsufR. The strains carrying pEPR1 with the tested promoters and empty pEC-XT99A were used as the controls (gray bars). The fluorescence intensity of cultures without IPTG is shown as light bars; the fluorescence intensity of cultures with IPTG induction is shown as dark bars. AU, arbitrary units. The sigma factors (A, E, H; N = no sigma) used for in vitro transcription are shown above the autoradiograms (B,D,F,H). The specific transcripts are indicated by arrows. The standard deviations of three biological replicates are depicted as error bars.
The comparative analysis of C. glutamicum RES167 and C. glutamicum ΔcseE transcriptomes thus showed that the strategy for detecting the σE-dependent genes using the σE-specific anti-σ factor gene deletion (analogous to previous detection of σΗ-dependent genes) was successful. The results confirmed that the cseE gene located closely downstream of the sigE gene encodes the specific anti-σE as suggested previously (Park et al., 2008). The results are also consistent with our assumption that σE would be active in the cseE deletion strain that grows under optimal conditions without stress.
The subtle differences between consensus sequences of σΗ- and σΗ/σE-dependent promoters
The sequences of the 16 σΗ/σE-dependent promoters (Table 2) and 44 exclusively σΗ-dependent promoters (Ehira et al., 2009; Busche et al., 2012; Toyoda et al., 2015) were separately aligned at the most conserved GTT trimer in the −10 region, and the respective consensus sequences were derived (Figure 9). The consensus sequence of the promoters recognized by σΗ/σE was defined as GGAAC–N17-18–cGTT. This consensus differs in a single conserved base (C instead of T) at position −31 from the core consensus GGAAt–N18-19–GTT of the σΗ-controlled genes (Ehira et al., 2009; Busche et al., 2012). However, RNAP+σH is also able to initiate transcription from all detected promoters with C−31. Moreover, in a few exceptional cases, there is G or A at position −31 in the σΗ-controlled promoters. It seems, therefore, that σΗ tolerates any base at position −31, whereas only C at this position ensures transcription with RNAP+σE (with a single exception of A−31 in PamtR).
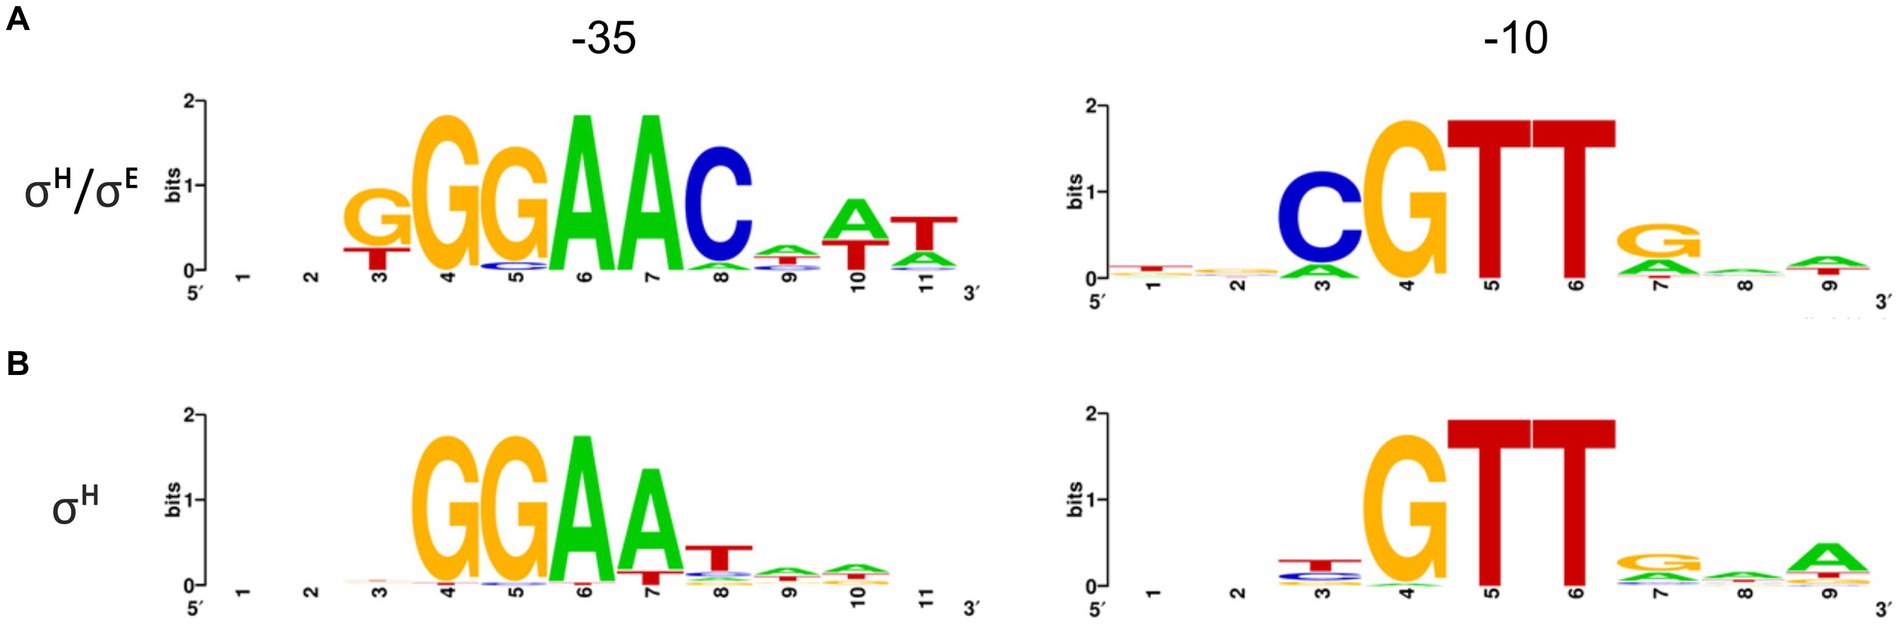
Figure 9. Consensus sequences of σΗ/σE-dependent (A) and σΗ-dependent (B) promoters defined by Weblogo. Promoters (nt sequences −1 to −50) were aligned at the highly conserved GTT trimer corresponding to the −10 element. σΗ/σE 16 sequences; σΗ 44 sequences. Sequence logos were made with Weblogo3 (Crooks et al., 2004).
Homology modeling of σH and σE in complexes with −35 elements of σH- and σE-dependent promoters
To see the interactions of the σ subunits with the promoter DNA from another perspective and in atomic detail, we involved computer homology modeling into the analysis. We focused on the difference between the −35 regions of the σE- and σH-dependent promoters in similar way as was done previously for the σD and σH-dependent promoters (Dostálová et al., 2019).
Recognition of the −35 element of the promoter DNA by stress σ subunits was captured in several X-ray/cryo-electron microscopy structures, which are available in the Protein Data Bank (www.rcsb.org; PDB id: 2H27, 6JBQ, 5ZX2; Lane and Darst, 2006; Guo et al., 2018; Fang et al., 2019). These studies included E. coli and M. tuberculosis RNAP+σ factors. In fact, all these σ subunits in the published models have the same fold. Moreover, their positioning relative to the −35 element of promoter DNA is also the same in all of them.
The 2H27 structure for σE from E. coli (Lane and Darst, 2006) was used as a template for creating homology models for C. glutamicum σE and σH. The non-template/template DNA strand in the 2H27 crystal structure has the GGAACTT/CCTTGAA sequence, which was in fact identical to the sequence of the C. glutamicum Pcg3309 promoter in the key region −35 to −29. Therefore, we used Pcg3309 as an example of a predominantly σE-dependent promoter. PtrxB1 (GGAATAA/CCTTATT) was taken as a typical strong exclusively σΗ-specific promoter.
Our homology models showed that the side chains of arginine R185 (in σE) or methionine M170 (in σH) interact with nucleotide bases (within the non-coding strand) at positions −31 and − 30 of the promoters (Figures 10A,B).
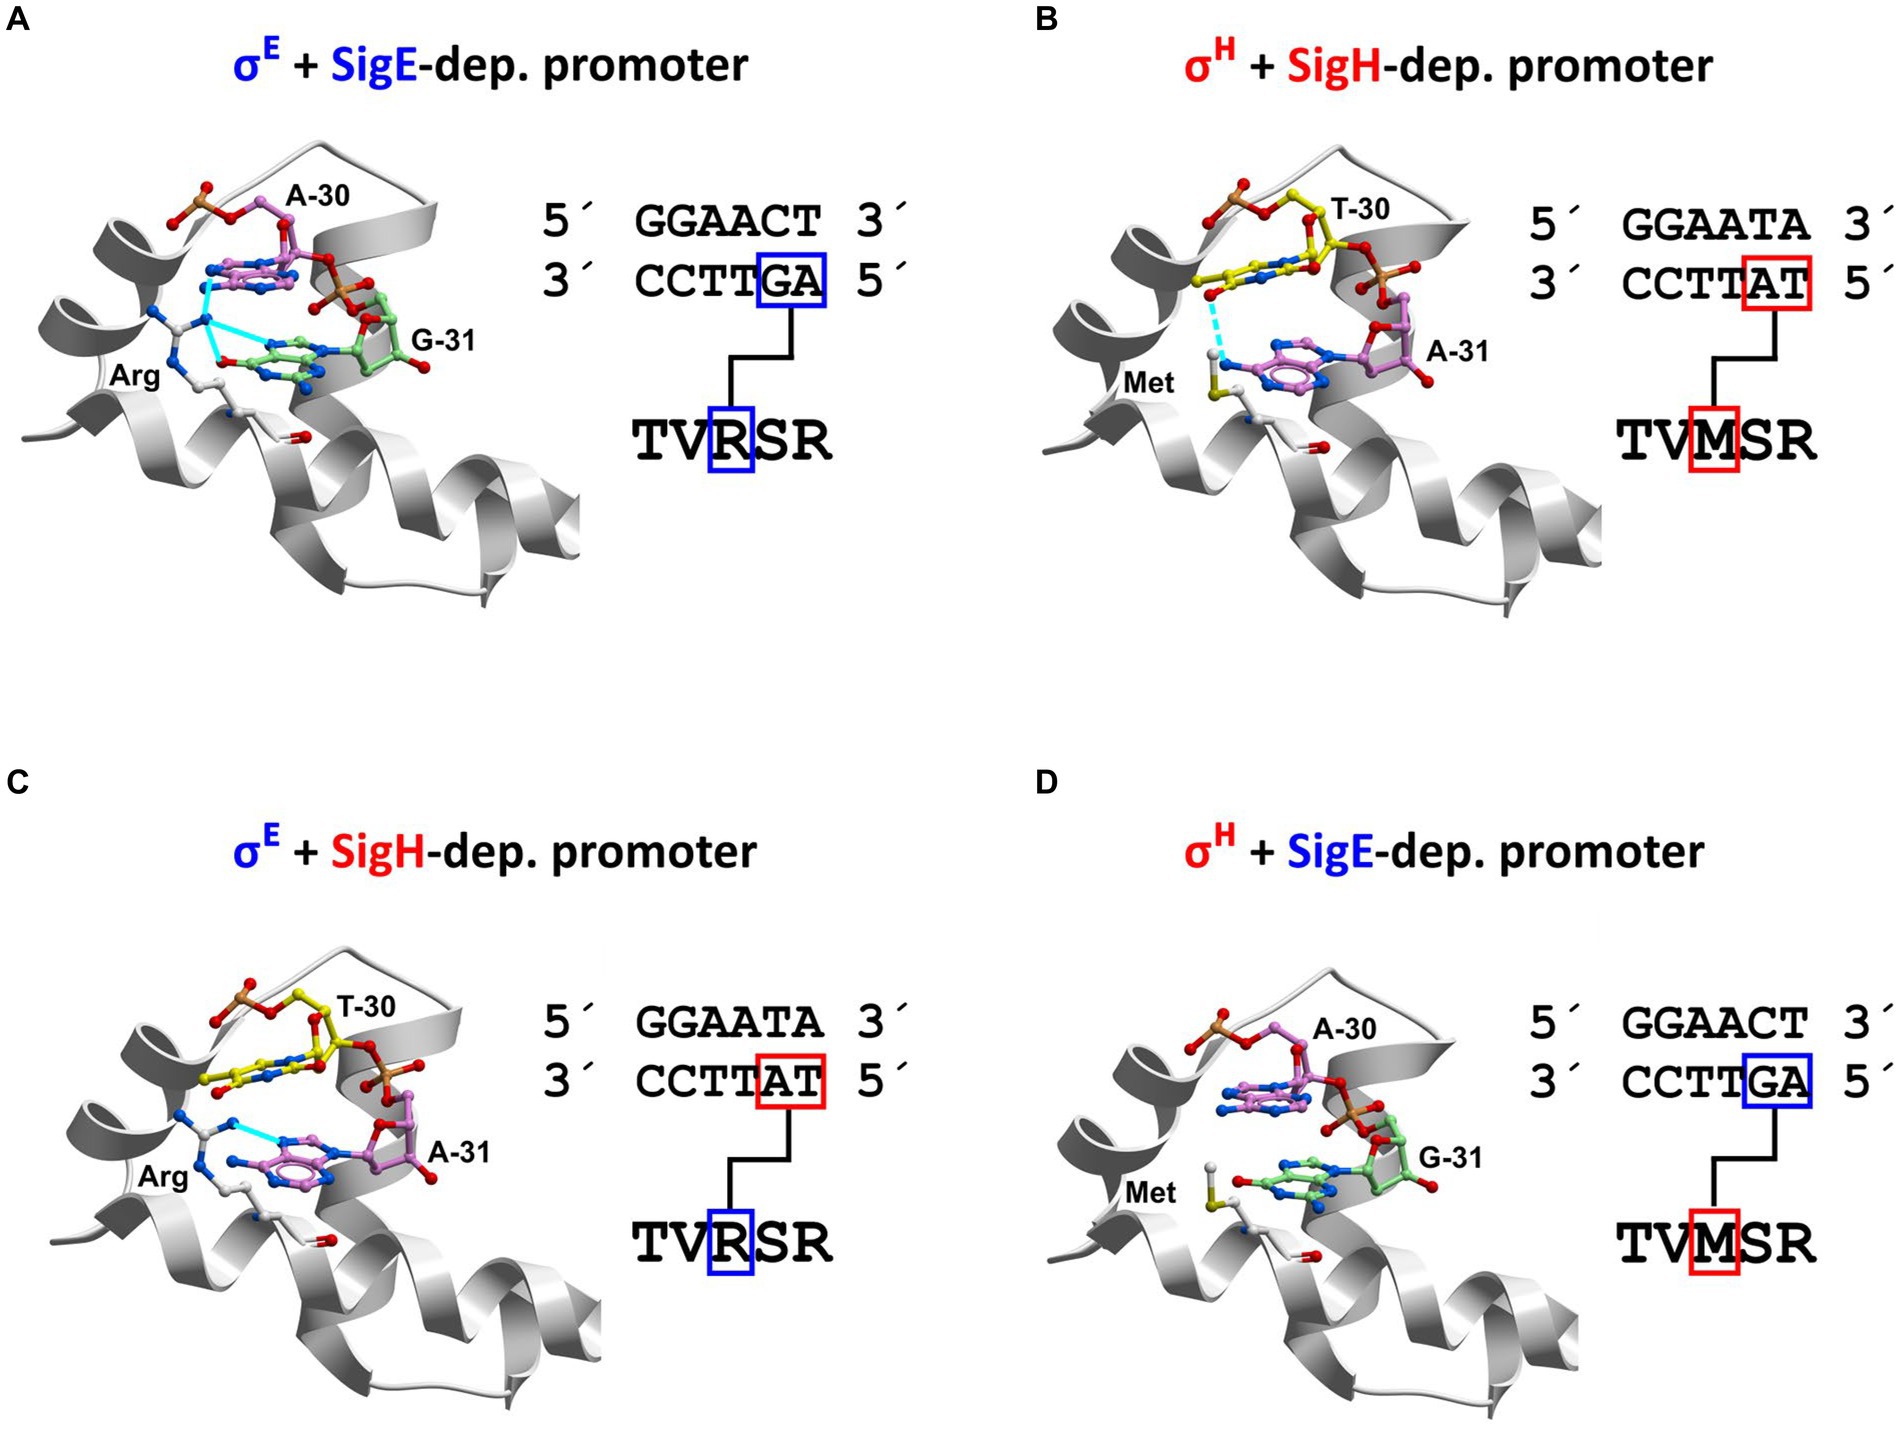
Figure 10. Recognition of nucleotides at promoter positions −31 and − 30 within non-coding (template) strand by σE and σH (homology modeling). The −35 sequences of the predominantly σE-dependent promoter Pcg3309 and exclusively σΗ-dependent promoter PtrxB1 are shown. Four unique combinations of the key interacting partners (amino acids R/M and dinucleotides at positions −31 G/A, −30 A/T) can occur (i.e., R-GA, M-AT, R-AT, M-GA). DNA: red = oxygen; blue = nitrogen; A: purple = carbon; T: yellow = carbon; G: green = carbon. Amino acids: white = carbon; blue = nitrogen; yellow = sulfur; red = oxygen. Interactions: (A) Arg-GA; (B) Met-AT; (C) Arg-AT; (D) Met-GA. Arginine R has a positively charged side chain, which forms stabilizing salt bridges with negatively charged phosphate groups of nucleic acids. In our models, the arginine side chain can form stabilizing hydrogen bonds with neutral nucleic acid bases G−31 and A−30 in the complex of σE with predominantly σE-dependent promoters (Pcg1121, Pcg3309, PsigB or PcseE; Figure 11A). In contrast, if the hydrophilic side chain of R is pushed into the immediate vicinity of the hydrophobic methyl group of T−30 (as in the case of σE and PtrxB1; Figure 11C), it will prevent hydrophilic R from coming into energetically advantageous contact with water molecules. Therefore, the close interaction of R with the T−30 base can destabilize complexes of σ subunits and promoters (Figure 11C). Methionine (M) is a hydrophobic amino acid that does not form hydrogen bonds with nucleic acid bases. From the point of view of the overall energy of the system, it is advantageous if the hydrophobic motifs come together, which allows the surrounding water molecules to form the maximum number of hydrogen bonds. Therefore, the stabilizing interactions can occur upon contact of M with the hydrophobic methyl group of T−30 of the template strand (in PtrxB1, PrshA, and PmshC; Figure 11B). If the hydrophobic side chain of methionine comes close to G−31 A−30 as in Pcg3309, neither hydrogen bonds nor hydrophobic interaction can be formed and a weak coupling results (Figure 11D).
Design of σΕ and σΗ mutagenesis and testing the effects of mutant sigma factors on activities of the σH or σH/σE-controlled promoters
Based on the conclusions from homology modeling, mutations in the key amino acids arginine R185 (in σE) or methionine M170 (in σH; i.e., R185 → M185 in σE, and M170 → R170 in σH) were proposed. The wild-type σH, σE, and the modified sigma factors σHmut and σEmut can form with Pcg3309, PtrxB1, and PcseE in total four unique combinations of key interactions between amino acids R or M and dinucleotides AT and GA at positions −31 and − 30 in the template strand, i.e., R-GA, M-AT, R-AT, M-GA (Figure 10). In addition, there are the combinations M-CT and R-CT that occur with PrshA, which are analogous to M-AT and R-AT. In these combinations, the amino-group of cytosine may interact in a similar way to the amino group of adenine.
The genes encoding the mutant σ factors were constructed and cloned into the expression vector pEC-XT99A. The plasmid constructs of pEC-XT99A with the genes encoding σH (M170), σE (R185), σHmut (R170), and σEmut (M185) and constructs of pEPR1 with the selected promoters were used for creating combinations of the two plasmids (pEC-XT99A + sig and pEPR1 + promoter) in C. glutamicum clones. In addition to the predominantly σE-controlled PcseE and Pcg3309 promoters and exclusively σH-dependent PtrxB1 promoter, we decided to also test PrshA. This promoter is one of a few exceptions among the strong σH-dependent promoters with G at position −31 (instead of T) and it can be thus supposed that M170 in σH would interact with −31 and − 30 CT (instead of AT) in the template strand. The promoter activities in the resulting clones were measured by the standard in vivo procedure as the intensity of fluorescence produced by GFPuv (Figure 11).
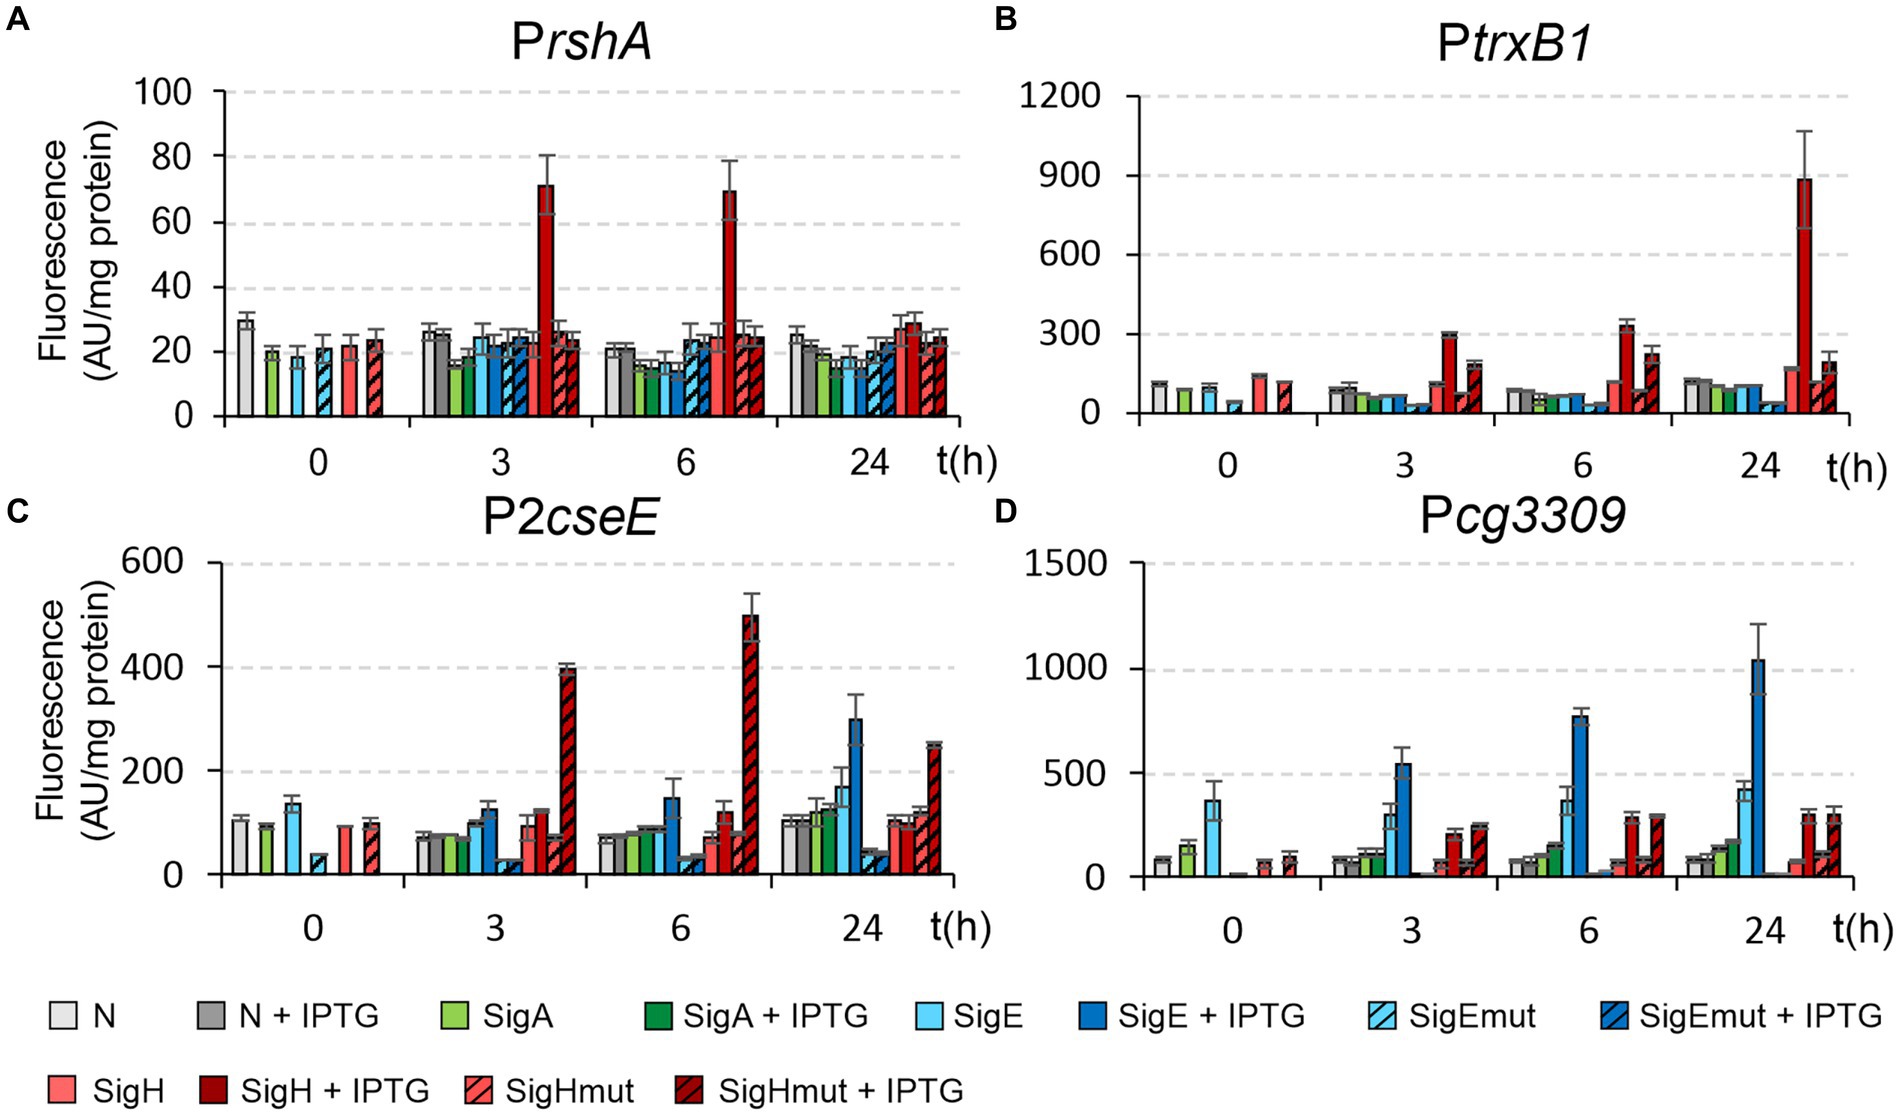
Figure 11. Activity of σH-controlled promoters PrshA (A) and PtrxB1 (B) and σH/σE-controlled promoters P2cseE (C) and Pcg3309 (D) with wild-type and mutant σH and σE. The activities were determined by two-plasmid assay. The C. glutamicum strains carried the pEC-XT99A constructs overexpressing sigA, sigE, sigEmut, sigH, or sigEmut after IPTG addition (at time point 0) and the promoter-test vector pEPR1 carrying the reporter gfpuv gene downstream of the tested promoters. The strains carrying pEPR1 with the tested promoters and empty pEC-XT99A were used as the controls (gray bars). The fluorescence intensity of cultures without IPTG is shown as light bars; the fluorescence intensity of cultures with IPTG induction is shown as dark bars. AU, arbitrary units. The standard deviations of three biological replicates are depicted as error bars.
The use of σΕmut and σΗmut enabled us to evaluate the results of promoter activity measurements (Figure 11) in connection with the hypotheses based on homology modeling (Figure 10).
The activity of the predominantly σE-dependent promoters PcseE and Pcg3309 vanished completely when the σEmut was used (Figures 11C,D). Apparently, their activity depends strictly on R185 in σE. We expected that the activity of these promoters, which are to a lower extent also active with σH, will be higher with σHmut carrying R170. This is true with PcseE, whereas the activity of Pcg3309 was approximately the same with σH and σHmut (Figures 11C,D). Apparently, sequences outside of the conserved motifs −35 and −10 also play significant roles in the activity of the individual promoters. As for the exclusively σH-dependent PtrxB1 and PrshA, the mutation in σHmut (M170 → R170) also impaired their activity: to a large extent for PtrxB1 and completely for PrshA (Figures 11A,B). Neither of these strictly σΗ-specific promoters were recognized by σEmut. Although σEmut carried methionine occurring in σΗ in the key position, this single alteration in σE did not suffice for the recognition of these σΗ-specific promoters.
We can conclude that the homology models of σE- and σH interactions with the respective promoters were generally confirmed, although differences in promoter sequences outside the −10 and − 35 elements can significantly modulate the promoter activity.
Genes of the σH/σE regulon
Genome-wide differential gene expression analysis by RNA-seq detected 296 upregulated genes using the C. glutamicum ΔcseE strain. This group forms the σE stimulon, in which genes directly or indirectly dependent on σE activity can be identified. However, only 15 genes were strictly defined as members of the σE regulon based on the presence of the σE-dependent promoters (clgR is transcribed from 2 σE-dependent promoters). Most of these genes (Table 2) are apparently related to maintaining cell envelope integrity or to protein quality control. The cseE gene encoding the cognate anti-σ is a natural part of the regulatory circuit, which controls the σE function (Park et al., 2008). The sigB gene, which was previously found to be under control of a σΗ/σE-dependent promoter (Dostálová et al., 2017), encodes the σ factor, which plays a key role in the activation of cell functions essential for C. glutamicum cell survival during the transition and stationary growth phases and in response to various stresses (Larisch et al., 2007). Among them, the effects of acids, ethanol, cold, and heat shock may finally lead to the cell envelope stress response. Thus, the sigB gene is a member of the σΗ/σE regulon.
It was shown that the presence of misfolded proteins in the cell envelope activates σE in some bacteria. In agreement with this, the main general function of chaperones such as DnaK and DnaJ2, which are encoded by the σH/σE -activated genes dnaK and dnaJ2 in C. glutamicum, is to promote proper protein folding and prevent aggregation of the incompletely folded proteins.
Another essential task in protein quality control is removing proteins which have been irreversibly damaged by stresses. This function is fulfilled by Clp proteases. The transcription of the gene clgR that encodes a regulatory protein which activates the expression of these proteases in C. glutamicum, was found to be induced by the heat shock response mediated by σH (Engels et al., 2004). In mycobacteria, clgR is also induced by oxidative and detergent stress. These responses are activated by σH and σE, respectively (Manganelli et al., 2002).
SugR regulator is a transcriptional repressor of the central carbon metabolism of C. glutamicum. Repression of the sugar metabolism may also be connected to the slowed growth during the stress responses.
The function of the cg3344 gene encoding 3-hydroxypropanoate dehydrogenase is related to energy production and conversion. This enzyme is involved in the pathway of pyrimidine degradation which may be connected to the slowed growth rate of the cell culture and energy saving during the defense reaction to stress effects.
The cg1121 gene encodes permease of the MFS type. The product belongs to the large family of transporters (efflux pumps) which confer bacteria resistance to various compounds, e.g., antibiotics. The tatB gene (twin-arginine translocation pathway protein) which is in the operon with sigE and cseE is most likely also connected to the stress response functions in C. glutamicum. The Tat proteins generally have a role in translocating fully folded proteins from the cytoplasm across the cytoplasmic membrane. Among them, redox proteins may be connected to the oxidative stress response (Montero et al., 2019). In E. coli, N-acetylmuramoyl-L-alanine amidase, which is transported by the Tat protein system, acts on the peptidoglycan structure, and may thus be involved at some stage in envelope stress response. Recently, SDS as a cell envelope stressor was found to induce expression of the tatABC operon in Salmonella (Rogers et al., 2022). The same Tat system was also observed to counteract severe oxidative stress and starvation when Bacillus subtilis grows in a NaCl-depleted medium (Prajapati et al., 2021).
Four other genes encode putative membrane proteins which may also be related to cell envelope functions. In conclusion, nearly all uncovered members of the C. glutamicum σΗ/σΕregulon have some function related to the cell envelope and/or various stresses.
Discussion
Sigma E is a major regulator in the cell envelope stress response in various Actinobacteria. In M. tuberculosis, σE also controls heat and oxidative stress response (Manganelli and Provvedi, 2010), whereas it coordinates stress response to various antibiotics in S. coelicolor (Tran et al., 2019). In addition to cell surface stress response, σE plays a role in responses to heat stress and slow growth under nutrient-limiting conditions and the stationary phase in C. glutamicum (Park et al., 2008; Pátek and Nešvera, 2011). It seems, therefore, that σE together with σH, which is involved in heat and oxidative stress response and DNA repair in Actinobacteria (Ehira et al., 2009; Busche et al., 2012; Sharp et al., 2016; Park et al., 2019), fulfill major functions in the defense of the bacterial cells against the main threats to their integrity. Moreover, both RNAP+σE and σH initiate the transcription of sigB in M. tuberculosis (Raman et al., 2001), C. glutamicum (Dostálová et al., 2017) and R. erythropolis (Štěpánek et al., 2022). The primary-like σB factor of C. glutamicum activates the genes in response to salt, ethanol, acid, cold and heat stresses (Halgasova et al., 2002; Larisch et al., 2007; Barreiro et al., 2013) and under oxygen deprivation (Ehira et al., 2008). Generally, σB is highly active during the transition phase between the exponential and stationary growth phases in C. glutamicum (Larisch et al., 2007). RNAP+σB most likely also contributes to the transcription of sigE and sigH genes. The intricate regulatory network of these three σ factors integrates signals from various stress conditions and enables cells to overcome unfavorable conditions via highly coordinated physiological responses.
In some bacteria (e.g., E. coli, Salmonella, and Burkholderia cenocepacia), an important role in controlling nitrogen metabolism is played by alternative sigma factor σ54, which is structurally and functionally different from the σ70-type sigma factors (Lardi et al., 2015). Such an σ54 factor is missing in C. glutamicum. We found that the gene encoding the key regulator of nitrogen metabolism AmtR was under the control of σE (and partially σH), although it was not detected as upregulated according to the RNA-seq results. Moreover, many genes of the AmtR regulon (Beckers et al., 2005), which are involved in nitrogen metabolism (amt, amtB, crnT, cg1918, urtA, urtB, urtC, urtE, glnK, codA, ureA, ureB, ocd, and soxA) were induced in C. glutamicum ΔcseE, but they were not found to be directly under an σE-dependent promoter. We can speculate that σE and σH together with AmtR (and probably some other transcriptional regulators) form a functional module which is responsible for regulating the uptake and assimilation of nitrogen sources.
One of the main aims of this study was to find differences between the σΗ- and σΕ-dependent promoters since the class of the promoters upstream of the genes defines a regulon. Surprisingly, we found that the activities of the two σ factors were substantially overlapping and that there is a specific group of σΗ/σΕ-dependent promoters. The difference of the two promoter classes (σΗ- and σΗ/σΕ-dependent) was found mainly in the −35 region of the consensus sequence: σE could only recognize promoters with the −35 GGAAC sequence, whereas σΗ recognized −35 GGAAN, although −35 GGAAT was the most frequent.
In M. tuberculosis, similar features were found (although based on less promoter sequences): C at position −31 was essential for recognition by σΕ, whereas any base at −31 allowed recognition by σΗ, although T prevailed (Song et al., 2008). However, a specific class of σΗ/σΕ-dependent promoters was not described in M. tuberculosis, probably due to lower number of promoters analyzed and different methods used. Interestingly, all four analyzed σΗ-dependent promoters showed the −35 GGAAC sequence in R. erythropolis (Štěpánek et al., 2022) in our recent study. Two of them seemed to be σΗ/σΕ-dependent. The results support the idea that the promoter sequences of promoters recognized by σΗ, σΕ, and σD (Dostálová et al., 2019) in C. glutamicum (and probably also in the closely related Actinobacteria) and the corresponding σ regulons to various extent overlap. These similarities in structure and activity are most probably based on similar sequences of the key amino acids in σ factors.
The genes encoding stress σ factors in various Actinobacteria, such as Mycobacterium (Donà et al., 2008), Rhodococcus (Štěpánek et al., 2022), and S. coelicolor (Paget et al., 1998), are mostly autoregulated, i.e., they are transcribed by RNAP holoenzymes containing the σ factors which they encode. In contrast, we found that the C. glutamicum sigE gene is expressed from three σA- and/or σB-dependent promoters. Instead of the σE-encoding gene, the gene cseE encoding the anti-σΕfactor was found to be driven from the σH/σE -dependent promoter. To compare the transcriptional organization of the C. glutamicum sigE-cseE operon with that of other Corynebacterium species, we analyzed the respective sequences (deposited in KEGG database) of 82 Corynebacterium species. A stress promoter with the consensus motifs (GGAAC–N18-20–GTT) was only found upstream of the sigE gene of 5 Corynebacterium species. The autoregulation of sigE is thus apparently rare in corynebacteria. Further, a stress promoter with the same structure was found upstream of cseE in 11 Corynebacterium species. In conclusion, both the sigE and cseE genes are mostly transcribed from vegetative promoters in the majority of the corynebacteria. In four species (C. imitans, C. aquilae, C. sphenisci, and C. ureicelerivorans) the cseE gene is clearly missing. The strategy for the control of sigE expression thus developed divergently in corynebacteria.
C. glutamicum cseE is transcribed from two promoters, σΑ-dependent P1cseE and σΗ/σΕ-dependent P2cseE (Figure 2). Primer extension analysis (Figure 2C) showed that both signals representing the two TSSs were enlarged in presence of SDS. The co-regulated transcription from the two promoters may be due to a still unknown transcriptional regulator which binds close to cseE promoter region. Transcription of many stress-responsive genes was found to be controlled by such regulators rather than by alternative σ factors (Hünnefeld et al., 2019). Some stress promoters are regulated by both DNA-binding transcription factors and RNA polymerase-binding sigma factors. Then, the two close promoters may be co-operatively regulated by transcription factor although they are transcribed with different sigma factors. We suppose that such situation may occur for example at σΑ-dependent P1dnaK and σΗ/σΕ-dependent P2dnaK regulated by HspR-associated inverted repeat (HAIR) in C. glutamicum (Pátek et al., 2013). Another possibility is that DNA in the promoter region is unwinded by RNAP holoenzyme carrying stress sigma factor and transcription bubble is formed. Then DNA may be exposed to bind RNAP carrying different sigma factor (e.g., σA) to another close promoter.
The analysis of the sigH-rshA operon showed that the transcription of sigH is also rarely autoregulated (in only 7 Corynebacterium species). In contrast to cseE, upstream of the rshA gene, conserved stress promoters (GGAAT–N18–GTT) were recognized in 63 Corynebacterium species. We can infer from these sequence analyses that the transcription of sigE and sigH in response to stress conditions should therefore be regulated mostly by DNA-binding transcriptional factors. Moreover, a certain level of σ factors could be permanently present in the cell in an inactive form bound by the cognate anti-σ factor. The additional σΗ- or σΕ-dependent promoter upstream of rshA or cseE, respectively, probably developed as a different strategy to ensure sufficient production of the anti-σ that can inhibit the σ factor when the stress is over (Busche et al., 2012).
Expression of the sigE gene is regulated by a two-component regulatory system in M. tuberculosis (Donà et al., 2008) and S. coelicolor (Hutchings et al., 2006). We detected inverted repeats in the upstream sequence of sigE in C. glutamicum (nt −41 to −31 relative to TSS), which might be a binding site for a transcriptional regulator. We tested the activity of the promoter fragment −42 to +5 and various shortened versions, including those in which the inverted repeats were missing, but did not find any significant effect of these deletions on the P1sigE activity (data not shown). Measurements in the C. glutamicum strain deficient in the two-component system CgtRS2 (homologous with the MprAB two-component system regulating sigE gene expression in M. tuberculosis; Bott and Brocker, 2012) also did not show any effect on of sigE promoter activity. We can thus conclude, that the expression of the sigE gene in C. glutamicum is most probably not controlled by two-component system.
Deletion of the anti-σΕgene cseE did not result in upregulation of the sigE gene, which is in agreement with the finding that sigE is transcribed from σΑ/σΒ-dependent promoters (Figure 4A). We previously observed an analogous situation with the sigH and rshA genes (Busche et al., 2012).
Interestingly, the transcription of cseE is driven from an σΗ/σΕ-dependent promoter (Figure 4) which suggests the cross-regulation of σΗ and σΕ. No such phenomenon was observed in the transcription of the C. glutamicum rshA gene, which was transcribed from a σΗ-specific promoter. However, a weak transcription of rshA induced in the ΔcseE strain was detected by RNA-seq (Table 3). This might also reflect an effect of indirect σΗ/σΕ cross-regulation. We speculate that σΗ and σΕ may compensate if one of the sigma factor is missing due to different growth or stress conditions or gene defect. In fact, all found σΕ-dependent genes were partially transcribed with σΗ, at least in some growth phases, due to the overlapping promoter recognition specificity. This notion is supported by the fact that sigH or sigE deletion strains are viable.
An intricate network of tightly co-regulated σΒ, σΕ, and σΗ sigma factors is documented by the fact, that σΗ and σΕ complementarily control the transcription of the sigB gene. It was possible to separately generate single sig deletions for each of these three genes; however, we were unable to isolate σΗ + σΕ double mutant in the previous studies (not shown). This double deletion is probably lethal due to the fact that these two σ factors secure too many functions in stress responses and therefore cannot be replaced by any of the three remaining C. glutamicum ECF sigma factors (σC, σD, and σΜ) which provide a limited number of activities. Moreover, σΗ and σΕ drive the transcription of sigB that also controls a wide range of functions. The σΒ-σΕ-σΗ “sigma triangle” or “Big Three” thus forms the essential basis for maintaining C. glutamicum cell viability during transition and stationary growth phases and diverse types of stress conditions. The integration of σΒ, σΕ and σΗ in an intricate regulatory network was also observed in M. tuberculosis (Raman et al., 2001; Dutta et al., 2010), Salmonella (Bang et al., 2005), and also most likely exists in R. erythropolis (Štěpánek et al., 2022).
Data availability statement
The transcriptome sequencing raw data files are available in the ArrayExpress database (www.ebi.ac.uk/arrayexpress) under accession numbers E-MTAB-12457 and E-MTAB-12458.
Author contributions
JK and MP conceived the project and led the studies performed in Bielefeld and Prague, respectively. TB, HD, LR, and VŠ carried out the most experiments. TB and HD carried out RNA-seq and processed the data. JH did the in vitro transcription assays. IB carried out in silico analyses. All authors analyzed the results. MP, TB, and JK drafted the initial manuscript. All authors contributed to the article and approved the submitted version.
Funding
This work was supported by Grant 17-06991S from the Czech Science Foundation, Mobility Grant DAAD-18-11 from the Czech Academy of Sciences (CAS), and Deutscher Akademischer Austauschdienst.
Conflict of interest
The authors declare that this work was carried out in the absence of any personal, professional, or financial relationships that could potentially be construed as a conflict of interest.
Publisher’s note
All claims expressed in this article are solely those of the authors and do not necessarily represent those of their affiliated organizations, or those of the publisher, the editors and the reviewers. Any product that may be evaluated in this article, or claim that may be made by its manufacturer, is not guaranteed or endorsed by the publisher.
Supplementary material
The Supplementary material for this article can be found online at: https://www.frontiersin.org/articles/10.3389/fmicb.2022.1059649/full#supplementary-material
References
Albersmeier, A., Pfeifer-Sancar, K., Rückert, C., and Kalinowski, J. (2017). Genome-wide determination of transcription start sites reveals new insights into promoter structures in the actinomycete Corynebacterium glutamicum. J. Biotechnol. 257, 99–109. doi: 10.1016/j.jbiotec.2017.04.008
Ao, W., Gaudet, J., Kent, W. J., Muttumu, S., and Mango, S. E. (2004). Environmentally induced foregut remodeling by PHA-4/FoxA and DAF-12/NHR. Science 305, 1743–1746. doi: 10.1126/science.1102216
Bang, I. S., Frye, J. G., McClelland, M., Velayudhan, J., and Fang, F. C. (2005). Alternative sigma factor interactions in salmonella: σE and σH promote antioxidant defences by enhancing σS levels. Mol. Microbiol. 56, 811–823. doi: 10.1111/j.1365-2958.2005.04580.x
Barreiro, C., Gonzalez-Lavado, E., Pátek, M., and Martín, J. F. (2013). Transcriptional analysis of the groES-groEL1, groEL2, and dnaK genes in Corynebacterium glutamicum: characterization of heat shock-induced promoters. J. Bacteriol. 195:2706. doi: 10.1128/JB.00344-13
Beckers, G., Strösser, J., Hildebrandt, U., Kalinowski, J., Farwick, M., Krämer, R., et al. (2005). Regulation of AmtR-controlled gene expression in Corynebacterium glutamicum: mechanism and characterization of the AmtR regulon. Mol. Microbiol. 58, 580–595. doi: 10.1111/j.1365-2958.2005.04855.x
Blumenstein, J., Rädisch, R., Štěpánek, V., Grulich, M., Dostálová, H., and Pátek, M. (2022). Identification of Rhodococcus erythropolis promoters controlled by alternative sigma factors using in vivo and in vitro systems and heterologous RNA polymerase. Curr. Microbiol. 79:55. doi: 10.1007/s00284-021-02747-8
Bott, M., and Brocker, M. (2012). Two-component signal transduction in Corynebacterium glutamicum and other corynebacteria: on the way towards stimuli and targets. Appl. Microbiol. Biotechnol. 94, 1131–1150. doi: 10.1007/s00253-012-4060-x
Brockmann-Gretza, O., and Kalinowski, J. (2006). Global gene expression during stringent response in Corynebacterium glutamicum in presence and absence of the rel gene encoding (p)ppGpp synthase. BMC Genomics 7:230. doi: 10.1186/1471-2164-7-230
Busche, T., Šilar, R., Pičmanová, M., Pátek, M., and Kalinowski, J. (2012). Transcriptional regulation of the operon encoding stress-responsive ECF sigma factor SigH and its anti-sigma factor RshA, and control of its regulatory network in Corynebacterium glutamicum. BMC Genomics 13:445. doi: 10.1186/1471-2164-13-445
Campagne, S., Marsh, M. E., Capitani, G., Vorholt, J. A., and Allain, F. H. (2014). Structural basis for −10 promoter element melting by environmentally induced sigma factors. Nat. Struct. Mol. Biol. 21, 269–276. doi: 10.1038/nsmb.2777
Crooks, G. E., Hon, G., Chandonia, J. M., and Brenner, S. E. (2004). WebLogo: a sequence logo generator. Genome Res. 14, 1188–1190. doi: 10.1101/gr.849004
Donà, V., Rodrigue, S., Dainese, E., Palù, G., Gaudreau, L., Manganelli, R., et al. (2008). Evidence of complex transcriptional, translational, and posttranslational regulation of the extracytoplasmic function sigma factor σE in mycobacterium tuberculosis. J. Bacteriol. 190, 5963–5971. doi: 10.1128/JB.00622-08
Dostálová, H., Busche, T., Holátko, J., Rucká, L., Štěpánek, V., Barvík, I., et al. (2019). Overlap of promoter recognition specificity of stress response sigma factors SigD and SigH in Corynebacterium glutamicum ATCC 13032. Front. Microbiol. 9:3287. doi: 10.3389/fmicb.2018.03287
Dostálová, H., Holátko, J., Busche, T., Rucká, L., Rapoport, A., Halada, P., et al. (2017). Assignment of sigma factors of RNA polymerase to promoters in Corynebacterium glutamicum. AMB Express 7:133. doi: 10.1186/s13568-017-0436-8
Dutta, N. K., Mehra, S., and Kaushal, D. (2010). A mycobacterium tuberculosis sigma factor network responds to cell-envelope damage by the promising anti-mycobacterial thioridazine. PLoS One 5:e10069. doi: 10.1371/journal.pone.0010069
Ehira, S., Shirai, T., Teramoto, H., Inui, M., and Yukawa, H. (2008). Group 2 sigma factor SigB of Corynebacterium glutamicum positively regulates glucose metabolism under conditions of oxygen deprivation. Appl. Environ. Microbiol. 74, 5146–5152. doi: 10.1128/AEM.00944-08
Ehira, S., Teramoto, H., Inui, M., and Yukawa, H. (2009). Regulation of Corynebacterium glutamicum heat shock response by the extracytoplasmic-function sigma factor SigH and transcriptional regulators HspR and HrcA. J. Bacteriol. 191, 2964–2972. doi: 10.1128/JB.00112-09
Engels, S., Schweitzer, J. E., Ludwig, C., Bott, M., and Schaffer, S. (2004). clpC and clpP1P2 gene expression in Corynebacterium glutamicum is controlled by a regulatory network involving the transcriptional regulators ClgR and HspR as well as the ECF sigma factor σH. Mol. Microbiol. 52, 285–302. doi: 10.1111/j.1365-2958.2003.03979.x
Fang, C., Li, L., Shen, L., Shi, J., Wang, S., Feng, Y., et al. (2019). Structures and mechanism of transcription initiation by bacterial ECF factors. Nucleic Acids Res. 47, 7094–7104. doi: 10.1093/nar/gkz470
Green, M. R., and Sambrook, J. (2012). Molecular Cloning: A Laboratory Manual. Cold Spring Harbor, NY: Cold Spring Harbor Laboratory Press.
Guo, X., Myasnikov, A. G., Chen, J., Crucifix, C., Papai, G., Takacs, M., et al. (2018). Structural basis for NusA stabilized transcriptional pausing. Mol. Cell 69, 816.e4– 827.e4. doi: 10.1016/j.molcel.2018.02.008
Halgasova, N., Bukovska, G., Ugorcakova, J., Timko, J., and Kormanec, J. (2002). The Brevibacterium flavum sigma factor SigB has a role in the environmental stress response. FEMS Microbiol. Lett. 216, 77–84. doi: 10.1111/j.1574-6968.2002.tb11418.x
Hanahan, D. (1985). “Techniques for transformation of E. coli,” in DNA Cloning. A Practical Approach. Vol. 1. ed. D. M. Glover (Oxford, United Kingdom: IRL), 109–135.
Hilker, R., Stadermann, K. B., Doppmeier, D., Kalinowski, J., Stoye, J., and Straube, J. (2014). ReadXplorer–visualization and analysis of mapped sequences. Bioinformatics 30, 2247–2254. doi: 10.1093/bioinformatics/btu205
Hilker, R., Stadermann, K. B., Schwengers, O., Anisiforov, E., Jaenicke, S., Weisshaar, B., et al. (2016). ReadXplorer 2-detailed read mapping analysis and visualization from one single source. Bioinformatics 32, 3702–3708. doi: 10.1093/bioinformatics/btw541
Holátko, J., Šilar, R., Rabatinová, A., Šanderová, H., Halada, P., Nešvera, J., et al. (2012). Construction of in vitro transcription system for Corynebacterium glutamicum and its use in the recognition of promoters of different classes. Appl. Microbiol. Biotechnol. 96, 521–529. doi: 10.1007/s00253-012-4336-1
Hünnefeld, M., Persicke, M., Kalinowski, J., and Frunzke, J. (2019). The MarR-type regulator MalR is involved in stress-responsive cell envelope remodeling in Corynebacterium glutamicum. Front. Microbiol. 10:1039. doi: 10.3389/fmicb.2019.01039
Hutchings, M. I., Hong, H. J., Leibovitz, E., Sutcliffe, I. C., and Buttner, M. J. (2006). The σE cell envelope stress response of Streptomyces coelicolor is influenced by a novel lipoprotein, CseA. J. Bacteriol. 188, 7222–7229. doi: 10.1128/JB.00818-06
Keilhauer, C., Eggeling, L., and Sahm, H. (1993). Isoleucine synthesis in Corynebacterium glutamicum: molecular analysis of the ilvB-ilvN-ilvC operon. J. Bacteriol. 175, 5595–5603. doi: 10.1128/jb.175.17.5595-5603.1993
Kirchner, O., and Tauch, A. (2003). Tools for genetic engineering in the amino acid-producing bacterium Corynebacterium glutamicum. J. Biotechnol. 104, 287–299. doi: 10.1016/s0168-1656(03)00148-2
Knoppová, M., Phensaijai, M., Veselý, M., Zemanová, M., Nešvera, J., and Pátek, M. (2007). Plasmid vectors for testing in vivo promoter activities in Corynebacterium glutamicum and Rhodococcus erythropolis. Curr. Microbiol. 55, 234–239. doi: 10.1007/s00284-007-0106-1
Lane, W. J., and Darst, S. A. (2006). The structural basis for promoter −35 element recognition by the group IV σ factors. PLoS Biol. 4:e269. doi: 10.1371/journal.pbio.0040269
Lardi, M., Aguilar, C., Pedrioli, A., Omasits, U., Suppiger, A., Cárcamo-Oyarce, G., et al. (2015). σ54-dependent response to nitrogen limitation and virulence in Burkholderia cenocepacia strain H111. Appl. Environ. Microbiol. 81, 4077–4089. doi: 10.1128/AEM.00694-15
Larisch, C., Nakunst, D., Huser, A. T., Tauch, A., and Kalinowski, J. (2007). The alternative sigma factor SigB of Corynebacterium glutamicum modulates global gene expression during transition from exponential growth to stationary phase. BMC Genomics 8:4. doi: 10.1186/1471-2164-8-4
Love, M. I., Huber, W., and Anders, S. (2014). Moderated estimation of fold change and dispersion for RNA-seq data with DESeq2. Genome Biol. 15:550. doi: 10.1186/s13059-014-0550-8
Manganelli, R., and Provvedi, R. (2010). An integrated regulatory network including two positive feedback loops to modulate the activity of σE in mycobacteria. Mol. Microbiol. 75, 538–542. doi: 10.1111/j.1365-2958.2009.07009.x
Manganelli, R., Voskuil, M. I., Schoolnik, G. K., Dubnau, E., Gomez, M., and Smith, I. (2002). Role of the extracytoplasmic-function σ factor σH in mycobacterium tuberculosis global gene expression. Mol. Microbiol. 45, 365–374. doi: 10.1046/j.1365-2958.2002.03005.x
Manganelli, R., Voskuil, M. I., Schoolnik, G. K., and Smith, I. (2001). The mycobacterium tuberculosis ECF sigma factor σE: role in global gene expression and survival in macrophages. Mol. Microbiol. 41, 423–437. doi: 10.1046/j.1365-2958.2001.02525.x
Mehra, S., Golden, N. A., Stuckey, K., Didier, P. J., Doyle, L. A., Russell-Lodrigue, K. E., et al. (2012). The mycobacterium tuberculosis stress response factor sigH is required for bacterial burden as well as immunopathology in primate lungs. J. Infect. Dis. 205, 1203–1213. doi: 10.1093/infdis/jis102
Montero, I. G., Dolata, K. M., Schlüter, R., Malherbe, G., Sievers, S., Zühlke, D., et al. (2019). Comparative proteome analysis in an Escherichia coli CyDisCo strain identifies stress responses related to protein production oxidative stress and accumulation of misfolded protein. Microb. Cell Factories 18:19. doi: 10.1186/s12934-019-1071-7
Paget, M. S., Kang, J. G., Roe, J. H., and Buttner, M. J. (1998). sigmaR, an RNA polymerase sigma factor that modulates expression of the thioredoxin system in response to oxidative stress in Streptomyces coelicolor A3(2). EMBO J. 17, 5776–5782. doi: 10.1093/emboj/17.19.5776
Park, J. H., Lee, J. H., and Roe, J. H. (2019). SigR, a hub of multilayered regulation of redox and antibiotic stress responses. Mol. Microbiol. 112, 420–431. doi: 10.1111/mmi.14341
Park, S. D., Youn, J. W., Kim, Y. J., Lee, S. M., Kim, Y., and Lee, H. S. (2008). Corynebacterium glutamicum σE is involved in responses to cell surface stresses and its activity is controlled by the anti-sigma factor CseE. Microbiology 154, 915–923. doi: 10.1099/mic.0.2007/012690-0
Pátek, M., Holátko, J., Busche, T., Kalinowski, J., and Nešvera, J. (2013). Corynebacterium glutamicum promoters: a practical approach. Microb. Biotechnol. 6, 103–117. doi: 10.1111/1751-7915.12019
Pátek, M., and Nešvera, J. (2011). Sigma factors and promoters in Corynebacterium glutamicum. J. Biotechnol. 154, 101–113. doi: 10.1016/j.jbiotec.2011.01.017
Pfeifer-Sancar, K., Mentz, A., Rückert, C., and Kalinowski, J. (2013). Comprehensive analysis of the Corynebacterium glutamicum transcriptome using an improved RNAseq technique. BMC Genomics 14:888. doi: 10.1186/1471-2164-14-888
Prajapati, B., Bernal-Cabasa, M., López-Álvarez, M., Schaffer, M., Bartel, J., Rath, H., et al. (2021). Double trouble: bacillus depends on a functional tat machinery to avoid severe oxidative stress and starvation upon entry into a NaCl-depleted environment. Biochimica et Biophysica Acta (BBA) - molecular. Cell Res. 1868:118914. doi: 10.1016/j.bbamcr.2020.118914
Raman, S., Song, T., Puyang, X., Bardarov, S., Jacobs, W. R. Jr., and Husson, R. N. (2001). The alternative sigma factor SigH regulates major components of oxidative and heat stress responses in mycobacterium tuberculosis. J. Bacteriol. 183, 6119–6125. doi: 10.1128/JB.183.20.6119-6125.2001
Rodrigue, S., Provvedi, R., Jacques, P. E., Gaudreau, L., and Manganelli, R. (2006). The σ factors of mycobacterium tuberculosis. FEMS Microbiol. Rev. 30, 926–941. doi: 10.1111/j.1574-6976.2006.00040.x
Rogers, A. R., Turner, E. E., Johnson, D. T., and Ellermeier, J. R. (2022). Envelope stress activates expression of the twin arginine translocation (tat) system in salmonella. Microbiol. Spectr. 29:e0162122. doi: 10.1128/spectrum.01621-22
Ross, W., Thompson, J. F., Newlands, J. T., and Gourse, R. L. (1990). E.coli Fis protein activates ribosomal RNA transcription in vitro and in vivo. EMBO J. 9, 3733–3742. doi: 10.1002/j.1460-2075.1990.tb07586.x
Salomon-Ferrer, R., Gotz, A. W., Poole, D., Le Grand, S., and Walker, R. C. (2013). Routine microsecond molecular dynamics simulations with AMBER on GPUs. 2. Explicit solvent particle mesh Ewald. J. Chem. Theory Comput. 9, 3878–3888. doi: 10.1021/ct400314y
Sharp, J. D., Singh, A. K., Park, S. T., Lyubetskaya, A., Peterson, M. W., Gomes, A. L., et al. (2016). Comprehensive definition of the SigH regulon of mycobacterium tuberculosis reveals transcriptional control of diverse stress responses. PLoS One 11:e0152145. doi: 10.1371/journal.pone.0152145
Song, T., Song, S.-E., Raman, S., Anaya, M., and Husson, R. N. (2008). Critical role of a single position in the −35 element for promoter recognition by mycobacterium tuberculosis SigE and SigH. J. Bacteriol. 190, 2227–2230. doi: 10.1128/JB.01642-07
Šilar, R., Holátko, J., Rucká, L., Rapoport, A., Dostálová, H., Kadeřábková, P., et al. (2016). Use of in vitro transcription system for analysis of Corynebacterium glutamicum promoters recognized by two sigma factors. Curr. Microbiol. 73, 401–408. doi: 10.1007/s00284-016-1077-x
Štěpánek, V., Dostálová, H., Busche, T., Blumenstein, J., Grulich, M., Plašil, L., et al. (2022). Sigma regulatory network in Rhodococcus erythropolis CCM2595. FEMS Microbiol. Lett. 369:fnac014. doi: 10.1093/femsle/fnac014
Taniguchi, H., Busche, T., Patschkowski, T., Niehaus, K., Pátek, M., Kalinowski, J., et al. (2017). Physiological roles of sigma factor SigD in Corynebacterium glutamicum. BMC Microbiol. 17:158. doi: 10.1186/s12866-017-1067-6
Tauch, A., Kirchner, O., Löffler, B., Gotker, S., Pühler, A., and Kalinowski, J. (2002). Efficient electrotransformation of Corynebacterium diphtheriae with a mini-replicon derived from the Corynebacterium glutamicum plasmid pGA1. Curr. Microbiol. 45, 362–367. doi: 10.1007/s00284-002-3728-3
Thakur, K. G., Praveena, T., and Gopal, B. (2010). Structural and biochemical bases for the redox sensitivity of mycobacterium tuberculosis RslA. J. Mol. Biol. 397, 1199–1208. doi: 10.1016/j.jmb.2010.02.026
Toyoda, K., Teramoto, H., Yukawa, H., and Inui, M. (2015). Expanding the regulatory network governed by the extracytoplasmic function sigma factor σH in Corynebacterium glutamicum. J. Bacteriol. 197, 483–496. doi: 10.1128/JB.02248-14
Tran, N. T., Huang, X., Hong, H. J., Bush, M. J., Chandra, G., Pinto, D., et al. (2019). Defining the regulon of genes controlled by σE, a key regulator of the cell envelope stress response in Streptomyces coelicolor. Mol. Microbiol. 112, 461–481. doi: 10.1111/mmi.14250
Vašicová, P., Abrhámová, Z., Nešvera, J., Pátek, M., Sahm, H., and Eikmanns, B. (1998). Integrative and autonomously replicating vectors for analysis of promoters in Corynebacterium glutamicum. Biotechnl. Tech. 12, 743–746.
Waterhouse, A., Bertoni, M., Bienert, S., Studer, G., Tauriello, G., Gumienny, R., et al. (2018). SWISS-MODEL: homology modelling of protein structures and complexes. Nucleic Acids Res. 46, W296–W303. doi: 10.1093/nar/gky427
Wittchen, M., Busche, T., Gaspar, A. H., Lee, J. H., Ton-That, H., Kalinowski, J., et al. (2018). Transcriptome sequencing of the human pathogen Corynebacterium diphtheriae NCTC 13129 provides detailed insights into its transcriptional landscape and into DtxR-mediated transcriptional regulation. BMC Genomics 19:82. doi: 10.1186/s12864-018-4481-8
Keywords: Corynebacterium, sigma factor, regulon, promoter, stress, consensus sequence, transcriptional start site, RNA-seq
Citation: Busche T, Dostálová H, Rucká L, Holátko J, Barvík I, Štěpánek V, Pátek M and Kalinowski J (2023) Overlapping SigH and SigE sigma factor regulons in Corynebacterium glutamicum. Front. Microbiol. 13:1059649. doi: 10.3389/fmicb.2022.1059649
Edited by:
Hari S. Misra, Bhabha Atomic Research Centre (BARC), IndiaReviewed by:
Marc Bramkamp, University of Kiel, GermanyMeike Baumgart, Institute of Bio- and Geosciences, IBG-1: Biotechnology, Germany
Kei Asai, Tokyo University of Agriculture, Japan
Copyright © 2023 Busche, Dostálová, Rucká, Holátko, Barvík, Štěpánek, Pátek and Kalinowski. This is an open-access article distributed under the terms of the Creative Commons Attribution License (CC BY). The use, distribution or reproduction in other forums is permitted, provided the original author(s) and the copyright owner(s) are credited and that the original publication in this journal is cited, in accordance with accepted academic practice. No use, distribution or reproduction is permitted which does not comply with these terms.
*Correspondence: Tobias Busche, tbusche@cebitec.uni-bielefeld.de; Miroslav Pátek, patek@biomed.cas.cz