 Xiayu He1,2
 Lijuan Long
 Sijun Huang
- 1Key Laboratory of Tropical Marine Bio-resources and Ecology, South China Sea Institute of Oceanology, Chinese Academy of Sciences, Guangzhou, China
- 2College of Earth and Planetary Sciences, University of Chinese Academy of Sciences, Huairou, Beijing, China
- 3Southern Marine Science and Engineering Guangdong Laboratory (Guangzhou), Guangzhou, China
Prochlorococcus is an obligate marine microorganism and the dominant autotroph in tropical and subtropical open ocean. However, the salinity range for growing and response to low salinity exposure of Prochlorococcus are still unknown. In this study, we found that low-light adapted Prochlorococcus stain NATL1A and high-light adapted strain MED4 could be acclimated in the lowest salinity of 25 and 28 psu, respectively. Analysis of the effective quantum yield of PSII photochemistry (Fv/Fm) indicated that both strains were stressed when growing in salinity lower than 34 psu. We then compared the global transcriptome of low salinity (28 psu) acclimated cells and cells growing in normal seawater salinity (34 psu). The transcriptomic responses of NATL1A and MED4 were approximately different, with more differentially expressed genes in NATL1A (525 genes) than in MED4 (277 genes). To cope with low salinity, NATL1A down-regulated the transcript of genes involved in translation, ribosomal structure and biogenesis and ATP-production, and up-regulated photosynthesis-related genes, while MED4 regulated these genes in an opposite way. In addition, both strains up-regulated an iron ABC transporter gene, idiA, suggesting low salinity acclimated cells could be iron limited. This study demonstrated the growing salinity range of Prochlorococcus cells and their global gene expression changes due to low salinity stress.
Introduction
Cyanobacterium Prochlorococcus is the smallest and most abundant photosynthetic, oxygen-evolving organism on Earth, playing a significant role in carbon fixation and biogeochemical cycles in the ocean (Guillard et al., 1985; Goericke and Welschmeyer, 1993; Liu et al., 1997). The prokaryotic Prochlorococcus cells contain divinyl-chlorophyll a and both monovinyl and divinyl-chlorophyll b as their primary photosynthetic pigments, which are unique to other cyanobacteria that contain chlorophyll a and phycobiliprotein (Chisholm et al., 1992; Hess et al., 1996). Prochlorococcus is believed to be an obligate marine organism that is predominantly found in oligotrophic open oceans, as well as in some coastal waters, but barely seen in low salinity estuarine waters (Flombaum et al., 2013). Prochlorococcus thrives throughout the euphotic zone in the tropical and subtropical oceans from 45° N to 40° S (Scanlan et al., 2009). This genus of marine picocyanobacteria is divided into high-light (HL) adapted and low-light (LL) adapted ecotypes, which are also phylogenetically distinct (Ferris and Palenik, 1998; Moore and Chisholm, 1999). HL ecotypes are usually distributed in upper euphotic zone, while LL ecotypes are generally distributed in the lower to bottom euphotic zone (Johnson et al., 2006; Zinser et al., 2007). Besides the light-related niche partitioning of HL and LL ecotypes, two HL ecotypes, HLI and HLII, also display temperature-related niche partitioning that HLII ecotypes dominate the warmer oceans between 30° N and 30° S while HLI ecotypes dominate the higher latitude oceans (West et al., 2001; Rocap et al., 2003; Mühling, 2012; Voigt et al., 2014). Despite comprising diverse phylogenetic lineages, Prochlorococcus is monophyletic on the phylogenetic tree built on 16S rRNA sequences of cyanobacteria (Rocap et al., 2002). Synechococcus is the sister genus of Prochlorococcus. However, Synechococcus is a provisional genus containing polyphyletic clusters which are scattering on the phylogenetic tree of cyanobacteria (Robertson et al., 2001). Marine Synechococcus is affiliated with cluster 5, which comprises subclusters 5.1, 5.2 and 5.3. In contrast to Prochlorococcus, marine Synechococcus is much more widely distributed, existing from estuary to open ocean and from equatorial to polar regions (Partensky et al., 1999; Zwirglmaier et al., 2008).
Salinity is a crucial factor affecting the growth and biogeography of cyanobacteria (Scanlan et al., 2009). There were plenty of studies on cyanobacteria’s salt acclimation and salt stress response (Hagemann, 2011). However, most of those studies were conducted mainly on freshwater cyanobacteria such as the euryhaline Synechococcus strain PCC 7002 and moderately halotolerant Synechocystis strain PCC 6803 rather than typical marine cyanobacteria such as Prochlorococcus or marine Synechococcus (Hagemann, 2011). For example, when growing at high salinity, Synechococcus PCC 7002 had increased expression of genes involved in compatible solute biosynthesis and electron transport, while only minor changes were observed when cells were grown at low salinity (Ludwig and Bryant, 2012). It also has been revealed that 200–300 genes were up-regulated and a comparable number of genes were down-regulated after the addition of salt in Synechocystis PCC 6803 (Kanesaki et al., 2002; Marin et al., 2003). Secondly, very few studies focus on the acclimation and stress response of marine cyanobacteria to low salinity. Lastly, compared to Synechococcus, salinity-related physiological studies on Prochlorococcus are even more seldom. A recent study showed that Prochlorococcus strain AS9601 could be acclimated to a high salt concentration of 5% (w/v; Al-Hosani et al., 2015). The authors compared the growth rate and transcriptome of AS9601 at salinities 3.8% (w/v) and 5% (w/v), and found that, under high salt concentration, approximately one-third of the genome expressed differentially.
The strict biogeographic distribution of Prochlorococcus in oceanic waters suggests that this organism cannot be adapted to low salinity. However, what is the lowest salinity that Prochlorococcus can survive and what is the stress response of Prochlorococcus cells to low salinity are still unclear. In this study we first tested the salinity range of two Prochlorococcus strains, NATL1A and MED4, and then acclimatized the two strains under different salinities. We found that the lowest acclimation salinity is 25 psu for MED4 and 28 psu for NATL1A. Both NATL1A and MED4 cells were stressed when growing in salinities lower than 34 psu. We also found that the transcriptomic response of the two strains to low salinity stress were highly different.
Materials and methods
Strains and growth conditions
Prochlorococcus strains MED4 and NATL1A were obtained from Jiao Nianzhi Lab, Xiamen University. Cultures were maintained in Pro99 natural seawater medium with a salinity of 34 psu, at 21°C and under a constant light intensity of 10 μE m−2 s−1. We used canted neck polystyrene flasks (Corning Inc., Corning, NY, United States) of different volumes to culture the Prochlorococcus strains.
Experiment setup and growth rate calculation
Preparation of Pro99 medium followed the protocol from the Chisholm Laboratory.1 The seawater from the South China Sea basin was filtered through 0.22 μm polycarbonate membrane, and the salinity was pre-adjusted to 22 psu ~ 60 psu with a 2 psu interval using ddH2O or NaCl. Salinity was measured using an ATAGO PAL-06S refractometer (ATAGO, Japan). These seawaters were autoclaved at 121°C for 15 min. Macronutrient (NH4Cl and NaH2PO4) stocks and the trace metal stock were prepared in advance, and they were added into the above seawater base. Prochlorococcus cultures growing in the Pro99 medium of salinity 34 psu were inoculated into the salinity gradient mediums. The salinity was finally adjusted to 22 psu ~ 60 psu using the ddH2O with Pro99 nutrients. Prochlorococcus growth was monitored every day for 2 weeks by measuring the OD440 absorbance using a multimode plate reader (PerkinElmer, Waltham, MA, United States) and measuring the cell abundance using a flow cytometer (BD Accuri C6, BD Biosciences, CA, United States). Three biological replicates were set up for the experiment. Growth rate was calculated based on the two monitoring methods, respectively. Growth rate was calculated according to Mackey et al. (2013): Td = Ln (Ni + 1/Ni), Ni + 1 is the number of cells on day i + 1, Ni is the number of cells on day i, Td is the growth rate of cells. The average growth rate of cells was calculated during the logarithmic phase.
Low salinity acclimation
Prochlorococcus strains MED4 and NATL1A were acclimated to different salinities (24 psu, 25 psu, 26 psu, 27 psu, 28 psu, 30 psu, 32 psu, 34 psu) by consecutive transfers from exponential growing cultures to fresh media. Three biological replicates were set up for each salinity. Five rounds of transfer were conducted for each strain. Using flow cytometry, cell abundance was monitored at day 0, day 5 and day 10. To assess the stress to low salinity, each strain’s dark-adapted photochemical efficiency (Fv/Fm) was monitored on day 10 in each round, using a handheld fluorometer (AquaPen AP 110/C, Photon Systems Instruments). To measure Fv/Fm, 1 ml culture was dark-adapted in the sample cuvette for 15–30 min. The maximal fluorescence levels (Fm) were measured in the dark and under bright purple light (455 nm, 100 μEm−2 s−1), where F0 is the basal fluorescence level and Fv is the variable fluorescence. The PSII quantum yield was calculated as Fv/Fm = (Fm–F0)/Fm.
RNAseq analysis
To acclimate the Prochlorococcus strains, MED4 and NATL1A were growing in the Pro99 medium of salinity 28 psu and 34 psu for five rounds of inoculation. Then the acclimated cultures were inoculated in fresh medium of salinity 28 psu and 34 psu, with salinity 34 psu being the control. Three biological replicates were set up. During the exponential growth phase, 100 ml cultures were filtered onto 0.22 μm polycarbonate membrane to collect cells and the membranes were immediately flash frozen in RNAlater by liquid nitrogen and stored at −80°C until RNA extraction. Total RNA was extracted from the membrane using the MagZol Reagent (Magen Biotech, Guangzhou, China). Sequencing libraries were prepared using VAHTS™ Stranded mRNA-seq Library Prep Kit for Illumina® (Vazyme biotech co., Ltd., Nanjing, China) following the manufacturer’s instructions. Libraries were multiplexed and sequencing was carried out on an Illumina HiSeq system with the 2 × 150 paired-end (PE) configuration (GENEWIZ). Cutadapt (v1. 9. 1) was used to remove adapters, primers, and reads with a base quality <20 based on FASTQ files. Clean data were aligned to the MED4 and NATL1A genomes via Bowtie2 software (v2. 1. 0). HTSeq (v0. 6. 1p1) was used to estimate gene expression levels from clean data. Differential expression analysis was performed using the DESeq Bioconductor package, a model based on negative binomial distribution. After adjusting using Benjamini and Hochberg’s approach for controlling the false discovery rate, differentially expressed genes were considered significant at value of p < 0.05. Highly induced or suppressed genes were considered as meeting both false discovery rate p < 0.05 and magnitude of log2fold change with values greater than 1 (highly induced) or less than −1 (highly suppressed). These two different criterions were also used in a previous study (Al-Hosani et al., 2015). Transcriptomic data have been deposited in NCBI Gene Expression Omnibus (GEO) under the accession number GSE195946.
Results and discussion
Salinity range and acclimation to low salinity of Prochlorococcus
High-light adapted Prochlorococcus strain MED4 and low-light adapted strain NATL1A were tested for growth in different salinities ranging from 22 psu to 60 psu. Cell counting through flow cytometry (Figure 1A) and absorbance measurement at 440 nm (Figure 1B) were used to monitor the growth of Prochlorococcus cells. MED4 could grow in the salinity range from 22 psu to 50 psu and NATL1A could grow in the range from 26 psu to 50 psu. The optimal salinity ranges of MED4 and NATL1A were similar, from 30 psu to 40 psu. This result came from the first transfer of cultures from salinity 34 psu to other salinities. Under the same growing temperature (21°C) and light intensity (10 μE m−2 s−1), the LL strain NATL1A grew faster than the HL strain MED4.
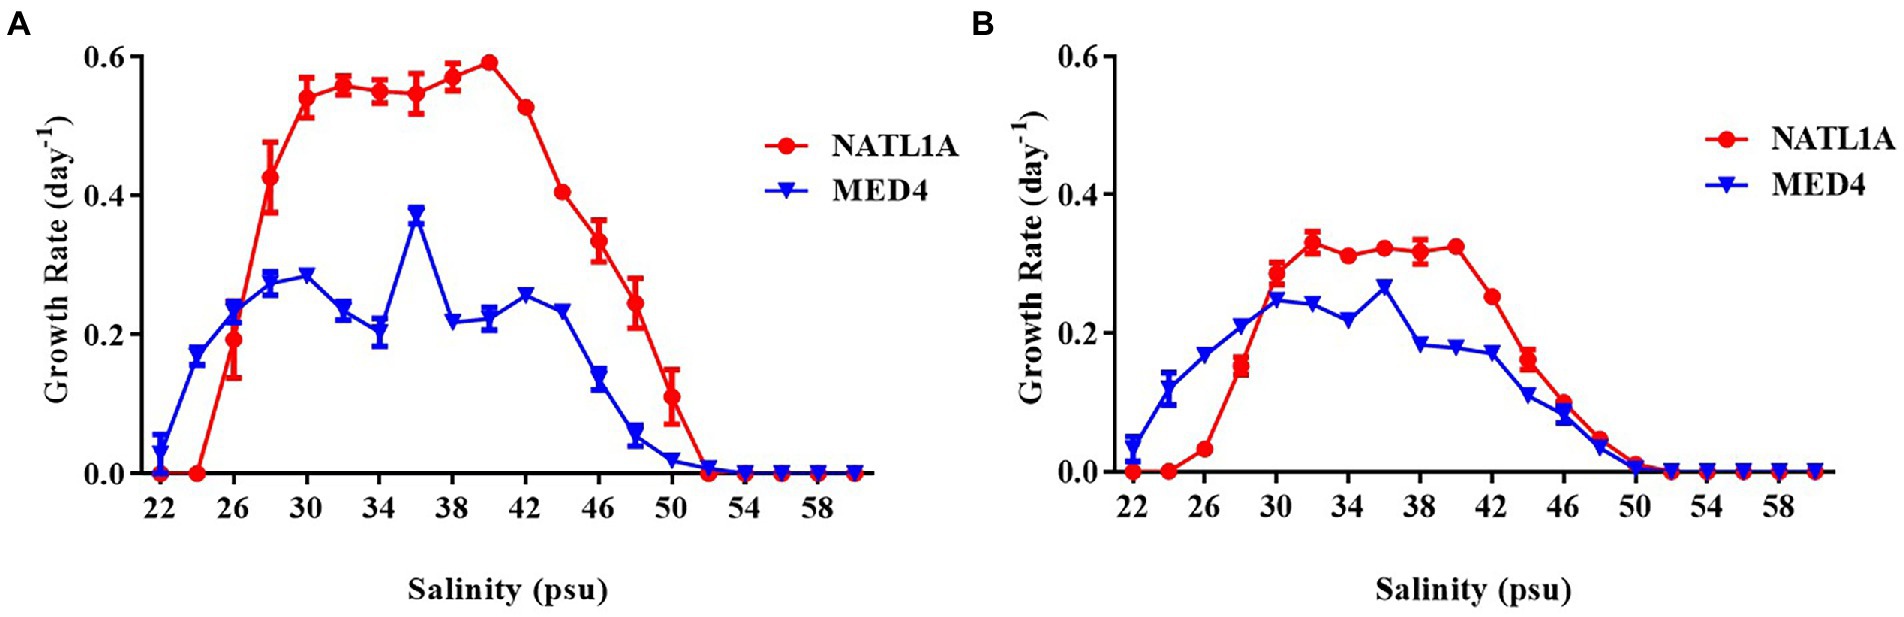
Figure 1. Growth rate of Prochlorococcus strains NATL1A and MED4 growing in Pro99 medium with salinities from 22 psu to 60 psu. Flow cytometry (A) and absorbance (OD440) measurement of chlorophyll (B) were used to monitor growth.
During the acclimation experiment, NATL1A could grow in salinities higher than 26 psu in the first round, but could not survive in salinity lower than 28 psu in the last round (Figure 2B). Interestingly, MED4 showed a gradually changing growth rate in the salinity gradient from 25 psu to 28 psu, while NATL1A showed a sharp change between salinity 27 psu and salinity 28 psu (Figures 2C,D). The effective quantum yield of PSII photochemistry (Fv/Fm) was measured on the 10th day at the end of each incubation round (Figure 3). Both strains showed reduced yield when growing in low salinities from 24 psu to 32 psu, compared to the yield when growing in salinity 34 psu, and the lower the salinity resulted in lower yield. The yield of MED4 growing in salinity 24 psu was not detectable after round 4, while the yield of NATL1A growing in salinities 27 psu and below was not detectable after round 2. Together, these data showed that Prochlorococcus MED4 and NATL1A could be acclimated in salinities 25 psu and 28 psu, respectively. Interesting, the high-light adapted strain MED4 and low-light adapted strain NATL1A showed different tolerance to low salinity.
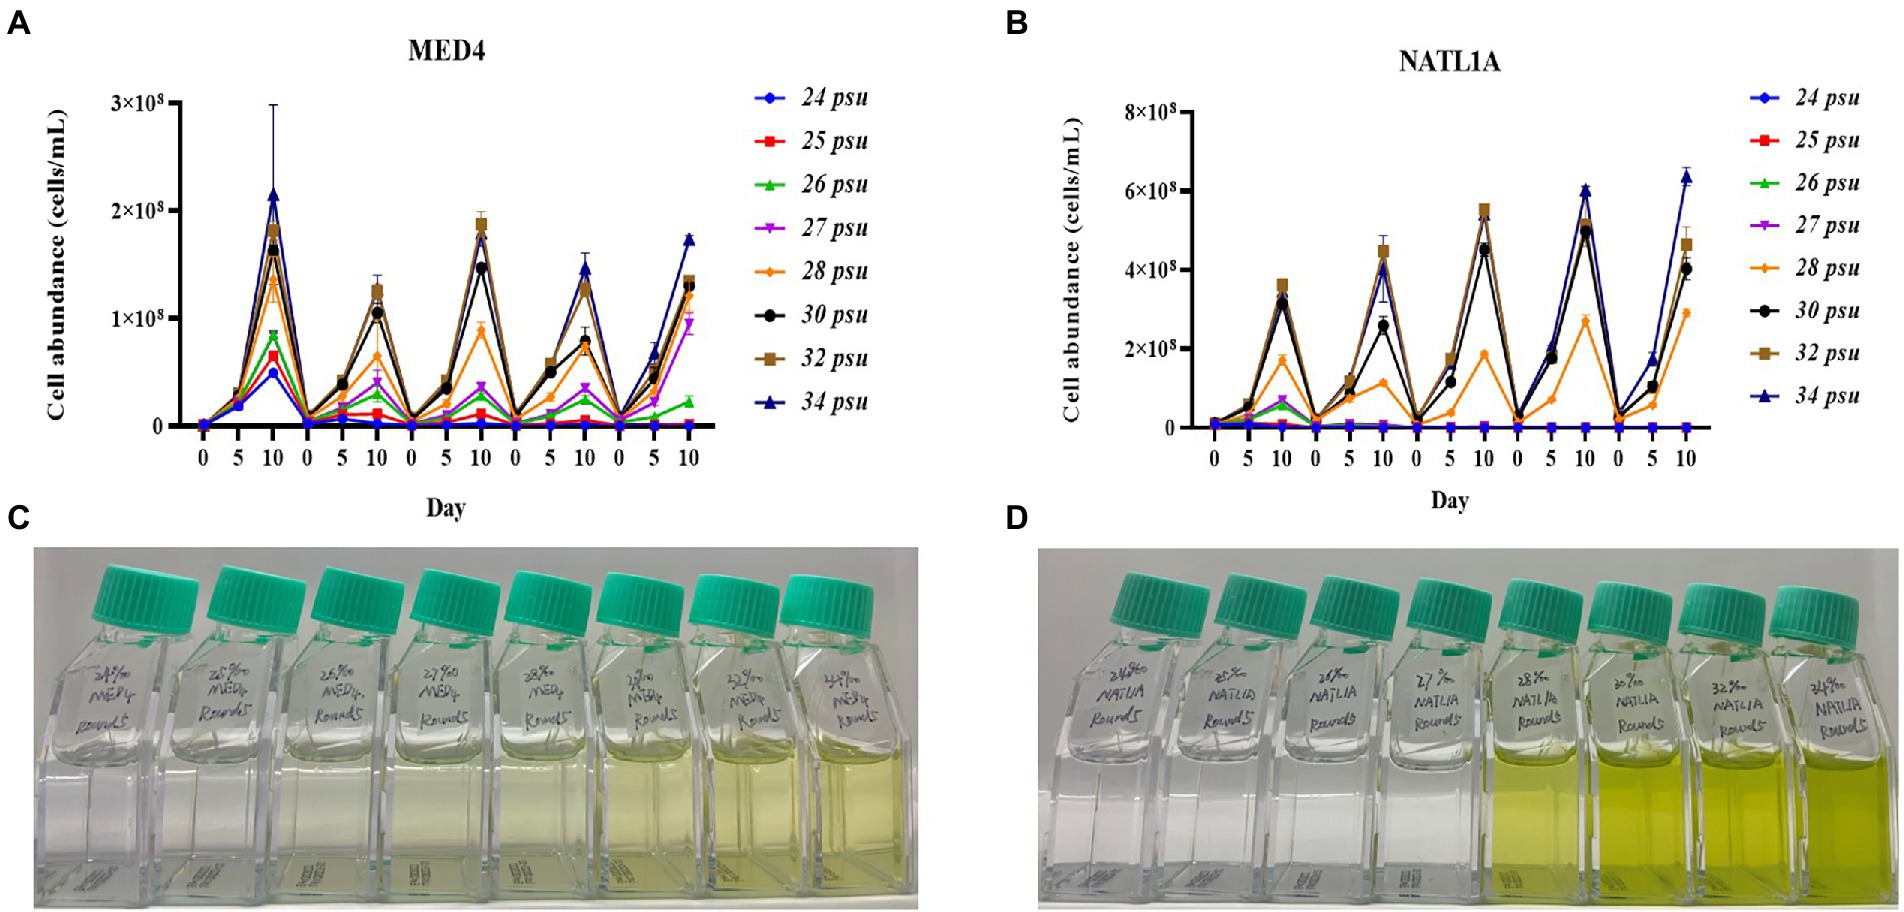
Figure 2. Acclimation of Prochlorococcus strains NATL1A and MED4 in different salinities. Five rounds of transfers were carried out and the growth (A,B) were monitored by flow cytometry. The pictures (C,D) showed the last round of cultures.
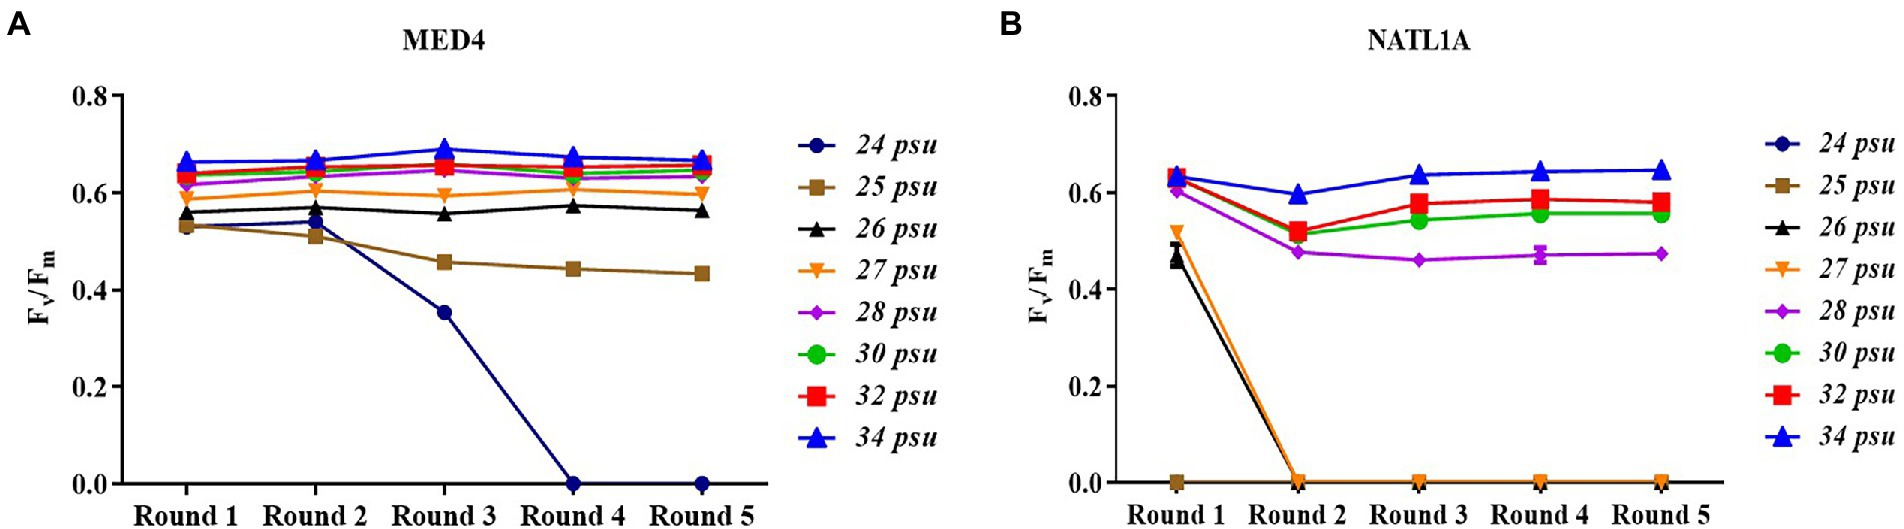
Figure 3. Dark-adapted photochemical efficiency (Fv/Fm) of Prochlorococcus strains MED4 (A) and NATL1A (B) growing in different salinities during acclimation.
It is well known that Prochlorococcus is an oceanic microorganism (Partensky et al., 1999), although a few studies claimed that Prochlorococcus-like populations existed in estuarine and even freshwater environments (Corzo et al., 1999; Shang et al., 2007; Mitbavkar et al., 2012; Zhang et al., 2013). However, these studies all only depended on flow cytometry investigation, and could not confirm that those “populations” on the flow cytometry diagram were indeed Prochlorococcus. Our acclimation study suggests that Prochlorococcus cannot live in salinity lower than 25 psu for a long time period (50 days in this study). This study provides evidence supporting that Prochlorococcus is an oceanic organism.
Differentially expressed genes in low salinity acclimated Prochlorococcus cells
RNA-seq was performed to assess the response of acclimated Prochlorococcus cells to low salinity (28 psu), with the salinity 34 psu being the control. When the filter criteria of significance meet the value of p < 0.05, there were 525 differentially expressed genes in the low salinity acclimated cells of NATL1A, with 286 genes being induced and 239 genes being repressed (Table 1). By contrast, MED4 appears to be less fluctuant under low salinity stress, with only 277 differentially expressed genes, among which 146 were induced and 131 were repressed (Table 1). A previous study compared the transcriptomes of Prochlorococcus AS9601 under high salt stress (5.0%) and under normal salt concentration (3.8%), and found 627 differentially expressed genes (Al-Hosani et al., 2015). Together, these results suggest that Prochlorococcus is sensitive to salinity changes.
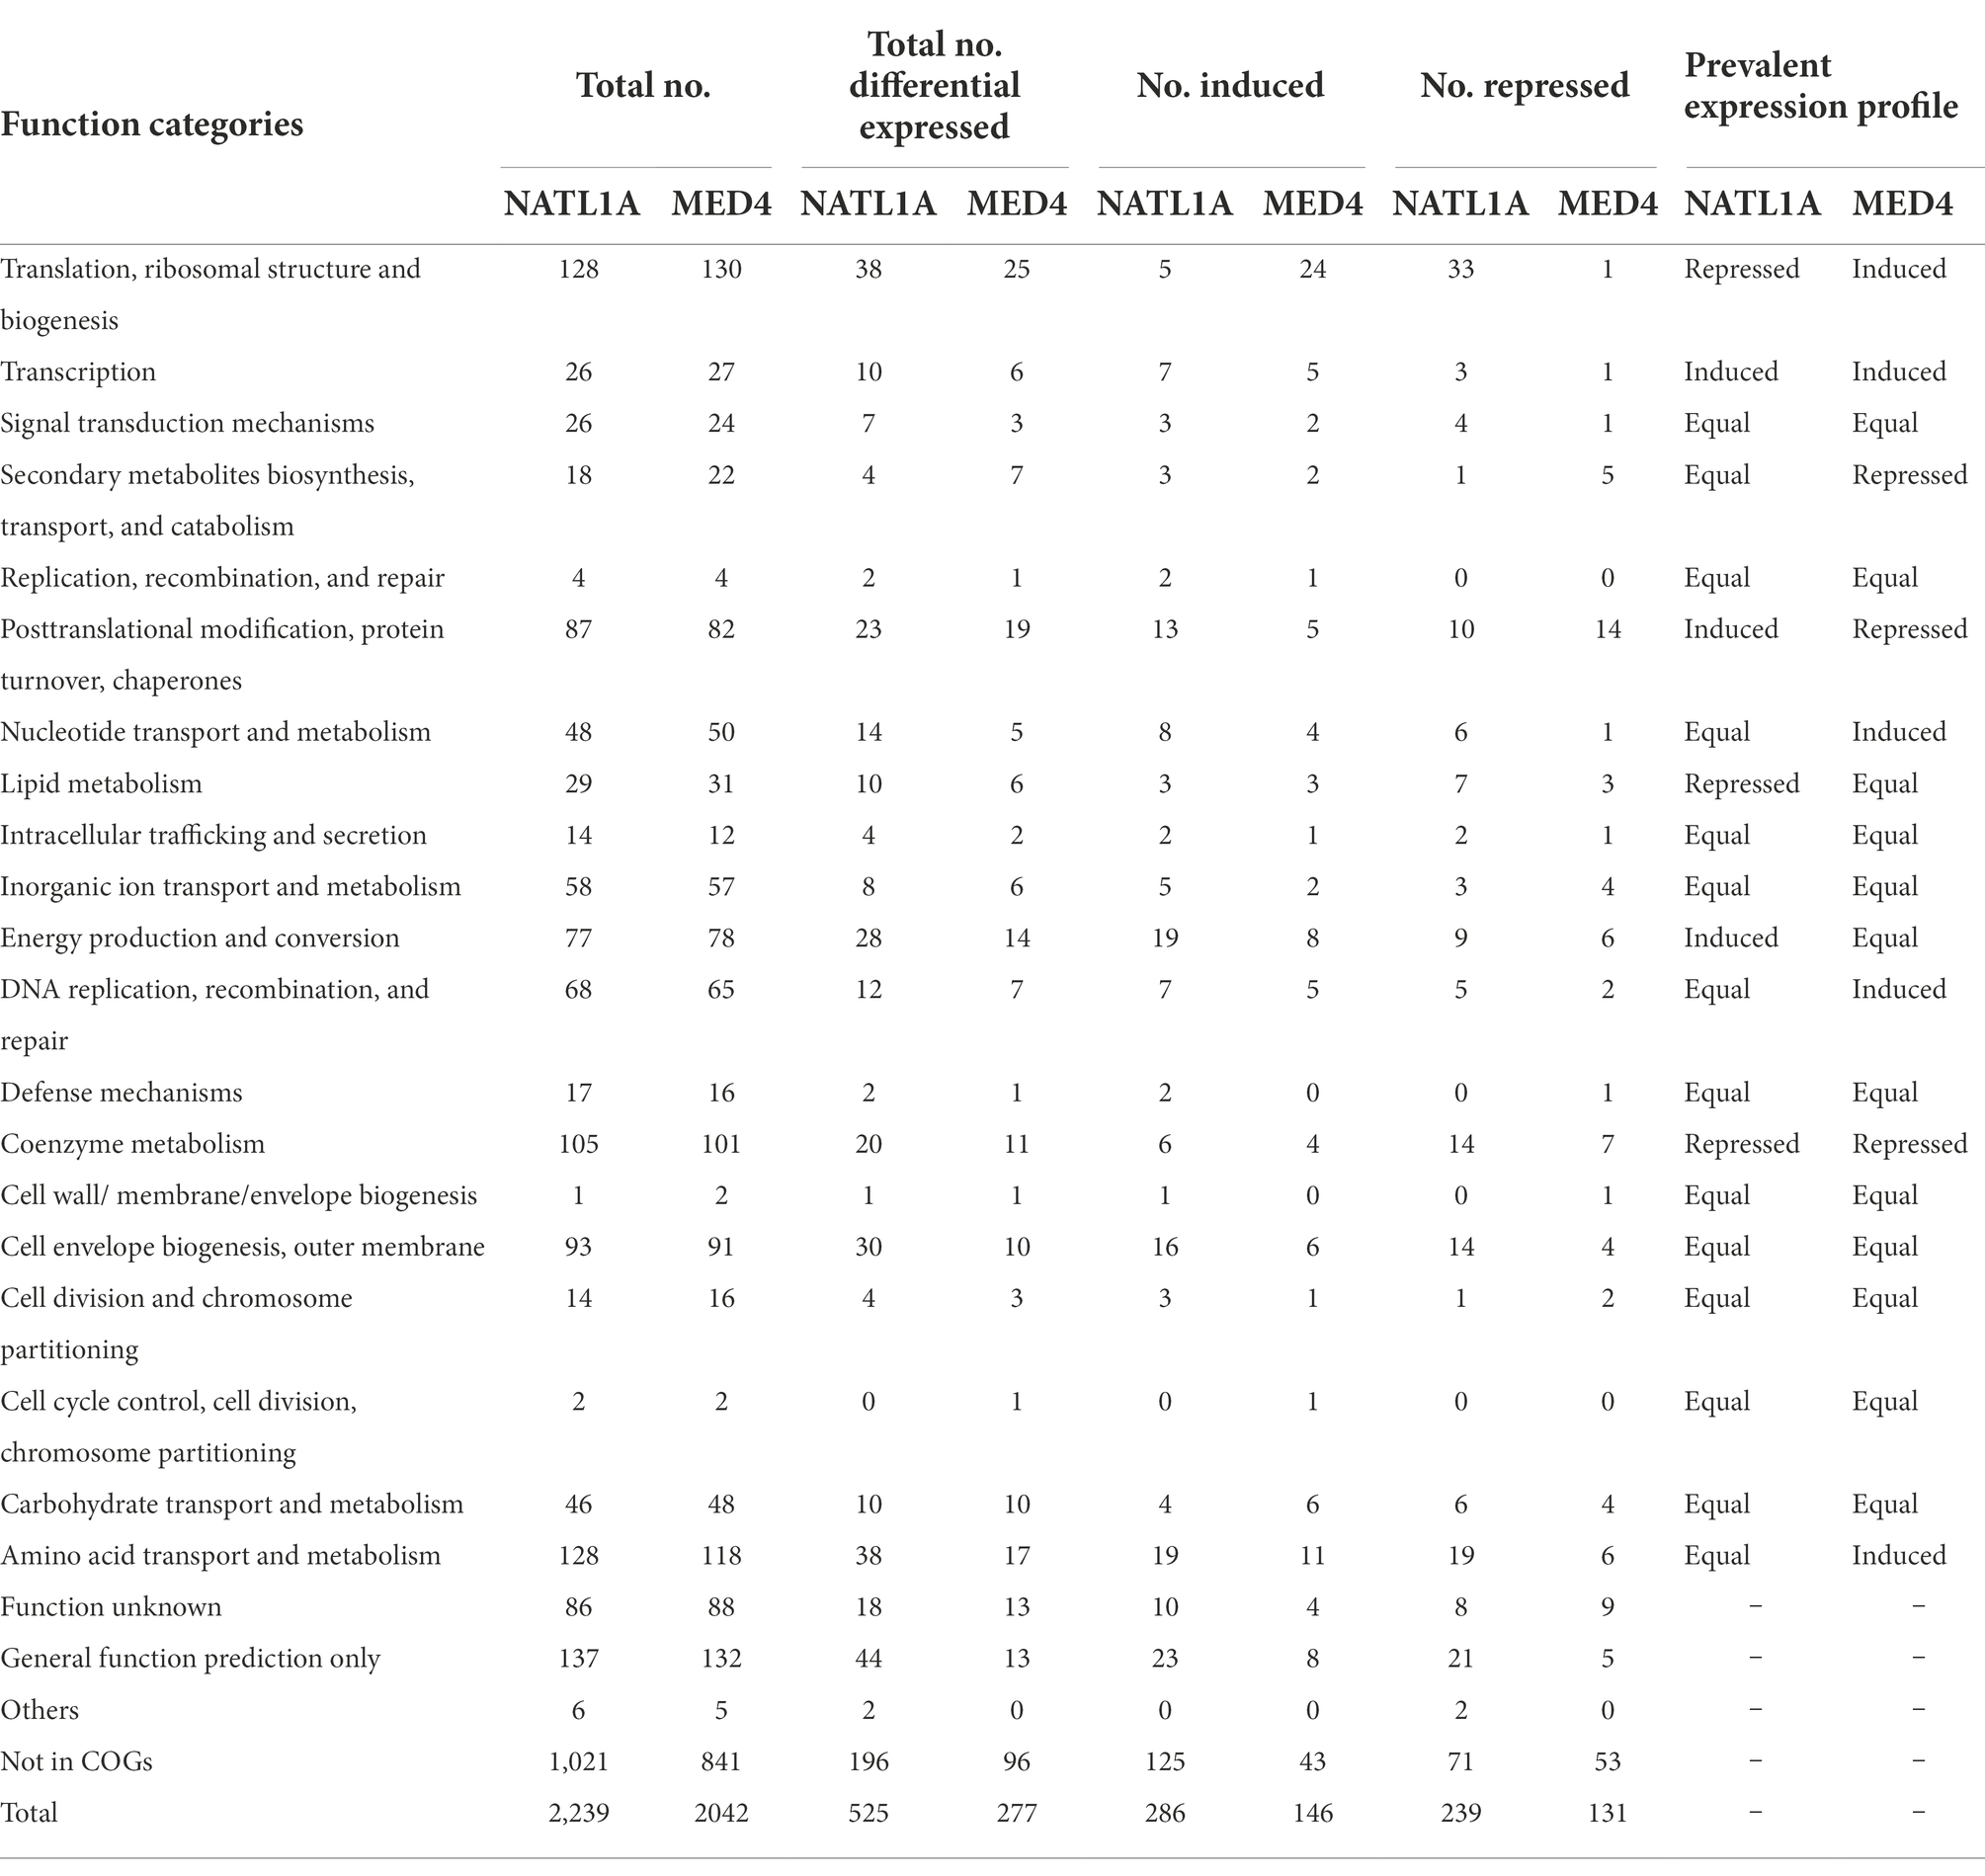
Table 1. Functional categorization of differentially expressed genes (p < 0.05) in low salinity acclimated cells of NATL1A and MED4.
Subsequently, the differentially expressed genes of these two strains were functionally classified according to Cyanobase definitions (Fujisawa et al., 2014). Firstly, the numbers of induced and repressed genes were equal for most functional modules (60–70%) in each of the two strains. Secondly, compared to the control group, the changed prevalent expression profiles between the two strains were different. In low salinity acclimated NATL1A, some genes involved in translation, ribosomal structure and biogenesis, lipid metabolism and coenzyme metabolism were down-regulated, while genes involved in transcription, posttranslational modification, protein turnover, chaperones and energy production and conversion were up-regulated (Table 1). However, in MED4, regulation profile of the functions mentioned above is different from NATL1A, except for coenzyme metabolism.
Contrasting regulation between NATL1A and MED4
Most interestingly, among the genes involved in translation, ribosomal structure and biogenesis, five were up-regulated and 33 were down-regulated in low salinity acclimated NATL1A cells compared to control (Tables 1, 2). However, in MED4, 24 genes of those genes were up-regulated and only one was down-regulated (Tables 1, 3). Strikingly, the regulation of genes involved in energy production and conversion were also in distinct patterns between NATL1A and MED4. In low salinity acclimated NATL1A cells, the ATP-producing genes were down-regulated (atpA, atpC, atpD, atpH and other ATP synthase genes), while many genes involved in photosynthesis (psaC, psb27, rbcS), cytochrome oxidation (cyoA, cyoB, ctaE), NADH dehydrogenase (ndhA, ndhH) were up-regulated (Table 2). However, in low salinity acclimated MED4 cells, genes for photosynthesis were down-regulated, such as photosystems II (psbA, psbB, psbD, psbN), cytochrome F (petA), and electron transport chain intermediate (ndhD), while most ATP-producing genes (acnB, atpG, atpF, atpH, atpD) were up-regulated. This striking contrasting transcriptional regulation indicated the two strains processed different response mechanisms to low salinity stress. It is likely that, to respond to low salinity stress, NATL1A enhanced photosynthesis but repressed ATP production and translation and biosynthesis. In contrast, MED4 repressed photosynthesis but enhanced ATP production, translation and biosynthesis. The reason is possible that NATL1A and MED4 were in different stress level under the salinity 28 psu, which appears to be slightly stressful for MED4, but extremely stressful for NATL1A. This is the reason why the differentially expressed genes of NATL1A were more than those of MED4.
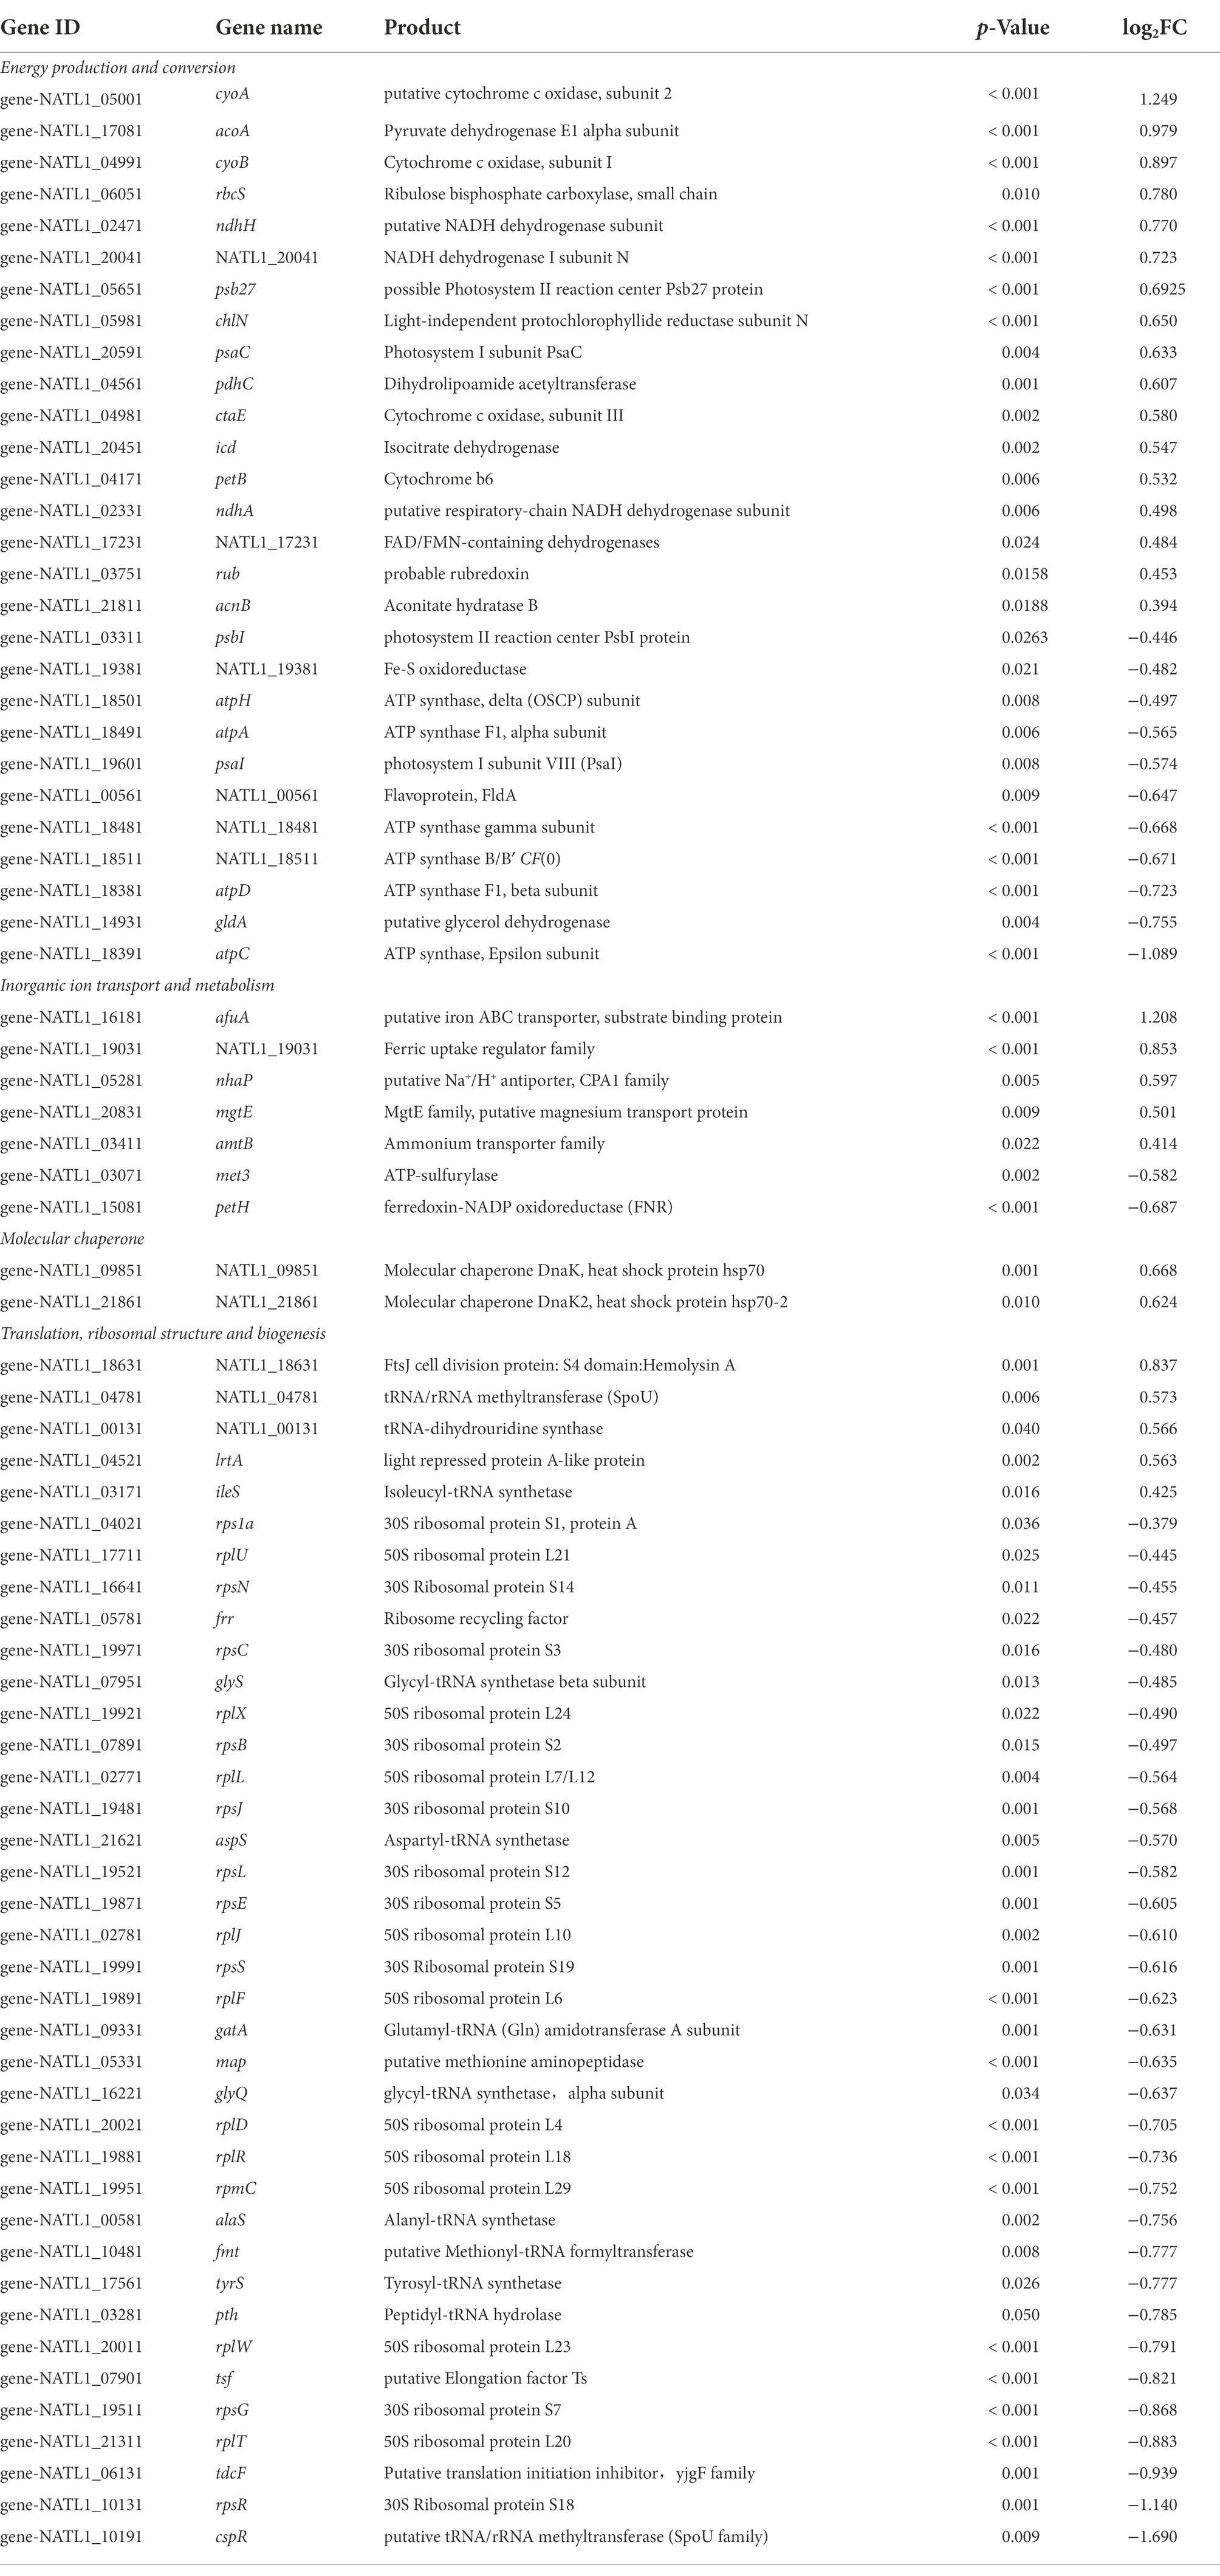
Table 2. List of a part of differentially expressed genes (p < 0.05) in low salinity acclimated Prochlorococcus NATL1A.
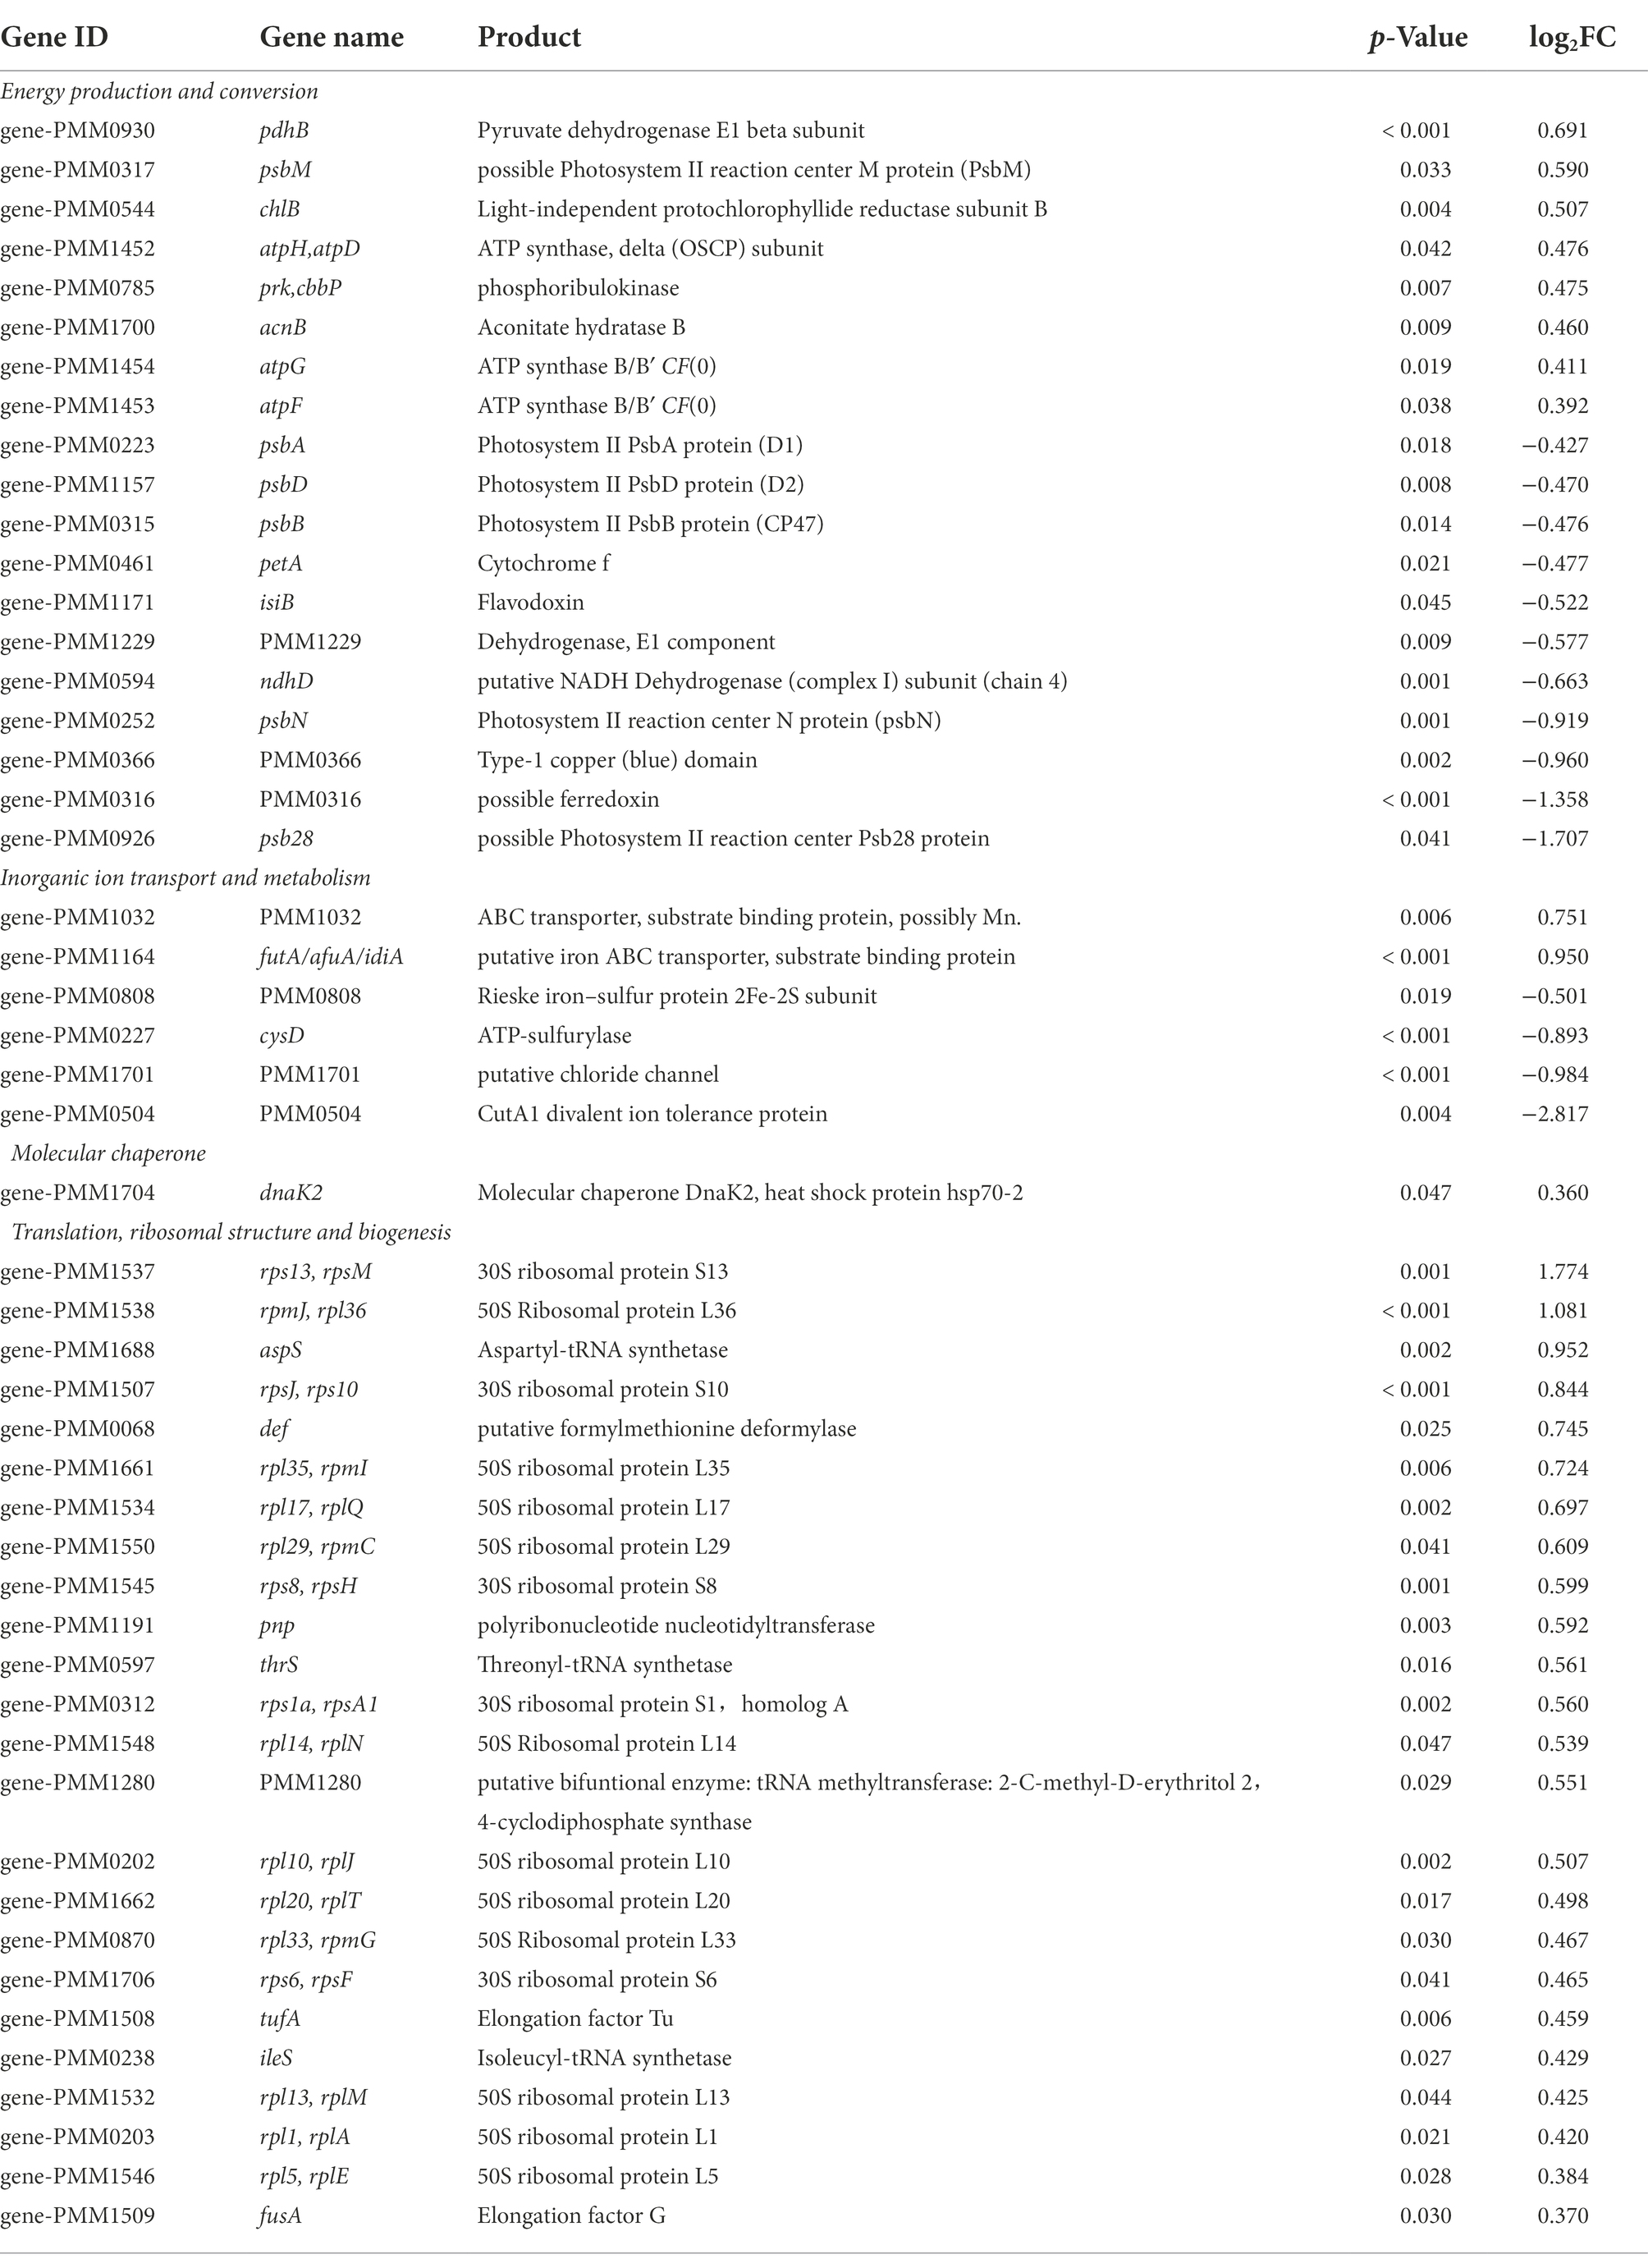
Table 3. List of a part of differentially expressed genes (p < 0.05) in low salinity acclimated Prochlorococcus MED4.
It has been pointed out that the response of photosystem gene expression to high salt stress might be dependent on the organism under study, based on the investigations on Prochlorococcus strain AS9601, Synechocystis PCC 6803 and Synechococcus PCC 7002 (Al-Hosani et al., 2015). In high salt acclimated AS9601 cells, many genes coding for components of Photosystem I, Photosystem II and chlorophyll were down-regulated. By contrast, in high salt acclimated PCC 7002, PSI genes were down-regulated but PSII genes were not changed significantly (Ludwig and Bryant, 2012). Similarly, in this study, NATL1A and MED4 also showed heterogeneity in response to low salinity stress.
Compatible solute and transporters
Cyanobacteria generally use the salt-out strategy for salt acclimation, in which cells maintain low intracellular ion concentration and accumulate compatible solutes to establish turgor (Hagemann, 2011). Compatible solutes are low-molecular-weight organic compounds, with sucrose, glucosylglycerol (GG), glucosylglycerate (GGA) and glycine betaine (GB) being the most common ones utilized by cyanobacteria (Klähn and Hagemann, 2011). Prochlorococcus cells probably use GGA and sucrose as their main compatible solutes (Scanlan et al., 2009). In NATL1A, we observed significant decrease in transcript abundance of the GGA synthesis genes (gpgP, encoding glucosyl-phosphoglycerate phosphatase, and gpgS, encoding glucosyl-phosphoglycerate synthase) in the low salinity acclimated cells compared to control cells (Table 4). However, we did not observe significant change on the sucrose synthesis gene spsA (encoding sucrose phosphate synthase). Moreover, in MED4, all the three genes did not show significant change in transcript abundance. These results suggest that, to cope with low salinity stress, NATL1A probably reduced the concentration of intracellular compatible solute GGA, while MED4 did not reduce the concentration of the compatible solutes. Again, this different observations may be due to that the two strains were at different stress level when growing in the medium with salinity 28 psu. In another study, high salt acclimated Prochlorococcus AS9601 cells up-regulated the gpgS gene and a sodium transporter, suggesting that active extrusion of sodium ions and accumulation of GGA are involved in AS9601 acclimation to high salt stress (Al-Hosani et al., 2015). Together, these results suggests that compatible solute GGA may play an important role in the adaptation of Prochlorococcus to salinity changes.
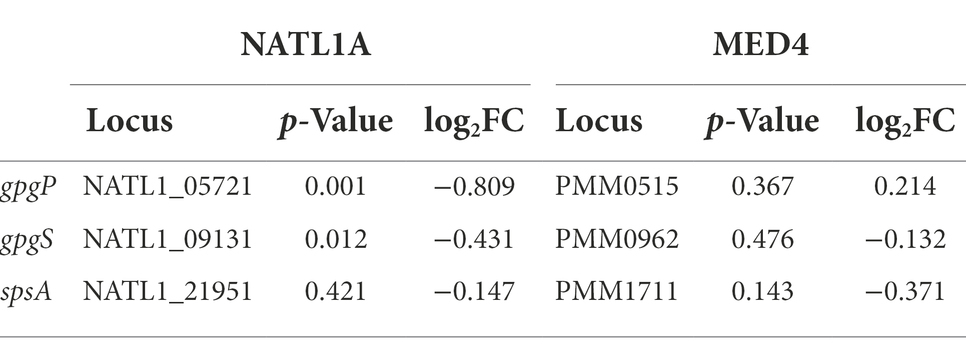
Table 4. Expression change on genes responsible for compatible solute biosynthesis.
Na+/H+ antiporter is closely related to plant salinity tolerance, and it is one of the critical factors of plant salt tolerance. To adapt to a high salt environment, plants will reduce the plasma membrane Na+ level through Na+/H+ antiporter (Apse et al., 1999; Hasegawa et al., 2000). Besides, cyanobacteria cells involved in salt stress tolerance was correlated with the activity of Na+/H+ antiporter (Allakhverdiev et al., 1999, 2000). However, in this study, the transcript level of Na+/H+ antiporter (nhaP) was increased under low salinity stress in NATL1A cells (Table 2). It is not clear what is the mechanism involved in this phenomenon. Perhaps the increasing expression of Na+/H+ antiporter would help to reduce the cytoplasm Na+ level which has already adapted to high salinity level of seawater.
Iron transporter and molecular chaperone
Interestingly, a periplasmic ABC-type Fe3+ transporter (afuA/idiA/futA) was up-regulated in low salinity acclimated cells of both NATL1A and MED4, compared to control cells. Moreover, NATL1A also up-regulated a ferric uptake regulator (NATL1_19031). It has been demonstrated that the transcript levels of idiA gene in Synechococcus PCC 6301 and Prochlorococcus MED4 were increased under iron deficiency conditions (Michel et al., 1999; Webb et al., 2001; Thompson et al., 2011). This suggests that cells may be iron-limited under low salt-stress. Previously, afuA was found to be down-regulated in high salt stressed cells of Prochlorococcus AS9601 (Al-Hosani et al., 2015). The authors attributed this to the reduced expression of iron required proteins under high salt condition. They also concluded that AS9601 was not iron limited because no difference in ferredoxin expression level was found between salt acclimated cells and control cells. It has been also revealed that iron requirement and siderophore production in cells is lower under high salinity (Boyle et al., 1977; Ruebsam et al., 2018). Together, these results indicates that there is a tight link between iron requirement and salt conditions in Prochlorococcus. However, the gene isiB (flavodoxin), which was induced in low iron stress (Erdner and Anderson, 1999; McKay et al., 1999), was not observed to be up-regulated in this study (Table 3). Hence, the specific relationship between low salinity stress and iron homeostasis remains to be investigated.
Up-regulated expression of dnaK was observed in both MED4 and NATL1A, which suggests that this gene could play a role in low salinity acclimation (Tables 2, 3). However, the molecular chaperone dnaK is one of the key factors for salt stress tolerance in halophiles, and over expression of dnaK can greatly reduce the growth lag period of the bacteria, allowing them to grow normally under salt stress (Sugimoto et al., 2003). Fukuda et al. (2001, 2002) cloned the dnaK gene from Tetragenococcus halophila JCM5888 and introduced it into E. coli, and found that the dnaK transcript abundance was increased approximately 3.5-fold under salt stress. Meanwhile, dnaK was also found to be present in the halotolerant cyanobacterium Aphanothece halophytica (Hibino et al., 1999). The gene product of dnaK, heat shock protein hsp70, likely plays an important role in stress resistance, no matter it is low salinity stress or high salt stress.
Highly differentially expressed genes
When the filter criterion was changed from only meeting the value of p (p < 0.05) to meeting both value of p and log2fold change with values greater than 1 (high induction) or less than-1 (high inhibition), there were 81 and 30 highly differentially expressed genes in NATL1A and MED4, respectively. These number are comparable to the previous study on Prochlorococcus AS9601, in which 69 highly differentially expressed genes were found in high salt acclimated cells compared to control cells (Al-Hosani et al., 2015). In NATL1A, 22 genes were down-regulated and 59 were up-regulated, while in MED4, 17 genes were down-regulated and 13 were up-regulated. There was no apparent gene enrichment pattern observed among these highly differentially expressed genes (Supplementary Tables S1, S2). For example, in low-salinity stress cells of NATL1A, many genes were highly inhibited, which were related to posttranslational modification (NATL1_02111 and NATL1_13731), signal transduction mechanisms (typA), cell envelope biogenesis, outer membrane (NATL1_08371 and NATL1_04491), translation, ribosomal structure and biogenesis (rpsR), coenzyme metabolism (folE), energy production and conversion (atpC), and amino acid transport and metabolism (proA). Nevertheless, in salinity acclimated cells of MED4, some other genes appear to be repressed, which were those involved in energy production and conversion (PMM0316), secondary metabolites biosynthesis, transport, and catabolism (PMM0280), DNA replication, recombination, and repair (ruvC), lipid metabolism (des, yocE) and posttranslational modification (PMM1006).
Conclusion
Prochlorococcus is the most abundant phototroph in the ocean. This organism has been adapted to open ocean areas with stable salt concentrations, and barely found in nearshore and estuarine waters with lower and variable salt concentrations. In this study, we showed that the lowest salinities for acclimation of high-light adapted Prochlorococcus strain MED4 and low-light adapted strain NATL1A were 25 psu and 28 psu, respectively. The optimal growing salinity of both MED4 and NATL1A were from 30 to 40 psu. Global transcriptome analysis showed that the two strains responded differently to low salinity stress. First, far more genes of NATL1A were impacted than those of MED4 in low salinity acclimated cells, suggesting NATL1A was more intensively stressed than MED4 under salinity 28 psu. Second, compared to control, low salinity acclimated cells of NATL1A repressed the expression of genes involved in translation, ribosomal structure and biogenesis and ATP production, but enhanced photosynthesis, while MED4 regulated these pathways in an opposite way. To cope with low salinity, NATL1A also reduced the transcript abundance of genes involved in compatible solute GGA, while MED4 did not. Interpreting from a previous study and this study, a tight link between iron transportation and salt condition was verified, with high salinity stressed cells coupling with up-regulation of iron transporters and low salinity stressed cells coupling with down-regulation of iron transporters. This study demonstrated the regulations of global transcriptome of Prochlorococcus under low salinity stress and the mechanisms within those regulations warrant further investigation.
Data availability statement
The datasets presented in this study can be found in online repositories. The names of the repository/repositories and accession number(s) can be found below: https://www.ncbi.nlm.nih.gov/geo/query/acc.cgi?acc=GSE195946.
Author contributions
SH, JD, and LL designed the experiments. XH and HL performed the experiments and analyzed the data. SH and XH wrote the manuscript. JD and LL provided resources and supervision. All authors contributed to the article and approved the submitted version.
Funding
This study was funded by the National Natural Science Foundation of China [grant number 42176116, 41576126]; Key Special Project for Introduced Talents Team of Southern Marine Science and Engineering Guangdong Laboratory (Guangzhou) [GML2019ZD0404]; the Natural Science Foundation of Guangdong Province [grant number 2017A030306020]; the Youth Innovation Promotion Association [grant number 2018377]; and the Rising Star Foundation of the South China Sea Institute of Oceanology [grant number NHXX2019ST0101].
Acknowledgments
We thank Rui Zhang and Xilin Xiao for sharing the Prochlorococcus strains.
Conflict of interest
The authors declare that the research was conducted in the absence of any commercial or financial relationships that could be construed as a potential conflict of interest.
Publisher’s note
All claims expressed in this article are solely those of the authors and do not necessarily represent those of their affiliated organizations, or those of the publisher, the editors and the reviewers. Any product that may be evaluated in this article, or claim that may be made by its manufacturer, is not guaranteed or endorsed by the publisher.
Supplementary material
The Supplementary material for this article can be found online at: https://www.frontiersin.org/articles/10.3389/fmicb.2022.1038136/full#supplementary-material
Footnotes
References
Al-Hosani, S., Oudah, M. M., Henschel, A., and Yousef, L. F. (2015). Global transcriptome analysis of salt acclimated Prochlorococcus AS9601. Microbiol. Res. 176, 21–28. doi: 10.1016/j.micres.2015.04.006
Allakhverdiev, S. I., Nishiyama, Y., Suzuki, I., Tasaka, Y., and Murata, N. (1999). Genetic engineering of the unsaturation of fatty acids in membrane lipids alters the tolerance of Synechocystis to salt stress. Proc. Natl. Acad. Sci. 96, 5862–5867. doi: 10.1073/pnas.96.10.5862
Allakhverdiev, S. I., Sakamoto, A., Nishiyama, Y., Inaba, M., and Murata, N. (2000). Ionic and osmotic effects of NaCl-induced inactivation of photosystems I and II in Synechococcus sp. Plant Physiol. 123, 1047–1056. doi: 10.1104/pp.123.3.1047
Apse, M. P., Aharon, G. S., Snedden, W. A., and Blumwald, E. (1999). Salt tolerance conferred by overexpression of a vacuolar Na+/H+ antiport in Arabidopsis. Science 285, 1256–1258. doi: 10.1126/science.285.5431.1256
Boyle, E. A., Edmond, J. M., and Sholkovitz, E. R. (1977). The mechanism of iron removal in estuaries. Geochim. Cosmochim. Acta 41, 1313–1324. doi: 10.1016/0016-7037(77)90075-8
Chisholm, S. W., Frankel, S. L., Goericke, R., Olson, R. J., Palenik, B., Waterbury, J. B., et al. (1992). Prochlorococcus marinus nov. gen. Nov. sp.: an oxyphototrophic marine prokaryote containing divinyl chlorophyll a and b. Arch. Microbiol. 157, 297–300. doi: 10.1007/BF00245165
Corzo, A., Jimenez-Gomez, F., Gordillo, F. J. L., Garcia-Ruiz, R., and Niell, F. X. (1999). Synechococcus and Prochlorococcus-like populations detected by flow cytometry in a eutrophic reservoir in summer. J. Plankton Res. 21, 1575–1581. doi: 10.1093/plankt/21.8.1575
Erdner, D. L., and Anderson, D. M. (1999). Ferredoxin and flavodoxin as biochemical indicators of iron limitation during open-ocean iron enrichment. Limnol. Oceanogr. 44, 1609–1615. doi: 10.4319/lo.1999.44.7.1609
Ferris, M. J., and Palenik, B. (1998). Niche adaptation in ocean cyanobacteria. Nature 396, 226–228. doi: 10.1038/24297
Flombaum, P., Gallegos, J. L., Gordillo, R. A., Rincon, J., Zabala, L. L., Jiao, N. Z., et al. (2013). Present and future global distributions of the marine cyanobacteria Prochlorococcus and Synechococcus. Proc. Natl. Acad. Sci. 110, 9824–9829. doi: 10.1073/pnas.1307701110
Fujisawa, T., Okamoto, S., Katayama, T., Nakao, M., Yoshimura, H., Kajiya-Kanegae, H., et al. (2014). CyanoBase and RhizoBase: databases of manually curated annotations for cyanobacterial and rhizobial genomes. Nucleic Acids Res. 42, D666–D670. doi: 10.1093/nar/gkt1145
Fukuda, D., Watanabe, M., Shino, S., Sonomoto, K., and Ishizaki, A. (2001). Cloning and characterization of dnaK operon of Tetragenococcus halophila. J. Fac. Agric. Kyushu Univ. 46, 229–241. doi: 10.5109/24435
Fukuda, D., Watanabe, M., Sonezaki, S., Sugimoto, S., Sonomoto, K., and Ishizaki, A. (2002). Molecular characterization and regulatory analysis of dnaK operon of halophilic lactic acid bacterium Tetragenococcus halophila. J. Biosci. Bioeng. 93, 388–394. doi: 10.1016/S1389-1723(02)80072-X
Goericke, R., and Welschmeyer, N. A. (1993). The marine prochlorophyte Prochlorococcus contributes significantly to phytoplankton biomass and primary production in the Sargasso Sea. Deep-Sea Res. I Oceanogr. Res. Pap. 40, 2283–2294. doi: 10.1016/0967-0637(93)90104-B
Guillard, R. R. L., Murphy, L. S., Foss, P., and Liaaen-Jensen, S. (1985). Synechococcus spp. as likely zeaxanthin-dominant ultraphytoplankton in the North Atlantic. Limnol. Oceanogr. 30, 412–414. doi: 10.4319/lo.1985.30.2.0412
Hagemann, M. (2011). Molecular biology of cyanobacterial salt acclimation. FEMS Microbiol. Rev. 35, 87–123. doi: 10.1111/j.1574-6976.2010.00234.x
Hasegawa, P. M., Bressan, R. A., Zhu, J. K., and Bohnert, H. J. (2000). Plant cellular and molecular responses to high salinity. Annu. Rev. Plant Biol. 51, 463–499. doi: 10.1146/annurev.arplant.51.1.463
Hess, W. R., Partensky, F., Van der Staay, G. W., Garcia-Fernandez, J. M., Börner, T., and Vaulot, D. (1996). Coexistence of phycoerythrin and a chlorophyll a/b antenna in a marine prokaryote. Proc. Natl. Acad. Sci. 93, 11126–11130. doi: 10.1073/pnas.93.20.11126
Hibino, T., Kaku, N., Yoshikawa, H., Takabe, T., and Takabe, T. (1999). Molecular characterization of DnaK from the halotolerant cyanobacterium Aphanothece halophytica for ATPase, protein folding, and copper binding under various salinity conditions. Plant Mol. Biol. 40, 409–418. doi: 10.1023/A:1006273124726
Johnson, Z. I., Zinser, E. R., Coe, A., McNulty, N. P., Woodward, E. M. S., and Chisholm, S. W. (2006). Niche partitioning among Prochlorococcus ecotypes along ocean-scale environmental gradients. Science 311, 1737–1740. doi: 10.1126/science.1118052
Kanesaki, Y., Suzuki, I., Allakhverdiev, S. I., Mikami, K., and Murata, N. (2002). Salt stress and hyperosmotic stress regulate the expression of different sets of genes in Synechocystis sp. PCC 6803. Biochem. Biophys. Res. Commun. 290, 339–348. doi: 10.1006/bbrc.2001.6201
Klähn, S., and Hagemann, M. (2011). Compatible solute biosynthesis in cyanobacteria. Environ. Microbiol. 13, 551–562. doi: 10.1111/j.1462-2920.2010.02366.x
Liu, H., Nolla, H. A., and Campbell, L. (1997). Prochlorococcus growth rate and contribution to primary production in the equatorial and subtropical North Pacific Ocean. Aquat. Microb. Ecol. 12, 39–47. doi: 10.3354/ame012039
Ludwig, M., and Bryant, D. A. (2012). Synechococcus sp. strain PCC 7002 transcriptome: acclimation to temperature, salinity, oxidative stress, and mixotrophic growth conditions. Front. Microbiol. 3:354. doi: 10.3389/fmicb.2012.00354
Mackey, K. R., Paytan, A., Caldeira, K., Grossman, A. R., Moran, D., McIlvin, M., et al. (2013). Effect of temperature on photosynthesis and growth in marine Synechococcus spp. Plant Physiol. 163, 815–829. doi: 10.1104/pp.113.221937
Marin, K., Suzuki, I., Yamaguchi, K., Ribbeck, K., Yamamoto, H., Kanesaki, Y., et al. (2003). Identification of histidine kinases that act as sensors in the perception of salt stress in Synechocystis sp. PCC 6803. Proc. Natl. Acad. Sci. 100, 9061–9066. doi: 10.1073/pnas.1532302100
McKay, R. M. L., La Roche, J., Yakunin, A. F., Durnford, D. G., and Geider, R. J. (1999). Accumulation of ferredoxin and flavodoxin in a marine diatom in response to Fe. J. Phycol. 35, 510–519. doi: 10.1046/j.1529-8817.1999.3530510.x
Michel, K. P., Krüger, F., Pühler, A., and Pistorius, E. K. (1999). Molecular characterization of idiA and adjacent genes in the cyanobacteria Synechococcus sp. strains PCC 6301 and PCC 7942. Microbiology 145, 1473–1484. doi: 10.1099/13500872-145-6-1473
Mitbavkar, S., Rajaneesh, K. M., Anil, A. C., and Sundar, D. (2012). Picophytoplankton community in a tropical estuary: detection of Prochlorococcus-like populations. Estuar. Coast. Shelf Sci. 107, 159–164. doi: 10.1016/j.ecss.2012.05.002
Moore, L. R., and Chisholm, S. W. (1999). Photophysiology of the marine cyanobacterium Prochlorococcus: ecotypic differences among cultured isolates. Limnol. Oceanogr. 44, 628–638. doi: 10.4319/lo.1999.44.3.0628
Mühling, M. (2012). On the culture-independent assessment of the diversity and distribution of Prochlorococcus. Environ. Microbiol. 14, 567–579. doi: 10.1111/j.1462-2920.2011.02589.x
Partensky, F., Blanchot, J., and Vaulot, D. (1999). Differential distribution and ecology of Prochlorococcus and Synechococcus in oceanic waters: a review. Bull. Inst. Oceanogr. Monaco 19, 457–476.
Robertson, B. R., Tezuka, N., and Watanabe, M. M. (2001). Phylogenetic analyses of Synechococcus strains (cyanobacteria) using sequences of 16S rDNA and part of the phycocyanin operon reveal multiple evolutionary lines and reflect phycobilin content. Int. J. Syst. Evol. Microbiol. 51, 861–871. doi: 10.1099/00207713-51-3-861
Rocap, G., Distel, D. L., Waterbury, J. B., and Chisholm, S. W. (2002). Resolution of Prochlorococcus and Synechococcus ecotypes by using 16S-23S ribosomal DNA internal transcribed spacer sequences. Appl. Environ. Microbiol. 68, 1180–1191. doi: 10.1128/AEM.68.3.1180-1191.2002
Rocap, G., Larimer, F. W., Lamerdin, J., Malfatti, S., Chain, P., Ahlgren, N. A., et al. (2003). Genome divergence in two Prochlorococcus ecotypes reflects oceanic niche differentiation. Nature 424, 1042–1047. doi: 10.1038/nature01947
Ruebsam, H., Kirsch, F., Reimann, V., Erban, A., Kopka, J., Hagemann, M., et al. (2018). The iron-stress activated RNA 1 (IsaR1) coordinates osmotic acclimation and iron starvation responses in the cyanobacterium Synechocystis sp. PCC 6803. Environ. Microbiol. 20, 2757–2768. doi: 10.1111/1462-2920.14079
Scanlan, D. J., Ostrowski, M., Mazard, S., Dufresne, A., Garczarek, L., Hess, W. R., et al. (2009). Ecological genomics of marine picocyanobacteria. Microbiol. Mol. Biol. Rev. 73, 249–299. doi: 10.1128/MMBR.00035-08
Shang, X., Zhang, L. H., and Zhang, J. (2007). Prochlorococcus-like populations detected by flow cytometry in the fresh and brackish waters of the Changjiang estuary. J. Mar. Biol. Assoc. U. K. 87, 643–648. doi: 10.1017/S0025315407055191
Sugimoto, S., Nakayama, J., Fukuda, D., Sonezaki, S., Watanabe, M., Tosukhowong, A., et al. (2003). Effect of heterologous expression of molecular chaperone DnaK from Tetragenococcus halophilus on salinity adaptation of Escherichia coli. J. Biosci. Bioeng. 96, 129–133. doi: 10.1016/S1389-1723(03)90114-9
Thompson, A. W., Huang, K., Saito, M. A., and Chisholm, S. W. (2011). Transcriptome response of high-and low-light-adapted Prochlorococcus strains to changing iron availability. ISME J. 5, 1580–1594. doi: 10.1038/ismej.2011.49
Voigt, K., Sharma, C. M., Mitschke, J., Lambrecht, S. J., Voß, B., Hess, W. R., et al. (2014). Comparative transcriptomics of two environmentally relevant cyanobacteria reveals unexpected transcriptome diversity. ISME J. 8, 2056–2068. doi: 10.1038/ismej.2014.57
Webb, E. A., Moffett, J. W., and Waterbury, J. B. (2001). Iron stress in open-ocean cyanobacteria (Synechococcus, Trichodesmium, and Crocosphaera spp.): identification of the IdiA protein. Appl. Environ. Microbiol. 67, 5444–5452. doi: 10.1128/AEM.67.12.5444-5452.2001
West, N. J., Schönhuber, W. A., Fuller, N. J., Amann, R. I., Rippka, R., Post, A. F., et al. (2001). Closely related Prochlorococcus genotypes show remarkably different depth distributions in two oceanic regions as revealed by in situ hybridization using 16S rRNA-targeted oligonucleotides. Microbiology 147, 1731–1744. doi: 10.1099/00221287-147-7-1731
Zhang, X., Shi, Z., Ye, F., Zeng, Y., and Huang, X. (2013). Picophytoplankton abundance and distribution in three contrasting periods in the Pearl River estuary, South China. Mar. Freshw. Res. 64, 692–705. doi: 10.1071/MF12303
Zinser, E. R., Johnson, Z. I., Coe, A., Karaca, E., Veneziano, D., and Chisholm, S. W. (2007). Influence of light and temperature on Prochlorococcus ecotype distributions in the Atlantic Ocean. Limnol. Oceanogr. 52, 2205–2220. doi: 10.4319/lo.2007.52.5.2205
Zwirglmaier, K., Jardillier, L., Ostrowski, M., Mazard, S., Garczarek, L., Vaulot, D., et al. (2008). Global phylogeography of marine Synechococcus and Prochlorococcus reveals a distinct partitioning of lineages among oceanic biomes. Environ. Microbiol. 10, 147–161. doi: 10.1111/j.1462-2920.2007.01440.x
Keywords: Prochlorococcus, transcriptome, low salinity acclimation, low salinity stress, RNAseq
Citation: He X, Liu H, Long L, Dong J and Huang S (2022) Acclimation and stress response of Prochlorococcus to low salinity. Front. Microbiol. 13:1038136. doi: 10.3389/fmicb.2022.1038136
Edited by:
Prashant Kumar Singh, Mizoram University, IndiaReviewed by:
Gulab Chand Arya, Agricultural Research Organization (ARO), IsraelAvinash Singh, New York University, United States
Deepanker Yadav, Guru Ghasidas Vishwavidyalaya, India
Copyright © 2022 He, Liu, Long, Dong and Huang. This is an open-access article distributed under the terms of the Creative Commons Attribution License (CC BY). The use, distribution or reproduction in other forums is permitted, provided the original author(s) and the copyright owner(s) are credited and that the original publication in this journal is cited, in accordance with accepted academic practice. No use, distribution or reproduction is permitted which does not comply with these terms.
*Correspondence: Sijun Huang, huangsijun@scsio.ac.cn