 Prem Lal Kashyap*†
 Sudheer Kumar†
 Ravi Shekhar Kumar
 Rahul Tripathi
 Palika Sharma
 Anju Sharma
 Poonam Jasrotia
 Gyanendra Pratap Singh
- ICAR – Indian Institute of Wheat and Barley Research, Karnal, India
Barley covered smut (CS) pathogen Ustilago hordei genome was mined for microsatellite distribution and their application in defining population structure and genetic variation. To dissect the molecular variation and genetic structure of U. hordei, 59 fungal isolates representing two distinct agro-ecological zones of India were analyzed by employing simple sequence repeats (SSRs). Using bioinformatic approaches, a total of 100,239 and 137,442 microsatellites were identified from 20.13 and 26.94 Mb of assembled genomic sequences of Uh364 and Uh4857-4 isolates of U. hordei, respectively. Penta-nucleotides (31.29 and 29.75%) followed by tri-nucleotide (28.27 and 29.88%) were most prevalent in both the genomes. Out of them, 15 polymorphic microsatellites showing conservancies in both the genomes were selected for exploring population genetic structure of U. hordei. An average of two alleles per microsatellite marker was generated with band size ranging from 180 to 850 bp. Polymorphic information content (PIC) varied between 0.095 and 0.37. Fifty-nine isolates were distributed in two distinct groups with about 65% genetic similarity according to UPGMA clustering and population structure analysis (K = 2). Gene flow analysis (Nm = 1.009) reflected moderate gene flow among the analyzed population. An analysis of molecular variance (AMOVA) displayed high level of genetic variation within population (87%) and low variation among populations (13%). Linkage disequilibrium (LD) analysis indicated positively significant but relatively low standardized index of association (SIA) value in both the population sets (SIA = 0.181), advocating a state of LD with epidemic population structure. In conclusion, the newly developed neutral SSR markers are highly polymorphic within U. hordei and will be useful for revealing evolutionary history and providing deep insight into the population dynamics of U. hordei in India as well as facilitating developing management strategies for CS of barley.
Introduction
Covered smut (CS) incited by biotrophic fungus, Ustilago hordei, is one of the most important diseases of barley (Hordeum vulgare L.). It is a seed- and soil-borne disease and fungal inocula survive in the form of teliospores on the external surface of seeds and in the soil (Grewal et al., 2008). Usually, dikaryotic mycelia attack the plant at seed germination stage via coleoptiles and move toward meristematic region of shoot with the growth of barley seedlings (Kozar, 1969; Hu et al., 2002). At the flowering stage, the mycelia penetrate in the inflorescence and produce diploid teliospores in place of kernels (Grewal et al., 2008). The typical symptom produced by CS is the black mass of spores in the infected barley head covered with a persistent membrane (Thomas, 1988). The membrane burst during harvesting and threshing, discharging teliospores that contaminate healthy seeds or drop down on the soil surface (Mathre, 1997). CS disease can be successfully managed by using disease-free seed, recommended seed treatment with fungicides, and resistant cultivars (Grewal et al., 2008). Seed treatment with Carbendazim, Tebuconazole, and Carboxin is effective (Kaur et al., 2014). However, farmers incur additional costs for chemicals and are not an option for organic production system. Moreover, pathogen may develop resistance (Ben-yephet et al., 1975; Henry et al., 1987), intimidating to make chemical seed treatment futile. Under such circumstances, understanding the virulence of the pathogen and population genetic structure of U. hordei would be helpful to devise better management strategies for this important fungal pathogen.
Traditionally, variations among fungal pathogens have been studied by analyzing the cultural characteristics, morphology, sporulation, virulence, mating type, plant–fungus physiological and biochemical interactions, and disease response on differential hosts (Rau et al., 2005; Kashyap et al., 2016; Yu et al., 2016; Goswami et al., 2019). Unfortunately, these techniques are laborious and time-consuming and also influenced by the environment. Moreover, they are not very accurate and precise. However, DNA-based markers have the potential to decipher genetic variation of fungal pathogens and are documented as precise and accurate (Weising et al., 1995; Kumar et al., 2013; Kashyap et al., 2015; Prasad et al., 2018). Several types of molecular markers such as random amplified polymorphic DNA (RAPD), amplified fragment length polymorphism (AFLP), inter-simple sequence repeats (ISSR), and single-nucleotide polymorphism (SNP) have been widely explored for understanding the genetic diversity and population structure of fungal crop pathogens (Karwasra et al., 2002; Braithwaite et al., 2004; Sun et al., 2013; Goswami et al., 2017). However, in comparison to these markers, SSR emerged as a promising marker for DNA fingerprinting, genetic linkage mapping, quantitative trait locus (QTL) identification, population genetics, and evolutionary studies owing to their polymorphic attribute, excellent reproducibility, co-dominance, and omnipresence inside the genome (Ellegren, 2004; Kumar et al., 2012; Singh et al., 2014a; Rai et al., 2016). Recently, these markers have been explored for studying various phytopathogenic fungi, such as Ustilago segetum tritici (Kashyap et al., 2019), Tilletia indica (Sharma et al., 2018), Ustilago scitaminea (Zhou et al., 2008), Ustilago maydis (Jiménez-Becerril et al., 2018), Phytophthora infestans (Montarry et al., 2010), Fusarium udum (Kashyap et al., 2015), Fusarium pseudograminearum (Scott and Chakraborty, 2010), and Colletotrichum gloeosporioides (Moges et al., 2016). So far, a single report is available with a limited number of SSR markers for the analysis of genetic variation and population structure of U. hordei (Yu et al., 2016) and no comprehensive database of such markers are documented through complete genome-wide SSR mining. At present, draft genome of two isolates of U. hordei (Uh4857-4 and Uh364) is available in National Center for Biotechnology Information (NCBI) data bank1. Therefore, in the present study, attempts have been made to explore this genomic resource for identification, characterization, and development of microsatellites markers. Further, efforts have been put to characterize U. hordei isolates collected from diverse barley-growing regions of North India by validating polymorphic SSR markers and to identify various factors that determine U. hordei population structure.
Materials and Methods
Sequence Resources and Bioinformatics Analysis
The whole genome sequences of two U. hordei isolates (Uh4857-4 and Uh364) available in the NCBI (see text footnote 1) database were screened for SSR motifs (Supplementary Files S1, S2). The frequency of occurrence, relative density, and relative abundance of the repeats motifs was analyzed using Krait software (Du et al., 2018) with default settings. Thirty-five SSR primers (Supplementary Table S1) present in both genomes were randomly selected for PCR amplification. Primers were generated using online PRIMER3 software2.
Collection and Isolation of U. hordei Isolates
All U. hordei isolates were obtained from infected barley heads from two geographically and environmentally distinct areas (Figure 1 and Supplementary Table S2). One of these regions lies within the plain zone (PZ) of India composed of four states (Haryana, Punjab, Uttar Pradesh, and Rajasthan). Generally, barley in this zone is planted in late October–November and harvested in March end to mid-April. Moreover, barley varieties cultivated under this region is significantly different from the HZ region (Singh et al., 2014b). HZ covers the humid Himalayan regions (Siwalik Hills) situated beyond 750 m mean sea level and is composed of two states (Himachal Pradesh and Uttarakhand). This zone is characterized by cool climate and longer growing season. Moreover, barley cultivation is generally performed during the months of October and November, while harvested during the months of May and June in this zone.
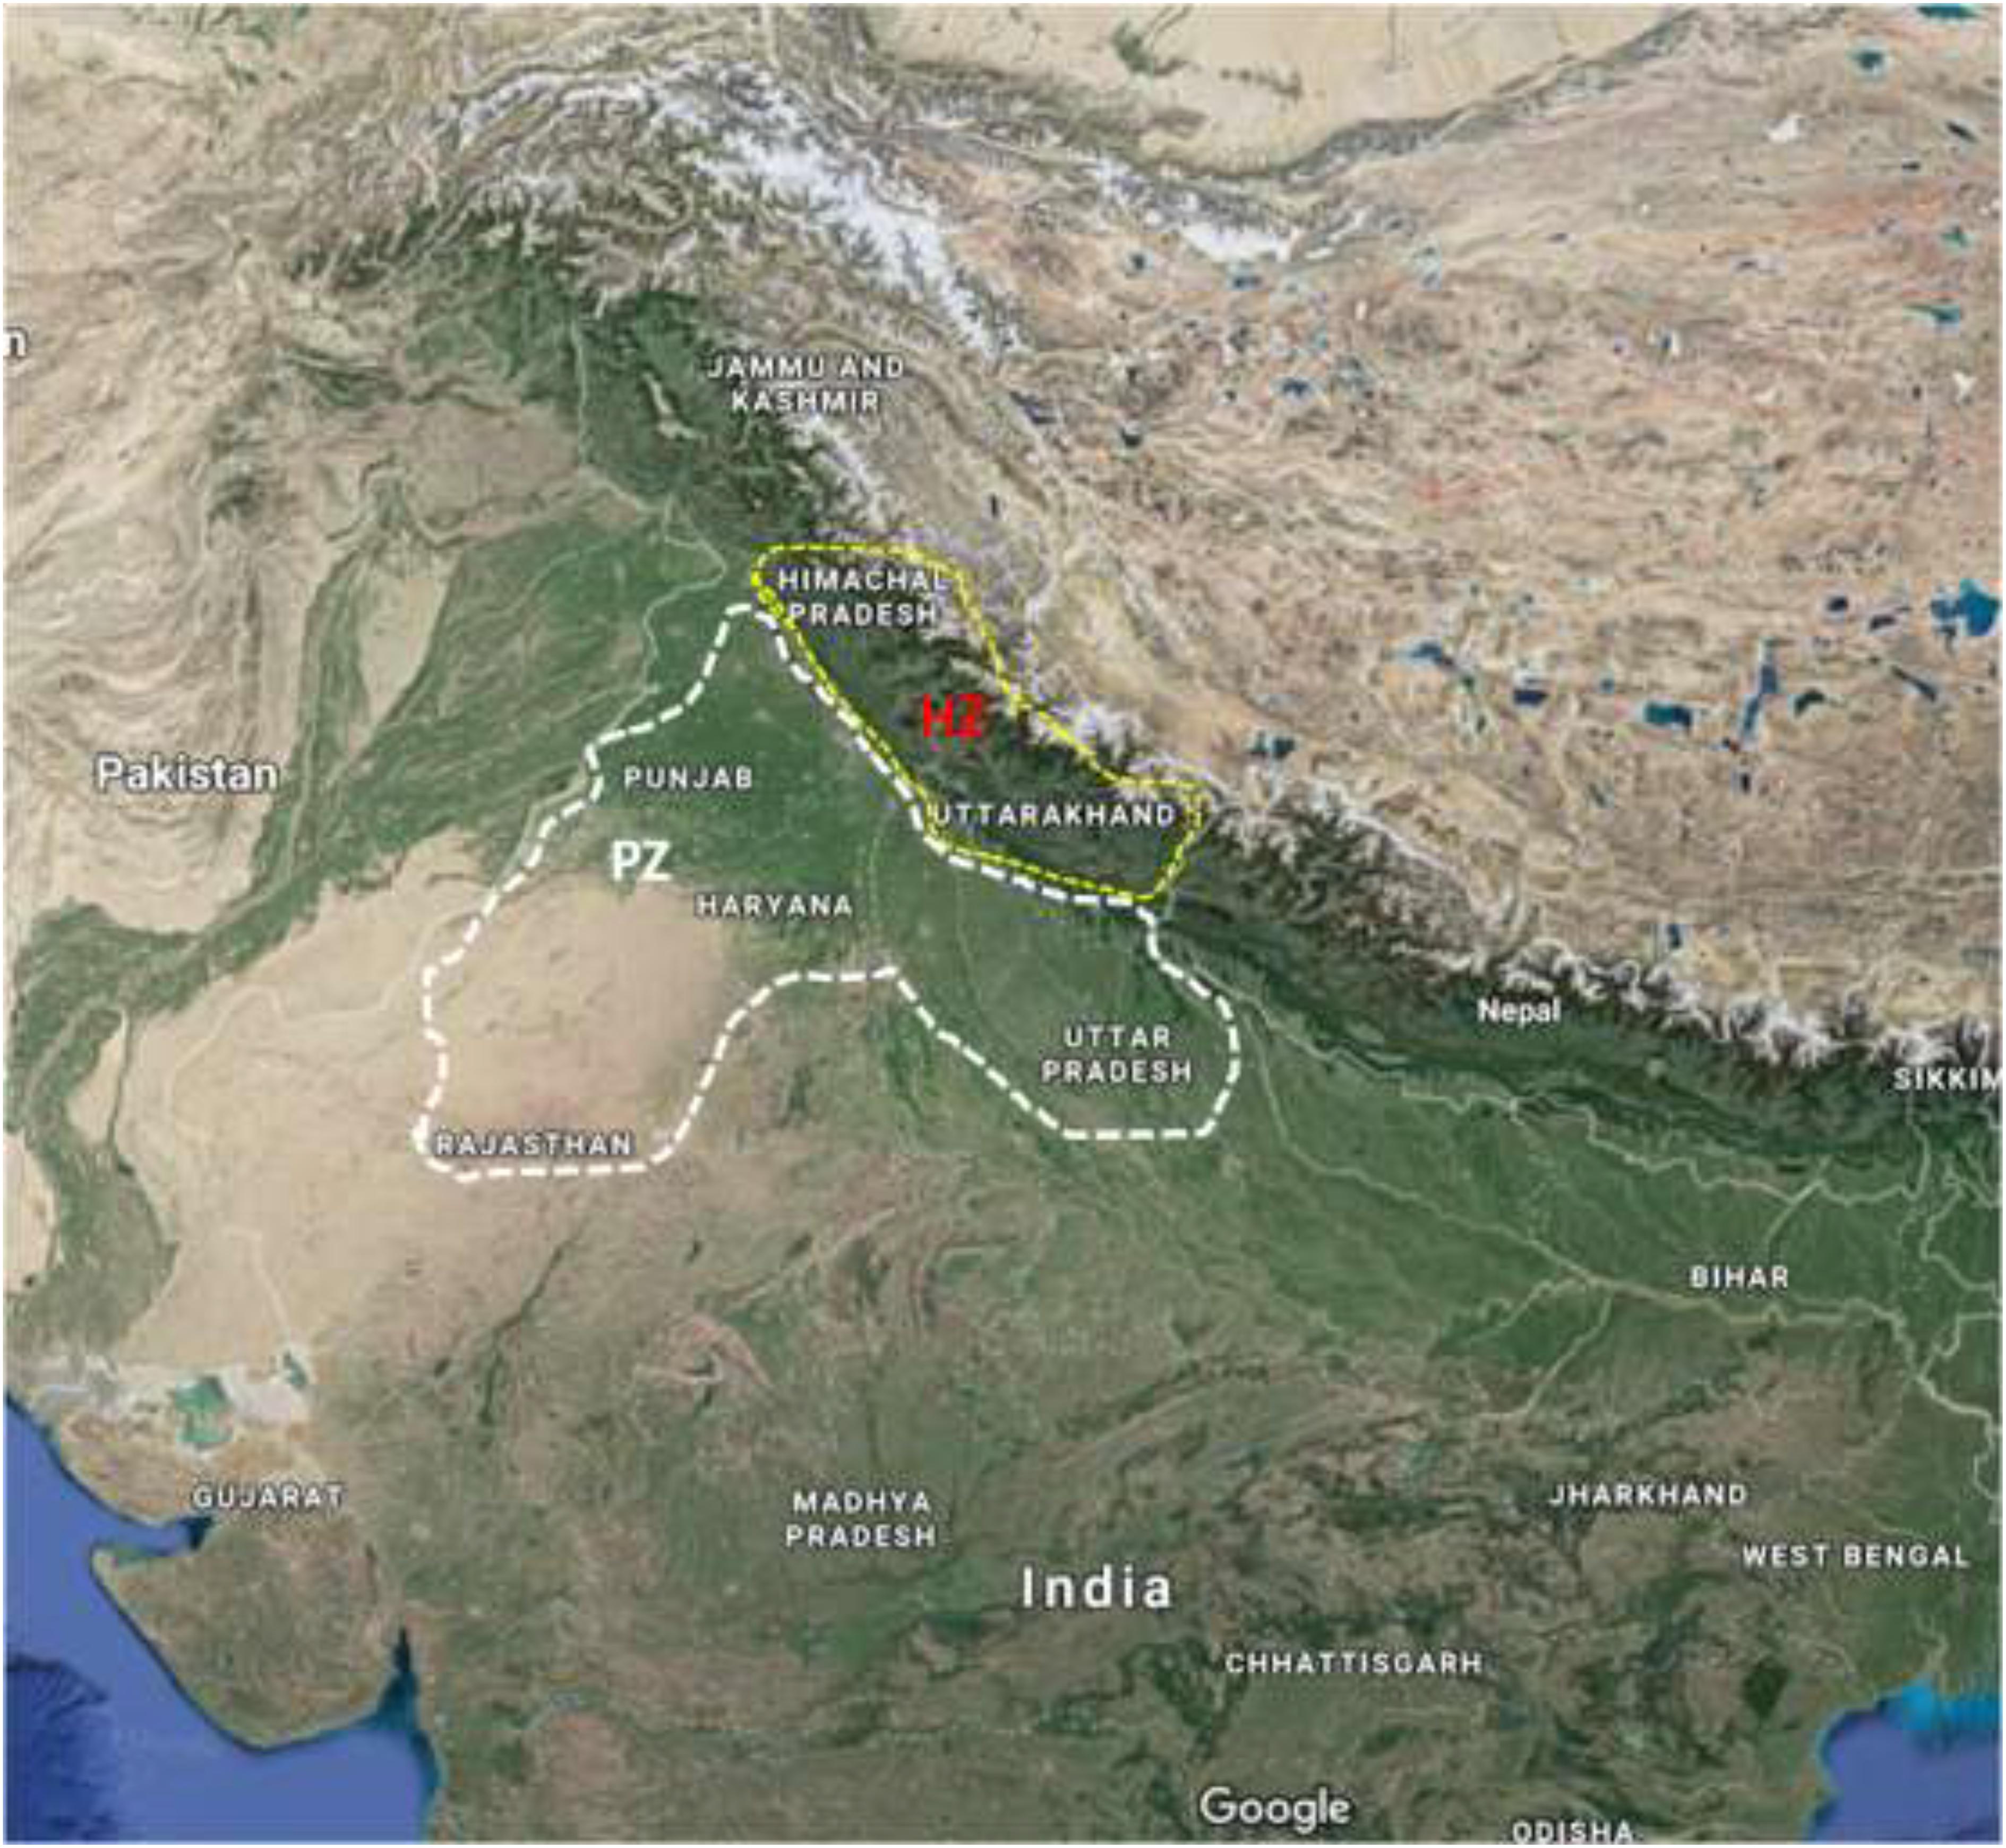
Figure 1. A map showing states of PZ (Uttar Pradesh, Punjab, Haryana, and Rajasthan) and HZ (Himachal Pradesh and Uttarakhand) surveyed for the collection of Ustilago hordei isolates from barley fields. PZ, plain zone; HZ, hill zone.
The single teliospore isolation method of McCluskey and Mills (1990) with minor modifications was adopted to raise the culture of U. hordei from single smutted barley spike per field and designated as an isolate. Briefly, teliospores from individual smutted ear were scraped off from the spike and dried at 37°C for 4 h. From each smutted spike, 10 mg of teliospore material was weighed and suspended in 1000 μl of sterile saline solution (0.85 M NaCl) containing streptomycin sulfate (0.05 g L–1) and incubated for 30 min at 25 ± 2°C. Later, 100 μl of the teliospore spore suspension of each serial dilution (up to 10–5) was smeared on PDA medium for teliospore germination. Single germinating teliospore was transferred to slants containing 50% PDA (Hi Media, India), incubated at 25 ± 2°C for 3 days and stored at 4°C for further use.
Total Genomic DNA Extraction
Each U. hordei isolate was grown in liquid potato-dextrose broth (50 ml) in a conical flask (250 ml) at 25 ± 2°C with shaking at 150 rpm. After 7 days, fungal mycelium was harvested and immediately ground into a fine powder in liquid nitrogen for DNA extraction according to the procedure adopted by Singh et al. (2014a). DNA concentrations were estimated using a Biodrop Spectrophotometer. DNA was routinely diluted to 1:10 (v:v) in Tris EDTA buffer before performing polymerase chain reaction (PCR).
Microsatellite Genotyping
The amplification for each microsatellite marker was carried out in a gradient PCR (Q cycler 96, Hain Lifescience, United Kingdom) to determine the best annealing temperature (Ta). For each SSR primer set, PCR was performed in 10 μl of total volume containing GoTaq® Green Master Mix (Promega), 0.5 pmol of each forward and reverse primer (Supplementary Table S1 and Table 1), and 25 ng of genomic DNA. PCR reaction without template DNA was employed as a no template control (NTC). DNA amplifications were carried out in Q cycler 96 (Hain Lifescience, United Kingdom) using the following thermal cycling parameters: initial denaturation (94°C for 4 min), followed by 35 cycles of denaturation (94°C for 60 s), annealing at temperatures corresponding to each primer pair as mentioned in Table 1 for 1 min, extension at 72°C for 1 min, and a final extension step at 72°C for 7 min. PCR products were electrophoretically discriminated on 3% agarose gel stained with ethidium bromide and visualized under ultraviolet (UV) light. Amplicon size was determined by making comparison with a 100-bp DNA ladder (Promega). For each SSR primer pair, amplicons of the same size across different isolates were considered to be the same allele.
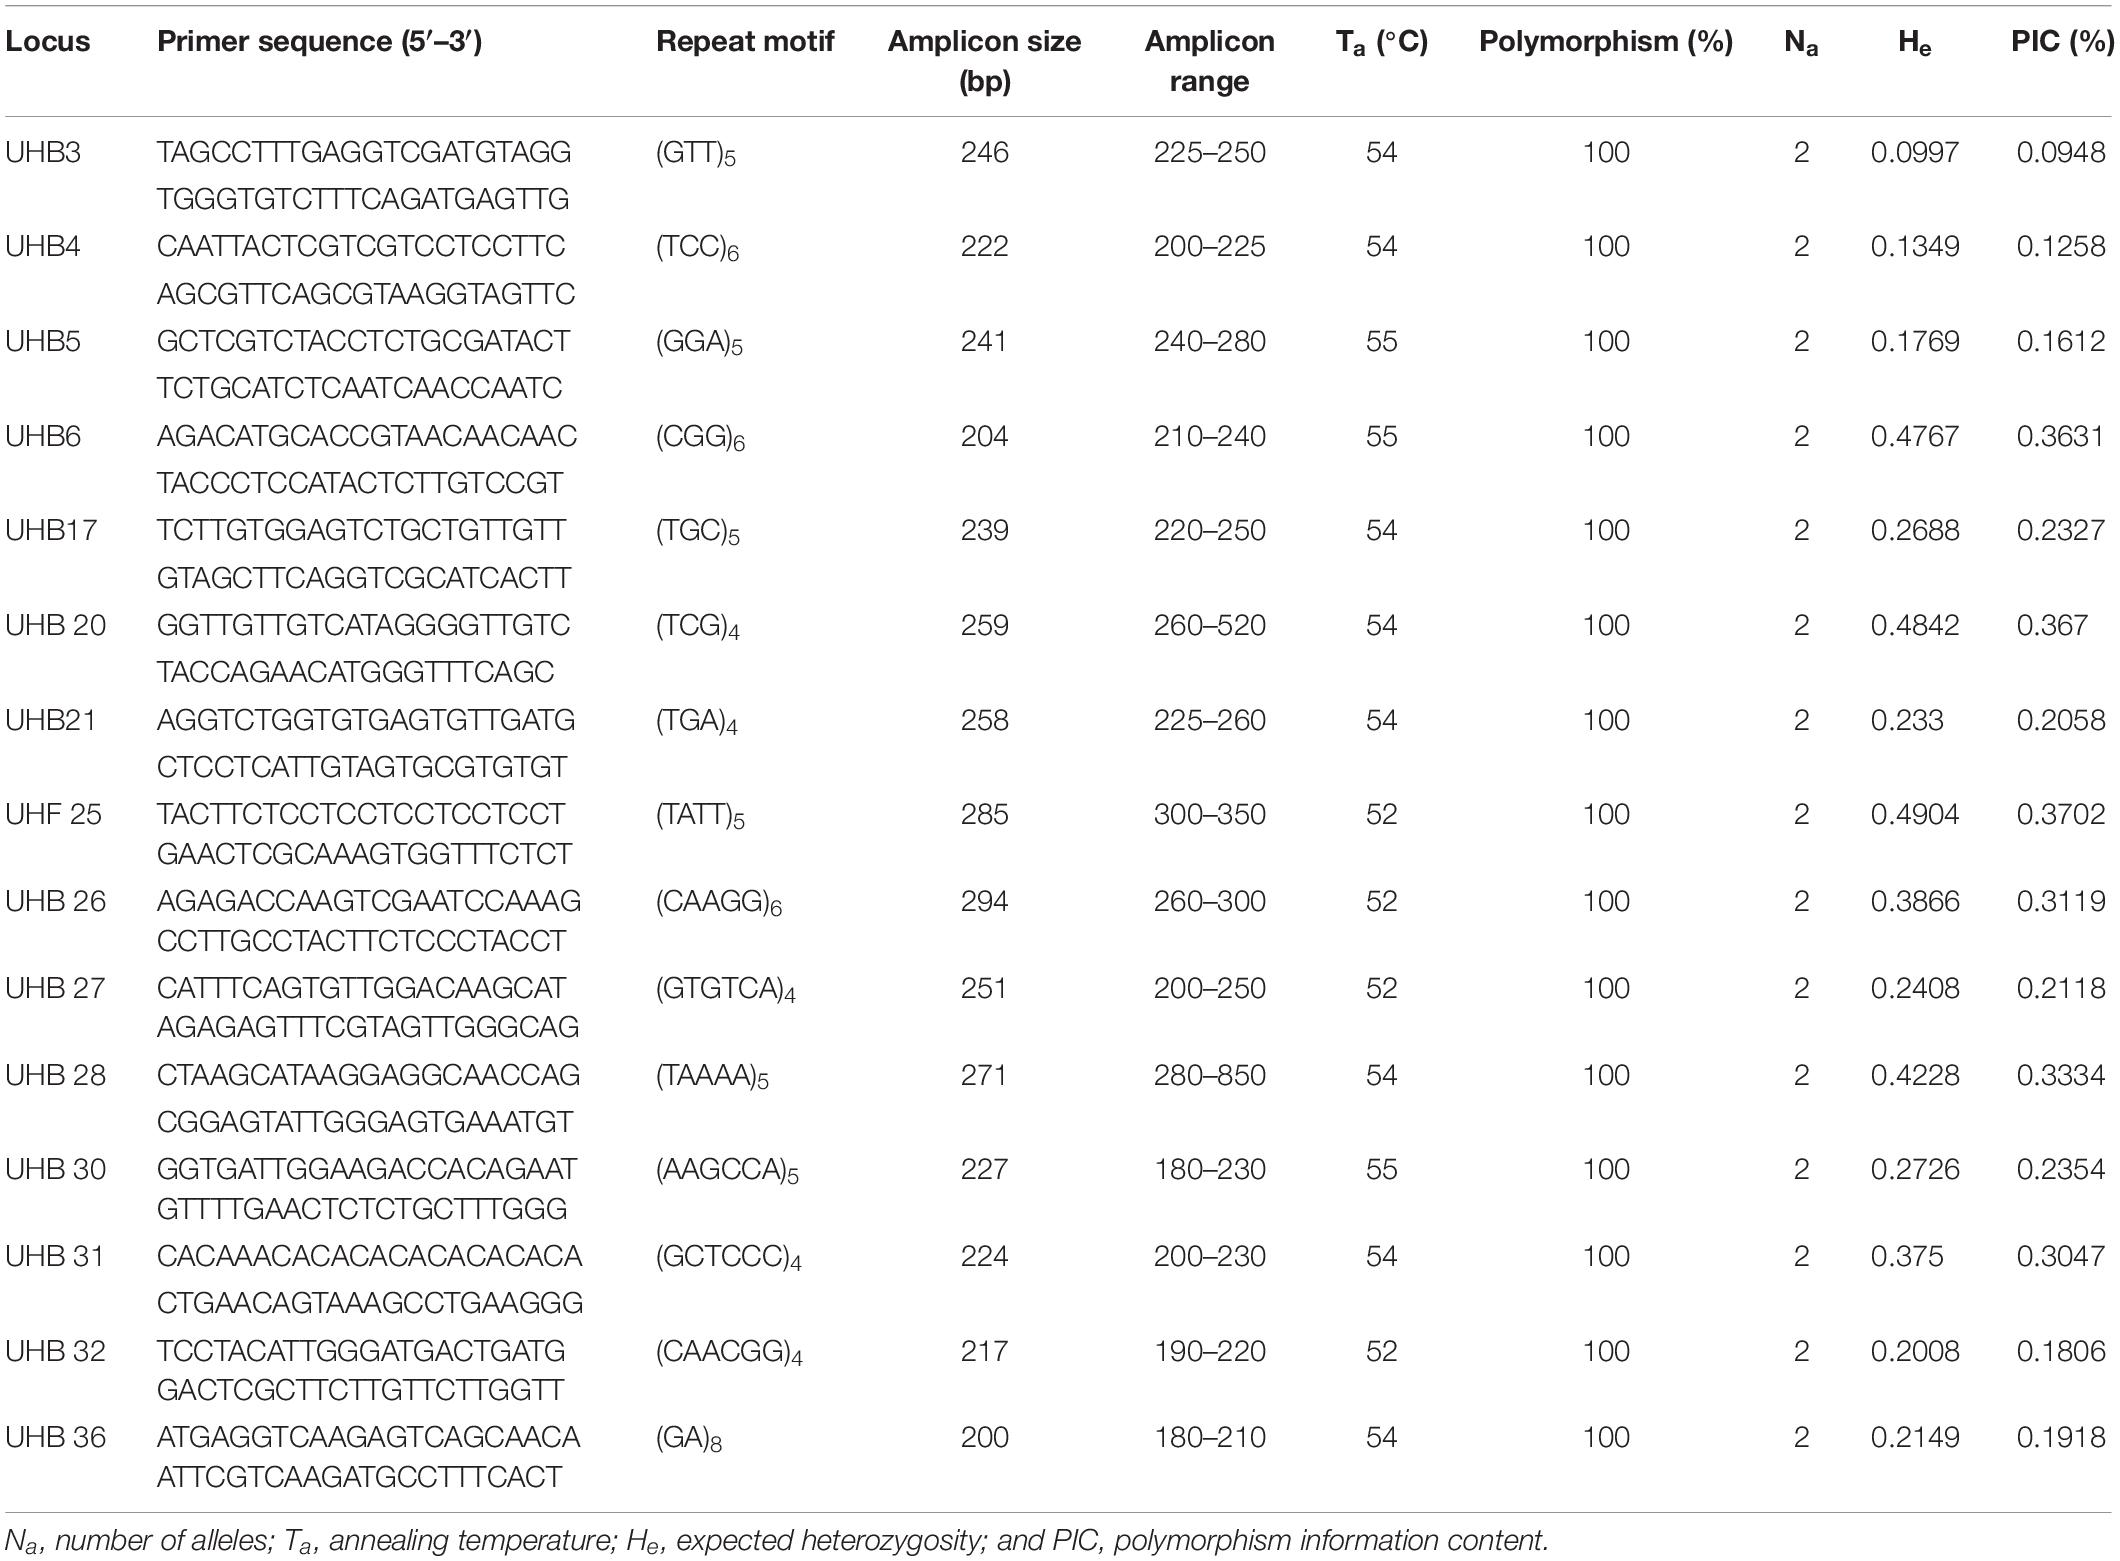
Table 1. Genetic characteristics of 15 polymorphic simple-sequence repeat (SSR) loci in 59 Indian isolates of U. hordei.
Bioinformatic Tools and Molecular Data Analysis
The gels were scored for the presence or absence of prominent and reproducible amplicons. Each amplicon was designated as a locus with two alternative alleles. The data of SSR amplification in different isolates were transformed into a binary data matrix as discrete variables (0 = absence and 1 = presence). The cluster analysis was performed with the NTSYS version 2.1 program (Rohlf, 2002) based on Unweighted Pair Group Method with Arithmetic Mean (UPGMA) algorithm to understand partitioning variation between populations. Bootstrap value was generated by FreeTree software (Pavlícek et al., 1999). GenAlEx 6.5 program (Peakall and Smouse, 2012) was used to determine polymorphic bands (%), the numbers of effective alleles (Ne), Nei’s gene diversity index (H), and Shannon’s information index (I). The polymorphic information content (PIC) value for each SSR marker was calculated using the formula mentioned by Kashyap et al. (2019). POPGENE version 1.31 software (Yeh et al., 1999) was used to calculate the cumulative allelic diversity (Ht), mean allelic diversity within populations (Hs), the proportion of the total allelic diversity (Gst), and the gene flow (Nm) among populations. The hierarchical analysis of molecular variance (AMOVA) was performed using a computer-based GenAlEx 6.5 program (Peakall and Smouse, 2012). Population structure analysis was performed with STRUCTURE 2.3.4 (Pritchard et al., 2000). The most favorable number of populations (K) was selected by testing K = 1 to K = 15 using five independent runs of 25,000 burn in period length at fixed iterations of 100,000. The optimum K-value was standardized by following the methodology of Evanno et al. (2005). The standardized index of association (SIA) was computed using LIAN (Linkage Analysis) version 3.7 software (Haubold and Hudson, 2000) to dissect the linkage disequilibrium (LD) under the null hypothesis that alleles observed at different loci are unlinked.
Results
Detection and Distribution of SSRs in U. hordei Genome
A total of 100,239 and 137,442 mono- to hexa-nucleotide repeat microsatellite sequences were identified from 20.13 and 26.94 Mb of assembled genomic sequences of Uh364 and Uh4857-4 isolates of U. hordei, respectively (Table 2), with an average relative density of 82,253.64 and 85,178.03 bp per Mb and relative abundance of 5125.14 and 5246.27 microsatellites per Mb, respectively. A total of 72,865 and 98,613 SSRs with perfect motifs were detected in the Uh364 and Uh4857-4 genomes, respectively (Supplementary Figure S1). The maximum percent of SSRs among two genome sequence sets was of penta-nucleotide motifs (31.29 and 29.75%) followed by tri-nucleotide (28.27 and 29.88%), hexa-nucleotide (19.86 and 20.78%), mono-nucleotide (17.21 and 16.56%), di-nucleotide (1.8 and 1.59%), and tetra-nucleotides (1.56 and 1.45%) in both Uh364 and Uh4857-4 genomes, respectively (Supplementary Figure S2 and Supplementary Table S3). Microsatellites were categorized into class I consisting of perfect core motifs above 20 bp and class II consisting of 10- to 20-bp-long motifs (Supplementary Figure S3). The number of perfect microsatellites assigned to class I in both the genomes Uh364 and Uh4857-4 was 2049 and 2684, respectively. Similarly within class II, 43,090 and 58,947 SSRs were found in both Uh364 and Uh4857-4 genomes, respectively (Supplementary Figure S3). The most frequent motif in Uh364 and Uh4857-4 genome was CT86 and CAA73 followed by TGT43 and T71, respectively (Supplementary Table S3). Overall, the repeats of A, T, CT, TG, TGT, CAA, AAGC, ATTT, ATAA, TGCT, CTTTT, AAATC, CCCTCG, and CCCTAA were remarkably abundant in both genomes. The A/T motif in both genomes (Uh364 and Uh4857-4) was the most abundant in mono-nucleotide motif (12.19 and 12.08%, respectively). With respect to the di-nucleotide motif, AG/CT was the most abundant type, with a total of 664 (0.91%) and 838 (0.85%) in both genomes, respectively. A total of 5843 and 6691 tri-nucleotide motif types in both genomes were identified with ACG/CGT, representing approximately 8.02 and 6.79%, respectively, while AAG/CTT accounted for 3.85 and 3.27%, respectively, in both genomes (Table 3). The hexa-nucleotide motif, AAAAAG/CTTTTT, covered 0.53 and 0.52% portion of Uh364 and Uh4857-4 genome, respectively (Table 3).
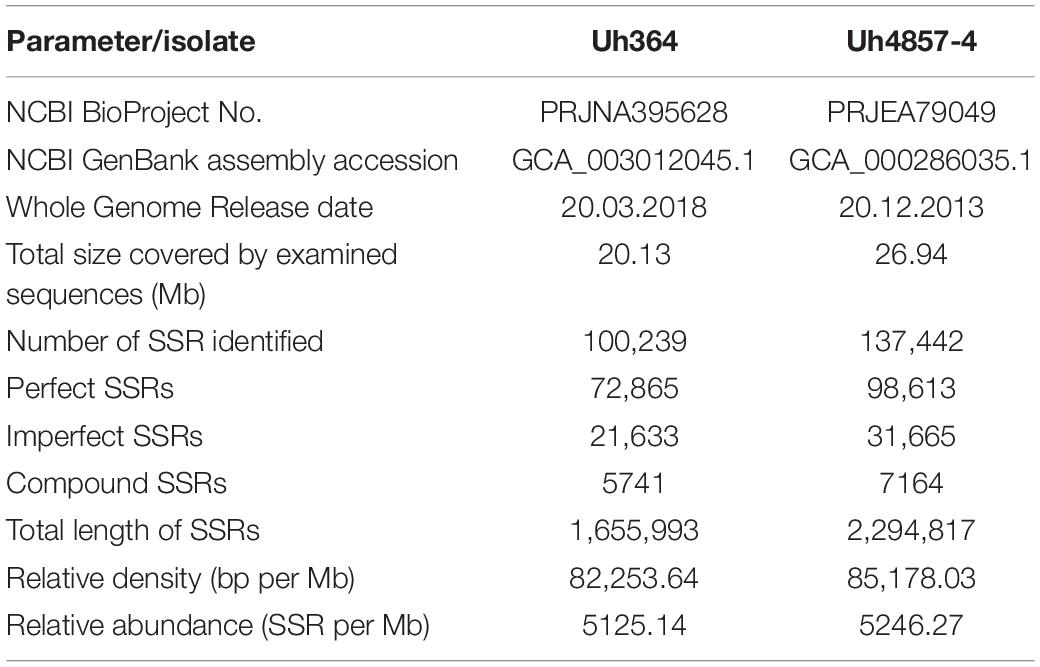
Table 2. Number and distribution of SSRs in whole genome of two isolates of U. hordei.
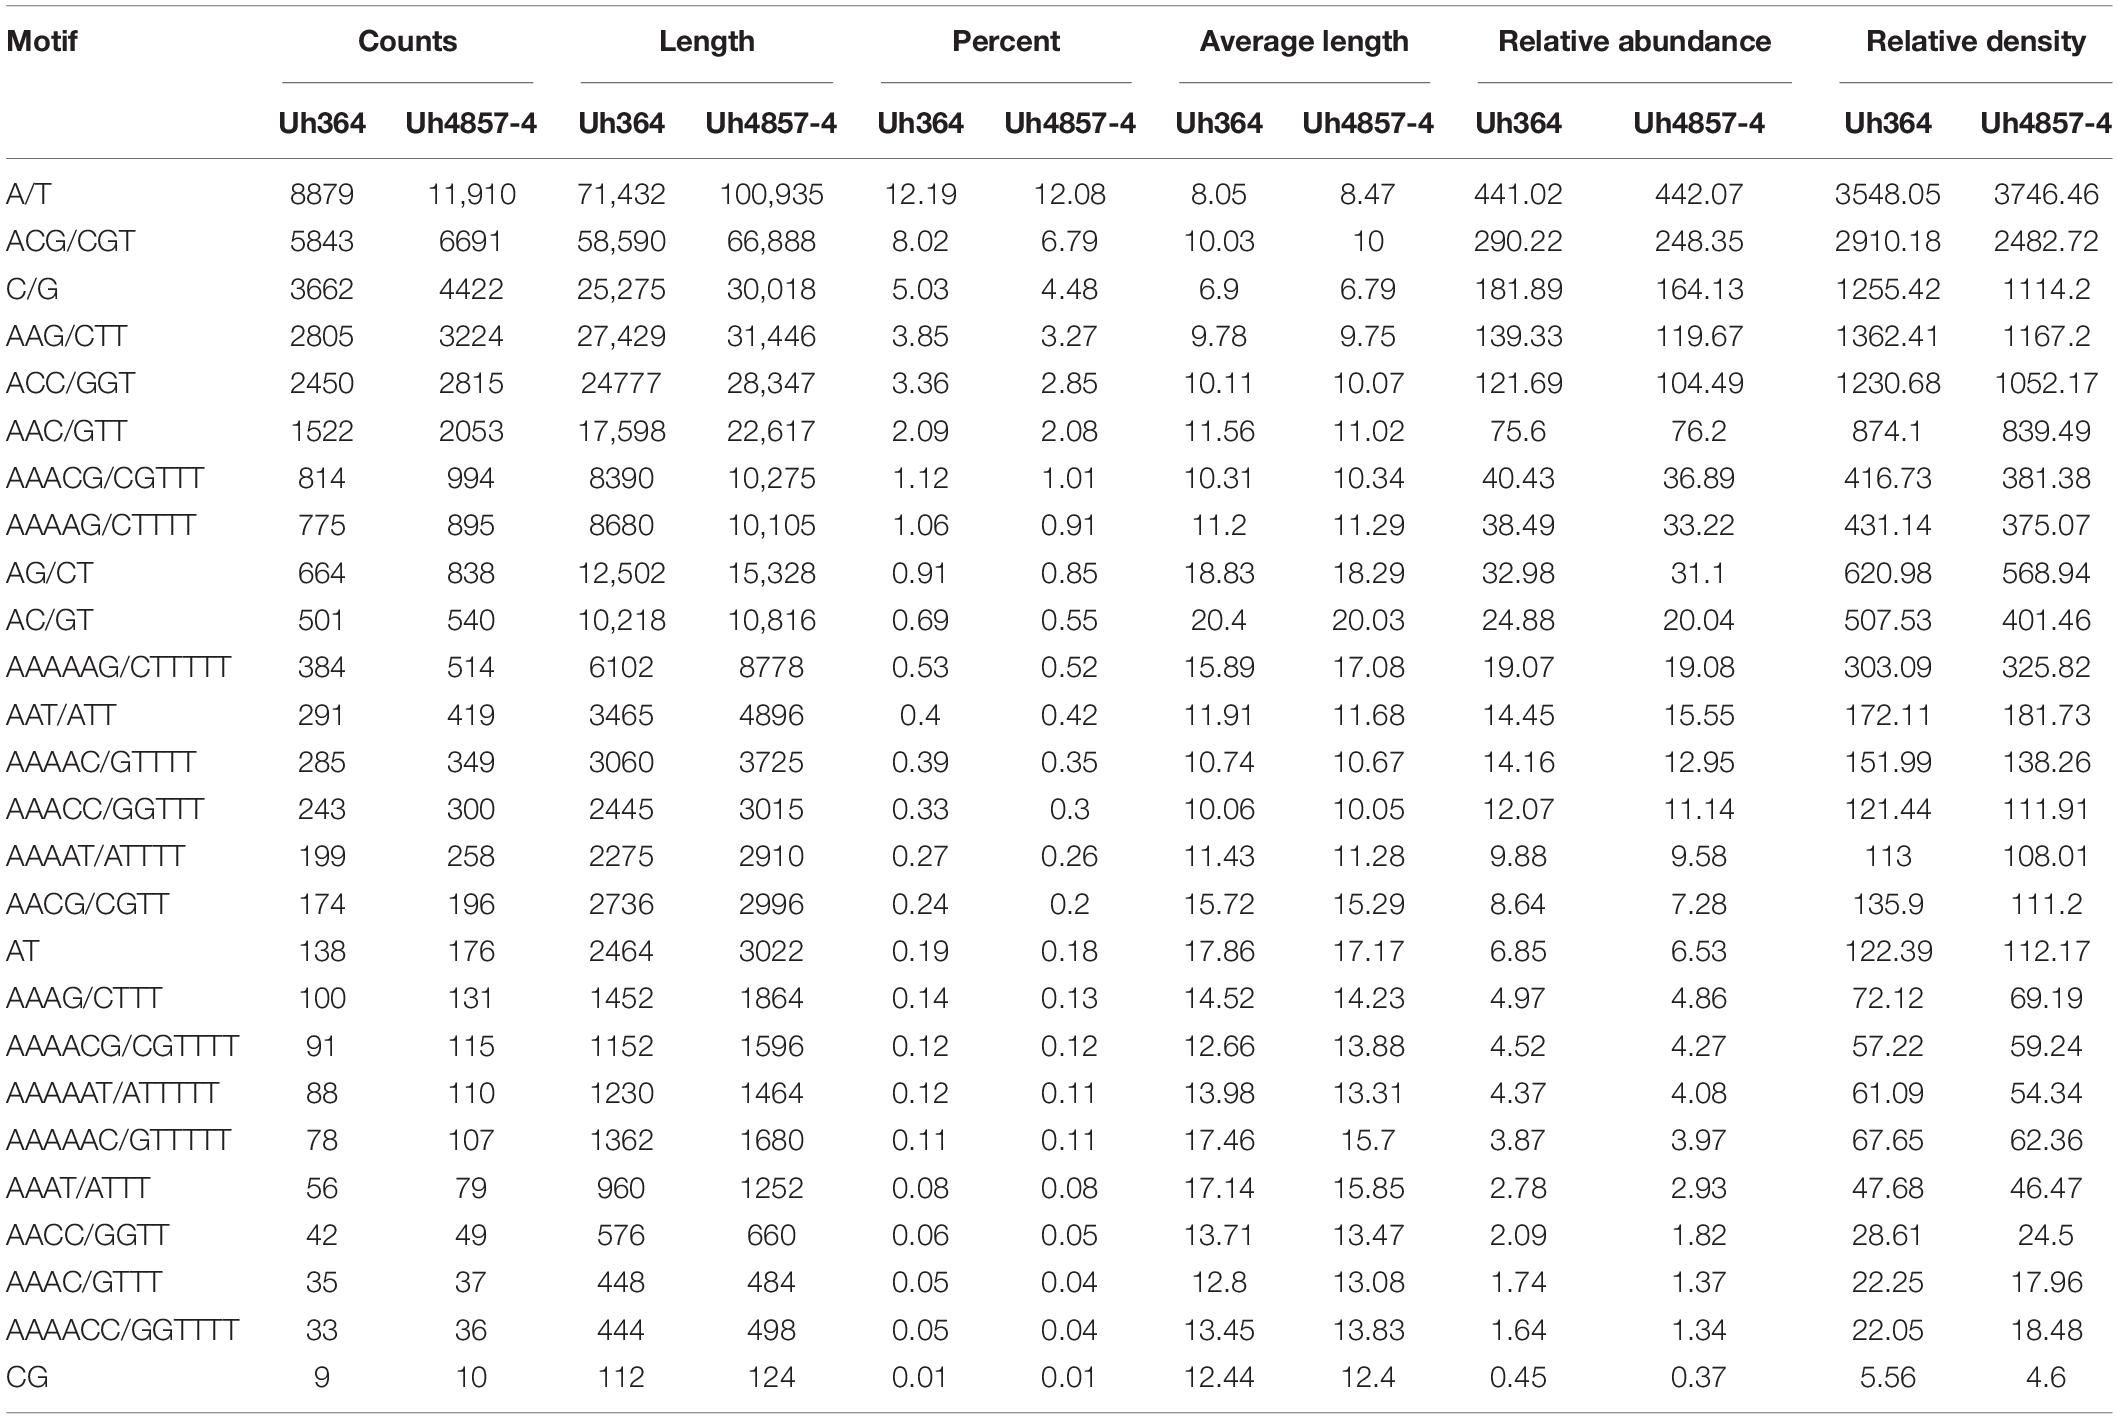
Table 3. Comparative account of total count length, percentage, relative abundance, and relative density of most abundant motifs in the U. hordei genome.
Polymorphism of SSR Markers
To determine the allelic diversity among U. hordei isolates, 50 randomly selected SSR primers present in both genomes were employed. Thirty-five SSR primer pairs displayed prominent amplification of at least single amplicon while the remaining primers did not show any amplification. Out of 35, only 15 primers (Table 1) revealed polymorphism and therefore employed further for analyzing genetic studies of 59 isolates of U. hordei collected from barley fields of hilly (HZ) and plain (PZ) terrains. The polymorphism data for each locus are mentioned in Table 1. An average of two alleles per microsatellite was generated with band size ranging from 180 to 850 bp. PIC was varied between 0.095 and 0.37 (Table 1). Ewens–Watterson test indicated that all the tested markers are of neutral type (Supplementary Table S4).
Population Genetic Diversity Analysis
Genetic analysis revealed that effective alleles (Ne) and expected heterozygosity (He) across all 15 loci in the whole population were varied from 1.3221 to 2.8792 and 0.0997 to 0.4904, respectively (Supplementary Table S5). The quantitative estimates of various genetic diversity indices for two distinct populations of U. hordei from barley-growing regions are shown in Table 4. Higher Na-value (1.433) was observed in the PZ population, while a lower value (1.066) was recorded in the HZ population (Table 4). In terms of expected heterozygosity (He) and effective alleles (Ne), the HZ population showed the least values (He = 0.1384; Ne = 0.766) relative to the PZ population (He = 0.2696; Ne = 1.140). Similarly, unbiased gene diversity (uHe) was the least in the PZ population (uHe = 0.5271) compared to the HZ population (uHe = 0.5903). The polymorphic loci (%) were varied from 86.67 (HZ) to 100% (PZ), with an average of 93.34% (Table 4). No private allele was detected in the entire population.
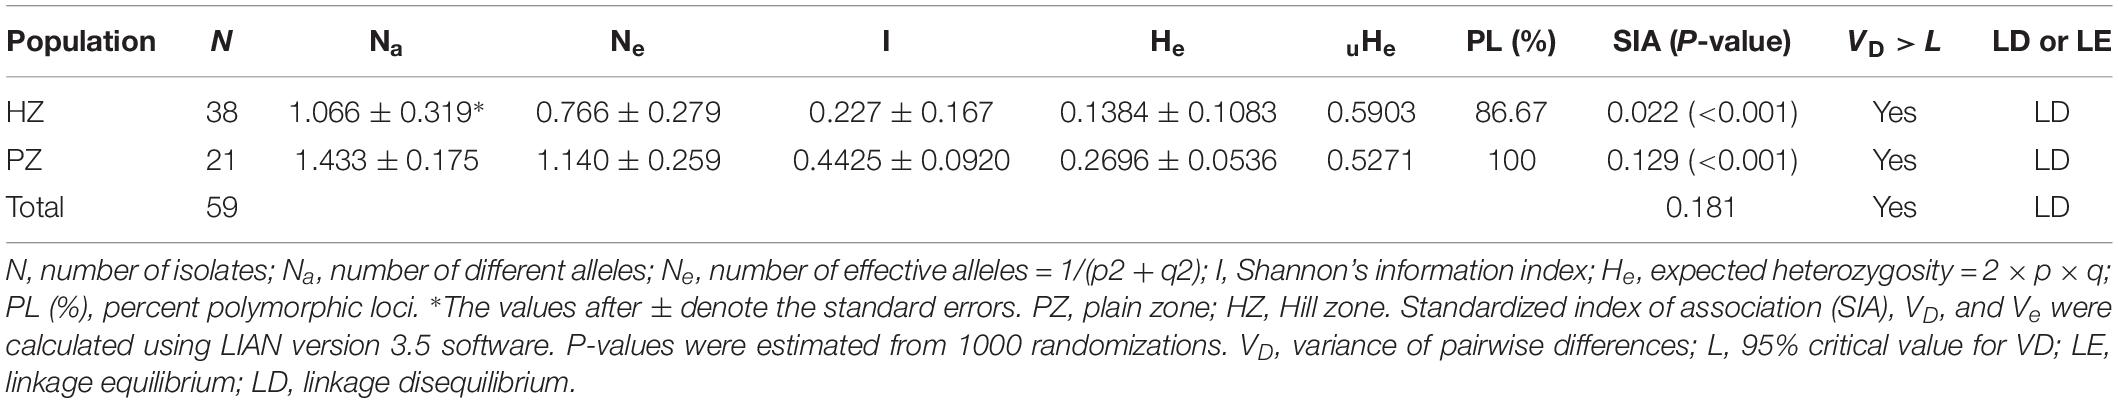
Table 4. Summary of the population diversity indices and estimation of linkage disequilibrium computed on the basis of SSR markers.
Genetic Differentiation
The results of AMOVA (Supplementary Table S6) revealed distribution of substantial genetic variation within U. hordei isolates (87%); however, genetic variation among populations was low (13%). Pairwise comparison between HZ and PZ populations reflected very low but significant genetic distance values (P < 0.001). The average and constant level of gene flow (Nm = 1.009) was noticed between HZ and PZ populations. Pairwise comparison of HZ and PZ showed a genetic identity of 0.198 levels (Supplementary Table S7).
Population Genetic Structure
The dendrogram based on UPGMA displayed spatial clustering and divided all the 59 isolates of U. hordei into two distinct groups at the similarity coefficient level of 0.65 (Figure 2). Cluster I consisted of seven isolates (PB-22, HR-294, RJ-314, RJ-320, RJ-298, HR-304, and UP-135), which were collected from PZ representing Punjab, Haryana, Rajasthan, and Uttar Pradesh states. Several sub-groups were noticed in cluster II, indicating genetic variability within and among isolates of both zones. Cluster II includes 38 isolates representing HZ and were collected from Uttarakhand (UK-46, UK-222, UK-358, UK-412, UK-418, UK-423, UK-429, UK-431, UK-442, UK-248, UK-393, UK-44, UK-51, UK-53, UK-71, and UK-74) and Himachal Pradesh (HP-250, HP-255, HP-256, HP-258, HP-416, HP-417, HP-436, HP-439, HP-440, HP-36, HP-199, HP-201, HP-366, HP-367, HP-397, HP-399, HP-400, HP-28, HP-29, HP-34 HP-85, and HP-18) states.
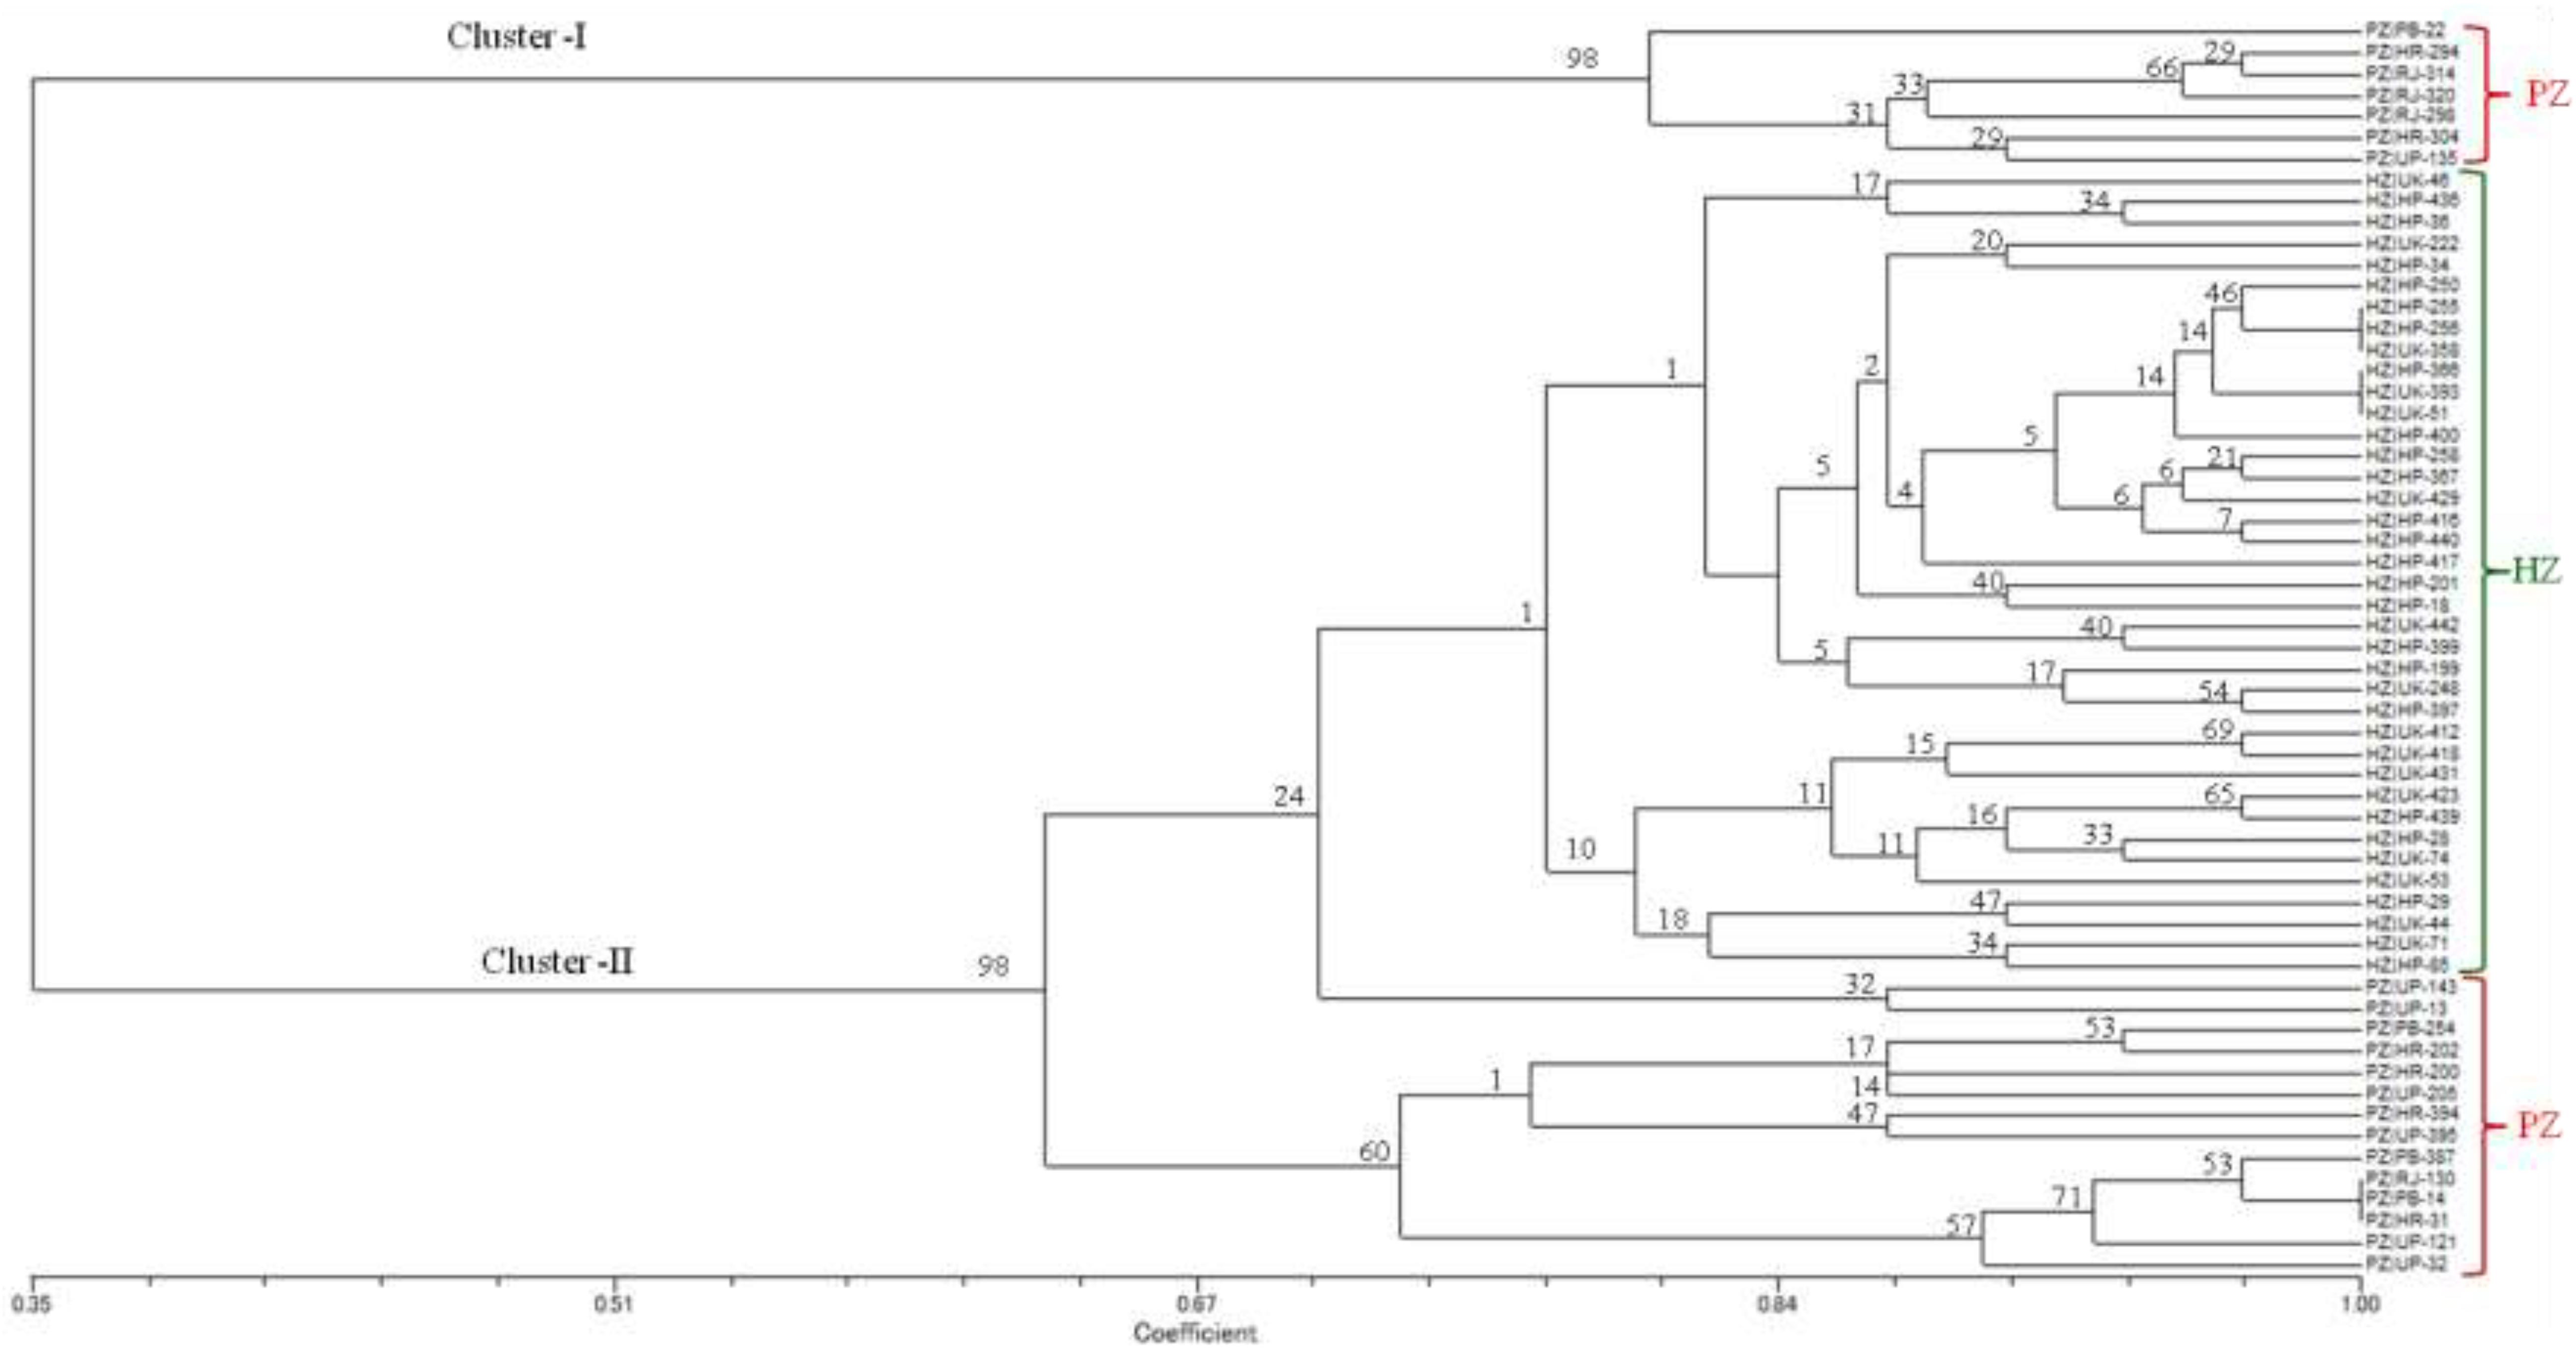
Figure 2. UPGMA dendrogram from SSR data for 59 isolates of Ustilago hordei amplified by 15 microsatellites. Scale indicates Jaccard’s coefficient of similarity. The numbers at the branches are confidence values based on Felsenstein’s bootstrap produced by FreeTree software (Pavlícek et al., 1999). HZ, hill zone; PZ, plain zone.
There was a sub-cluster of 14 isolates (UP-143, UP-13, PB-254, HR-202, HR-200, UP-205, HR-394, UP-395, PB-387, RJ-130, PB-14, HR-31, UP-121, and UP-32) grouped into cluster II, representing Punjab, Haryana, Rajasthan, and Uttar Pradesh states.
Structure analysis performed to determine the genetic relationship among U. hordei isolates, excluding loci with null alleles, demonstrated a strong signal with a single clear peak at K = 2 (Figure 3). Moreover, K = 2 indicated the existence of two genetically distinct groups within the 59 studied U. hordei isolates.
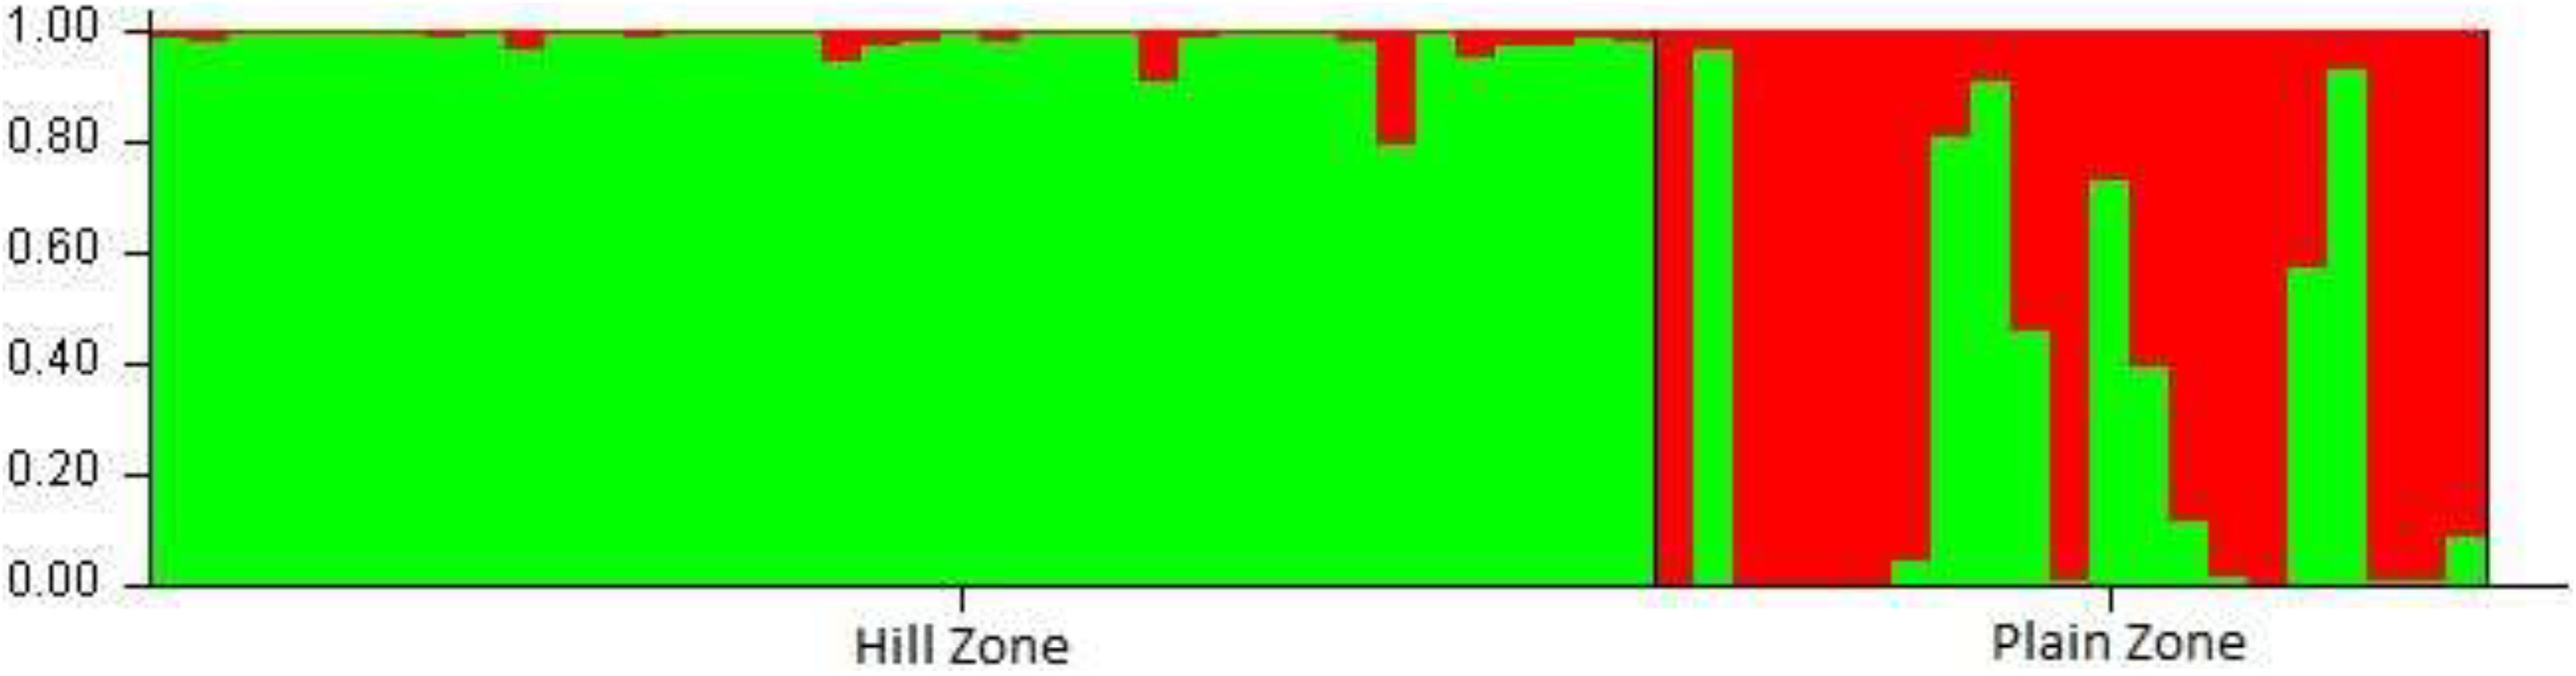
Figure 3. Population structure analysis of 59 isolates of Ustilago hordei. Analysis was carried out using STRUCTURE software with K set at 2. Inferred ancestries of the 59 UH isolates were based on two geographical distinct population.
Linkage Disequilibrium
The LD analysis reflected positive but low SIA values (0.0229–0.129) that deviated from zero in the case of both HZ and PZ populations (Table 4). When isolates of U. hordei representing HZ and PZ were evaluated as a single population, a SIA value of 0.181 (P < 0.001) and a VD-value higher than the L-value was observed, advocating a state of LD (Table 4).
Discussion
The whole genome data of two isolates of U. hordei (Uh4857-4 and Uh364) have been released in 2013 and 2018, respectively, but, still these have not been elucidated for distribution, abundance, and frequency of microsatellite motifs. To the best of our knowledge, the present investigation provides the first comprehensive information about the microsatellite distribution and their comparison between assembled genomes of both the U. hordei isolates. Further, 15 new microsatellite markers were developed for analyzing the genetic differentiation and population structure of 59 isolates of U. hordei collected from barley field representing two different terrains (HZ and PZ) in India. In earlier reports, a small number of microsatellites developed from U. hordei genome have been utilized for analyzing the genetic variability between the isolates of U. hordei in China (Yu et al., 2016). However, the current study was performed on the complete genome assembly of Uh4857-4 and Uh364 isolates and non-coding sequences were also included. As a consequence, it permits to report a huge number of microsatellites (100239 in Uh364 and 137442 in Uh4857-4) compared to earlier reports in phytopathogenic fungi (Kumar et al., 2012; Singh et al., 2014a; Zhang et al., 2015; Mahfooz et al., 2017; Choudhary et al., 2018; Varady et al., 2018). In the present study, the relative abundance of microsatellites in the whole genome of Uh4857-4 (5246.27 microsatellites per Mb) and Uh364 (5125.14 microsatellites per Mb) is quite similar, suggesting the highly homogeneous genomic structure of these two U. hordei isolates. Moreover, the pattern of microsatellite distribution in terms of motif type and repeat number is almost identical in assembled genome of both the isolates. The A/T-rich motifs are present in large numbers, while C/G-rich motifs are least dominated in both genomes, which is in agreement with earlier reports of Singh et al. (2011). This observed microsatellite expansion and variation might be due to replication slippage that happened during DNA replication and observed more frequently in A/T-rich motifs in comparison to C/G-rich motifs as reported earlier (Klintschar et al., 2004; Forster et al., 2015).
In the current investigation, two terrains, i.e., HZ and PZ, were chosen because they are geographically distinct from one another, differ greatly in size, and are subject to different barley cultivation and management practices. The results of the present study revealed low but significant genetic differentiation in U. hordei isolates with a similarity coefficient of over 60%. Parallel to these findings, Xu et al. (2004) also documented the phenomenon of diverse geographical origin of U. scitaminea population with small values of dissimilarity coefficients (Owati et al., 2019). The low level of genetic differentiation and formation of two distinct sub-groups within U. hordei isolates of PZ reflected an extreme event of genetic discrimination that happened at a small scale, probably due to migration. Moreover, it seems that probably in some of the areas of HZ, U. hordei isolates migrated from PZ through anthropogenic activities linked with barley seed production and distribution. This statement was firmly supported by the restricted and sympatric distribution of two distinct clusters (PZ and HZ) in the barley sampling fields and by the observation that two different barley-growing terrains were clustered in the same lineages. Therefore, the PZ population was most likely migrated into the HZ in recent times.
An AMOVA based of microsatellite markers revealed that 13% of the total molecular variance belonged to variation among U. hordei populations (P < 0.001), whereas the rest (87%) was due to variations within population. Similarly, low variation (16%) among population of U. maydis and comparatively more variation (84%) within U. maydis population were observed in Mexico (Jiménez-Becerril et al., 2018). On parallel lines, Owati et al. (2019) reported 85% of the total diversity within the population of Didymella pisi, and 15% of the total genetic diversity among populations in Montana. Thus, a major portion of total molecular variance that existed within the population, as observed in the present study, could be due to the relatively moderate level of gene flow (Nm = 1.009) between the U. hordei population (geographic distance between populations of 150–800 km). Therefore, migration plays a more important role than genetic drift in the case of the present study. It is also a well-established fact that in the sampling sites, the teliospores of CS fungus are proficient for travel by wind and human interventions, resulting in minimizing the genetic differences among populations. Moreover, there is also the possibility that the genetic differences in the U. hordei population may be influenced by environmental conditions, geography, and cultivation of different types of barley cultivars. Overall, it seems that gene flow mediated processes as a consequence of anthropogenic activities, such as movement and exchange of infected plant material responsible for causing significant variation among a pathogen population.
There are several reports that describe low level of genetic variation in basidiomycetes fungi (Hamelin et al., 1995; Braithwaite et al., 2004; Zhou et al., 2008). Similarly, the average similarity coefficient was 0.65, demonstrating a moderate level of genetic variation among all the studied isolates. This may be attributed to the regular exchange of barley cultivars of PZ to HZ areas in recent time owing to the fact that U. hordei is a seed- and soil-borne fungus. LD analysis conducted to explore the extent of recombination within U. hordei population indicated positively significant but relatively low SIA value deviating extensively from zero in both the population sets. This clearly indicated a state of LD in both PZ and HZ populations, which might be due to the presence of epidemic isolates (i.e., isolates exhibiting strong competitive potential). These results are in line with the earlier reports of Lomholt et al. (2001); Haubold and Hudson (2000), Morrison et al. (2008), and Kashyap et al. (2019). The current study provides the baseline information, and a large sample size coupled with ecology data of a wider geographical area in HZ and PZ is still required to validate the LD state of the U. hordei population. Moreover, Bayesian clustering and UPGMA analysis based on polymorphic SSR markers also divided U. hordei population into two distinct genetic clusters. However, 23.72% isolates were found as admixture. These observations were similar to the earlier findings of Yu et al. (2016), where they reported molecular variation and differentiation associated with geographical origin excluding few isolates of U. hordei belonging to Tibetan areas of China. Structure analysis in the present study revealed two clusters (K = 2 with microsatellite data) and pointed toward the existence of significant structure in U. hordei populations. The population structure is composed of sub-groups formed as a result of admixture of isolates representing PZ isolates in HZ cluster and thereby highlighting a common origin source for U. hordei populations or the role of migration and gene flow among U. hordei populations.
The microsatellite markers generated in the current investigation are very useful to decipher the genetic variability and population structure of U. hordei isolates from barley fields of India. Despite geographical barriers (HZ and PZ), the observed genetic variations in the U. hordei population suggest frequent exchange of planting materials and dispersal of inocula among the barley growing regions. Migration of U. hordei isolates between barley-growing regions appeared accidental through movement of infected materials or though barley breeding linked processes. Overall, this study provides baseline information that can be further utilized to dissect evolutionary history and pathogen biology for in-depth analysis of disease dynamics, plant–fungus interactions, and development and deployment of resistant varieties and evolve effective disease management module. Moreover, genomic resources generated from this study can be used to develop novel specific primers for identification and molecular characterization of U. hordei.
Data Availability Statement
Publicly available datasets were analyzed in this study. This data can be found here: https://www.ncbi.nlm.nih.gov/genome/?term=ustilago+hordei.
Author Contributions
PK and SK conceived and designed the work, and drafted the manuscript. PK, SK, and PJ performed the sampling survey. RK, RT, PK, AS, and PS conducted the experiments. RT, PJ, and AS performed the data analysis. SK and GS performed the final editing and proofing of the manuscript. All authors approved the submitted version of the manuscript.
Conflict of Interest
The authors declare that the research was conducted in the absence of any commercial or financial relationships that could be construed as a potential conflict of interest.
Acknowledgments
We are highly thankful to the Indian Council of Agricultural Research (ICAR) for providing research grant under the Institute Research projects “Management of Major Diseases and Insect Pests of Wheat in an Agro-Ecological Approach under Climate Change (CRSCIIWBRSIL201500500186)” and “Improvement of Malt, Feed Food and Dual Purpose Barley for Better Yield, Quality and Biotic and Abiotic Stresses (CRSCIIWBRSIL201501000191.1).”
Supplementary Material
The Supplementary Material for this article can be found online at: https://www.frontiersin.org/articles/10.3389/fmicb.2019.02929/full#supplementary-material
Footnotes
References
Ben-yephet, Y., Henis, Y., and Dinoor, A. (1975). Inheritance of tolerance of carboxin and benomyl in Ustilago hordei. Phytopathology 64, 51–56.
Braithwaite, K. S., Bakkeren, G., Croft, B. J., and Brumbley, S. M. (2004). Genetic variation in a worldwide collection of the sugarcane smut fungus Ustilago scitaminea. Proc. Aust. Soc. Sugar Cane Technol. 26, 1–9.
Choudhary, P., Kashyap, P. L., Goswami, S. K., Chakdar, H., Srivastava, A. K., and Saxena, A. K. (2018). Genome-wide analysis of microsatellites in Alternaria arborescens and elucidation of the function of polyketide synthase (PksJ). Interdiscip. Sci. Comput. Life. Sci. 10:813. doi: 10.1007/s12539-017-0251-6
Du, L., Zhang, C., Liu, Q., Zhang, X., and Yue, B. (2018). Krait: an ultrafast tool for genome-wide survey of microsatellites and primer design. Bioinformatics 34, 681–683. doi: 10.1093/bioinformatics/btx665
Ellegren, H. (2004). Microsatellites: simple sequences with complex evolution. Nat. Rev. Genet. 5, 435–445. doi: 10.1038/nrg1348
Evanno, G., Regnaut, S., and Goudet, J. (2005). Detecting the number of clusters of individuals using the software STRUCTURE: a simulation study. Mol. Ecol. 14, 2611–2620. doi: 10.1111/j.1365-294x.2005.02553.x
Forster, P., Hohoff, C., Dunkelmann, B., Schürenkamp, M., Pfeiffer, H., Neuhuber, F., et al. (2015). Elevated germline mutation rate in teenage fathers. Proc. R. Soc. B Biol. Sci. 282:20142898. doi: 10.1098/rspb.2014.2898
Goswami, S. K., Singh, V., and Kashyap, P. L. (2017). Population genetic structure of Rhizoctonia solani AG1IA from rice field in North India. Phytoparasitica 45, 299–316. doi: 10.1007/s12600-017-0600-3
Goswami, S. K., Singh, V., Kashyap, P. L., and Singh, P. K. (2019). Morphological characterization and screening for sheath blight resistance using Indian isolates of Rhizoctonia solani AG1IA. Indian Phytopathol. 72, 107–124. doi: 10.1007/s42360-018-0103-2
Grewal, T. S., Rossnagel, B. G., Bakkeren, G., and Scoles, G. J. (2008). Identification of resistance genes to barley covered smut and mapping of the Ruh1 gene using Ustilago hordei strains with defined avirulence genes. Can. J. Plant Pathol. 30, 277–284. doi: 10.1080/07060661.2008.10540543
Hamelin, R. C., Beaulieu, J., and Plourde, A. (1995). Genetic diversity in populations of Cronartium ribicola in plantations and natural stands of Pinus strobus. Theor. Appl. Genet. 91, 1214–1221. doi: 10.1007/BF00220932
Haubold, H., and Hudson, R. R. (2000). LIAN 3.0: detecting linkage disequilibrium in multilocus data. Bioinformatics 16, 847–848.
Henry, C. E., Gaines, V., Bullock, B., and Schaefer, R. W. (1987). Genetics of Ustilago hordei: fungicide resistant mutants. Bot. Gaz. 148, 501–506. doi: 10.1086/337681
Hu, G. G., Linning, R., and Bakkeren, G. (2002). Sporidial mating and infection process of the smut fungus, Ustilago hordei, in susceptible barley. Can. J. Bot. 80, 1103–1114. doi: 10.1139/b02-098
Jiménez-Becerril, M. F., Hernández-Delgado, S., Solís-Oba, M., and González Prieto, J. M. (2018). Analysis of mitochondrial genetic diversity of Ustilago maydis in Mexico. Mitochondrial DNA A DNA Mapp. Seq. Anal. 29, 1–8. doi: 10.1080/24701394.2016.1229776
Karwasra, S. S., Mukherjee, A. K., Swain, S. C., Mohapatra, T., and Sharma, R. P. (2002). Evaluation of RAPD, ISSR and AFLP markers for characterization of the loose smut fungus Ustilago tritici. J. Plant Biochem. Biotechnol. 11, 99–103. doi: 10.1007/bf03263143
Kashyap, P. L., Kumar, S., Tripathi, R., Kumar, R. S., Jasrotia, P., Singh, D. P., et al. (2019). Phylogeography and population structure analysis reveals diversity by gene flow and mutation in Ustilago segetum (Pers.) Roussel tritici causing loose smut of wheat. Front. Microbiol. 10:1072.
Kashyap, P. L., Rai, S., Kumar, S., and Srivastava, A. K. (2016). Genetic diversity, mating types and phylogenetic analysis of Indian races of Fusarium oxysporum f. sp. ciceris from chickpea. Arch. Phytopathol. Plant Prot. 49, 533–553.
Kashyap, P. L., Rai, S., Kumar, S., Srivastava, A. K., Anandaraj, M., and Sharma, A. K. (2015). Mating type genes and genetic markers to decipher intraspecific variability among Fusarium udum isolates from pigeonpea. J. Basic Microbiol. 55, 846–856. doi: 10.1002/jobm.201400483
Kaur, A., Sharma, V. K., Ritu Rani, and Mohan, C. (2014). Management of covered smut of barley through cultural, chemical and biological methods. J. Mycol. Plant Pathol. 44, 432–437.
Klintschar, M., Dauber, E.-M., Ricci, U., Cerri, N., Immel, U.-D., Kleiber, M., et al. (2004). Haplotype studies support slippage as the mechanism of germline mutations in short tandem repeats. Electrophoresis 25, 3344–3348. doi: 10.1002/elps.200406069
Kozar, F. (1969). The pathway of infection of Ustilago hordei. Can. J. Genet. Cytol. 11, 977–986. doi: 10.1139/g69-114
Kumar, S., Maurya, D., Rai, S., Kashyap, P. L., and Srivastava, A. K. (2012). Computational mining and genome wide distribution of microsatellite in Fusarium oxysporum f. sp. lycopersici. Not.Sci. Biol. 4, 127–131. doi: 10.15835/nsb448271
Kumar, S., Rai, S., Maurya, D. K., Kashyap, P. L., Srivastava, A. K., and Anandaraj, M. (2013). Cross-species transferability of microsatellite markers from Fusarium oxysporum for the assessment of genetic diversity in Fusarium udum. Phytoparasitica 41, 615–622. doi: 10.1007/s12600-013-0324-y
Lomholt, J. A., Poulsen, K., and Kilian, M. (2001). Epidemic population structure of Pseudomonas aeruginosa: evidence for a clone that is pathogenic to the eye and that has a distinct combination of virulence factors. Infect Immun. 69, 6284–6295. doi: 10.1128/iai.69.10.6284-6295.2001
Mahfooz, S., Singh, S. P., Mishra, N., and Mishra, A. (2017). A comparison of microsatellites in phytopathogenic Aspergillus species in order to develop markers for the assessment of genetic diversity among its isolates. Front Microbiol. 8:1774. doi: 10.3389/fmicb.2017.01774
Mathre, D. E. (1997). Compendium of Barley Diseases. St. Paul, MN: American Phytopathological Society Press.
Moges, A. D., Admassu, B., Belew, D., Yesuf, M., Njuguna, J., Kyalo, M., et al. (2016). Development of microsatellite markers and analysis of genetic diversity and population structure of Colletotrichum gloeosporioides from Ethiopia. PLoS One 11:e0151257. doi: 10.1371/journal.pone.0151257
Montarry, J., Andrivon, D., Glais, I., Corbiere, R., Mialdea, G., and Delmotte, F. (2010). Microsatellite markers reveal two admixed genetic groups and an ongoing displacement within the French population of the invasive plant pathogen Phytophthora infestans. Mol. Ecol. 19, 1965–1977. doi: 10.1111/j.1365-294X.2010.04619.x
Morrison, L. J., Mallon, M. E., Smith, H. V., MacLeod, A., Xiao, L., and Tait, A. (2008). The population structure of the Cryptosporidium parvum population in Scotland: a complex picture. Infect. Genet. Evol. 8, 121–129. doi: 10.1016/j.meegid.2007.10.010
Owati, A., Agindotan, B., and Burrows, M. (2019). First microsatellite markers developed and applied for the genetic diversity study and population structure of Didymella pisi associated with ascochyta blight of dry pea in Montana. Fungal Biol. 123, 384–392. doi: 10.1016/j.funbio.2019.02.004
Pavlícek, A., Hrdá, S., and Flegr, J. (1999). Free-Tree–freeware program for construction of phylogenetic trees on the basis of distance data and bootstrap/jackknife analysis of the tree robustness. Application in the RAPD analysis of genus Frenkelia. Folia Biol 45, 97–99.
Peakall, R. O. D., and Smouse, P. E. (2012). GENALEX 6.5: genetic analysis in Excel. Population genetic software for teaching and research – an update. Bioinformatics 28, 2537–2539. doi: 10.1093/bioinformatics/bts460
Prasad, P., Bhardwaj, S. C., Savadi, S., Kashyap, P. L., Gangwar, O. P., Khan, H., et al. (2018). Population distribution and differentiation of Puccinia graminis tritici detected in the Indian subcontinent during 2009–2015. Crop Prot. 108, 128–136. doi: 10.1016/j.cropro.2018.02.021
Pritchard, J. K., Stephens, M., and Donnelly, P. (2000). Inference of population structure using multilocus genotype data. Genetics 155, 945–959.
Rai, S., Kashyap, P. L., Kumar, S., Srivastava, A. K., and Ramteke, P. W. (2016). Comparative analysis of microsatellites in five different antagonistic Trichoderma species for diversity assessment. World J. Microbiol. Biotechnol. 32:8. doi: 10.1007/s11274-015-1964-5
Rau, D., Maier, F. J., Papa, R., Brown, A. H. D., Balmas, V., Saba, E., et al. (2005). Isolation and characterization of the mating-type locus of the barley pathogen Pyrenophora teres and frequencies of mating-type idiomorphs within and among fungal populations collected from barley landraces. Genome 48, 855–869. doi: 10.1139/g05-046
Rohlf, F. J. (2002). “Geometric morphometrics and phylogeny,” in Morphology, Shape and Phylogeny, ed. P. L. Forey (Boca Raton, FL: CRC Press), 175–193. doi: 10.1201/9780203165171.ch9
Scott, J. B., and Chakraborty, S. (2010). Genotypic diversity in Fusarium pseudograminearum populations in Australian wheat fields. Plant Pathol. 59, 338–347. doi: 10.1111/j.1365-3059.2009.02219.x
Sharma, P., Pandey, B., Muthusamy, S. K., Kumar, S., Saharan, M. S., Kumar, S., et al. (2018). Development and validation of microsatellite markers for Karnal bunt (Tilletia indica) and loose smut (Ustilago segetum tritici) of wheat from related fungal species. J. Phytopathol. 166, 729–738. doi: 10.1111/jph.12756
Singh, R., Kumar, S., Kashyap, P. L., Srivastava, A. K., Mishra, S., and Sharma, A. K. (2014a). Identification and characterization of microsatellite from Alternaria brassicicola to assess cross-species transferability and utility as a diagnostic marker. Mol. Biotechnol. 56, 1049–1059. doi: 10.1007/s12033-014-9784-7
Singh, R., Kumar, A., Kharub, A. S., Kumar, V., Chhokar, R. S., Selvakumar, R., et al. (2014b). Barley cultivation in India. directorate of wheat research, Karnal-132001. Extension Bull. 53:18.
Singh, R., Sheoran, S., Sharma, P., and Chatrath, R. (2011). Analysis of simple sequence repeats (SSRs) dynamics in fungus Fusarium graminearum. Bioinformation 5, 402–404. doi: 10.6026/97320630005402
Sun, X., Kang, S., Zhang, Y., Tan, X., Yu, Y., He, H., et al. (2013). Genetic diversity and population structure of rice pathogen Ustilaginoidea virens in China. PLoS One 8:e76879. doi: 10.1371/journal.pone.0076879
Thomas, P. L. (1988). “Ustilago hordei, covered smut of barley and Ustilago nuda, false loose smut of barley,” in Advances in Plant Pathology, Vol. 6, ed. G. S. Sidhu (London: Acadenic Press), 415–425. doi: 10.1016/b978-0-12-033706-4.50032-3
Varady, E. S., Bodaghi, S., Vidalakis, G., and Douhan, G. W. (2018). Microsatellite characterization and marker development for the fungus Penicillium digitatum, causal agent of green mold of citrus. Microbiologyopen 8:1774. doi: 10.1002/mbo3.788
Weising, K., Atkinson, R. G., and Gardner, R. C. (1995). Genomic finger priniting by microsatellite primed PCR: a critical evaluation. PCR Meth. Appl. 4, 249–255. doi: 10.1101/gr.4.5.249
Xu, L., Que, Y., and Chen, R. (2004). Genetic diversity of Ustilago scitaminea in mainland China. Sugar Tech. 6, 267–271. doi: 10.1139/cjm-2016-0449
Yeh, F. C., Yang, R. C., and Boyle, T. (1999). POPGENE Software Package Version 1.31 for Population Genetic Analysis. Edmonton, AB: University of Alberta.
Yu, Z., Gui-mei, C., Jia-jia, L., Ming-qi, Z., Yang, W., and Bai-li, F. (2016). Genetic diversity of Ustilago hordei in Tibetan areas as revealed by RAPD and SSR. J. Integr. Agric. 15, 2299–2308. doi: 10.1016/s2095-3119(16)61413-2
Zhang, M., Chen, Y., Yuan, J., and Meng, Q. (2015). Development of genomic SSR markers and analysis of genetic diversity of 40 haploid isolates of Ustilago maydis in China. Int. J. Agric. Biol. 17, 369–374.
Keywords: barley, covered smut, genetic diversity, gene flow, genome, haplotype, microsatellite, population structure
Citation: Kashyap PL, Kumar S, Kumar RS, Tripathi R, Sharma P, Sharma A, Jasrotia P and Singh GP (2020) Identification of Novel Microsatellite Markers to Assess the Population Structure and Genetic Differentiation of Ustilago hordei Causing Covered Smut of Barley. Front. Microbiol. 10:2929. doi: 10.3389/fmicb.2019.02929
Received: 24 September 2019; Accepted: 05 December 2019;
Published: 15 January 2020.
Edited by:
Cristina Silva Pereira, New University of Lisbon, PortugalReviewed by:
James Kolmer, Agricultural Research Service (USDA), United StatesWei Li, Northeast Agricultural University, China
Copyright © 2020 Kashyap, Kumar, Kumar, Tripathi, Sharma, Sharma, Jasrotia and Singh. This is an open-access article distributed under the terms of the Creative Commons Attribution License (CC BY). The use, distribution or reproduction in other forums is permitted, provided the original author(s) and the copyright owner(s) are credited and that the original publication in this journal is cited, in accordance with accepted academic practice. No use, distribution or reproduction is permitted which does not comply with these terms.
*Correspondence: Prem Lal Kashyap, plkashyap@gmail.com; Prem.Kashyap@icar.gov.in
†These authors have contributed equally to this work