Spirometry test values can be estimated from a single chest radiograph
 Akifumi Yoshida1*
  Chiharu Kai1,2
  Hitoshi Futamura3 Kunihiko Oochi4 Satoshi Kondo5
  Ikumi Sato2,6
  Satoshi Kasai1*
- 1Department of Radiological Technology, Faculty of Medical Technology, Niigata University of Health and Welfare, Niigata, Japan
- 2Major in Health and Welfare, Graduate School of Niigata University of Health and Welfare, Niigata, Japan
- 3Konica Minolta, Inc., Tokyo, Japan
- 4Kyoto Industrial Health Association, Kyoto, Japan
- 5Graduate School of Engineering, Muroran Institute of Technology, Muroran, Japan
- 6Department of Nursing, Faculty of Nursing, Niigata University of Health and Welfare, Niigata, Japan
Introduction: Physical measurements of expiratory flow volume and speed can be obtained using spirometry. These measurements have been used for the diagnosis and risk assessment of chronic obstructive pulmonary disease and play a crucial role in delivering early care. However, spirometry is not performed frequently in routine clinical practice, thereby hindering the early detection of pulmonary function impairment. Chest radiographs (CXRs), though acquired frequently, are not used to measure pulmonary functional information. This study aimed to evaluate whether spirometry parameters can be estimated accurately from single frontal CXR without image findings using deep learning.
Methods: Forced vital capacity (FVC), forced expiratory volume in 1 s (FEV1), and FEV1/FVC as spirometry measurements as well as the corresponding chest radiographs of 11,837 participants were used in this study. The data were randomly allocated to the training, validation, and evaluation datasets at an 8:1:1 ratio. A deep learning network was pretrained using ImageNet. The input and output information were CXRs and spirometry test values, respectively. The training and evaluation of the deep learning network were performed separately for each parameter. The mean absolute error rate (MAPE) and Pearson’s correlation coefficient (r) were used as the evaluation indices.
Results: The MAPEs between the spirometry measurements and AI estimates for FVC, FEV1 and FEV1/FVC were 7.59% (r = 0.910), 9.06% (r = 0.879) and 5.21% (r = 0.522), respectively. A strong positive correlation was observed between the measured and predicted indices of FVC and FEV1. The average accuracy of >90% was obtained in each estimation of spirometry indices. Bland–Altman analysis revealed good agreement between the estimated and measured values for FVC and FEV1.
Discussion: Frontal CXRs contain information related to pulmonary function, and AI estimation performed using frontal CXRs without image findings could accurately estimate spirometry values. The network proposed for estimating pulmonary function in this study could serve as a recommendation for performing spirometry or as an alternative method, suggesting its utility.
1 Introduction
Imaging tests and pulmonary function tests (PFTs) are two important examination modalities that are fundamental to respiratory medicine. Imaging tests are used to diagnose abnormalities based on the anatomy and morphology of the respiratory tract, whereas PFTs are used to evaluate the physiological functions of the respiratory tract as quantitative values. Spirometry is a relatively simple method for measuring the ventilatory performance and is performed in routine practice and as part of medical examinations. Spirometry quantitatively measures the pulmonary capacity and velocity by determining the pressure and flow rate. The results are interpreted based on the symptoms and other clinical findings. Forced vital capacity (FVC) and forced expiratory volume in 1 s (FEV1) can be measured using spirometry. These indices can be evaluated relative to the decline in pulmonary function by calculating the ratio of the measured values (% FVC and % FEV1) to the representative values corresponding to the individual’s age, height, and sex. Post-bronchodilator FEV1/FVC <0.7 indicates obstructive ventilatory defects and is used as a strong diagnostic criterion (1–4). Thus, FVC, FEV1 and FEV1/FVC are important clinical assessment indices (5, 6). They allow for earlier detection of diseases that affect pulmonary function, such as chronic obstructive pulmonary disease (COPD) and asthma, than imaging tests. Spirometry remains the gold standard for diagnosing ventilatory defects (2). It can detect asymptomatic cases with obstructive ventilatory defects as well as cases of impaired pulmonary function, even in the absence of obstructive ventilatory defects (7–11). Conversely, spirometry is usually performed in symptomatic patients (12), low uptake compared to that in chest radiography is the major problem of spirometry in preventive medicine. Moreover, participants must cooperate during the test and breathe with effort to obtain accurate results. Low throughput is an additional issue. Throughput is further limited in cases that require infection control measures. Thus, spirometry must be encouraged, and alternative tests with good throughput must be developed to overcome the challenges in performing PFTs during clinical examinations.
Imaging tests are associated with high throughput and a relatively high screening uptake rate. Chest radiographs (CXRs) remain the first choice of imaging test for cardiopulmonary screening and are commonly acquired during routine primary care, including health checkups. The CXR can visually identify morphological abnormalities in the lungs and other thoracic regions and can detect various diseases, for example, pneumonia and lung cancer. If the CXR shows abnormal findings related to pulmonary function, such as emphysema in COPD, this can be detected without spirometry. However, it is difficult to detect lesions that cause abnormal pulmonary function at an early stage with CXR, and, therefore, it is generally not used to assess pulmonary function. Thus, spirometry and CXR are complementary and have advantages and disadvantages. If cases with functional abnormalities can be detected in CXR without detectable image findings, it may lead to the creation of health-promoting opportunities for patients. Hence, it would be clinically useful if pulmonary function could be accurately obtained from the CXR.
Previous studies have estimated pulmonary function using the shape of the rib cage on CXRs acquired during static imaging (13–16). Similarly, studies have investigated the relationship between image characteristics and pulmonary function on dynamic chest X-ray radiographs (DCRs) acquired during dynamic imaging (17, 18). Pulmonary function has been estimated using image characteristics measured from landmarks in the images and regression models or equations; however, the accuracy of the estimated values was limited as the correlation between image features and lung function was not high. Furthermore, it requires manual measurement of image characteristics, a labor-intensive task, and may lead to errors. Machine learning has resulted in breakthroughs in medical image analysis in recent years, and several studies have used general image recognition models in medical image analysis and the estimation of functional parameters and other information from images (19). Sogancioglu et al. (20) reported the use of artificial intelligence (AI) for the estimation of the lung volume from pseudo-CXRs calculated from CT images. However, the estimated lung volumes were calculated from CT image data and not pulmonary function values. Schroeder et al. (21) reported the estimation of the % predFEV1 and FEV1/FVC as PFT values from bidirectional CXR pairs using deep learning. The study used two-view CXRs including imaging findings for estimation, not frontal CXRs alone. It was not clear whether pulmonary function impairment could be estimated from CXRs without imaging findings. Health checkups are performed routinely under the national system in Japan, and almost all adults undergo CXR screening. However, CXR screening is not always performed bidirectionally. It is important to determine whether accurate pulmonary function values can be obtained from frontal CXR images to develop an AI system for estimating pulmonary function from CXRs that can be used during medical examinations worldwide, including in developing countries.
Therefore, this study aimed to estimate the spirometry measurements from single frontal CXR without image findings using a general image recognition model and evaluate the precision of the estimation.
2 Materials and methods
This study was conducted after receiving approval for the use of medical data obtained during medical examinations from the Institutional Review Board of the Niigata University of Health and Welfare and the data-providing institutions (Approval number: 18952-221124).
2.1 Materials
2.1.1 Data
Frontal CXRs acquired at a single institution in Japan for 2019 were used in this study. The CXR images in 8-bit PNG format were used. Figure 1 shows a representative CXR. The FVC, FEV1 and FEV1/FVC values obtained via forced vital capacity testing were used as the pre-bronchodilator spirometry data, as described in multiple COPD studies (22–24). Figure 2 presents the inclusion and exclusion criteria for the CXR and PFT data. The dataset used in this study are cases with no image findings noted in the radiology reports of the screening CXR. Cases with any abnormal findings such as lung opacities, lung cancer or other pulmonary disease, pleural lesions, cardiovascular lesions, musculoskeletal lesions, tracheal abnormalities, postoperative and supported devices were excluded. The CXRs in the dataset does not include any image findings noted, including inactive findings. The CXR data and corresponding PFT data were extracted from only one sample per participant. A total of 11,837 data samples, including the corresponding heights, sexes, and ages, were included in the PFT data; there were no missing data values. Table 1 presents the demographic characteristics of the datasets. A total of 9,469, 1,184, and 1,184 samples were used for the training, validation, and test of the deep learning network to ensure that the data ratio was maintained at 8:1:1.
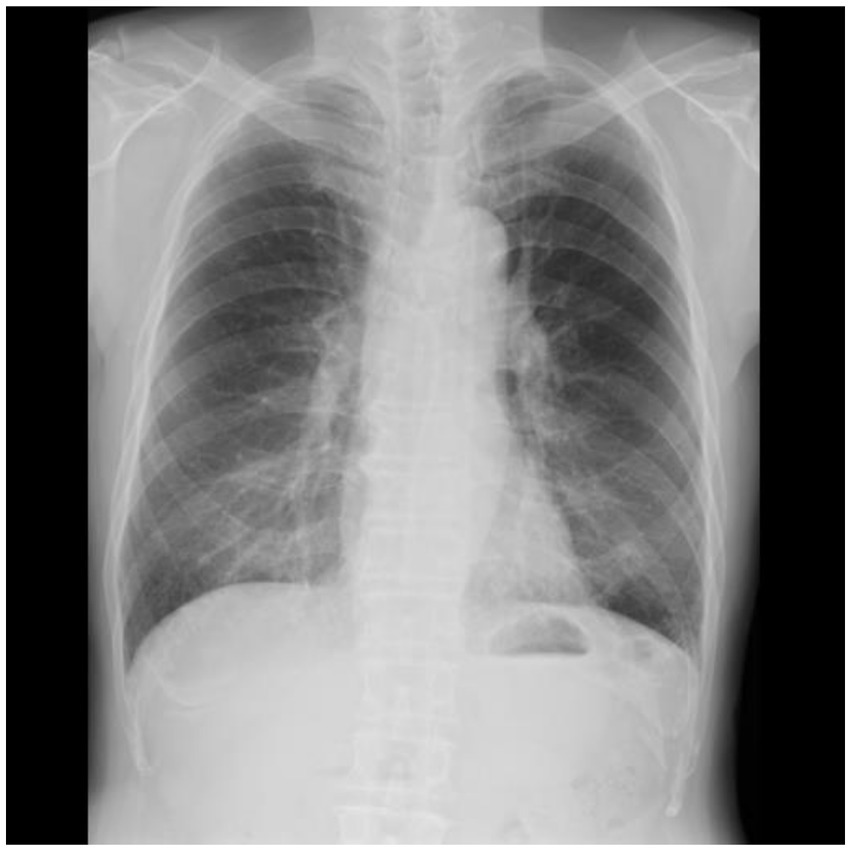
Figure 1. Sample chest radiographs used in this study. The original images were down-sampled and zero-padded to a 512 × 512 matrix with the aspect ratio preserved. Additionally, they were resampled to 224 × 224 and used as input.
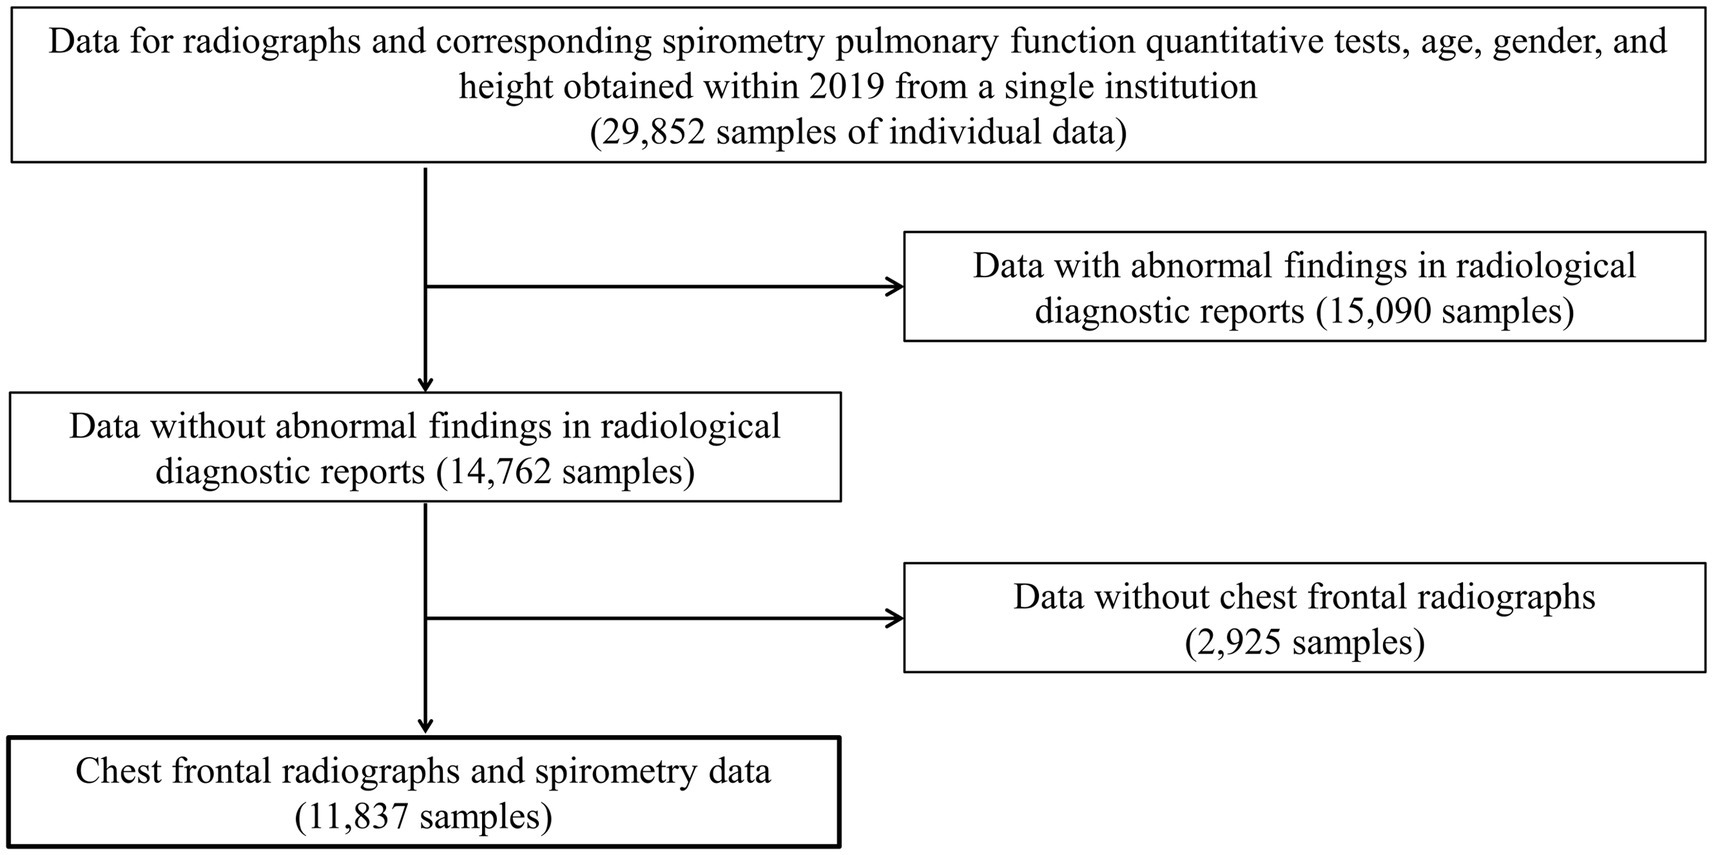
Figure 2. The inclusion and exclusion criteria for data acquisition. Only frontal chest radiographs and spirometry data obtained at a single institution with no abnormal findings on diagnostic reports and no history of undergoing radiography and spirometry on the same day were used.
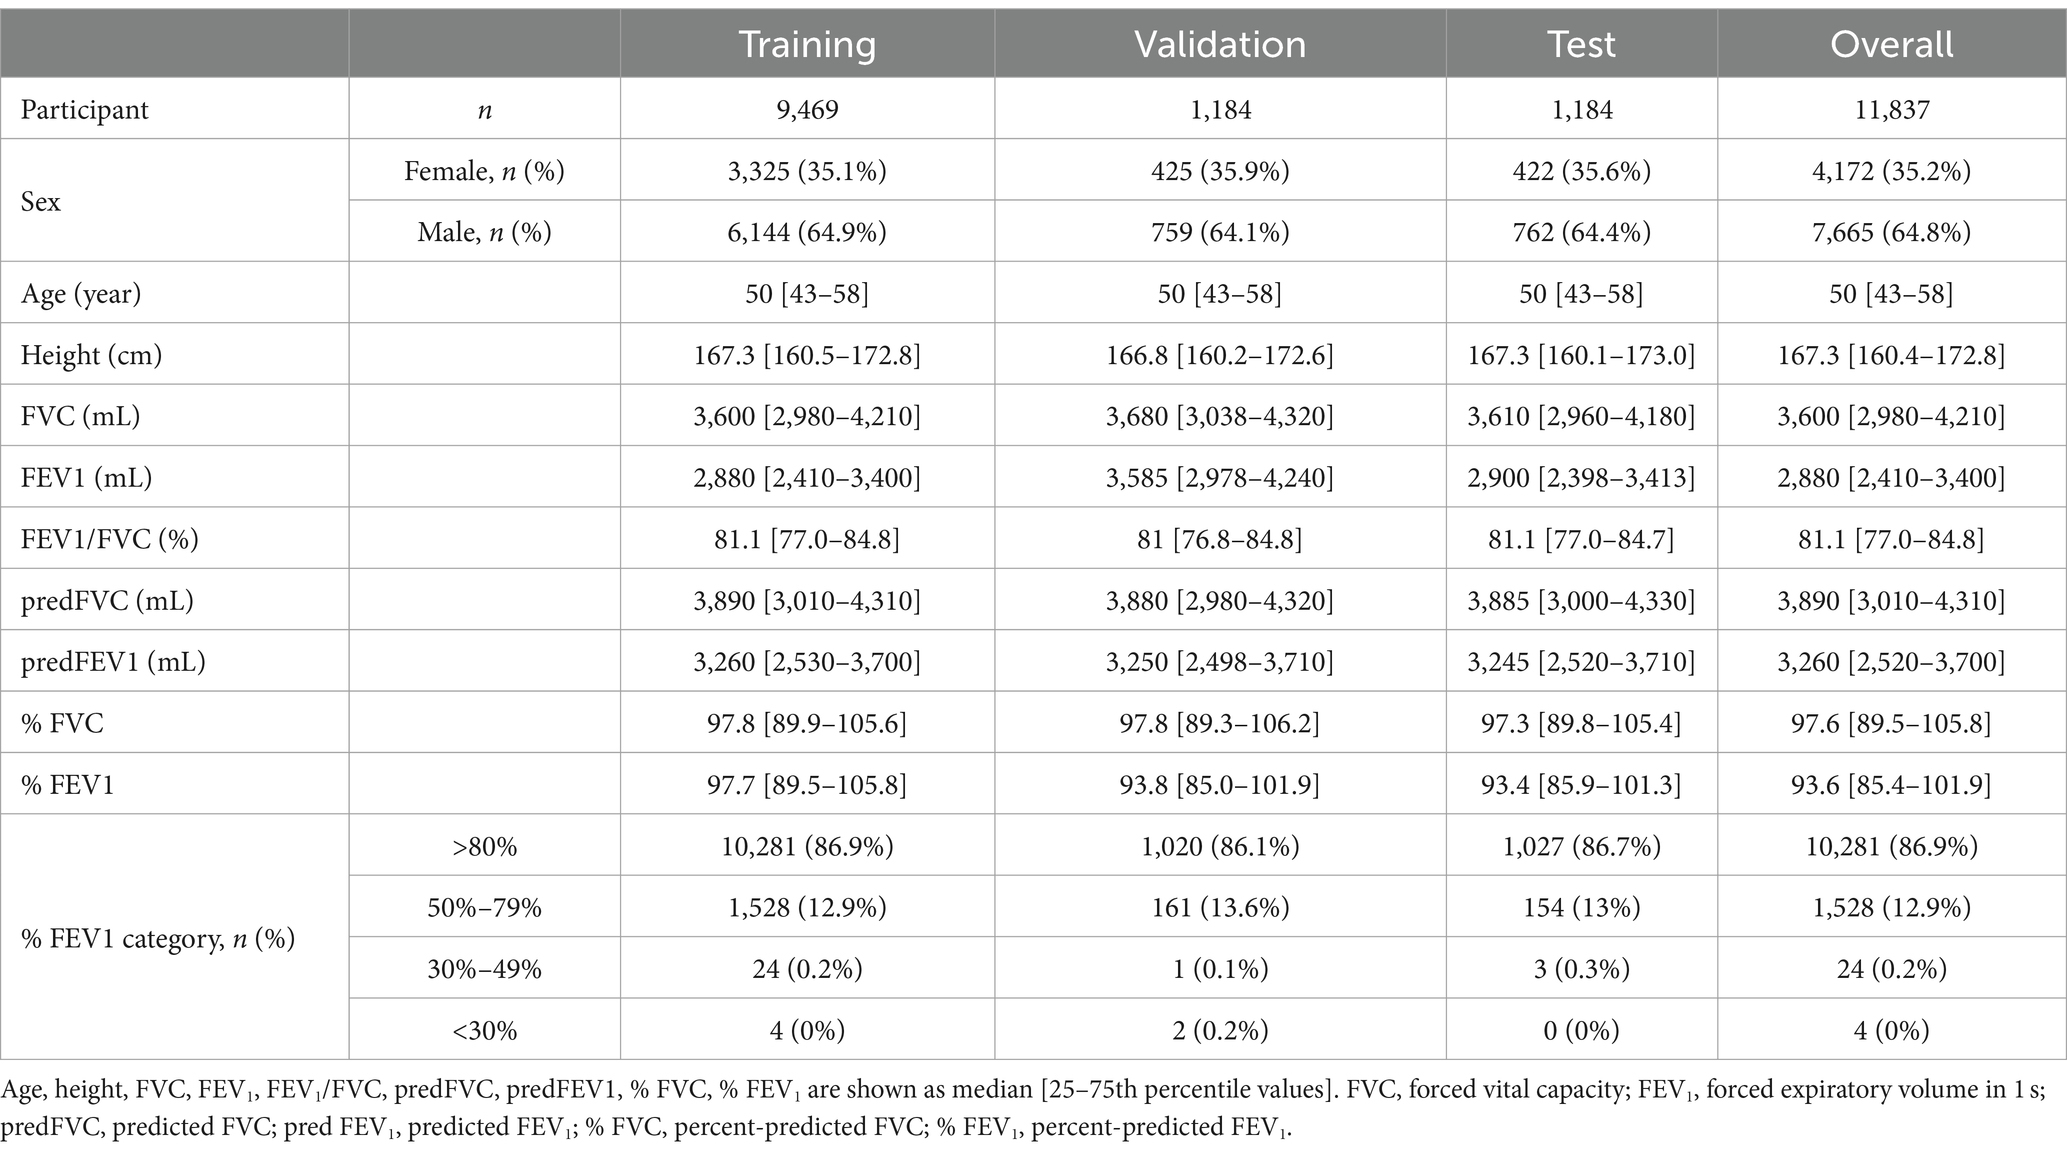
Table 1. Demographic characteristics and pulmonary function indices of datasets.
2.1.2 Experimental environment
MATLAB 2022a (MathWorks, Inc.) was used to implement the framework for performing the deep learning operations. Image processing and deep learning computations were performed using MATLAB in this study.
2.2 Methods
2.2.1 Network training and evaluation
In addition to the pre-training data from the ImageNet classification task, ResNet-18, ResNet-50, ResNet-101, DenseNet-201, and Inception-ResNet-V2, which are publicly available in the MATLAB add-in library, were used as the initial weights (25, 26). The fully connected layers closest to the output layer of each network were replaced with a new layer with an output class of one. The training conditions were as follows: optimization method, Adam; loss function root mean square error; batch size, 32–256 (variable); initial learning rate, 1 × 10⁻⁵; maximum number of epochs, 50; image data augmentation, ±5° random rotation/random horizontal flip/±5% random scaling. The batch size was varied for each network type and then optimized. The network weights were updated using the training dataset, and the network performance at each epoch was displayed using the validation dataset. The weights in the epoch with the lowest loss for the validation dataset were saved to complete the learning. Network training and estimation were performed separately for FVC, FEV1 and FEV1/FVC.
2.2.2 Evaluation
CXRs from the test dataset and the FVC or FEV1 estimations were the input and output of the network, respectively. The mean average percentage error (MAPE) and Pearson’s correlation coefficient (r) between the reference measured values and network-estimated values were used as the evaluation indices. Bland–Altman analysis (27) was performed using the reference measured value and the error between the estimated value and the measured value. The estimated value and the measured value were considered to be variables that could be treated equally if >95% of the evaluation data were included in the limits of agreement (LOA) at mean ± 1.96 SD.
3 Results
Table 2 presents the results of FVC, FEV1 and FEV1/FVC estimations for each network. FVC and FEV1 estimates showed strong positive correlations with both networks. Inception-ResNet-V2, which had the largest number of parameters, achieved the best MAPE and correlation coefficients for FVC and FEV1. The MAPE and correlation coefficients for FVC estimation were 7.585–8.246 and 0.903–0.910, respectively. The MAPE and correlation coefficients for FEV1 estimation were 9.055–9.442 and 0.865–0.879, respectively. The MAPE and correlation coefficients for FVC estimation were superior to those of FEV1 estimation, regardless of the network type used. Figure 3 presents the results of the comparison between the FVC estimation results of the Inception-ResNet-V2 network, which yielded the lowest MAPE and the highest correlation coefficient, and the reference. Figure 4 presents the results of the comparison between the FEV1 estimation results and the reference. The 95% confidence interval for the mean error rate of FVC estimation (Figure 3B) ranged between −1.741% and −0.615% in the Bland–Altman plot. The slope of the coefficient for the determination of the % error-reference of an approximately straight line, R2 = 0.106, was not significant. The agreement between the estimated and measured FVC values was confirmed, as 96.1% of the data were included within the LOA. The 95% confidence interval for the mean percentage error of FEV1 estimation ranged between 0.606% and 2.164% in the Bland–Altman plot (Figure 4B). The slope of the coefficient for the determination for the % error-reference of an approximately straight line, R2 = 0.157, was not significant. The agreement between the FEV1 estimates and measured values was confirmed, as 97.6% of the data were included within the LOA. Figure 5 presents the results of the deep learning network with the best correlation coefficient and MAPE for estimating FEV1/FVC. The MAPE was acceptable at 5.20%, whereas the correlation was moderate at r = 0.522. The correlation between FEV1/FVC estimates and measured values was weaker than those observed for the estimation of FVC and FEV1. The 95% confidence interval for the mean error rate of FVC estimation (Figure 5B) ranged between −221213.6% and 15.7% in the Bland–Altman plot. The slope of the coefficient for the determination for the % error-reference of an approximately straight line, R2 = 0.759, was significant. The agreement between the FEV1/FVC estimates and measured values was confirmed, as 96.8% of the data were included within the LOA.
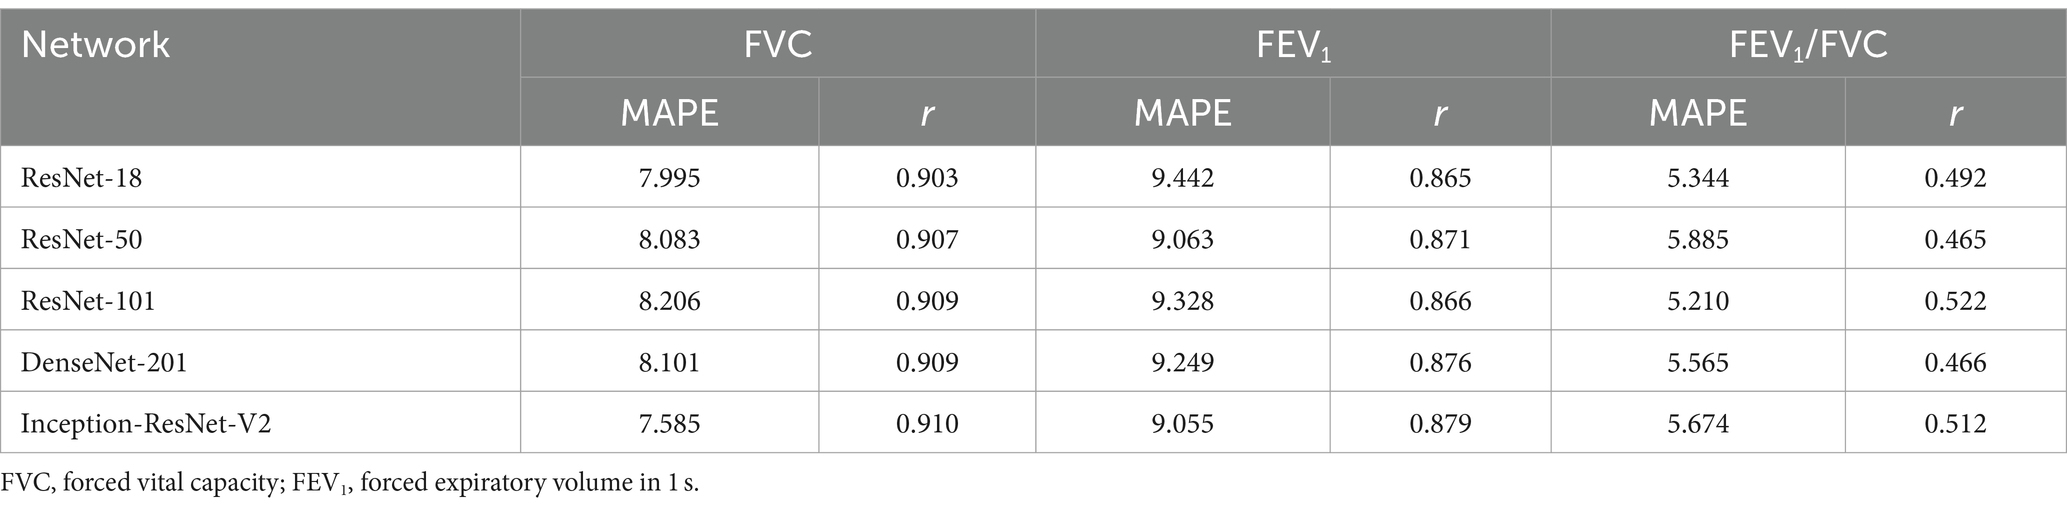
Table 2. Comparison of estimation performance of the network for each pulmonary function indices.
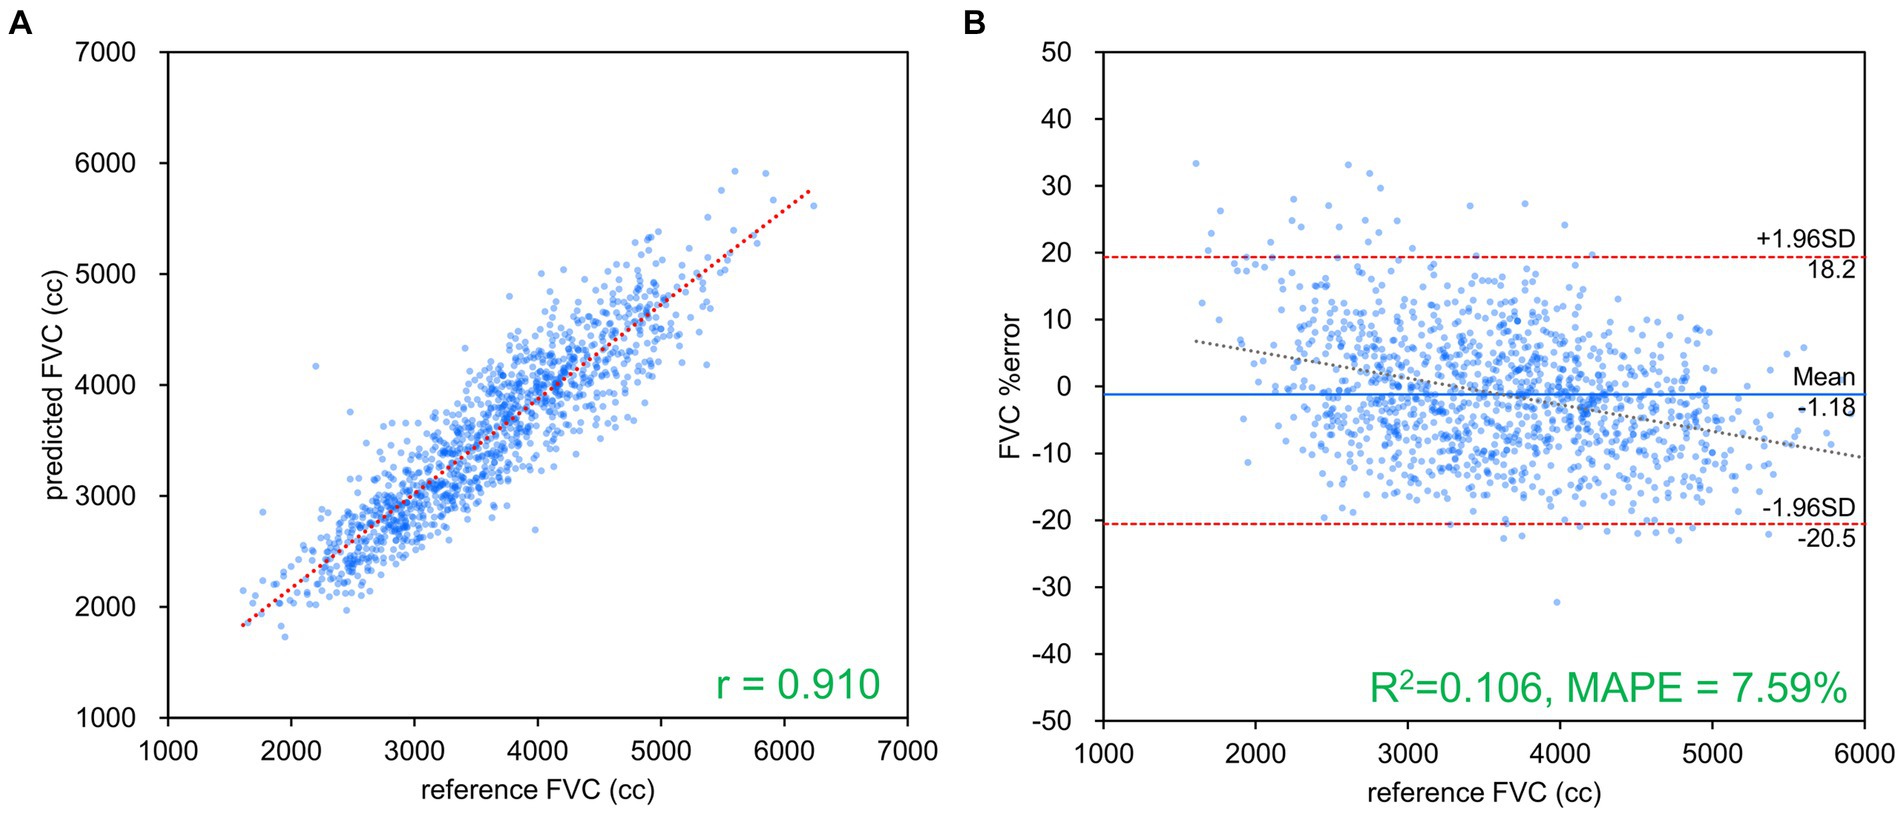
Figure 3. FVC estimation results using Inception-ResNet-V2. (A) Comparison of measured and estimated values. (B) Bland–Altman-like plot presenting the measured value-estimated error rate relationship. The correlation coefficient and error rate were the best among the networks used, with 96.1% of the data within the limits of agreement (mean ± 1.96 SD), confirming agreement between spirometry measurements and AI estimation using chest radiography. FVC, forced vital capacity.
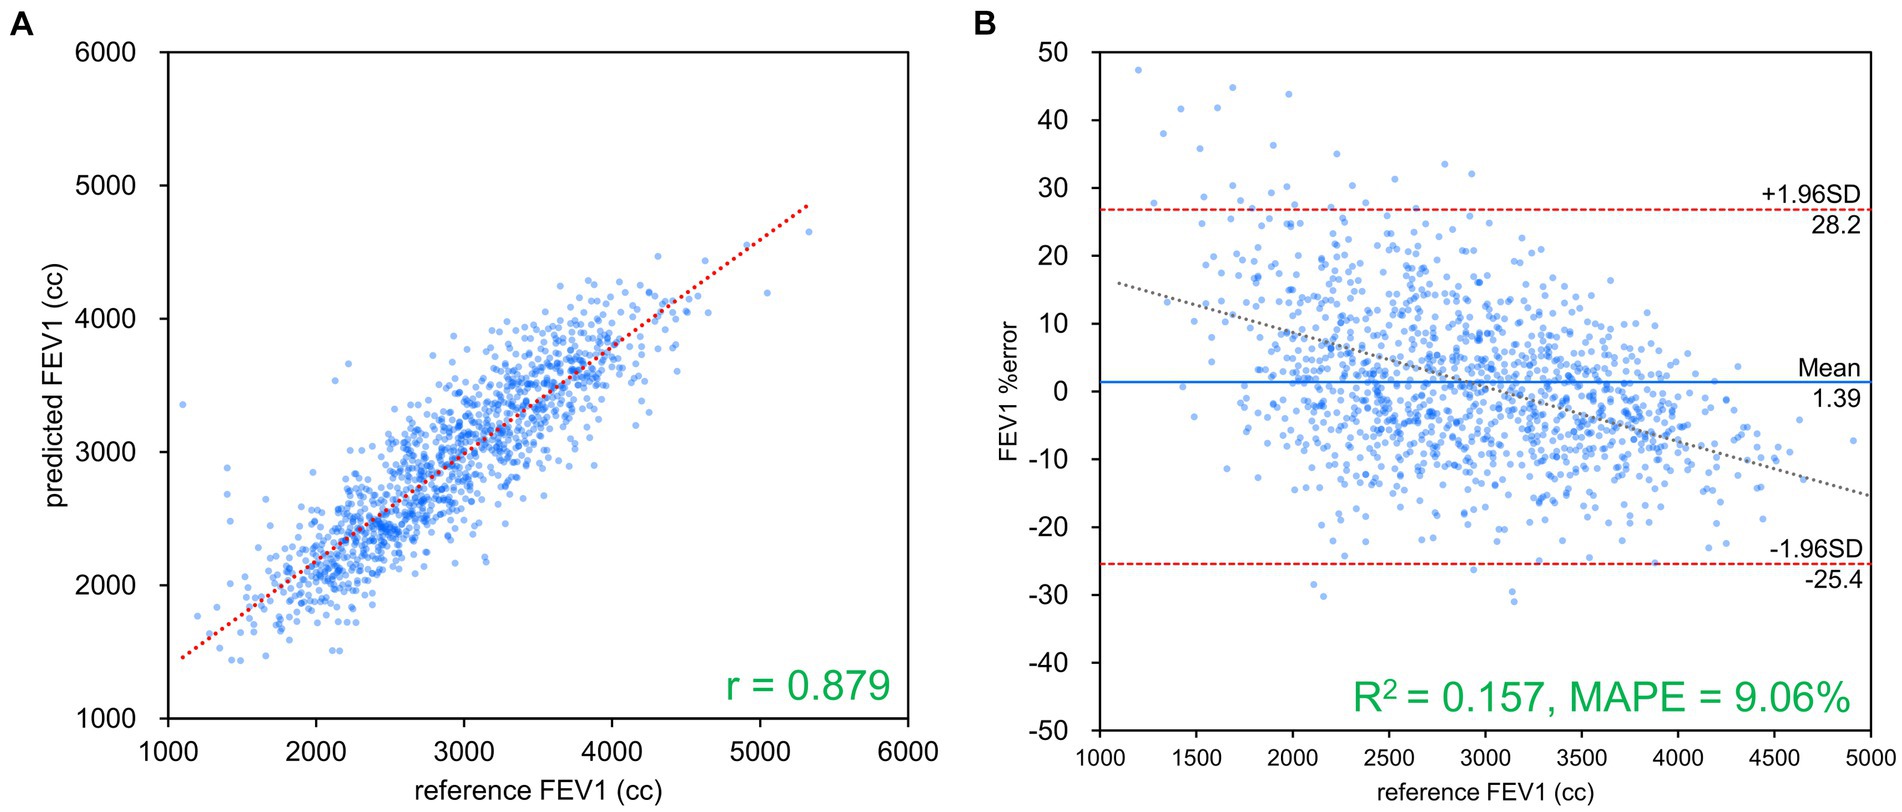
Figure 4. FEV1 estimation results using Inception-ResNet-V2. (A) Comparison of measured and estimated values. (B) Bland–Altman-like plot representing the measured value-estimated error rate relationship. The correlation coefficient and error rate were the best among the networks used, with 97.6% of the data within the limits of agreement (mean ± 1.96 SD), confirming agreement between spirometry measurements and AI estimation using chest radiography. FEV1, forced expiratory volume in 1 s.
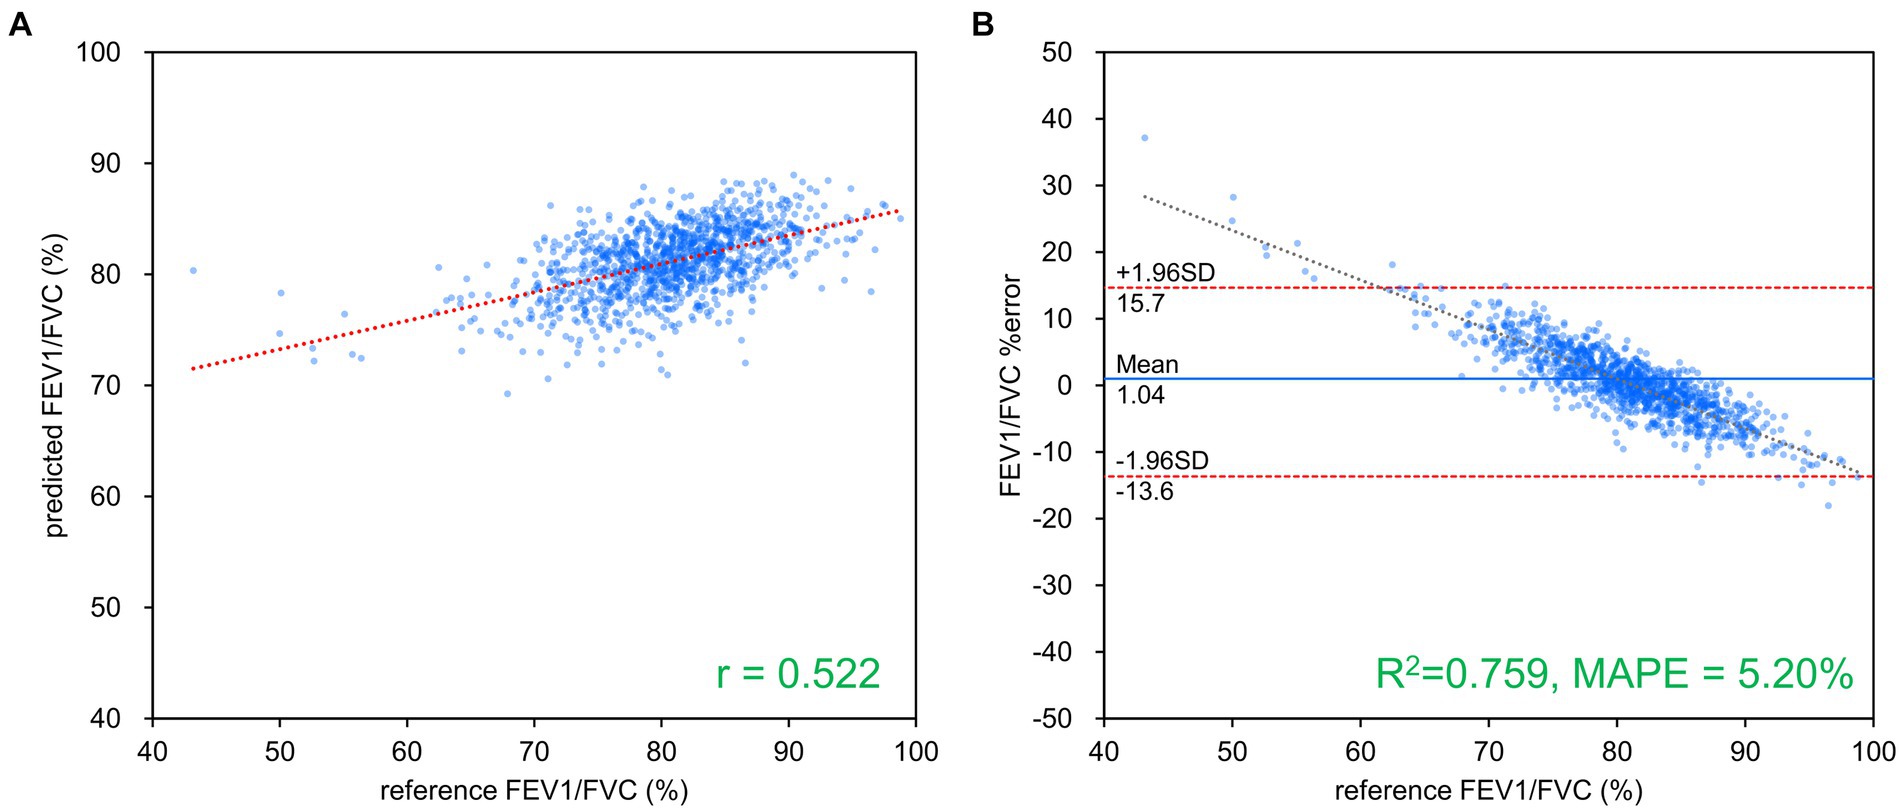
Figure 5. FEV1/FVC estimation results using ResNet-101. (A) Comparison of measured and estimated values. (B) Bland–Altman-like plot representing the measured value-estimated error rate relationship. The correlation between the estimated and measured values was moderate, while the error rate was low at about 5%. FVC, forced vital capacity; FEV1, forced expiratory volume in 1 s.
4 Discussion
A typical deep learning network was used to estimate the FVC, FEV1 and FEV1/FVC values from a frontal CXR via spirometry in this study. Strong positive correlations were observed between the estimated FVC and FEV1 values and the corresponding measured values. The MAPE was low (<10%) for FVC, FEV1 and FEV1/FVC estimations. The Bland–Altman analysis revealed good agreement between the estimated and measured values for FVC and FEV1. Thus, the findings of this study indicate that frontal CXRs contain information related to pulmonary function and that AI estimation performed using frontal CXRs can estimate spirometry-measured values FVC and FEV1 with high accuracy.
The pulmonary function parameters to be estimated in this study were FVC and FEV1, which are expiratory volumes exhaled during forced breathing with no time limit. FVC is the total expiratory volume exhaled during forced breathing without any time limit, whereas FEV1 is the expiratory volume exhaled during the first second of forced breathing. Thus, FEV1 can be considered a part of FVC, where FEV1 is the flow velocity. FEV1, a highly sensitive indicator of decreased ventilatory capacity, is decreased in patients with obstructive ventilatory defects owing to air trapping caused by damaged alveoli, which increases the peripheral airway resistance and limits the expiratory volume that can be exhaled in a short period of time (28–30). This decrease in FEV1 is particularly significant in patients with progressive COPD; however, it can also be observed in the pre-COPD stage and early stages of COPD, wherein the decrease in ventilation capacity is less evident (31). Specific findings are observed on the CXRs of patients with severe COPD; however, such findings are not observed in patients with early-stage COPD. Therefore, it is reasonable to assume that the accuracy of FEV1 estimation is relatively inferior to that of FVC estimation, an index that varies more frequently among patients. The correlation of the estimated FEV1/FVC and those of measurements was weaker than those observed for the case of estimation of FVC and FEV1. This may be attributed to the individual variability of FVC and FEV1, which makes the FEV1/FVC value a more complex predictor.
Subgroups were created based on the age, height, sex, % FVC, and % FEV1 related to the estimation error to increase the robustness of the performance of the AI estimation method used in this study. Age, height, and sex are the information used to determine the % FVC and % FEV1 in spirometry. The % FVC and % FEV1 are relative to the predicted FVC and FEV1 values, respectively, which are standard values for the same age, height, and sex expressed as percentages. Thus, % FVC and % FEV1 are indicators of a participant’s pulmonary function relative to the standard population. Each subgroup, except for the subgroup created on the basis of sex, was divided into categories, and the error rates for each category were compared. The categories for each subgroup were as follows: age category, <30 years, 30–49 years, 50–59 years, 60–69 years, and >70 years; height category, <150 cm, 150–160 cm, 160–170 cm, 170–180 cm, and >180 cm; sex category, male and female; % FVC category, <70, 70–80, 80–90, 90–100, 100–110, 110–120, and >120, % FEV1 category <70, 70–80, 80–90, 90–100, 100–110, 110–120, and >120. Differences in the distributions of error rates among categories were tested using the Kruskal–Wallis method (significance level p < 0.05) and multiple comparisons. Figure 6 presents the distributions of error rates in the FVC estimation according to the subgroup and category. The distribution of error rates tended to widen with increasing age in the age category (Figure 6A); however, multiple comparisons performed using the Kruskal–Wallis test revealed no statistically significant differences among the categories. There were no trends or significant differences in height, sex, or % FVC subgroups (Figure 6B-D). Significant differences were observed in the distribution between the categories with low % FEV1 and the other categories in the % FEV1 subgroup (p < 0.001). Figure 7 presents the distributions of error rates in the FEV1 estimation according to the subgroup and category. No significant differences were observed between the categories in terms of age, height, or sex. Thus, the findings suggest that robust performance was obtained without error bias for age, height, and sex. Significant differences were observed in the errors between categories with low % FVC values and several other categories in the % FVC subgroup. Multiple comparisons revealed the relationship between each % FEV1 category and the FEV1 estimation error rate (Figure 7E). Significantly different mean ranks were observed between all categories except between categories 100–110 and 110–120 and between 110–120 and >120 in the % FEV1 subgroup (p < 0.001). Figure 8 presents the distributions of error rates in the FEV1/FVC estimation according to the subgroup and category. No significant differences were observed between the categories in terms of height and sex. Thus, the findings suggest that a robust performance was obtained without error bias for height and sex. Multiple comparisons revealed the relationship between each % FEV1 category and the FEV1/FVC estimation error rate (Figure 8E). Significantly different mean ranks were observed between categories between categories 30–39 years and 50–59 years in the age subgroup (p < 0.01) and between categories between categories 80–90 and >120 in the % FVC subgroup. Additionally, in the % FEV1 subgroup, significantly different mean ranks were observed between all categories (p < 0.05), except between categories <70 and 70–80; 70–80 and 80–90; 80–90 and 100–110; 100–110 and 110–120 and >120; 110–120 and >120. Table 3 presents the number of data points and error rates for each subgroup and category. The median error tended to be more positively biased for categories with a lower % FEV1 in the % FEV1 subgroup. It is suspected that the low % FVC and low % FEV1 categories had small samples and that the characteristics of % FVC and % FEV1 might not have been learned sufficiently. However, the error rate did not increase significantly for the other age and height categories with a lesser amount of data. Therefore, the results of this study do not exclude the possibility that the relationship between lower % FVC and % FEV1 and imaging features has not been sufficiently trained by network. Future studies should increase the number of samples with low % FVC and % FEV1 during training and validate the robustness of the % FVC and % FEV1 subgroups.
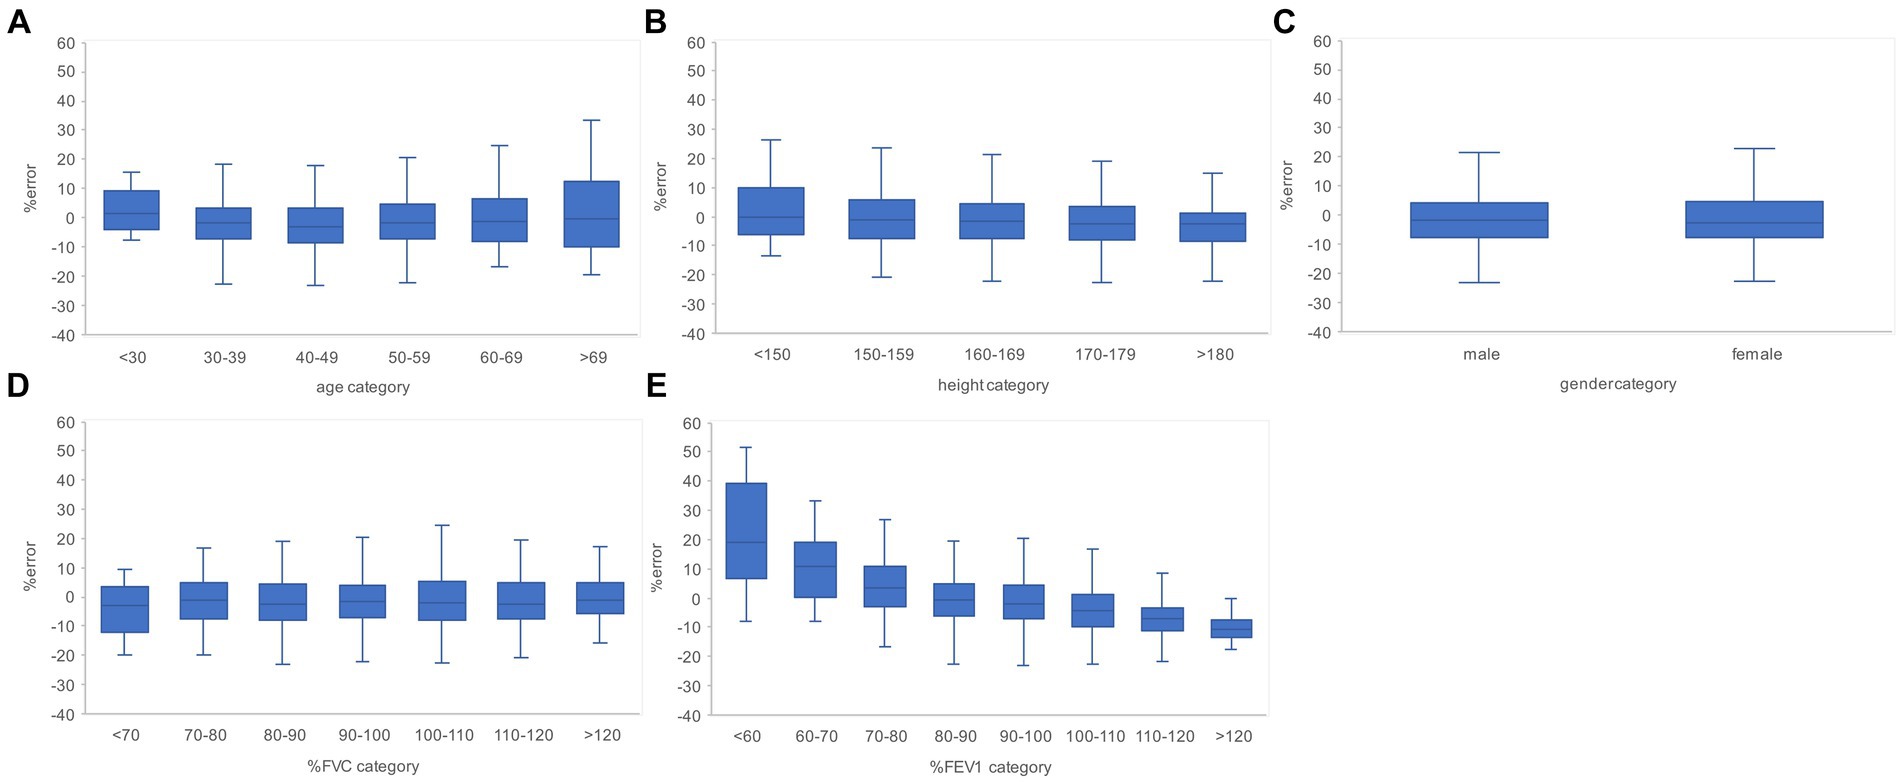
Figure 6. Relationship between the subgroups and FVC estimation error rates in the evaluation data. (A) Percentage error by age category. (B) Percentage error by height category. (C) Percentage error by gender. (D) Percentage error per % FVC category. (E) Percentage error by % FEV1 category. The higher the age category and the lower the % FEV1 category, the larger the variance of the percentage error tended to be. FVC, forced vital capacity; FEV1, forced expiratory volume in 1 s.
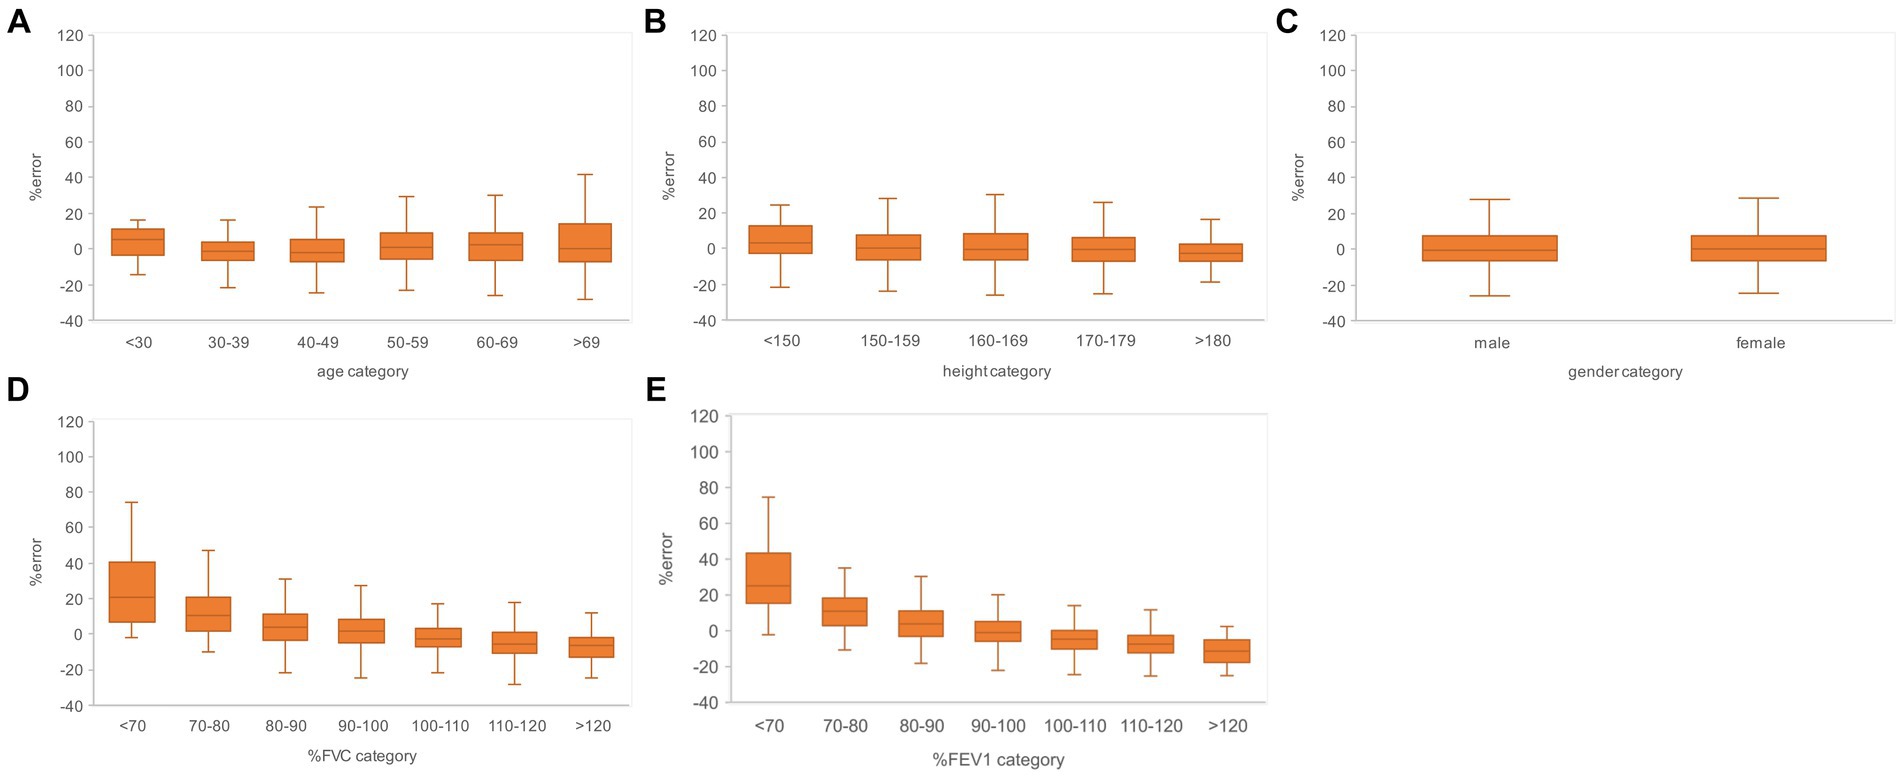
Figure 7. Relationship between the subgroups and FEV1 estimation error rates in the evaluation data. (A) Percentage error by age category. (B) Percentage error by height category. (C) Percentage error by gender. (D) Percentage error per % FVC category. (E) Percentage error by % FEV1 category. The variance of the percent error tended to be larger for the higher age categories and for the lower % FVC and % FEV1 categories. FVC, forced vital capacity; FEV1, forced expiratory volume in 1 s.
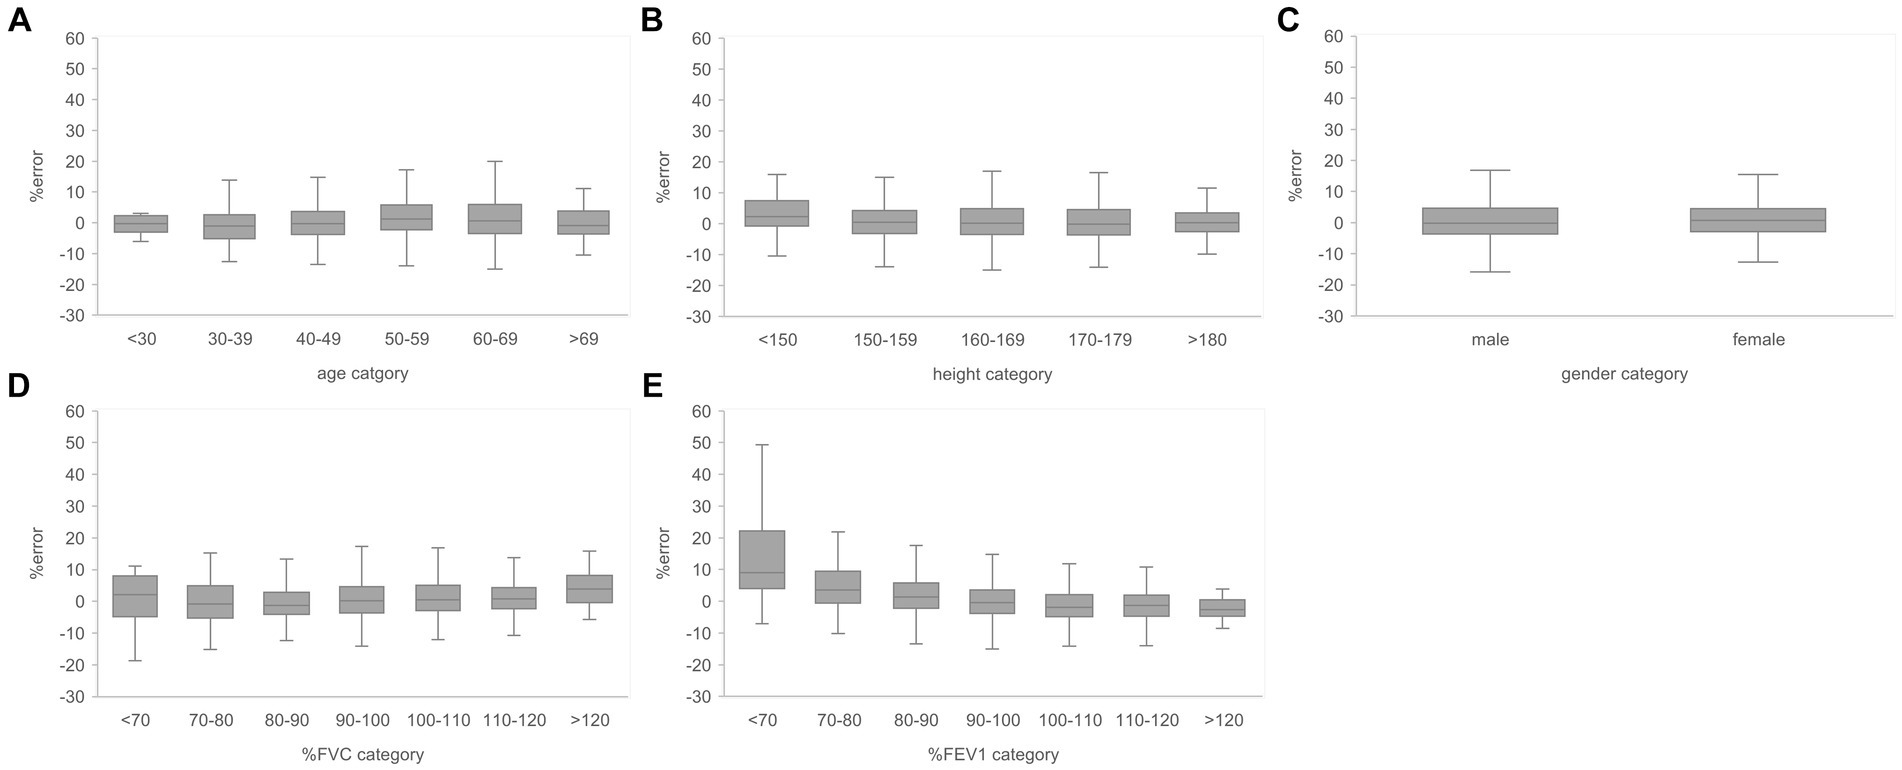
Figure 8. Relationship between the subgroups and FEV1/FVC estimation error rates in the evaluation data. (A) Percentage error by age category. (B) Percentage error by height category. (C) Percentage error by gender. (D) Percentage error per % FVC category. (E) Percentage error by % FEV1 category. The variance of the percent error tended to be larger for the lower % FEV1 categories. FVC, forced vital capacity; FEV1, forced expiratory volume in 1 s.
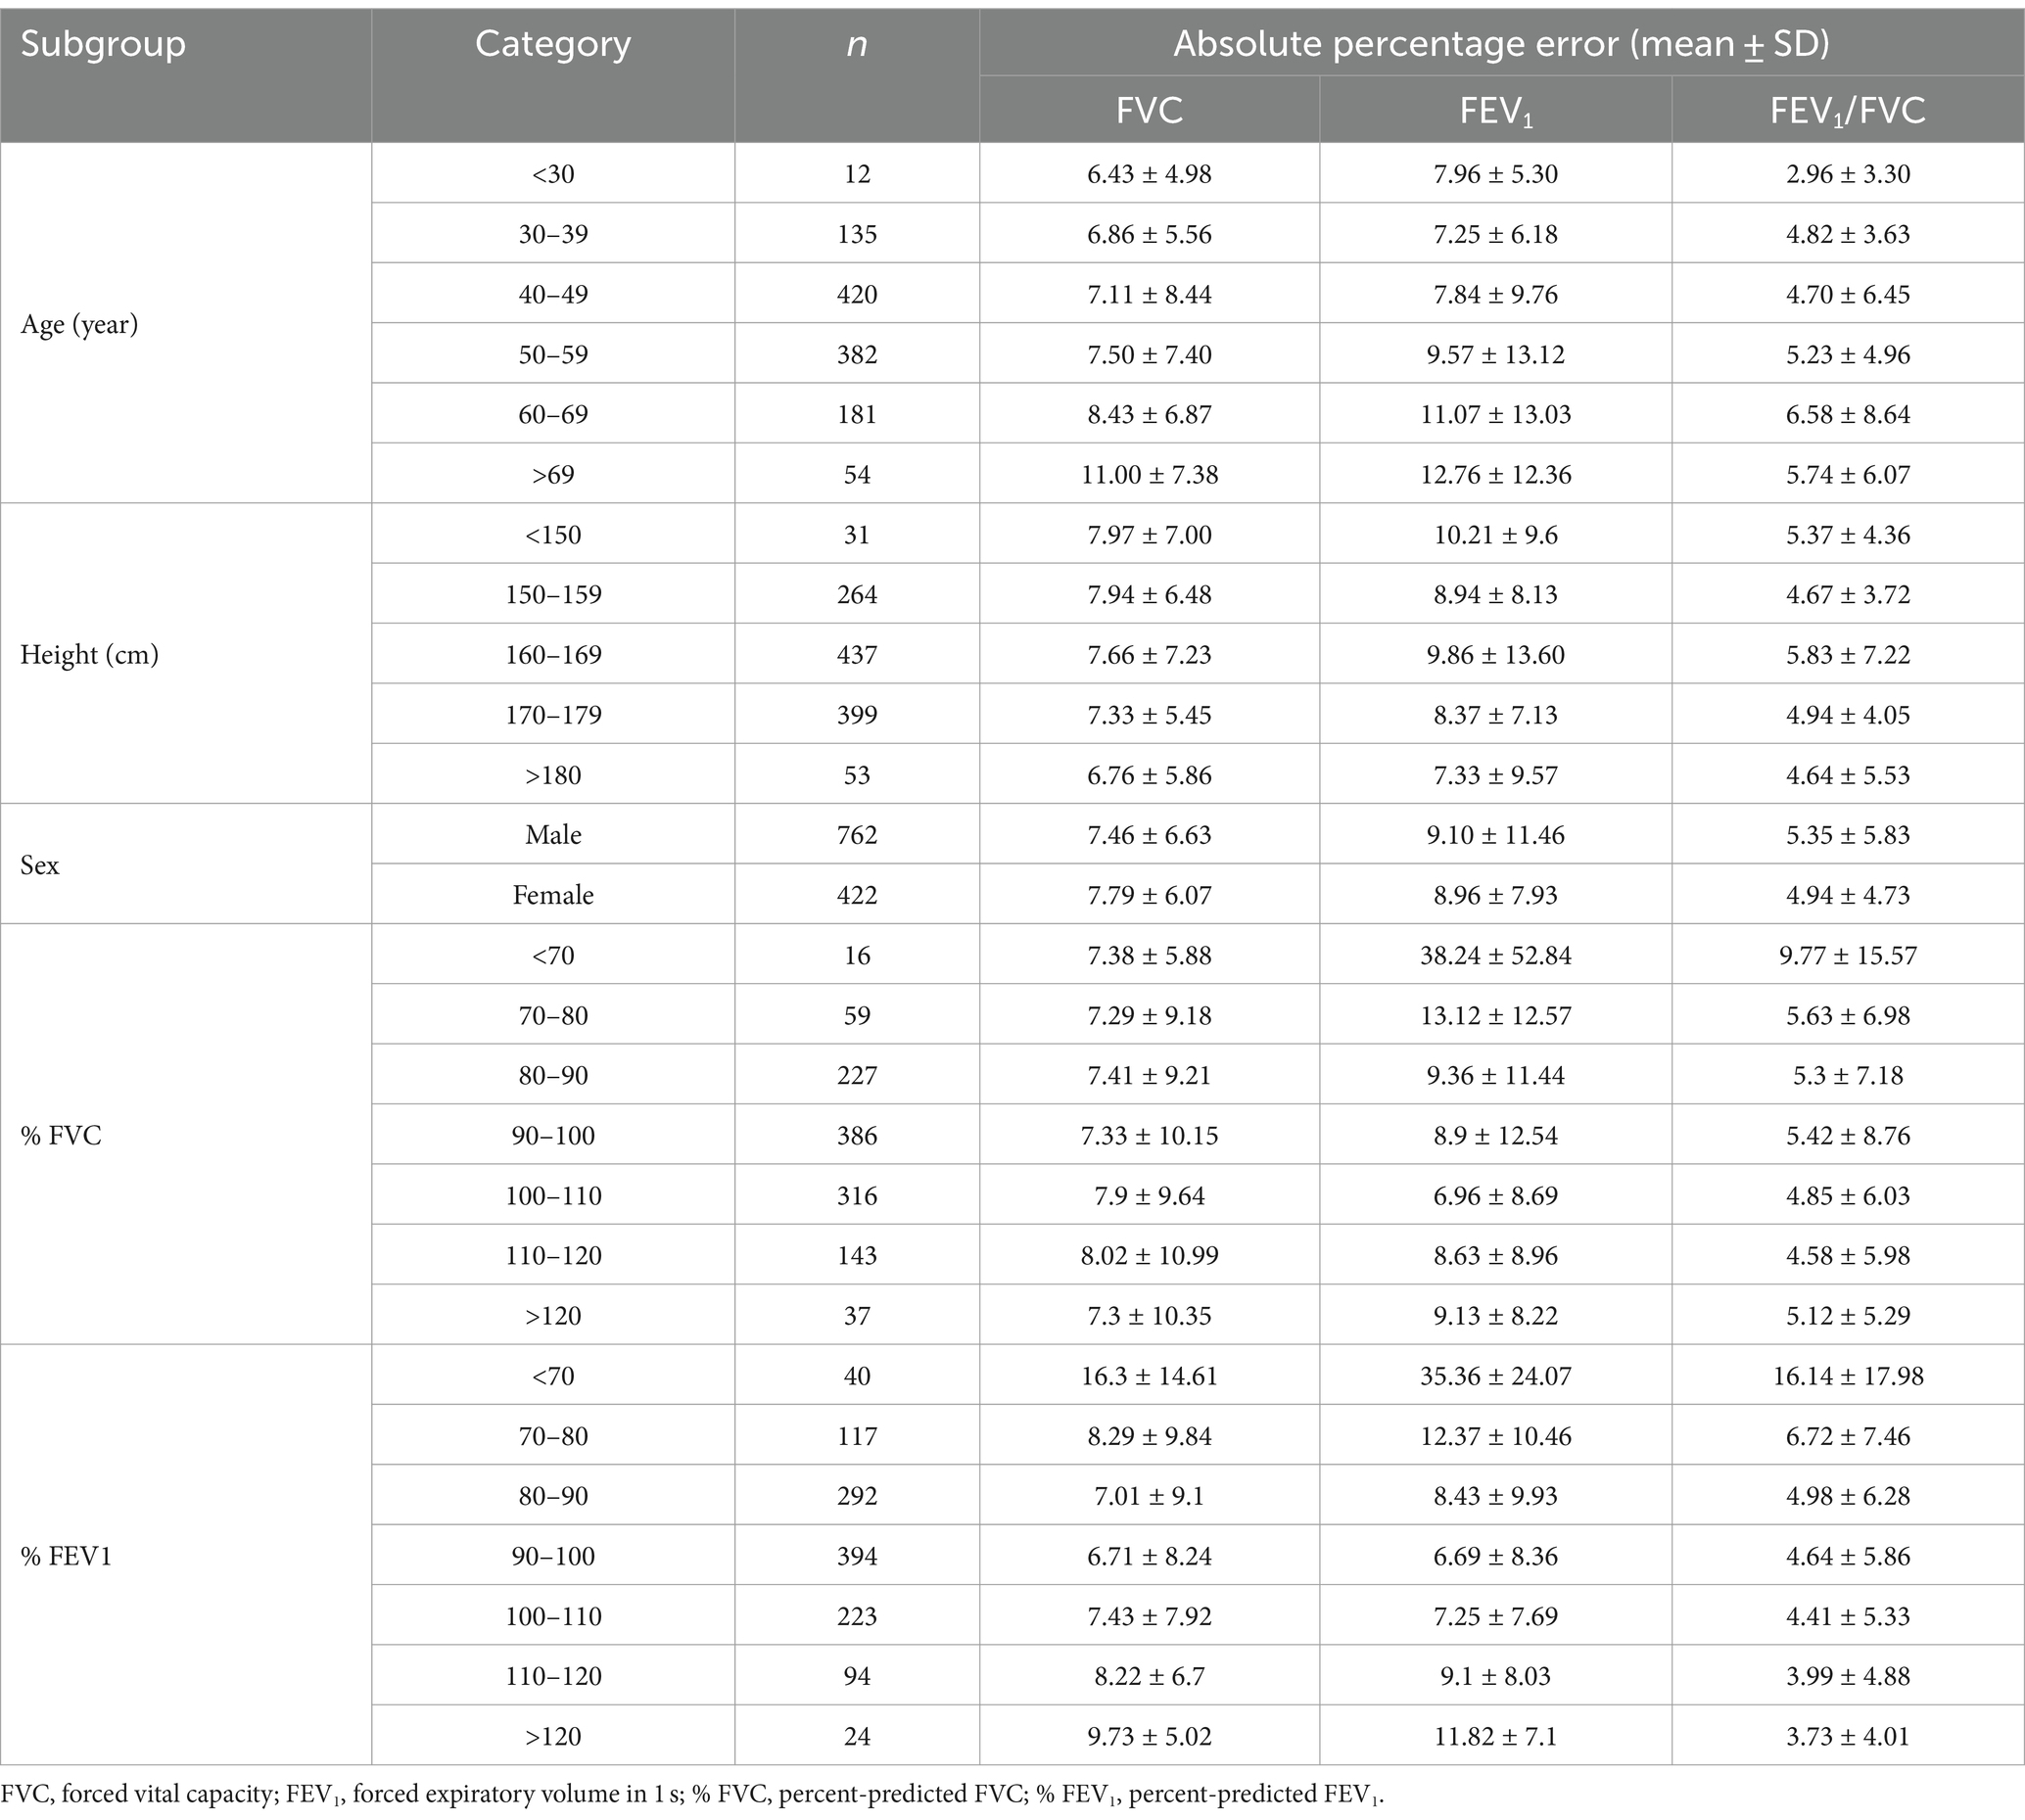
Table 3. Number of test data and percentage error of AI estimation according to the age, height, sex, % FVC and % FEV1.
Previous studies investigating the relationship between CXRs and pulmonary function manually extracted image characteristics from dynamic CXRs to investigated their correlations with pulmonary function. Hino et al. (17) and Hida et al. (18) investigated the correlation between image characteristics and pulmonary function values on dynamic CXR. In the study by Hino et al. (17), the highest correlation coefficient was between lung field area and FEV1 at the maximal inspiratory position with effort breathing in DCR was the highest (right r = 0.59, left r = 0.62). The study by Hida et al. (18) also showed the highest correlation between whole excursion of the diaphragm and FEV1 in DCR, although the correlation was weak (right r = 0.27, left r = 0.38). While previous studies have reported a moderate correlation between FEV1 and lung field area based on DCR image measurements, this study used deep learning networks to automatically extract and select image characteristics from static CXRs and revealed a strong positive correlation (r = 0.879) between CXRs and FEV1. The findings of this study suggest that pulmonary function can be estimated accurately from static images using deep learning networks, resulting in a significant improvement in accuracy. In a previous study in which pulmonary function was estimated from CXR using machine learning, Schroeder et al. (21) estimated FEV1/FVC using bidirectional CXR pair and obtained R2 = 0.415 (conversion r = 0.644), which is a moderately positive correlation. In this study, only frontal CXR was used to estimate FEV1/FVC. An R2 = 0.272 (r = 0.522) was obtained, indicating a moderate positive correlation. The absence of lateral CXR in this study is expected to have resulted in the deep learning network extracting less information compared to if bidirectional CXR pairs were utilized, leading to lower estimation performance.
Among pathologies with obstructive ventilation defects, COPD is the most common chronic respiratory disease worldwide, with approximately 174 million affected individuals (32). COPD is an irreversible pathology; thus, it is important to detect and initiate treatment prior to its progression. However, the symptoms of COPD only become apparent as the disease reaches advanced stages. Moreover, it is difficult to detect COPD early using CXRs. Therefore, detecting and initiating treatment at the earliest possible stage for patients with COPD who are asymptomatic has become an important public health issue worldwide. In this study, the FVC and FEV1 values measured using spirometry could be estimated with an average accuracy of >90% using only frontal CXRs, which are the most commonly acquired images in imaging tests, in this study. The method used in this study provides spirometry estimates without any additional burden to the CXR examinee. In the future, if the robustness of the estimation performance to the characteristics of the data is sufficiently verified, estimation of pulmonary function using CXR could be used as an adjunct to spirometry in individuals with low estimated pulmonary function or as an alternative to pulmonary function measurement. Chest radiography (screening CXR) is a low-cost and relatively widespread cancer screening method that can be used as an alternative for the COPD risk assessment. The findings of this study suggest that FVC and FEV1 could be estimated with an average accuracy of >90% and >87% for participants with % FEV1 of >80% and >70%, respectively. Thus, the network developed in this study could be used as an alternative for COPD risk assessment in patients with mildly impaired pulmonary function and for the control of the pre-COPD group.
This study has some limitations. Only cases with no abnormal findings in the CXR report were used to eliminate the influence of abnormal findings on the estimation of pulmonary function by image features of abnormal findings. Another reason is that it is significant for use in estimating pulmonary function is CXR without abnormal findings related to abnormalities in pulmonary function. However, the available training data can be expected to increase and a higher network performance can be achieved if the pulmonary function can be estimated accurately, even in cases with abnormal findings. The results of this study did not exclude the possibility of inferior estimation performance by deep learning for cases with lower % FVC and % FEV1. To validate and further generalize the findings of this study, it will be necessary to train a larger number of samples with low % FVC and % FEV1 and to perform external validation using data from another facility. Only ImageNet-pretrained networks publicly available in MATLAB and general deep-learning networks were used in this study. Depending on the samples and networks used, a larger network scale had greater correlation coefficient and MAPE. Thus, it is possible that larger deep learning networks can be used to develop pulmonary function estimation networks with higher performance.
5 Conclusion
Pulmonary function values measured using spirometry were estimated from the corresponding frontal CXRs using a general deep learning network. FVC, FEV1 and FEV1/FVC were estimated with an average accuracy of >90%. The pulmonary function estimation network developed in this study may be a useful method for pulmonary function screening or a potential substitute for spirometry.
Data availability statement
The raw data supporting the conclusions of this article will be made available by the authors, without undue reservation.
Ethics statement
The studies involving humans were approved by Ethics Committee of Niigata University of Health and Welfare. The studies were conducted in accordance with the local legislation and institutional requirements. The ethics committee/institutional review board waived the requirement of written informed consent for participation from the participants or the participants’ legal guardians/next of kin because this study was conducted using only anonymously processed information provided by Konica Minolta, Inc.
Author contributions
AY: Conceptualization, Data curation, Formal analysis, Investigation, Methodology, Software, Validation, Writing – original draft, Writing – review & editing. CK: Writing – review & editing. HF: Resources, Writing – review & editing. KO: Resources, Writing – review & editing. SKo: Writing – review & editing. IS: Writing – review & editing. SKa: Conceptualization, Methodology, Project administration, Supervision, Writing – review & editing.
Funding
The author(s) declare that financial support was received for the research, authorship, and/or publication of this article. This research was supported by a Grant-in-Aid for Scientific Research Start-up from KAKENHI (Grant No. 21K21265).
Acknowledgments
This study was conducted in collaboration with Konica Minolta, Inc. The author sincerely thank Yuta Hirono in the same laboratory for helpful discussions.
Conflict of interest
HF was employed by Konica Minolta, Inc.
The remaining authors declare that the research was conducted in the absence of any commercial or financial relationships that could be construed as a potential conflict of interest.
Publisher’s note
All claims expressed in this article are solely those of the authors and do not necessarily represent those of their affiliated organizations, or those of the publisher, the editors and the reviewers. Any product that may be evaluated in this article, or claim that may be made by its manufacturer, is not guaranteed or endorsed by the publisher.
References
1. Buist, AS , McBurnie, MA , Vollmer, WM , Gillespie, S , Burney, P , Mannino, DM, et al. International variation in the prevalence of COPD (the BOLD Study): a population-based prevalence study. Lancet. (2007) 370:741–50. doi: 10.1016/S0140-6736(07)61377-4
2. Agustí, A , Celli, BR , Criner, GJ , Halpin, D , Anzueto, A , Barnes, P, et al. Global initiative for chronic obstructive lung disease 2023 report: GOLD executive summary. Eur Respir J. (2023) 61:2300239. doi: 10.1183/13993003.00239-2023
3. Fouka, E , Papaioannou, AI , Hillas, G , and Steiropoulos, P . Asthma-COPD overlap syndrome: recent insights and unanswered questions. J Pers Med. (2022) 12:708. doi: 10.3390/jpm12050708
4. Celli, B , Fabbri, L , Criner, G , Martinez, FJ , Mannino, D , Vogelmeier, C, et al. Definition and nomenclature of chronic obstructive pulmonary disease: time for its revision. Am J Respir Crit Care Med. (2022) 206:1317–25. doi: 10.1164/rccm.202204-0671PP
5. Celli, BR , Cote, CG , Marin, JM , Casanova, C , Montes de Oca, M , Mendez, RA, et al. The body-mass index, airflow obstruction, dyspnea, and exercise capacity index in chronic obstructive pulmonary disease. N Engl J Med. (2004) 350:1005–12. doi: 10.1056/NEJMoa021322
6. Hurst, JR , Anzueto, A , and Vestbo, J . Susceptibility to exacerbation in COPD. Lancet Respir Med. (2017) 5:e29. doi: 10.1016/S2213-2600(17)30307-7
7. Lindberg, A , Jonsson, AC , Rönmark, E , Lundgren, R , Larsson, LG , and Lundbäck, B . Ten-year cumulative incidence of COPD and risk factors for incident disease in a symptomatic cohort. Chest. (2005) 127:1544–52. doi: 10.1378/chest.127.5.1544
8. Kalhan, R , Dransfield, MT , Colangelo, LA , Cuttica, MJ , Jacobs, DR Jr, Thyagarajan, B, et al. Respiratory symptoms in young adults and future lung disease. The CARDIA lung study. Am J Respir Crit Care Med. (2018) 197:1616–24. doi: 10.1164/rccm.201710-2108OC
9. Allinson, JP , Hardy, R , Donaldson, GC , Shaheen, SO , Kuh, D , and Wedzicha, JA . The presence of chronic mucus hypersecretion across adult life in relation to chronic obstructive pulmonary disease development. Am J Respir Crit Care Med. (2016) 193:662–72. doi: 10.1164/rccm.201511-2210OC
10. Guerra, S , Sherrill, DL , Venker, C , Ceccato, CM , Halonen, M , and Martinez, FD . Chronic bronchitis before age 50 years predicts incident airflow limitation and mortality risk. Thorax. (2009) 2009:894–900. doi: 10.1136/thx.2008.110619
11. Lange, P , Celli, B , and Agustí, A . Lung-function trajectories and chronic obstructive pulmonary disease. N Engl J Med. (2015) 373:1575. doi: 10.1056/NEJMc1510089
12. MacIntyre, NR , and Selecky, PA . Is there a role for screening spirometry? Respir Care. (2010) 55:35–42.
13. Barnhard, HJ , Pierce, JA , Joyce, JW , and Bates, JH . Roentgenographic determination of total lung capacity. A new method evaluated in health, emphysema and congestive heart failure. Am J Med. (1960) 28:51–60. doi: 10.1016/0002-9343(60)90222-9
14. Loyd, HM , String, ST , and DuBois, AB . Radiographic and plethysmographic determination of total lung capacity. Radiology. (1966) 86:7–14. doi: 10.1148/86.1.7
15. Pratt, PC , and Klugh, GA . A method for the determination of total lung capacity from posteroanterior and lateral chest roentgenograms. Am Rev Respir Dis. (1967) 96:548–52. doi: 10.1164/arrd.1967.96.3.548
16. Rodenstein, DO , Sopwith, T , Denison, DM , and Stanescu, DC . Reevaluation of the radiographic method for measurement of total lung capacity. Bull Eur Physiopathol Respir. (1985) 21:521–5.
17. Hino, T , Hata, A , Hida, T , Yamada, Y , Ueyama, M , Araki, T, et al. Projected lung areas using dynamic X-ray (DXR). Eur J Radiol Open. (2020) 7:100263. doi: 10.1016/j.ejro.2020.100263
18. Hida, T , Yamada, Y , Ueyama, M , Araki, T , Nishino, M , Kurosaki, A, et al. Time-resolved quantitative evaluation of diaphragmatic motion during forced breathing in a health screening cohort in a standing position: dynamic chest phrenicography. Eur J Radiol. (2019) 113:59–65. doi: 10.1016/j.ejrad.2019.01.034
19. Çallı, E , Sogancioglu, E , van Ginneken, B , van Leeuwen, KG , and Murphy, K . Deep learning for chest X-ray analysis: a survey. Med Image Anal. (2021) 72:102125. doi: 10.1016/j.media.2021.102125
20. Sogancioglu, E , Murphy, K , Scholten, TE , Boulogne, LH , Prokop, M , and van Ginneken, B . Automated estimation of total lung volume using chest radiographs and deep learning. Med Phys. (2022) 49:4466–77. doi: 10.1002/mp.15655
21. Schroeder, JD , Bigolin Lanfredi, R , Li, T , Chan, J , Vachet, C , Paine, R, et al. Prediction of obstructive lung disease from chest radiographs via deep learning trained on pulmonary function data. Int J Chron Obstruct Pulmon Dis. (2020) 15:3455–66. doi: 10.2147/COPD.S279850
22. Tseng, H , Henry, TS , Veeraraghavan, S , Mittal, PK , and Little, BP . Pulmonary function tests for the radiologist. Radiographics. (2017) 37:1037–58. doi: 10.1148/rg.2017160174
23. Tashkin, DP , Wang, H , Halpin, D , Kleerup, EC , Connett, J , Li, N, et al. Comparison of the variability of the annual rates of change in FEV1 determined from serial measurements of the pre-versus post-bronchodilator FEV1 over 5 years in mild to moderate COPD: results of the lung health study. Respir Res. (2012) 13:70. doi: 10.1186/1465-9921-13-70
24. Mannino, DM , Diaz-Guzman, E , and Buist, S . Pre- and post-bronchodilator lung function as predictors of mortality in the lung health study. Respir Res. (2011) 12:136. doi: 10.1186/1465-9921-12-136
25. ImageNet . Available at: http://www.image-net.org (Accessed October 27, 2023).
26. MathWorks . Pretrained deep neural networks. Available at: https://mathworks.com/help/deeplearning/ug/pretrained-convolutional-neural-networks.html (Accessed 27, October 2023).
27. Bland, JM , and Altman, DG . Statistical methods for assessing agreement between two methods of clinical measurement. Lancet. (1986) 1:307–10. doi: 10.1016/j.ijnurstu.2009.10.001
28. Yuan, R , Hogg, JC , Pare, PD , Sin, DD , Wong, JC , Nakano, Y, et al. Prediction of the rate of decline in FEV1 in smokers using quantitative computed tomography. Thorax. (2009) 64:944–9. doi: 10.1136/thx.2008.112433
29. Mohamed Hoesein, FA , de Hoop, B , Zanen, P , Gietema, H , Kruitwagen, CL , van Ginneken, B, et al. CT-quantified emphysema in male heavy smokers: association with lung function decline. Thorax. (2011) 66:782–7. doi: 10.1136/thx.2010.145995
30. Vestbo, J , Edwards, LD , Scanlon, PD , Yates, JC , Agusti, A , Bakke, P, et al. Changes in forced expiratory volume in 1 second over time in COPD. N Engl J Med. (2011) 365:1184–92. doi: 10.1056/NEJMoa1105482
31. Han, MK , Agusti, A , Celli, BR , Criner, GJ , Halpin, DMG , Roche, N, et al. From GOLD 0 to pre-COPD. Am J Respir Crit Care Med. (2021) 203:414–23. doi: 10.1164/rccm.202008-3328PP
32. GBD 2017 Disease and Injury Incidence and Prevalence Collaborators . Global, regional, and national incidence, prevalence, and years lived with disability for 354 diseases and injuries for 195 countries and territories, 1990–2017: a systematic analysis for the global burden of disease study 2017. Lancet. (2018) 392:1789–858. doi: 10.1016/S0140-6736(18)32279-7
Keywords: pulmonary function test, chest radiography, artificial intelligence, spirometry, deep learning
Citation: Yoshida A, Kai C, Futamura H, Oochi K, Kondo S, Sato I and Kasai S (2024) Spirometry test values can be estimated from a single chest radiograph. Front. Med. 11:1335958. doi: 10.3389/fmed.2024.1335958
Edited by:
Jim Wild, The University of Sheffield, United KingdomReviewed by:
Jian Luo, University of Oxford, United KingdomDiana Calaras, Nicolae Testemiţanu State University of Medicine and Pharmacy, Moldova
Copyright © 2024 Yoshida, Kai, Futamura, Oochi, Kondo, Sato and Kasai. This is an open-access article distributed under the terms of the Creative Commons Attribution License (CC BY). The use, distribution or reproduction in other forums is permitted, provided the original author(s) and the copyright owner(s) are credited and that the original publication in this journal is cited, in accordance with accepted academic practice. No use, distribution or reproduction is permitted which does not comply with these terms.
*Correspondence: Satoshi Kasai, satoshi-kasai@nuhw.ac.jp; Akifumi Yoshida, akifumi-yoshida@nuhw.ac.jp