Narrative review of magnetic resonance imaging in quantifying liver iron load
 Qing Feng1†
  Jixing Yi
 Fengming Xu
- 1Department of Radiology, Fourth Affiliated Hospital of Guangxi Medical University, Liuzhou Workers' Hospital, Liuzhou, China
- 2School of International Education, Guangxi Medical University, Nanning, China
- 3Department of Radiology, The First Affiliated Hospital of Guangxi Medical University, Nanning, China
Objective: To summarize the research progress of magnetic resonance imaging (MRI) in quantifying liver iron load.
Methods: To summarize the current status and progress of MRI technology in the quantitative study of liver iron load through reviewing the relevant literature at home and abroad.
Results: Different MRI sequence examination techniques have formed a series of non-invasive methods for the examination of liver iron load. These techniques have important clinical significance in the imaging diagnosis of liver iron load. So far, the main MRI methods used to assess liver iron load are: signal intensity measurement method (signal intensity, SI) [signal intensity ratio (SIR) and difference in in-phase and out-of-phase signal intensity], T2/R2 measurement (such as FerriScan technique), ultra-short echo time (UTE) imaging technique, and susceptibility weighted imaging (including conventional susceptibility weighted imaging) (SWI), quantitative susceptibility mapping (QSM), T2*/R2* measurement, Dixon and its derivative techniques.
Conclusion: MRI has become the first choice for the non-invasive examination of liver iron overload, and it is helpful to improve the early detection of liver injury, liver fibrosis, liver cirrhosis and liver cancer caused by liver iron overload.
1 Introduction
As Liver is one of the main iron storage organs, and Liver iron concentration (LIC), that can reflect the total iron load, is used as an important clinical indicator for clinical monitoring, evaluation and treatment of iron overload (1).
Iron is an essential component of proteins in many important biochemical reactions, including hemoglobin, myoglobin, cytochromes, and peroxidases (2). Since the body has no natural mechanism for iron excretion, excess iron is stored in the liver (iron overload) (1, 2). As iron can promote the transformation of hydrogen peroxide into free radicals, excessive iron will produce toxicity, which can damage proteins, cell membranes and DNA, and it will eventually lead to organ damage (1). The causes of iron overload in human organs are different. The onset of patients with iron overload in organs is insidious, and the progression rate is different. The corresponding symptoms and signs are diverse and non-specific, and the degree of tissue and organ involvement is different. The diagnosis can often be made only when the organ is significantly damaged (3). Early and accurate diagnosis of organ iron overload is essential for timely treatment of patients and avoidance of irreversible organ damage (1, 3). The actual liver iron concentration provided by liver biopsy is often used as the “gold standard” for clinical quantitative iron content indicators, but biopsy is expensive and only provides small sample LIC. It possibaly may not reflect the overall liver LIC accurately, and has the shortcomings of invasiveness and poor repeatability. So it is not suitable for repeated longitudinal detection in treatment (1, 2). At present, most scholars and medical centers prefer to use non-invasive magnetic resonance imaging (MRI) technology for quantitative evaluation of LIC and monitoring of liver iron chelation efficacy (1, 3–5). With the continuous development of MRI equipment and imaging sequences, T2* technique based on MRI gradient recalled echo (GRE) imaging sequence has been identified as the non-invasive preferred method for quantifying tissue iron content (2, 4–6). Many centers have been using the T2* relaxation method, the corresponding calibration formula and different software techniques to measure the relevant relaxation parameters of organs, such as T2* and R2* (1,000/T2*) values, so as to indirectly obtain the estimates of LIC of organs (4, 6). Currently, accurate quantification of organ iron content remains challenging, especially in patients with severe organ iron overload (1, 4, 6). Therefore, scholars are still looking for a reliable, noninvasive, accurate and reproducible assessment method of organ iron overload (3). At present, the methods used to detect LIC mainly include: Liver biopsy, laboratory tests such as serum ferritin (SF) and transferrin saturation (transferrin saturation, TS) detection, superconducting quantum electromagnetic interference (SQUID) iron quantification, computed tomography (CT) and MRI related technologies. This article reviews the basic principles, research progress and application status of magnetic resonance imaging T2* technology and other related magnetic resonance imaging techniques for quantifying liver iron load.
2 Liver tissue biopsy
As mentioned above, LIC reported by liver biopsy have long been used as the “gold standard” for clinical quantification of liver LIC (1, 3–5). However, due to different research centers or medical institutions, some factors may lead to discrepancies between LIC reported by liver biopsy, including the materials and methods used in the process of liver biopsy, and the heterogeneity of iron in liver tissue, etc. Some studies have pointed out that early liver iron deposition is uneven and irregular (7, 8), and the “spot sampling” of liver biopsy may not reflect the overall liver iron deposition. Moreover, repeated sampling and long-term LIC monitoring in patients with liver iron overload are not recommended because of the invasiveness and risk of complications of this method (1, 6). Therefore, liver biopsy is not an ideal method for long-term assessment of liver iron burden and monitoring the efficacy of iron chelation therapy.
3 Laboratory tests
Two measurement indexes commonly used in the laboratory to evaluate the iron load of organs in patients are SF and TS (3). Although SF and TS can reflect the iron load in human blood to a certain extent, they have no obvious correlation with organ iron deposition. The degree of correlation is not high enough to accurately quantify the iron content of liver or other organs (6, 8). Moreover, it is not comprehensive to only use SF and TS as indicators of iron load in human body. Because these two indicators are likely to show large changes due to inflammation, infection, blood transfusion, or other chronic diseases, SF will be too low even when patients have severe iron overload in organs (9, 10).
4 SQUID detection
Superconducting quantum interference device (SQUID) is a highly sensitive magnetic field detection instrument, which can measure the magnetic susceptibility of liver or other organs in a non-invasive way. Then the iron content of liver or other organs was quantitatively evaluated (11). It has been experimentally verified that the results of SQUID quantification of liver iron content show a good correlation with LIC reported by liver biopsy (10). However, the high cost of using this device and its very limited availability are the biggest limitations for the use of this device to quantify the iron content of organs. And the requirement of professionals for data measurement collection and equipment maintenance also limits its widespread use (3, 12). Therefore, SQUid-based measurements are currently not widely used in clinical practice for long-term quantitative monitoring of LIC in patients with iron overload.
5 CT examination
It is proved that X-rays decay proportionally with increasing tissue iron concentration. In the absence of intravenous contrast agent injection, if the liver density CT measurement value is ≥75HU, liver iron overload can be suspected (3). Although CT may be able to qualitatively monitor and assess liver iron overload in patients, attenuation or increase in liver CT measurements is not entirely due to iron overload (13). Recently, some studies have shown that dual-energy CT imaging can achieve quantitative assessment of LIC even in the presence of liver steatosis, and it has shown good correlation and consistency (14, 15). However, in addition to hepatic steatosis, other confounding factors, including Wilson’s disease, glycogen deposition, and certain medications (e.g., amiodarone), may also alter liver CT measurements (13, 14). Because ionizing effects can cause radiation damage to patients, CT examination is not the best choice for repeated measurement of LIC during iron chelation therapy monitoring in patients with liver iron overload.
6 MRI examination
In recent years, with the development of new MRI imaging techniques, more and more MRI imaging techniques have been applied to quantitative or semi-quantitative assessment of liver iron load in patients with iron overload (1, 4). Key approaches include: signal intensity (SI) measurement [including signal intensity ratio (SIR) and the difference of signal intensity in the same and opposite phase], T2/R2 measurement (such as FerriScan technique), T2*/R2* measurement, ultroshort echo time (ultroshort echo time, UTE), Dixon and its derivative techniques, and susceptibility weighted imaging techniques [conventional susceptibility weighted imaging (SWI) and quantitative susceptibility mapping (QSM)]. These techniques can quantify the organ iron load and reflect the severity of organ iron overload in patients with iron overload on the basis of non-invasiveness and no radiation damage, and the efficacy of iron chelation therapy can be evaluated in patients with iron overload (16, 17). Therefore, quantitative MRI imaging technology plays a very important role in the diagnosis, clinical classification, severity assessment and efficacy monitoring of iron chelation in liver iron overload. The merits and faults of different MRI examination methods are shown in Table 1.
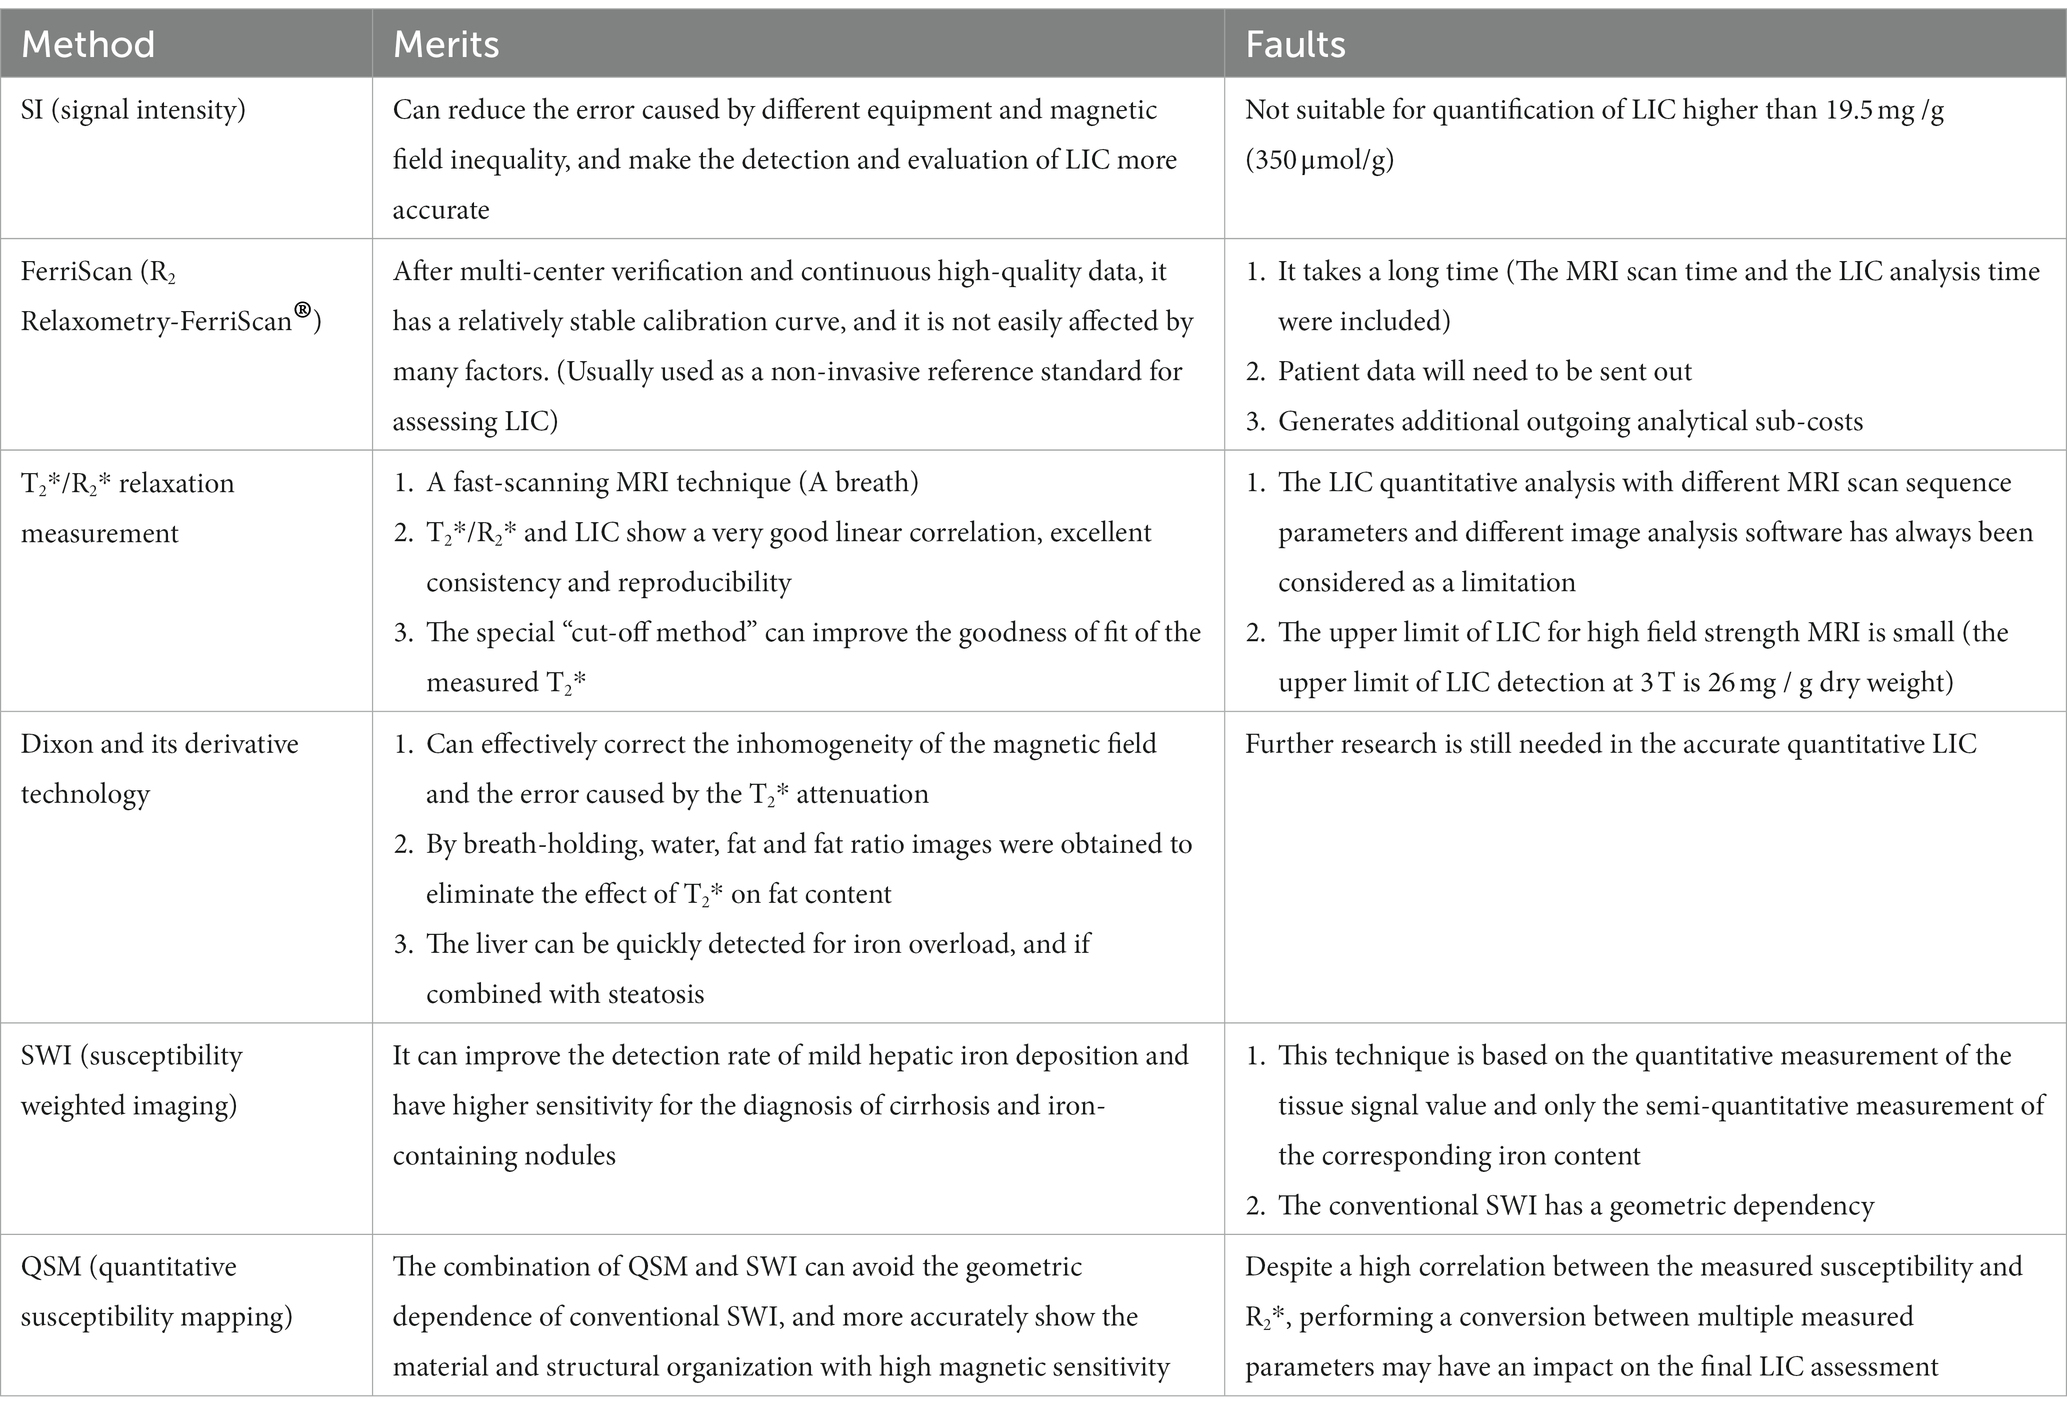
Table 1. Merits and faults of different MRI methods in quantitative LIC.
6.1 SI measurement method
Based on the correlation between LIC and its signal intensity, SI measurement method (mainly including SIR And difference in signal intensity of in-phase and out-of-phase) is used for semi-quantitative diagnosis of iron overload by measuring and calculating the ratio of SI of the liver and paraspinal muscles (such as erector spinae) without iron at the same level of the liver (3, 18). By reflecting the complex nonlinear relationship between LIC and SI, SIR Measurement can be used to assess the iron load in patients with moderate liver iron overload (18–20). Its advantage is that it can reduce the errors caused by different equipment and magnetic field heterogeneity, so that LIC detection and evaluation are more accurate (19, 20). The original SIR Method is suitable for iron overload of low to high severity, but not for LIC quantification above 19.5 mg/g (350 μmol/g) (1). Early research data from Ernst et al. (18) showed that the range of liver iron concentration that SIR could detect was 50–300 μmol/g, but it had low accuracy in detecting liver iron overload less than 50 μmol/g or more than 300 μmol/g. The SIR Method has been verified at 1.5 T and 3 T, but there is no regulatory approval at present (1). However, d'Assignies et al. (19) suggested that the use of 3 T MRI SIR may be able to more accurately quantify the liver iron load in patients with severe liver iron overload. The wider measurement range of the SIR Measurement may be due to the lower sensitivity of the spinecho (SE) sequence to iron. And it leads to delayed signal loss at high LIC due to the shorter TE, thus allowing the assessment of more severe liver iron overload. In recent years, Jensen et al. (21) found that the upper limit of 1.5 T MRI SIR Measurement range would be extended to 115 mg/g if the relevant parameters TE = 12 ms and TR = 1,200 ms were set in the liver iron overload experiment of quantitative miniature pigs. However, this conclusion was drawn in an animal model and requires further validation in iron-loaded patients. Therefore, the current SIR Method for measuring liver iron overload should be considered as an alternative to R2 and R2* relaxation quantification methods.
6.2 Relaxation measurement method
At present, the main MRI sequences used to measure LIC are SE sequence and GRE sequence. With SE and GRE sequences, based on the influence of iron, the transverse relaxation of proton magnetization in water becomes faster, resulting in attenuation of magnetic resonance signal intensity, and T2 and T2* weighted imaging are obtained, respectively. Then the corresponding signal decay time constants T2 and T2* and the corresponding relaxation rates R2 (1,000/T2) and R2* (1,000/T2*) were obtained (1, 3, 22). Relaxometry is a quantitative assessment of MRI signal loss caused by the shortening of T2/T2* relaxation times (21, 22). Excess iron stored in the body in the form of trivalent iron can shorten T1 and T2—as T1 shortens, the corresponding SI increases; The corresponding SI decreases with the shortening of T2 (1, 3).
6.2.1 T2/R2 relaxation measurement method
The T2/R2 relaxation measurement method is based on the T2 SE sequence (a time-wasting sequence whose transverse relaxation time depends on the iron content of the tissue) to evaluate the iron concentration in different tissues by measuring the size of the T2 value (23). The R2 relaxation quantitative method is based on SE signals of multiple TE, and the attenuation of R2 in this method is mainly composed of irreversible spin echo R2 (1, 3, 23). St Pierre et al. (24) obtained the calibration constant of the single exponential attenuation model by analyzing specific MRI imaging parameters. This method enables LIC conversion of the obtained R2 measurements, and this quasi-method is called R2 Relaxometry® (FerriScan) (24). FerriScan is a widely validated 1.5 T MRI technique that has been certified and approved by the Food and Drug Administration (FDA) for commercial use for safe, reliable, and noninvasive LIC assessment. Quantification of a wide range of LIC can be achieved based on five T2-weighted SE sequence acquisitions during free breathing, with TE added to calculate R2 (1, 24, 25). The R2-Ferriscan method has a relatively stable calibration curve due to multi-center validation and continuous high-quality data, and is not affected by multiple factors (MRI equipment, patient age, fibrosis stage, inflammation, iron chelator treatment, etc.). It is commonly used as a noninvasive reference standard for evaluating LIC (1, 24). However, this technology also has many limiting problems: (1) This method takes a long time to collect, patients may feel uncomfortable or anxious, and errors will be introduced by movement (1); (2) Because T2/R2 sequence is not easy to measure fat, one of the limitations of FerriScan is that it cannot quantify the fat content in liver tissue (26). (3) The MRI T2/R2 data of the patients were sent to FerriScan for offsite post-processing and analysis. However, sending patient data off-site requires the approval of the relevant center, and the time cost required will prolong the time of obtaining LIC results. (4) The additional analysis cost will increase the monitoring cost of LIC. These factors concurred to the fact that liver iron quantification using the FerriScan technique is limited to a few large medical centers or research institutions, and the possibility of monitoring patients with LIC on a regular or long-term basis is substantially reduced (24, 27, 28).
6.2.2 T2*/R2* relaxation measurement method
T2*/R2* relaxation measurement is a fast scanning MRI technique that can obtain the corresponding T2* image data only after a patient holds his or her breath once. At present, many studies have shown that T2*/R2* relaxation quantitative methods have good linear correlation when measuring LIC at 1.5 T and 3 T. T2* is negatively correlated with LIC. R2* is positively correlated with LIC and has shown excellent agreement and reproducibility (1, 4, 5, 22, 23, 27, 29), and this measurement has become a reliable quantitative assessment of liver iron overload. Figure 1 from Xu et al. (4) shows liver T2* measured by different software. There are two other free software from Prof Gandon in France (19):
(1) https://imagemed.univ-rennes1.fr/en/mrquantif/quantif
(2) http://www.isodense.com/ic/
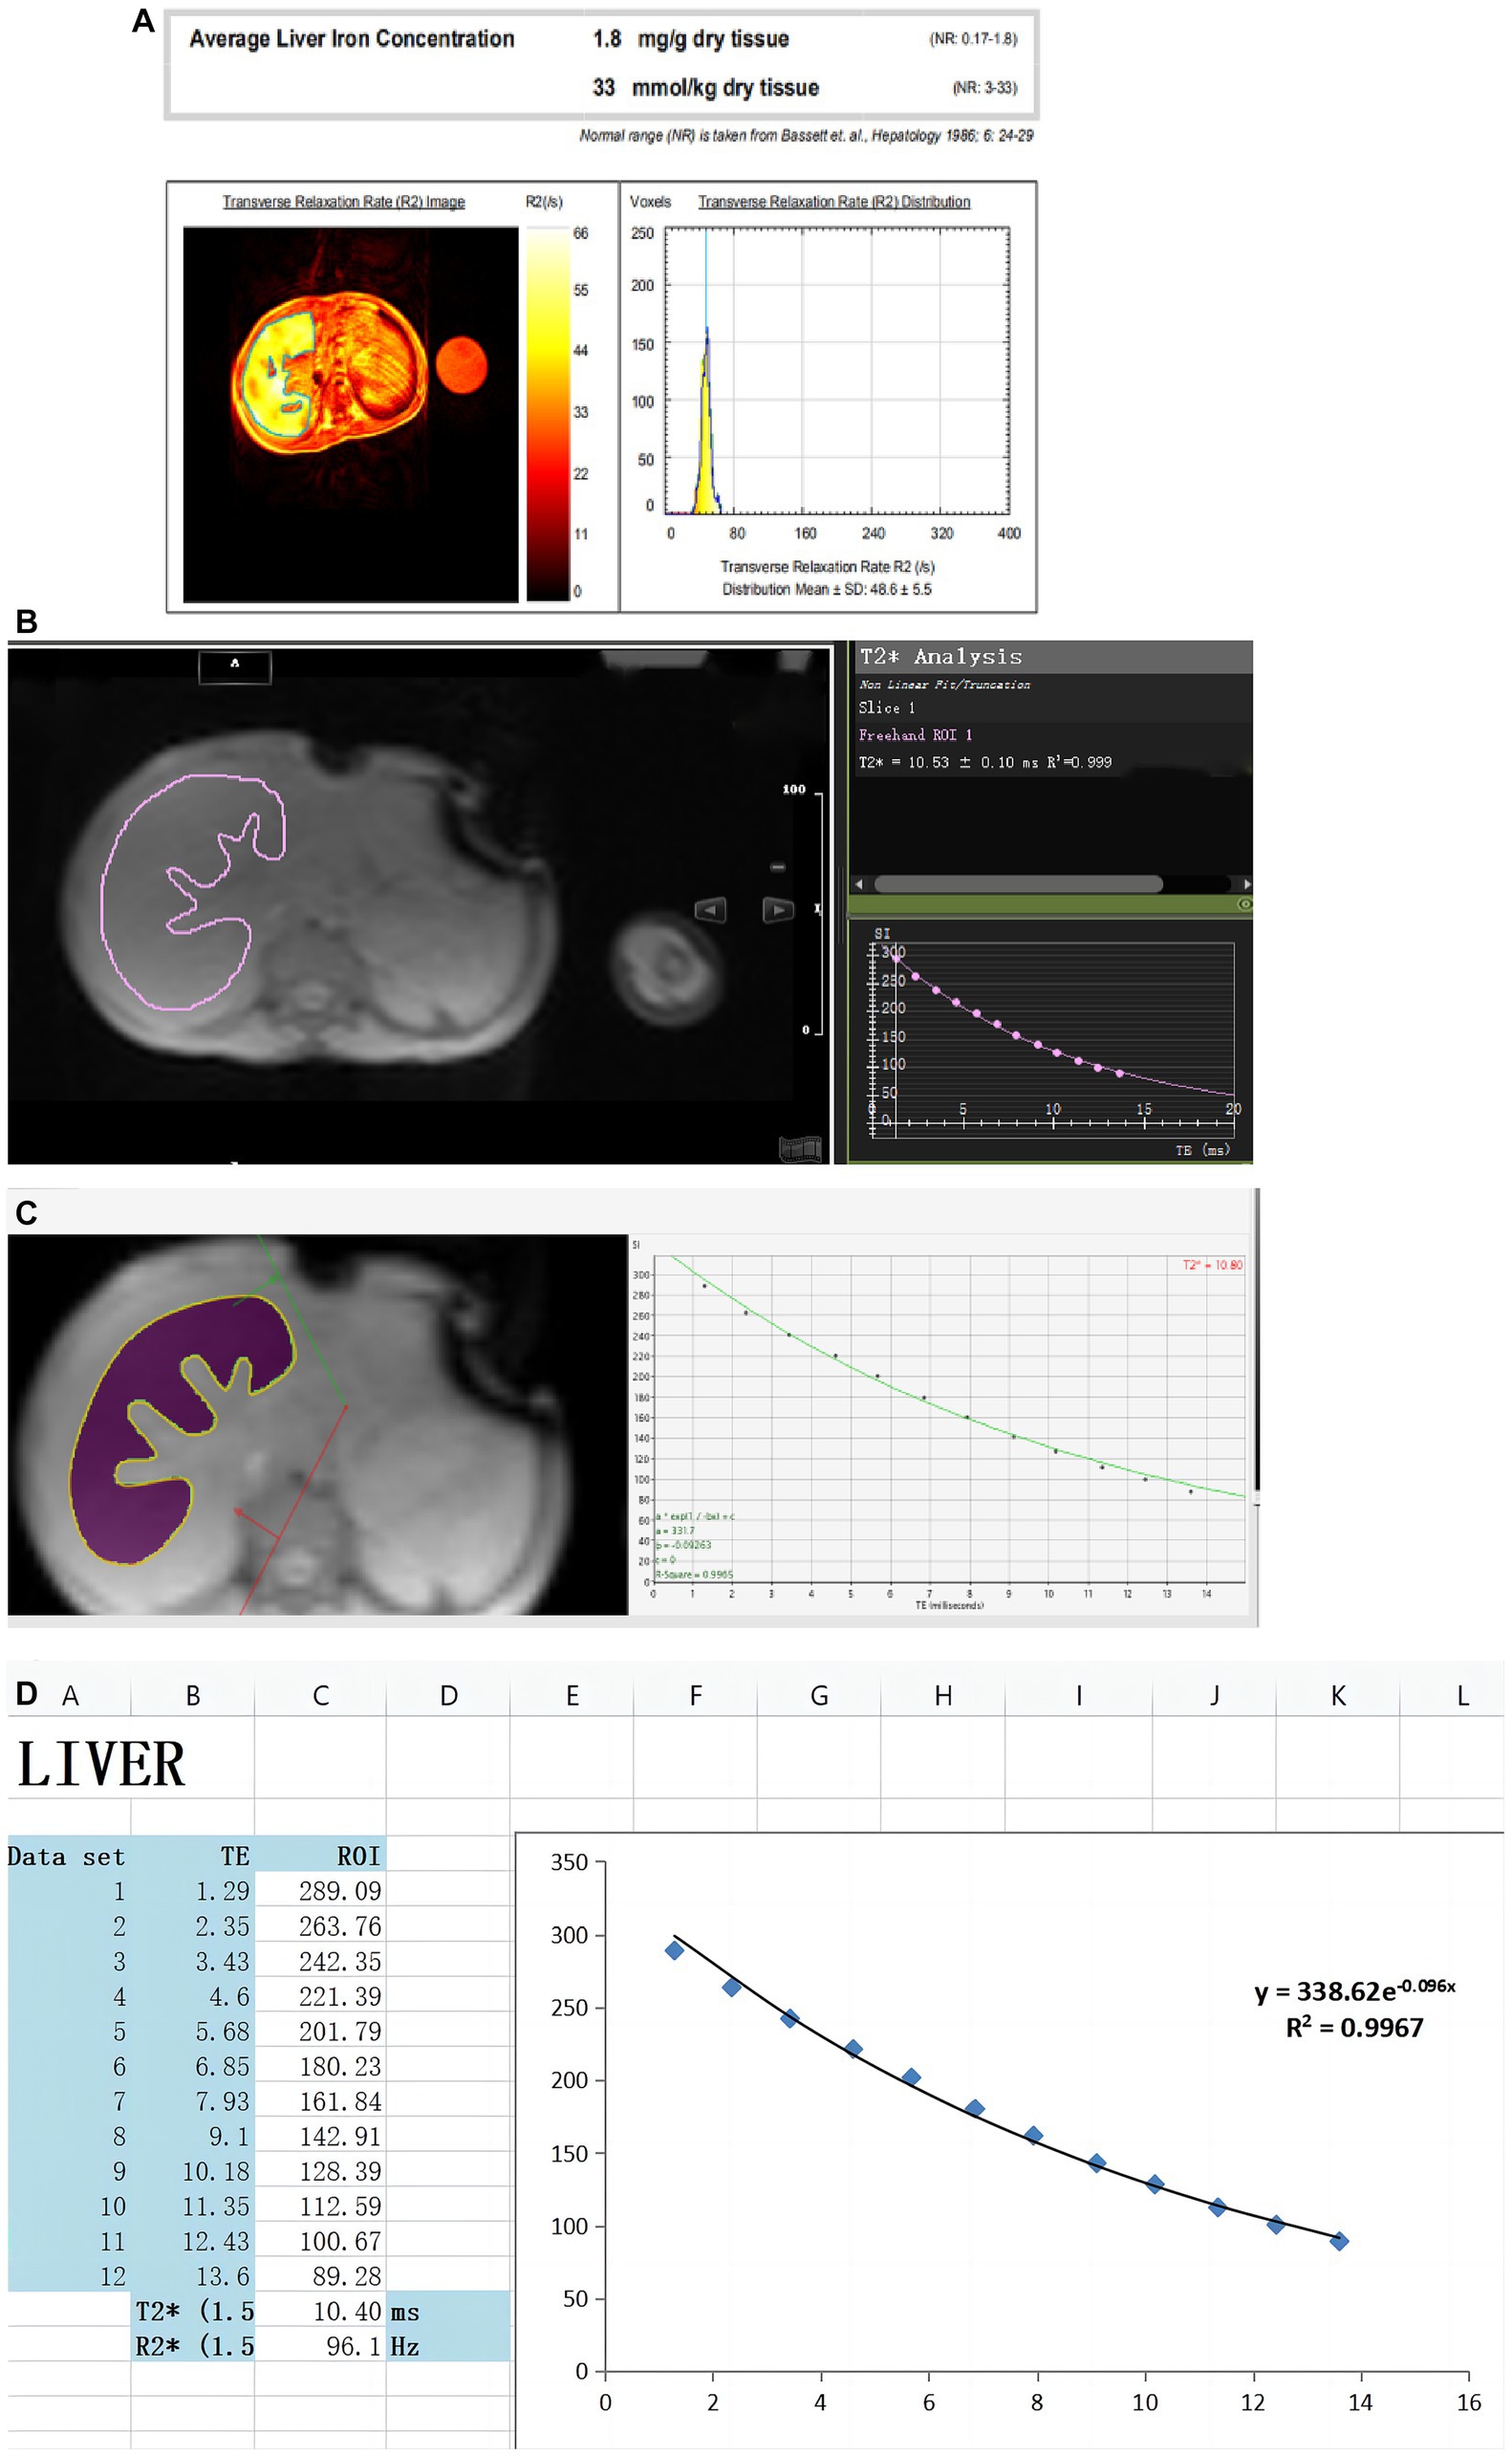
Figure 1. Created by Xu et al. (4) can be reused under the CC BY license (https://creativecommons.org/licenses/by-nc/4.0). These figures show LIC was quantified in the same thalassemia patient using different software. (A) Report from the FerriScan: LIC = 1.8 mg/g dw. (B) Report from Circle Cardiovascular Imaging CVI42 (CVI42): T2* = 10.53 ms. (C) Report from CMRtools/Thalassemia Tools (CMRtools): T2* = 10.80 ms. (D) Report from Excel spreadsheet (Excel): T2* = 10.40 ms.
However, the different MRI scanning sequence parameters and image analysis software used in many studies have been considered as a limitation (26, 30, 31). Studies have shown that the existing bias can be corrected, and in some cases, the Goodness of Fit (R2) of the measurement can be improved by using the truncation method to remove part of the interfering signal that affects the background noise. It thereby provides clinically acceptable LIC estimation and reproducible results (31). Therefore, many medical centers or scientific research institutions have been using T2*/R2* relaxometry, self-made MRI sequences and corresponding post-processing software for quantitative assessment of liver iron overload (5, 30, 32–38). Using the R2* relaxation method in the quantitative study of liver iron overload, Henninger et al. (6) initially performed liver biopsy and MRI in 17 patients with clinically suspected liver iron overload with the relevant parameters set as repetition time (TR) = 200 ms and initial echo time (TE) = 0.99 ms. Finally, the regression model between R2* and LIC was constructed as follows. LIC = 0.024R2* + 0.277, correlation coefficient = 0.926, slope = 0.024 (mg/g) [95%CI = 0.013–0.024], intercept = 0.277 (mg/g) [95%CI = 0.328–2.49]. In an early study by Wood et al. (30), the set TE was increased from the initial 0.8–4.8 ms at an interval of 0.25 ms in a breath-hold, with TR = 25 ms. After MRI evaluation of 102 patients with liver iron overload (the biopsimeasured LIC was evenly distributed between 1.3 mg/gdw and 32.9 mg/gdw, and one patient had a HIC of 57.8 mg/g dw), the final LIC-R2* regression equation was constructed as follows: The correlation coefficient was 0.97, the slope was 37.4 Hz/mg/gdw, and the y-intercept was 23.7 Hz. In the early study of Hankins et al. (33), TE = 1.1–17.3 ms (20 echoes) was set, and 43 patients (32 with sickle cell anemia, 6 with major β-thalassemia, 6 with mild thalassemia) were tested. Five patients with bone marrow failure underwent MRI examination and liver biopsy (LIC range = 0.6 mg Fe/g to 27.6 mg Fe/g). The final LIC-R2* regression model was constructed as follows: The intercept was −454.85, the slope was 28.02 (p < 0.001), the R2 was 0.72, and the correlation coefficient was 0.98. In an early study by Christoforidis et al. (34), MRI was performed on 94 patients with β-thalassemia major with TE = 2.24 ms ~ 20.13 ms and TR = 200 ms. By comparing the relationship between liver-muscle ratio (MRI-LIC = 5 μmol/g ~ 350 μmol/g) and R2* (27.03 s−1 ~ 1298.70 s−1), the final LCI-R2* regression model was constructed as follows: R2* = 0.851(MR-LIC) - 2.137 (correlation coefficient = 0.851). In the study of Garbowski et al. (35), TE = 0.93 ms ~ 16.0 ms was set. Fifty-four patients (36 cases of thalassemia major, 7 cases of sickle cell anemia, 4 cases of myelodysplastic syndrome, 3 cases of Diamond-Blackfan anemia, 2 cases of red cell aplasia, 2 cases of pyruvate kinase deficiency anemia) and 31 healthy volunteers underwent liver biopsy (LIC = 1.7 mg/g dw ~ 42.3 mg/g dw) and MRI (R2* range: 28.7 s−1 to 54.4 s−1). Finally, the regression models of LIC (biopsy)-T2* and LIC (biopsy)-R2* were constructed: (1) LIC = 31.94(T2*)−1.014, 95%CI of coefficient = 27.8 ~ 36.7 (87% ~ 115%), 95%CI of index = −1.118 ~ −0.91 (110% ~ 90%). (2) LIC = 0.029R2*1.014, 95%CI of coefficient = 0.016 ~ 0.054 (55% ~ 186%), 95%CI of index = 0.910 ~ 1.118 (90% ~ 110%). Garbowski et al. also constructed the correction relationship between LIC(Ferriscan)-R2* and LIC(T2*)-T2*: (1) R2-LIC = 0.83 T2*-LIC1.04, 95%CI of coefficient = 0.96 ~ 1.11, 95%CI of index = 0.55 ~ 1.29. (2) R2-LIC = 0.87R2*-LIC -0.55, 95%CI of slope = 0.74 ~ 0.99, 95%CI of intercept = −0.01 ~ 1.19. The linear relationship between the relaxation parameters and the LIC for the different studies is shown in Table 2.
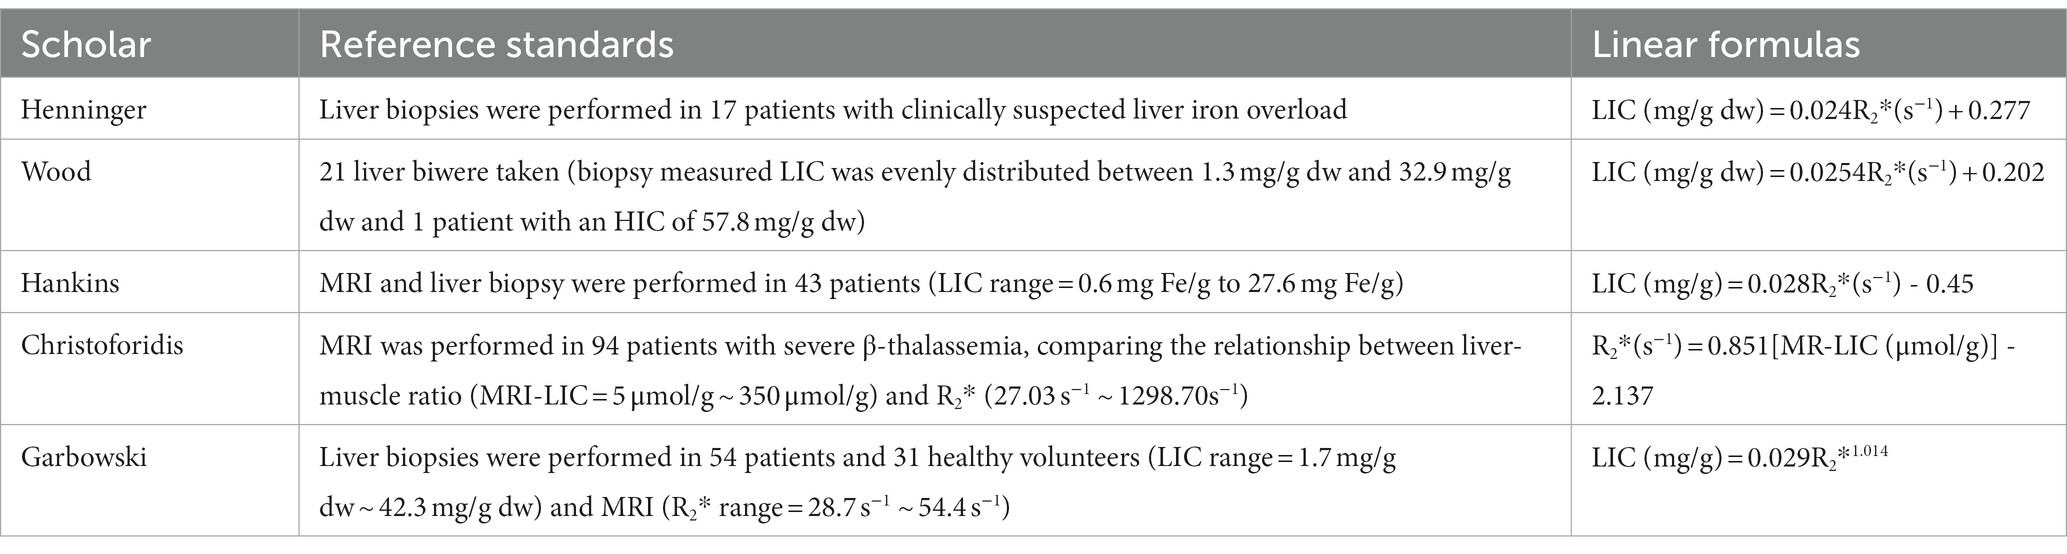
Table 2. The linear relationship between the relaxation parameters and the LIC.
With the development of The Times, high-magnetic field MRI (3 T and above) scanners may gradually replace low-magnetic field MRI scanners because of their high contrast images (30, 33). However, T2*/R2* relaxation measurement method has a certain range for LIC measurement: [The upper limit of LIC detection is 26 mg/g (466 μmol/g) at 3 T, and 52 mg/g (932 μmol/g) at 1.5 T] (1). Moreover, with the increase of magnetic field, the decrease rate of T2* value is faster, which may make a big difference in the accurate quantitative analysis of liver iron load in patients with iron overload in higher magnetic field. Although previous studies have reported that the high sensitivity of 3 T MRI for liver iron quantification in patients with iron overload can more accurately analyze and detect mild iron overload, some studies have used 3 T MRI T2*/R2* technology to quantify liver iron overload only for the diagnosis of iron overload. However, it is not possible to accurately quantify LIC in patients with moderate to severe liver iron overload at 3 T field strength, especially those with LIC > 26 mg/g (466 μmol/g). It is strongly recommended that 3 T T2* method should be avoided to quantify LIC in patients with severe iron overload. Whereas 1.5 T or other methods are used (1, 18, 19).
6.2.3 Dixon and its derivative technology
Based on the fact that water and fat have different precession frequencies in the magnetic field, the in-and out-phase of water and fat can be obtained by adjusting the Dixon technique of chemical shift imaging of TE (3, 23). Then by computational processing, images of separate water or fat signals can be obtained (3, 23). As a T2*-weighted sequence examination method capable of quantifying fat, Dixon technique is mainly used in fat quantification studies of the liver (3, 36, 37). Meanwhile, R2* mapping obtained from T2* using this technique can also be used for quantitative analysis of liver iron overload (36, 37). Since the development of Dixon technique, its related imaging techniques have been continuously improved, from the initial acquisition of signals under two echoes (two-point acquisition) to the acquisition of signals under three or six echoes.
The disadvantage of two-point Dixon imaging is that it is easy to be affected by the interference of the non-uniform main magnetic field and the attenuation effect of T1 and T2*. It will lead to fuzzy display of the structure of the interface between water and fat on the image, resulting in incomplete separation of water and fat (34–39). Three-point Dixon water-fat separation imaging technology can overcome the above shortcomings: Three-point Dixon imaging is characterized by the acquisition of an echo signal in the same phase on the basis of two-point imaging. The acquisition time of the middle signal is the same as that of the spin echo/fast spin echo (FSE) sequence. It can correct the rapid decay of T2* to a certain extent (34, 35, 38). However, because the liver fat fraction obtained by three-point Dixon imaging is also susceptible to various confounding factors, the accuracy, reliability and repeatability of its results as liver fat quantification still need further study (40).
At present, chemical replacement water-fat separation imaging technology with multiple gradient echoes is the most common, such as the Liver Laboratory Liver-LabqDixon and IDEAL-IQ technology from Siemens. Compared with the early Dixon technique, the six-echo Dixon technique can effectively correct the magnetic field inhomogeneity and the error caused by T2* attenuation, and make the measurement result more accurate. DEAL-IQ achieves dynamic 0 to 100% fat ratios by reconstructing complex domains. By holding the breath, water, fat and fat ratio images were obtained and the effect of T2* on fat content can be eliminated. Fat distribution map can not only directly measure fat content, but also reflect fat distribution (41). This method can be applied to the measurement and analysis of visceral fat content, the application of fat quantification technology in musculoskeletal system diseases, and it also can be applied to the quantitative measurement of iron, such as the detection of iron deposition in the central nervous system of patients with Alzheimer’s disease and Parkinson’s disease, and the quantitative analysis of iron overload in solid organs and endocrine glands. It is not limited in the test of organs, and can be used in the test of heart, liver, pancreas and spleen (41, 42). At present, most published studies on iron overload at home and abroad are mainly based on IDEAL-IQ technology (42). LAVA-Flex sequence is a 3D disturbed gradient echo sequence based on Dixon technique. This technique is to obtain pure water image, pure fat image, in-phase image and out-of-phase image by applying machine to post-process the original data (42, 43). Then it is combined to determine whether the liver has iron overload, and LAVA-Flex sequence can be used to quickly detect whether the liver has iron overload and whether it is complicated with steatosis (43). Dixon technique has a very optimistic application prospect either as a means of scientific research at present or as an independent clinical detection project in the future.
6.3 Susceptibility weighted imaging and QSM techniques
Susceptibility weighted imaging (SWI), based on T2*-weighted gradient echo sequence, provides image contrast enhancement according to the difference in magnetic sensitivity between different tissues. It is an imaging technique that can obtain a phase image and a magnitude image at the same time. The basic principle of this technology is to perform high-resolution 3D gradient echo imaging based on T2* -weighted gradient echo sequence to detect the difference in magnetic sensitivity between different tissues for comparative analysis (44).
SWI has become a widely used imaging diagnostic technique in clinical practice, which is often used for the differential diagnosis of cerebral hemorrhage, intracerebral microvascular hemorrhage and intracranial calcification. This technique is based on quantitative measurement of tissue signal values and semi-quantitative measurement of corresponding iron content, which can improve its sensitivity to iron (3, 22, 45). With the continuous application of MRI technology in the detection of iron overload, the application of SWI in the study of liver iron overload is also increasing. Compared with other MRI imaging sequences such as T2 SE and T2* gradient echo, SWI has some different advantages: SWI can improve the detection rate of mild hepatic iron deposition, and has higher sensitivity for the diagnosis of small iron-containing nodules in liver cirrhosis (45, 46).
Although SWI has made progress in the related research of liver iron overload, the current conventional SWI has geometric dependence. The quantitative assessment of liver iron burden needs further in-depth research (44). QSM can reduce phase confounding and the limitation of T2 signal attenuation by using short TE. Moreover, the combination of SWI and QSM can avoid the geometric dependence of conventional SWI, and can more accurately display substances and structures with high magnetic sensitivity (44, 46).
At present, studies based on abdominal QSM technology have verified the feasibility of QSM technology in quantitative detection of liver iron in patients with iron overload (47). Sharma et al. (48) confirmed that quantitative susceptibility mapping-based biomagnetic liver susceptometry (QSM-BLS) can provide clear three-dimensional images. Moreover, the magnetic susceptibility measured by QSM technology has a high correlation with R2*, which can be used to correct R2* and evaluate liver iron load, especially when SQUID equipment is lacking for accurate quantification (44–47).
7 Conclusion
In summary, although there are many methods to detect liver iron load, MRI has become an important method in clinical practice to detect liver iron load in patients with iron overload due to its advantages of non-invasiveness, accuracy and repeatability (3, 5). This method is helpful to improve the early detection of liver damage, liver fibrosis, cirrhosis and even liver cancer in patients with iron overload. However, most of the existing studies based on the effect of MRI on the detection of liver iron concentration have a certain quantitative range, and the quantitative analysis of liver iron concentration in patients with iron overload by high-field MRI is limited. It is necessary to further optimize the MRI sequence and establish a perfect and standardized data analysis method. This will further improve the clinical application of MRI in the diagnosis of liver iron overload and monitoring the efficacy of iron chelation therapy.
Author contributions
QF: Writing – original draft, Writing – review & editing. JY: Writing – original draft, Writing – review & editing. TL: Writing – original draft, Writing – review & editing. BL: Writing – original draft, Writing – review & editing. FX: Writing – original draft, Writing – review & editing. PP: Funding acquisition, Writing – review & editing.
Funding
The author(s) declare financial support was received for the research, authorship, and/or publication of this article. This work was supported by grants from the National Natural Science Foundation of China (81760305), National Natural Science Foundation of China (81641066). The Key Research and Development Program of the Liuzhou science and technology planning project (2019BJ10607) and The Science and technology research and new product reagents of Liuzhou Science and Technology Bureau(2021CBC0128) and The Key Laboratory of Children’s Disease Research in Guangxi’s Colleges and Universities, Education Department of Guangxi Zhuang Autonomous Region (GXCDR2023001). At the same time, this study is supported by the “Advanced Innovation Teams and Xinghu Scholars Program of Guangxi Medical University” project and NHC Key Laboratory of Thalassemia Medicine and Guangxi Key laboratory of Thalassemia Research.
Conflict of interest
The authors declare that the research was conducted in the absence of any commercial or financial relationships that could be construed as a potential conflict of interest.
Publisher’s note
All claims expressed in this article are solely those of the authors and do not necessarily represent those of their affiliated organizations, or those of the publisher, the editors and the reviewers. Any product that may be evaluated in this article, or claim that may be made by its manufacturer, is not guaranteed or endorsed by the publisher.
References
1. Labranche, R, Gilbert, G, Cerny, M, Vu, KN, Soulières, D, Olivié, D, et al. Liver Iron quantification with MR imaging: a primer for radiologists. Radiographics. (2018) 38:392–412. doi: 10.1148/rg.2018170079
2. Reeder, SB, Yokoo, T, França, M, Hernando, D, Alberich-Bayarri, Á, Alústiza, JM, et al. Quantification of liver Iron overload with MRI: review and guidelines from the ESGAR and SAR. Radiology. (2023):221856. doi: 10.1148/radiol.221856
3. Yi, Z, Bin, S, Fubi, H, and Fang, Y. Progress of quantitative magnetic resonance technology in iron overload of substantial abdominal organs. Chinese J Gen Foreign Affairs Found Clin Affairs. (2017) 24:1139–44. doi: 10.7507/1007-9424.201707066
4. Xu, F, Yi, J, Liang, B, Tang, C, Feng, Q, and Peng, P. Comparative study on the measurement of liver LICdw between Ferriscan and T2* based LICdw obtained by different Software's. Mediter J Hematol Infect Dis. (2022) 14:e2022072. doi: 10.4084/MJHID.2022.072
5. Yidi, C, Liling, L, Peng, P, Zhongkui, H, and Chunyan, L. The MRI T2* value was used to quantitatively assess the value of the iron deposition in organs in patients with severe β thalassemia. Chinese J Radiol. (2017) 51:284–7. doi: 10.3760/cma.j.issn.1005-1201.2017.04.010
6. Henninger, B, Zoller, H, Rauch, S, Finkenstedt, A, Schocke, M, Jaschke, W, et al. R2* relaxometry for the quantification of hepatic iron overload: biopsy-based calibration and comparison with the literature. Rofo. (2015) 187:472–9. doi: 10.1055/s-0034-1399318
7. Musallam, KM, Motta, I, Salvatori, M, Fraquelli, M, Marcon, A, Taher, AT, et al. Longitudinal changes in serum ferritin levels correlate with measures of hepatic stiffness in transfusion- independent patients with β-thalassemia intermedia. Blood Cells Mol Dis. (2012) 49:136–9. doi: 10.1016/j.bcmd.2012.06.001
8. França, M, and Carvalho, JG. MR imaging assessment and quantification of liver iron. Abdom Radiol (NY). (2020) 45:3400–12. doi: 10.1007/s00261-020-02574-8
9. Ghugre, NR, Coates, TD, Nelson, MD, and Wood, JC. Mechanisms of tissue-iron relaxivity: nuclear magnetic resonance studies of human liver biopsy specimens. Magn Reson Med. (2005) 54:1185–93. doi: 10.1002/mrm.20697
10. Roghi, A, Cappellini, MD, Wood, JC, Musallam, KM, Patrizia, P, Fasulo, MR, et al. Absence of cardiac siderosis despite hepatic iron overload in Italian patients with thalassemia intermedia: an MRI T2* study. Ann Hematol. (2010) 89:585–9. doi: 10.1007/s00277-009-0879-3
11. Brittenham, GM, and Badman, DG. National Institute of Diabetes and Digestive and Kidney Diseases (NIDDK)workshop. Noninvasive measurement of iron: report of an NIDDK workshop. Blood. (2003) 101:15–9. doi: 10.1182/blood-2002-06-1723
12. Brittenham, GM, Sheth, S, Allen, CJ, and Farrell, DE. Noninvasive methods for quantitative assessment of transfusional iron overload in sickle cell disease. Semin Hematol. (2001) 38:37–56. doi: 10.1016/s0037-1963(01)90059-9
13. Donners, R, Zaugg, C, Gehweiler, JE, Boldanova, T, Heim, MH, Terracciano, LM, et al. Computed tomography (CT) and magnetic resonance imaging (MRI) of diffuse liver disease: a multiparametric predictive modelling algorithm can aid categorization of liver parenchyma. Quant Imaging Med Surg. (2022) 12:1186–97. doi: 10.21037/qims-21-384
14. Du, D, Wu, X, Wang, J, Chen, H, Song, J, Liu, B, et al. Impact of iron deposit on the accuracy of quantifying liver fat fraction using multi-material decomposition algorithm in dual-energy spectral computed tomography. J Appl Clin Med Phys. (2021) 22:236–42. doi: 10.1002/acm2.13368
15. Xie, T, Li, Y, He, G, Zhang, Z, Shi, Q, and Cheng, G. The influence of liver fat deposition on the quantification of the liver-iron fraction using fast-kilovolt-peak switching dual-energy CT imaging and material decomposition technique: an in vitro experimental study. Quant Imaging Med Surg. (2019) 9:654–61. doi: 10.21037/qims.2019.04.06
16. Positano, V, Meloni, A, Santarelli, MF, Pistoia, L, Spasiano, A, Cuccia, L, et al. Deep learning staging of liver Iron content from multiecho MR images. J Magn Reson Imaging. (2023) 57:472–84. doi: 10.1002/jmri.28300
17. Hernando, D, Zhao, R, Yuan, Q, Aliyari Ghasabeh, M, Ruschke, S, Miao, X, et al. Multicenter reproducibility of liver Iron quantification with 1.5-T and 3.0-T MRI. Radiology. (2023) 306:e213256. doi: 10.1148/radiol.213256
18. Ernst, O, Sergent, G, Bonvarlet, P, Canva-Delcambre, V, Paris, JC, and L'Herminé, C. Hepatic iron overload: diagnosis and quantification with MR imaging. AJR Am J Roentgenol. (1997) 168:1205–8. doi: 10.2214/ajr.168.5.9129412
19. d'Assignies, G, Paisant, A, Bardou-Jacquet, E, Boulic, A, Bannier, E, Lainé, F, et al. Non-invasive measurement of liver iron concentration using 3-tesla magnetic resonance imaging: validation against biopsy. Eur Radiol. (2018) 28:2022–30. doi: 10.1007/s00330-017-5106-3
20. Fernandes, JL, Fioravante, LAB, Verissimo, MP, and Loggetto, SR. A free software for the calculation of T2* values for iron overload assessment. Acta Radiol. (2017) 58:698–701. doi: 10.1177/0284185116666416
21. Jensen, PD, Nielsen, AH, Simonsen, CW, Jensen, KK, Bøgsted, M, Jensen, ABH, et al. Biopsy-based optimization and calibration of a signal-intensity-ratio-based MRI method (1.5 tesla) in a dextran-iron loaded mini-pig model, enabling estimation of very high liver iron concentrations. MAGMA. (2022) 35:843–59. doi: 10.1007/s10334-021-00998-x
22. Zaizhu, Z, Bo, H, Guiying, D, Sun, P, Guan, W, Lin, Q, et al. Association of hepatic/pancreatic iron overload evaluated by quantitative T2* MRI with bone mineral density and trabecular bone score. BMC Endocr Disord. (2023) 23:1–8. doi: 10.1186/S12902-022-01262-6
23. Zhang, Q, Hou, B, Wang, L, du, Y, Han, B, and Feng, F. MRI monitoring in diagnosis and follow-up of iron overload. Zhonghua xueyexue zazhi. (2015) 36:302–6. doi: 10.3760/cma.j.issn.0253-2727.2015.04.009
24. St Pierre, TG, Clark, PR, Chua-anusorn, W, Fleming, AJ, Jeffrey, GP, Olynyk, JK, et al. Noninvasive measurement and imaging of liver iron concentrations using proton magnetic resonance. Blood. (2005) 105:855–61. doi: 10.1182/blood-2004-01-0177
25. Craft, ML, Edwards, M, Jain, TP, and Choi, PY. R2 and R2* MRI assessment of liver iron content in an undifferentiated diagnostic population with hyperferritinaemia, and impact on clinical decision making. Eur J Radiol. (2021) 135:109473. doi: 10.1016/j.ejrad.2020.109473
26. Hernando, D, Levin, YS, Sirlin, CB, and Reeder, SB. Quantification of liver iron with MRI: state of the art and remaining challenges. J Magn Reson Imaging. (2014) 40:1003–21. doi: 10.1002/jmri.24584
27. Wunderlich, AP, Cario, H, Kannengießer, S, Grunau, V, Hering, L, Götz, M, et al. Volumetric Evaluation of 3D Multi-Gradient-Echo MRI Data to Assess Whole Liver Iron Distribution by Segmental R2* Analysis: First Experience. Volumetrische Auswertung von 3D-Multigradientenecho-MRT-Daten zur Beurteilung der Eisenverteilung in der gesamten Leber durch segmentale R2*-Analyse: erste Erfahrungen. Rofo. (2023) 195:224–33. doi: 10.1055/a-1976-910
28. Wang, C, Reeder, SB, and Hernando, D. Relaxivity-iron calibration in hepatic iron overload: reproducibility and extension of a Monte Carlo model. NMR Biomed. (2021) 34:e4604. doi: 10.1002/nbm.4604
29. Nashwan, AJ, Yassin, MA, Abd-Alrazaq, A, Shuweihdi, F, Othman, M, Abdul Rahim, HF, et al. Hepatic and cardiac iron overload quantified by magnetic resonance imaging in patients on hemodialysis: a systematic review and meta-analysis. Hemodial Int. (2023) 27:3–11. doi: 10.1111/hdi.13054
30. Wood, JC, Enriquez, C, Ghugre, N, Tyzka, JM, Carson, S, Nelson, MD, et al. MRI R2 and R2* mapping accurately estimates hepatic iron concentration in transfusion-dependent thalassemia and sickle cell disease patients. Blood. (2005) 106:1460–5. doi: 10.1182/blood-2004-10-3982
31. Kirk, P, He, T, Anderson, LJ, Roughton, M, Tanner, MA, Lam, WWM, et al. International reproducibility of single breathhold T2* MR for cardiac and liver iron assessment among five thalassemia centers. J Magn Reson Imaging. (2010) 32:315–9. doi: 10.1002/jmri.22245
32. Alexopoulou, E, Stripeli, F, Baras, P, Seimenis, I, Kattamis, A, Ladis, V, et al. R2 relaxometry with MRI for the quantification of tissue iron overload in beta-thalassemic patients. J Magn Reson Imaging. (2006) 23:163–70. doi: 10.1002/jmri.20489
33. Hankins, JS, McCarville, MB, Loeffler, RB, Smeltzer, MP, Onciu, M, Hoffer, FA, et al. R2* magnetic resonance imaging of the liver in patients with iron overload. Blood. (2009) 113:4853–5. doi: 10.1182/blood-2008-12-191643
34. Christoforidis, A, Perifanis, V, Spanos, G, Vlachaki, E, Economou, M, Tsatra, I, et al. MRI assessment of liver iron content in thalassamic patients with three different protocols: comparisons and correlations. Eur J Haematol. (2009) 82:388–92. doi: 10.1111/j.1600-0609.2009.01223.x
35. Garbowski, MW, Carpenter, JP, Smith, G, Roughton, M, Alam, MH, He, T, et al. Biopsy-based calibration of T2* magnetic resonance for estimation of liver iron concentration and comparison with R2 Ferriscan. J Cardiovasc Magn Reson. (2014) 16:40. doi: 10.1186/1532-429X-16-40
36. Yucheng, L, and Rong, T. Research progress of Dixon water-fat separation sequence R2* value in evaluating liver iron concentration anddifferentiating liver nodules. (2023) Int J Med Radiol 46:1–5. doi: 10.19300/j.2023.Z20200
37. Dandi, W, Yonghua, X, Qing, Gan, Qifang, C, and Ke, J. Quantitative evaluation of liver fat content in obese children via magnetic resonance multi-Echo Dixon technique. Chinese J Med Imaging (2022), 30:368–372. doi: 10.3969/j.issn.1005-5185.2022.04.013, PMC2686136
38. Ouederni, M, Ben Khaled, M, Mellouli, F, Ben Fraj, E, Dhouib, N, Yakoub, IB, et al. Myocardial and liver iron overload, assessed using T2* magnetic resonance imaging with an excel spreadsheet for post processing in Tunisian thalassemia major patients. Ann Hematol. (2017) 96:133–9. doi: 10.1007/s00277-016-2841-5
39. Mobini, N, Malekzadeh, M, Haghighatkhah, H, and Saligheh, RH. A hybrid (iron-fat-water) phantom for liver iron overload quantification in the presence of contaminating fat using magnetic resonance imaging. MAGMA. (2020) 33:385–92. doi: 10.1007/s10334-019-00795-7
40. Hong, CW, Fazeli Dehkordy, S, Hooker, JC, Hamilton, G, and Sirlin, CB. Fat quantification in the abdomen. Top Magn Reson Imaging. (2017) 26:221–7. doi: 10.1097/RMR.0000000000000141
41. Kang, BK, Yu, ES, Lee, SS, Lee, Y, Kim, N, Sirlin, CB, et al. Hepatic fat quantification: a prospective comparison of magnetic resonance spectroscopy and analysis methods for chemical-shift gradient echo magnetic resonance imaging with histologic assessment as the reference standard. Investig Radiol. (2012) 47:368–75. doi: 10.1097/RLI.0b013e31824baff3
42. Zhenping, F, Hongxia, S, Wenjin, Z, Xuemin, S, Shaoping, C, Yingjie, J, et al. Meta-analysis on clinical characteristics of Chinese patients with haemochromatosis in 1991-2010. Clin Focus. (2011) 26:2132–6. CNKI:SUN:LCFC.0.2011-24-008
43. Ziyi, Z, Peiguo, L, Liang, Z, and Liang, D. Principle analysis and simulation for measurement of liver Iron oVerload based on magnetic induction method. Chinese J Med Phys. (2013) 30:3927–32. doi: 10.3969/j.issn.1005-202X.2013.01.023
44. Khorasani, A, and Tavakoli, MB. Multiparametric study for glioma grading with FLAIR, ADC map, eADC map, T1 map, and SWI images. Magn Reson Imaging. (2023) 96:93–101. doi: 10.1016/j.mri.2022.12.004
45. Obmann, VC, Marx, C, Berzigotti, A, Mertineit, N, Hrycyk, J, Gräni, C, et al. Liver MRI susceptibility- weighted imaging (SWI) compared to T2* mapping in the presence of steatosis and fibrosis. Eur J Radiol. (2019) 118:66–74. doi: 10.1016/j.ejrad.2019.07.001
46. Hou, ZB, Zhao, F, Zhang, B, and Zhang, CZ. Study on clinical application of susceptibility weighted imaging ombined with diffusion weighted imaging in patients with liver cirrhosis complicated with small hepatocellular carcinoma. Pak J Med Sci. (2021) 37:800–4. doi: 10.12669/pjms.37.3.3822
47. Liu, S, Buch, S, and Chen, Y. Susceptibility-weighted imaging: current status and future directions. NMR Biomed. (2017) 30 doi: 10.1002/nbm.3552
Keywords: magnetic resonance imaging, T2*, quantifying, liver, load of iron
Citation: Feng Q, Yi J, Li T, Liang B, Xu F and Peng P (2024) Narrative review of magnetic resonance imaging in quantifying liver iron load. Front. Med. 11:1321513. doi: 10.3389/fmed.2024.1321513
Edited by:
Giorgio Treglia, Ente Ospedaliero Cantonale (EOC), SwitzerlandReviewed by:
Lorenzo Cereser, University of Udine, ItalyGiulia Besutti, S. Maria Nuova Hospital, Italy
Copyright © 2024 Feng, Yi, Li, Liang, Xu and Peng. This is an open-access article distributed under the terms of the Creative Commons Attribution License (CC BY). The use, distribution or reproduction in other forums is permitted, provided the original author(s) and the copyright owner(s) are credited and that the original publication in this journal is cited, in accordance with accepted academic practice. No use, distribution or reproduction is permitted which does not comply with these terms.
*Correspondence: Fengming Xu, 501780124@qq.com; Peng Peng, doublep@126.com
†These authors share first authorship