Development and validation of a predicted nomogram for mortality of COVID-19: a multicenter retrospective cohort study of 4,711 cases in multiethnic
 Yuchen Shi
 Ze Zheng1
 - 1Center for Coronary Artery Disease (CCAD), Beijing Anzhen Hospital, Capital Medical University, and Beijing Institute of Heart, Lung and Blood Vessel Diseases, Beijing, China
- 2Zhengzhou Central Hospital Affiliated to Zhengzhou University, Zhengzhou, Henan Province, China
Background: Coronavirus disease 2019 (COVID-19) is an infectious disease spreading rapidly worldwide. As it quickly spreads and can cause severe disease, early detection and treatment may reduce mortality. Therefore, the study aims to construct a risk model and a nomogram for predicting the mortality of COVID-19.
Methods: The original data of this study were from the article “Neurologic Syndromes Predict Higher In-Hospital Mortality in COVID-19.” The database contained 4,711 multiethnic patients. In this secondary analysis, a statistical difference test was conducted for clinical demographics, clinical characteristics, and laboratory indexes. The least absolute shrinkage and selection operator (LASSO) and multivariate logistic regression analysis were applied to determine the independent predictors for the mortality of COVID-19. A nomogram was conducted and validated according to the independent predictors. The area under the curve (AUC), the calibration curve, and the decision curve analysis (DCA) were carried out to evaluate the nomogram.
Results: The mortality of COVID-19 is 24.4%. LASSO and multivariate logistic regression analysis suggested that risk factors for age, PCT, glucose, D-dimer, CRP, troponin, BUN, LOS, MAP, AST, temperature, O2Sats, platelets, Asian, and stroke were independent predictors of CTO. Using these independent predictors, a nomogram was constructed with good discrimination (0.860 in the C index) and internal validation (0.8479 in the C index), respectively. The calibration curves and the DCA showed a high degree of reliability and precision for this clinical prediction model.
Conclusion: An early warning model based on accessible variates from routine clinical tests to predict the mortality of COVID-19 were conducted. This nomogram can be conveniently used to facilitate identifying patients who might develop severe disease at an early stage of COVID-19. Further studies are warranted to validate the prognostic ability of the nomogram.
1. Introduction
Coronavirus disease 2019 (COVID-19), an infectious disease caused by the novel binuclear virus—severe acute respiratory syndrome coronavirus 2 (SARS-CoV-2), has been broken out and rapidly spread worldwide (1). The number of affected countries and deaths has risen dramatically, which is providing significant challenges and placing an unprecedented economic burden on global public health systems and clinical management (2).
COVID-19 can affect multisystem organs, and the main clinical presentation is pneumonia (3). Although most patients with COVID-19 have mild to moderate illness, with common respiratory symptoms and a good prognosis, several severe and critical patients will get worse rapidly with acute respiratory distress syndrome (ARDS), septic shock, multiple organ dysfunction, and even death, especially in those of the elderly with comorbidities such as congestive heart failure (CHF), chronic obstructive pulmonary disease (COPD), central nervous system (CNS) disease, chronic renal failure, and cancer (4). Furthermore, as previously described, deaths were more common in older patients with abnormal laboratory indexes such as inflammatory factors and hepatorenal function after COVID-19 affected (5). Therefore, it is crucial and urgent to rapidly identify prognostic indicators of fatal outcomes through efficient predictive methods to aid in the early implementation of preventive measures and interventions, thereby preventing disease progression and mortality in critically ill patients. The accurate and immediate decision-making of treatment strategies may reduce the mortality risk.
Considering radiological abnormalities were not observed during initial presentation in approximately 20% of cases, clinical characteristics and routine clinical laboratory tests may provide such prognostic factors as quickly as possible (6). The nomogram is a two-dimensional graphic mathematical representation of a scoring model made up of multiple scale axes designed for a user-friendly interface, highly accurate to calculate the probability of an outcome (7). A nomogram including variables like routine laboratory tests might be more effective and affordable for predicting the risk of mortality (8). Therefore, the purpose of this study was to describe the clinical features of COVID-19 and establish a nomogram based on a large number of COVID-19 patients incorporating common clinical demographics, characteristics, and laboratory parameters, to early warn the risk of fatal outcomes in patients with COVID-19.
2. Methods
2.1. Data source
The original database of this research was from the Neurologic Syndromes Predict Higher In-Hospital Mortality in COVID-19 (9). Since Eskandar et al. had relinquished the ownership of the original database to Neurology,1 we can use this database to conduct secondary analysis according to different scientific hypotheses. The original research was granted exempt status. The requirement for obtaining informed consent was waived by the Ethics Committee for Clinical Research of the Albert Einstein College of Medicine, Montefiore Medical Center (9).
The original database collected consecutive hospitalized patients with moderate or severe COVID-19 from four hospitals in the Montefiore Health System between March 1st and April 16th, 2020. The database contained multiethnic patients, including 1743 Black, 466 White, 121 Asian, and 1753 Latino. The diagnosis of COVID-19 was based on World Health Organization interim guidance and confirmed by real-time reverse transcriptase PCR positive assay testing for SARS-CoV-2 RNA (10).
2.2. Study population and covariates
A total of 4,711 patients with confirmed COVID-19 were consecutively collected between March 1st and April 16th, 2020. We divided the whole participants into a derivation or validation cohorts by 7:3, randomly. The derivation cohort was formed of 3,534 subjects, including 2,661 surviving patients and 873 deceased patients. The validation cohort was formed of 1,177 subjects, including 902 surviving patients and 275 deceased patients.
Information on clinical demographics, characteristics, laboratory indexes, comorbidities, and mortality was collected by a health care surveillance software package (Clinical Looking Glass; Streamline Health, Atlanta, GA) and a review of the primary medical records (11).
2.3. Regression analysis
Least absolute shrinkage and selection operator (LASSO) regression analysis was applied to identify factors related to the mortality of patients with COVID-19. The Lambda values were chosen after a 10-fold cross-validation. Subsequently, a multivariate logistic regression analysis was established with the selection of LASSO regression analysis, in which p-value levels for inclusion criteria were conducted as 0.05.
2.4. Model development
Predictive models related to the mortality of COVID-19 were conducted in the primary cohort according to the variables selected by multivariate logistic regression analysis. The final model was determined by the Akaike information criterion (AIC), the receiver operating characteristic (ROC) curves, and the Harrell concordance index (C-index). The nomogram was derived from the final model.
2.5. Performance of the nomogram
The model was internally validated by data from the validation cohort. Discriminatory performance was measured by the C index. Calibration was tested via a calibration plot with 1,000 bootstraps resamples, which described the degree of fit between actual and nomogram-predicted mortality of COVID-19.
2.6. Clinical usage
Regarding its clinical usefulness, the decision curve analysis (DCA) was undertaken to assess the clinical benefit of the nomogram. Detailed descriptions of DCA have been previously reported (12). The results were considered statistically significant at p-value <0.05.
2.7. Statistical analysis
Continuous variables were expressed as medians (mean ± standard deviation), and categorical variables were expressed as numbers (percentage). Differences in baseline characteristics between groups for continuous variables were assessed by the Mann–Whitney U test. The Chi-square test or Fisher’s exact test was used for categorical variables according to their sample size.
A two-sided p < 0.05 was considered statistically significant. IBM SPSS v23.0 (SPSS Inc., Chicago, IL, United States) was applied for statistical analyses in the research. The nomogram was conducted and calibration curve analysis were carried out by the R software v4.2.0 (http://www.R-project.org, R Foundation for Statistical Computing, Vienna, Austria).
3. Results
3.1. Population clinical characteristics of the derivation and validation set
Table 1 summarized the clinical characteristics of the derivation set (n = 3,534) and the validation set (n = 1,177). The clinical demographics including mortality, race, comorbidities, and laboratory indexes did not have significant differences between both cohorts (all p > 0.05).

Table 1. Baseline clinical characteristics of the derivation and validation cohort.
3.2. Comparison of the baseline characteristics of the derivation set between the survived patients and deceased patients
The baseline clinical characteristics of the derivation set were shown in Table 2. Compared with surviving patients, patients deceased were more likely to be white race and older, with comorbidities including CHF, COPD, renal disease, CNS disease, and stroke (all p < 0.05). Meanwhile, they were more frequently encountered with decreased median arterial blood pressure (MAP), oxygen saturation (O2Sats), and longer length of stay (LOS) (all p < 0.01). In the laboratory parameters between the two groups, the deceased patients showed significantly higher white blood cells (WBC), ferritin, glucose, sodium, procalcitonin (PCT), C-reactive protein (CRP), D-dimer, aspartate aminotransferase (AST), alanine aminotransferase (ALT), troponin, international normalized ratio (INR), blood urea nitrogen (BUN), and creatinine, but lower platelets (all p < 0.01).
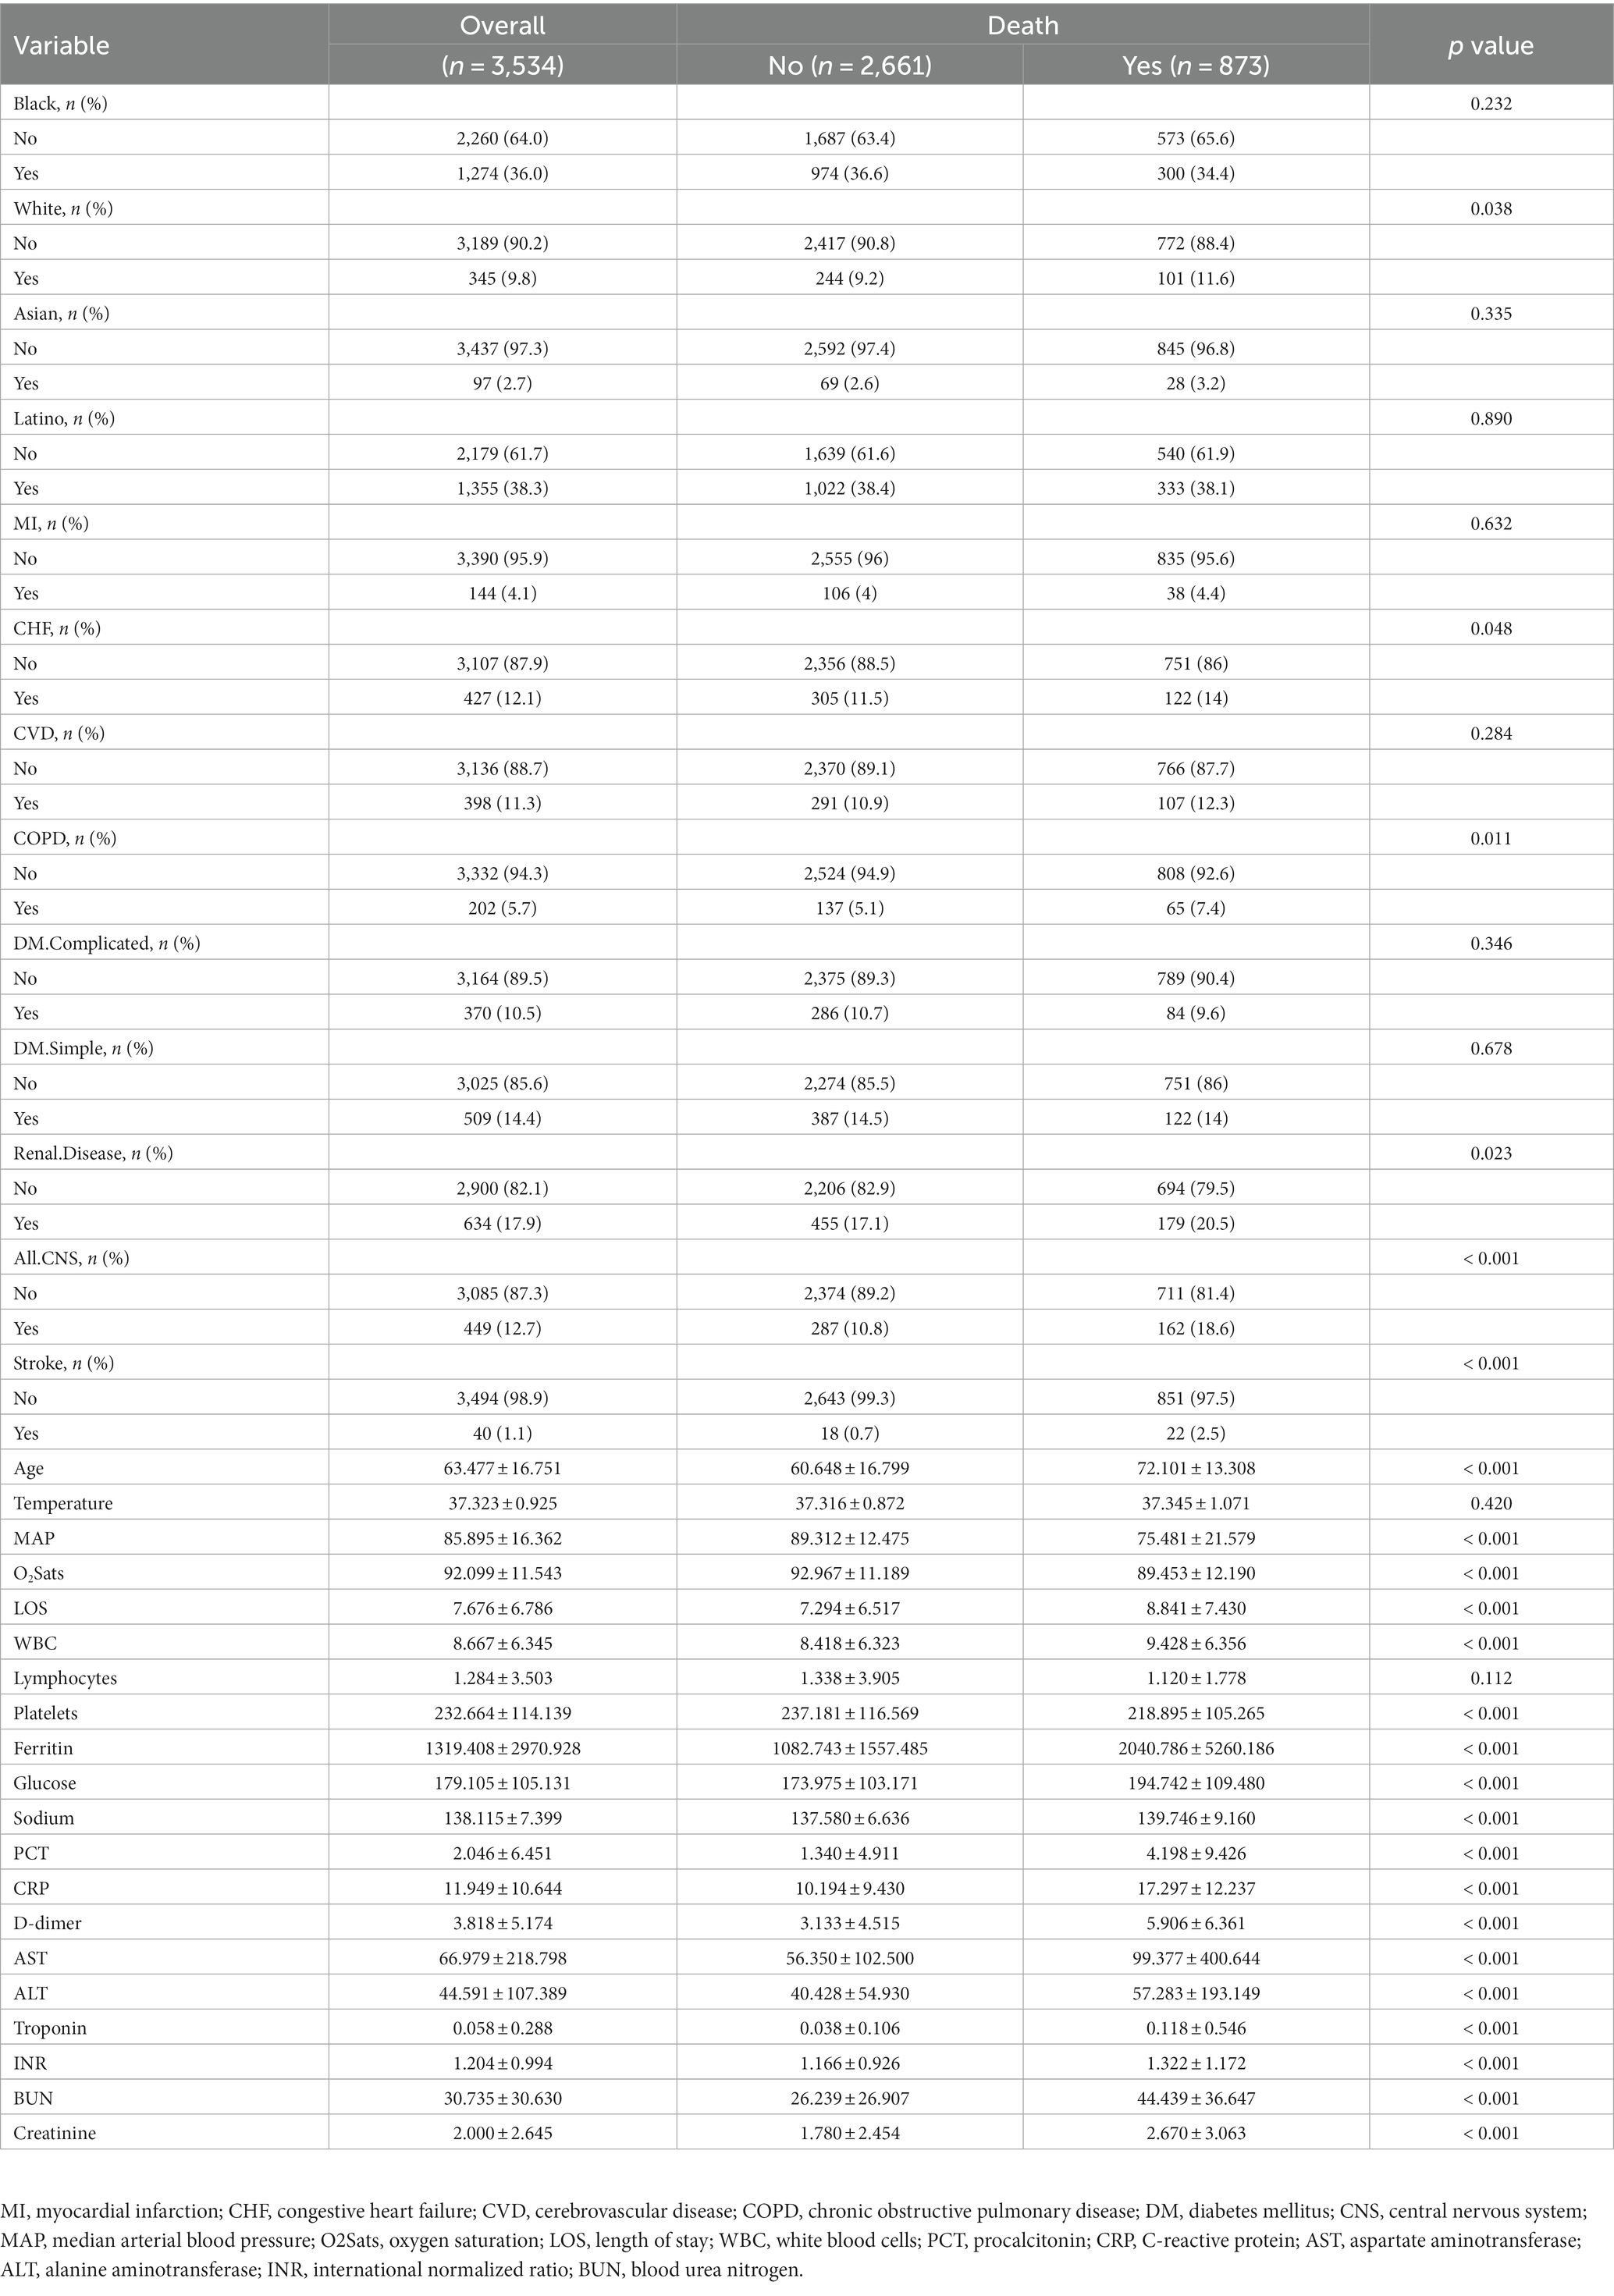
Table 2. Clinical characteristics of the derivation cohort.
3.3. LASSO regression analysis
A total of 33 related variables, including clinical demographics, laboratory indexes, and comorbidities, were initially put into the LASSO regression algorithm by 10-fold cross-validation to identify the indictors for mortality of COVID-19. As shown in Figure 1A, 16 potential indictors with non-zero coefficients were chosen: age, PCT, glucose, D-dimer, CRP, troponin, BUN, LOS, MAP, AST, temperature, O2Sats, platelets, Asian, CNS disease, and stroke. Figure 1B depicted the changes in the LASSO coefficients.
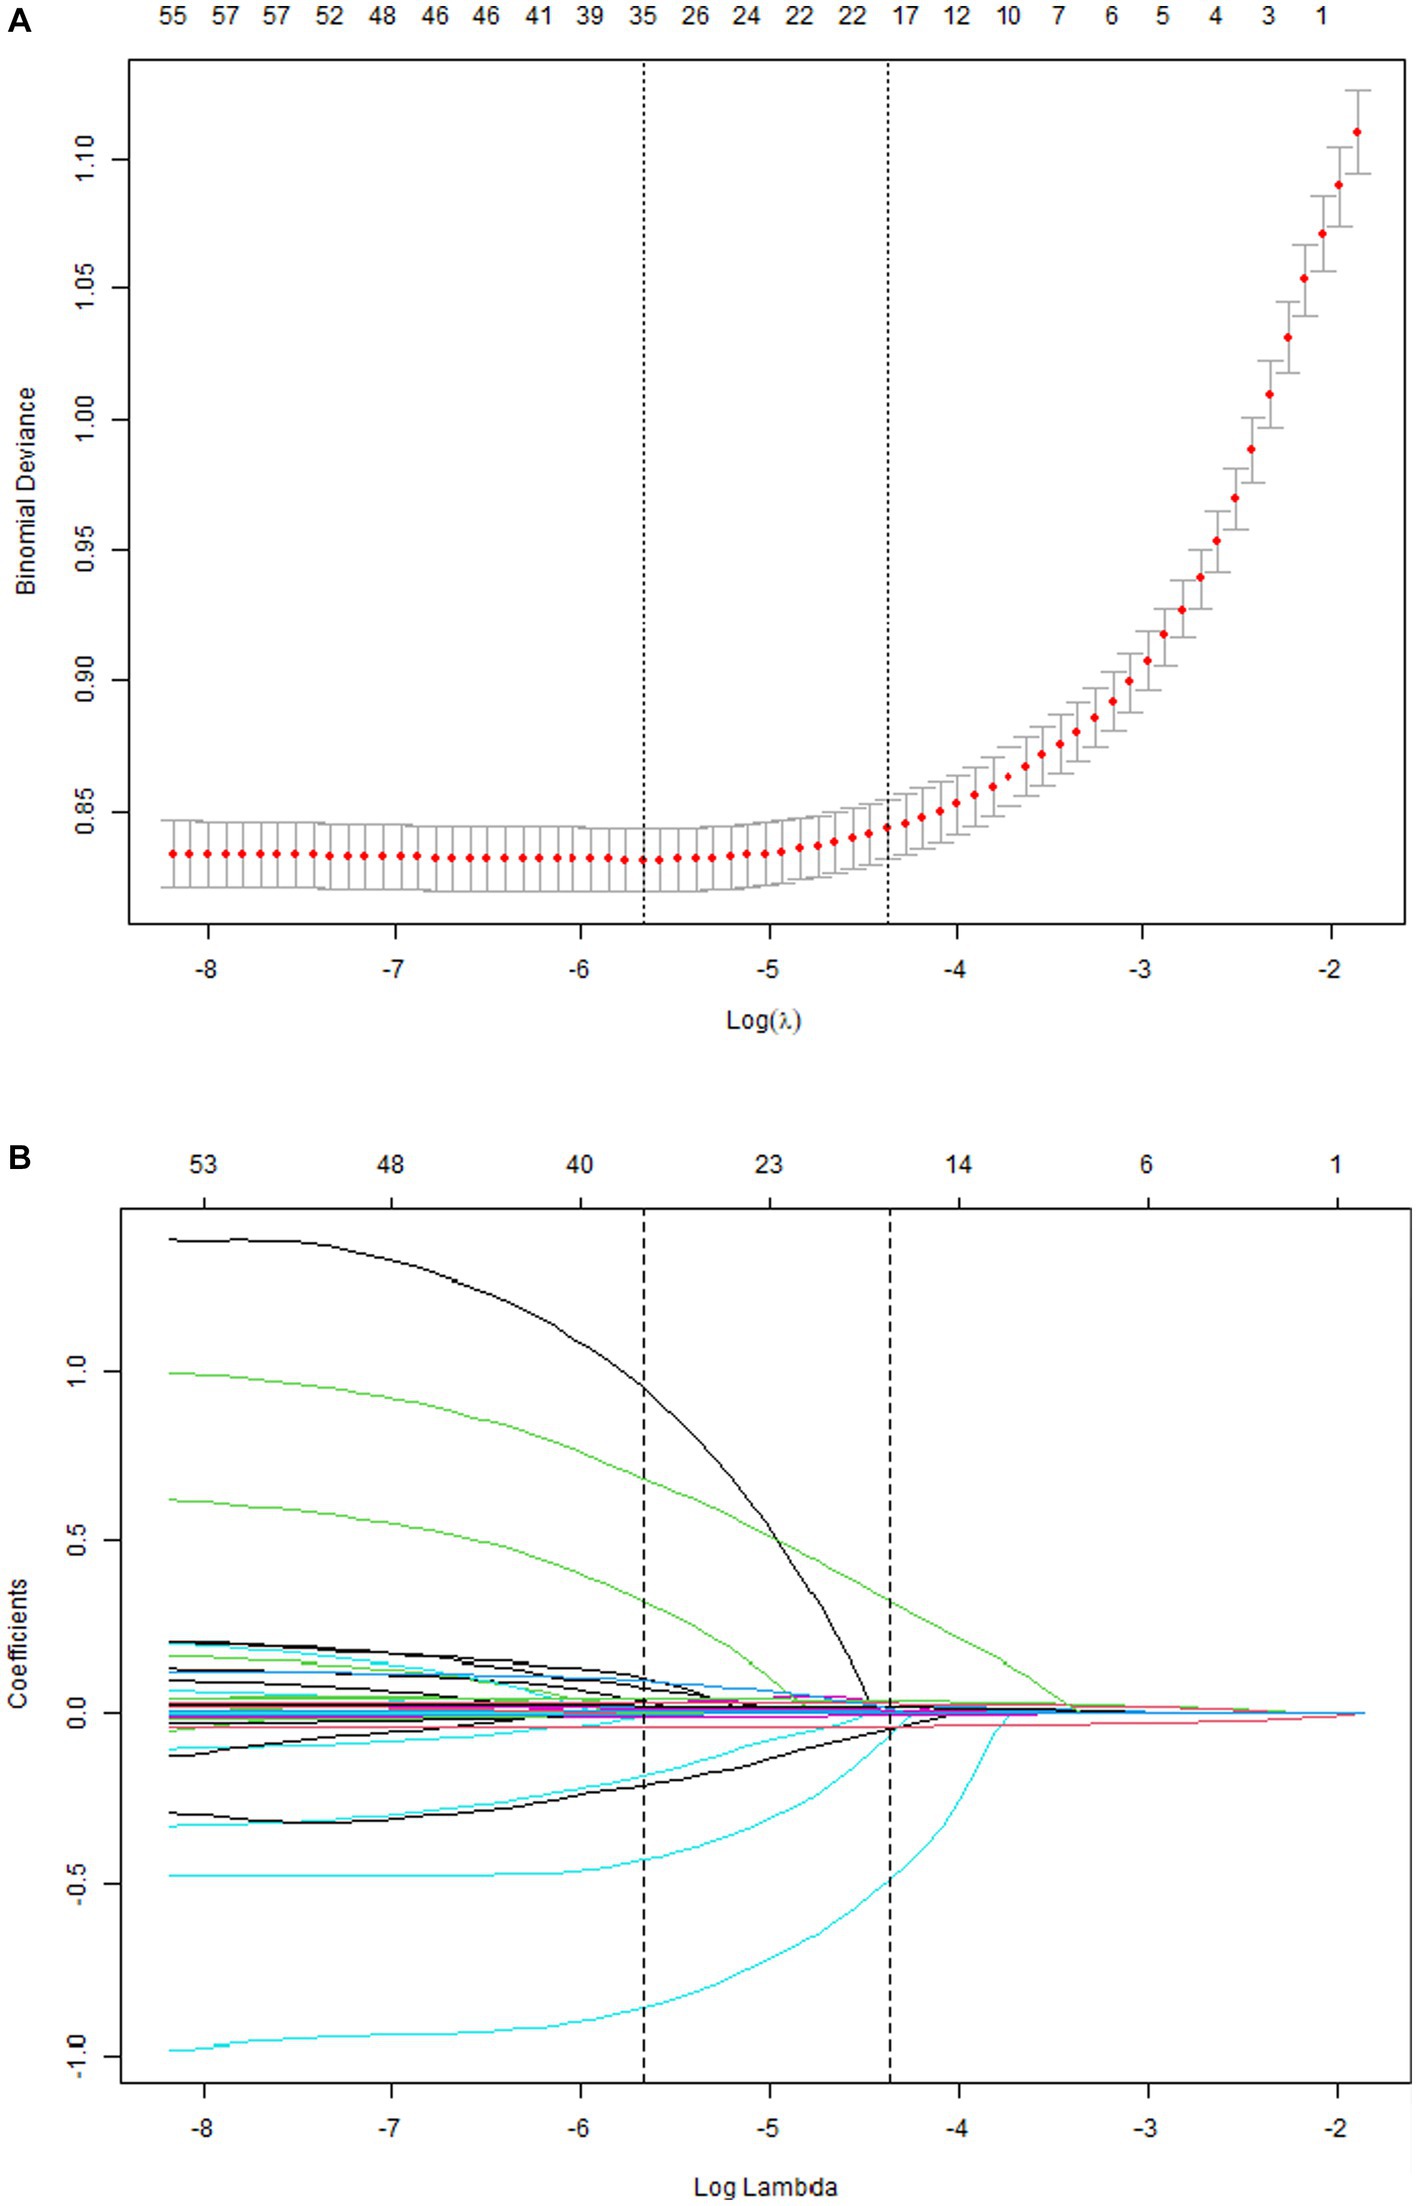
Figure 1. Risk factors selecting using LASSO model. 1A: Optimal parameter (lambda) selection for the LASSO model was cross-validated 6 the minimum criterion. Partial likelihood deviation curves (binomial deviation) versus log (lambda). The dotted vertical lines are drawn at the best values of 1SE (1-SE criterion) using the minimum criterion and the maximum criterion. 1B: LASSO coefficient profiles for 33 characteristics. The coefficient profiles were produced from logarithmic sequences (lambda). The vertical lines are drawn on the value selected using fivefold cross-validation, where the best lambda resulted in non-zero coefficients for five features.
3.4. Multivariate logistic regression analysis
As Figure 2 showed, 16 predictors chosen by the LASSO regression analysis were selected via multivariate logistic regression analysis to determine the independent parameters that predicted the mortality of COVID-19. 15 parameters were included in the final model, and those were age, PCT, glucose, D-dimer, CRP, troponin, BUN, LOS, MAP, AST, temperature, O2Sats, platelets, Asian, and stroke.
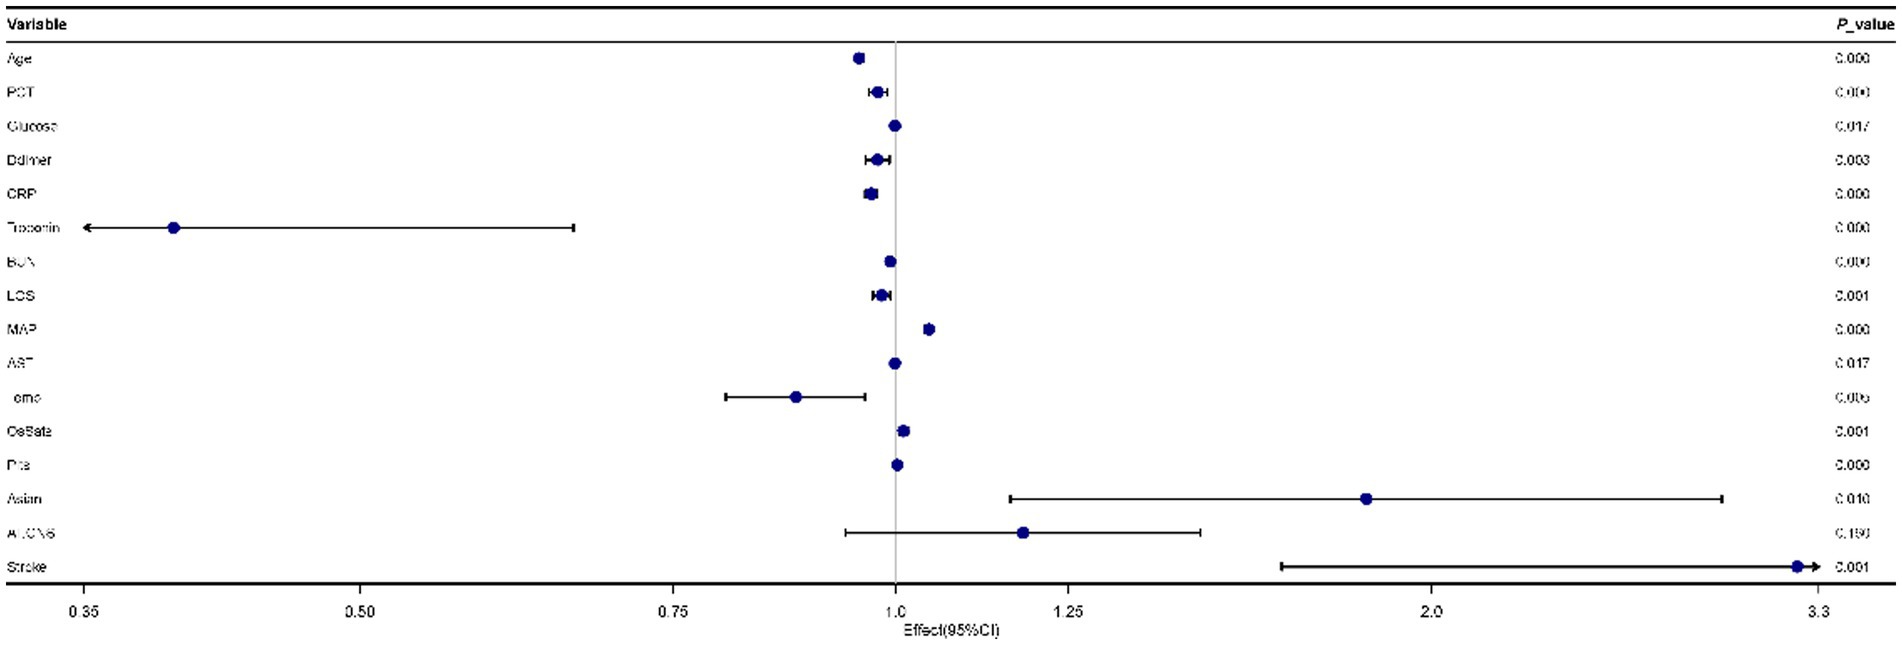
Figure 2. Forest plot for multivariate logistic regression analyses of predictors for mortality in patients with coronavirus disease 2019 (COVID-19).
3.5. Construction of a novel nomogram scoring system
Based on the results of the multivariate logistic regression analysis, the 15 variables above were included as predictors to establish a nomogram (Figure 3). Each predicters corresponded to a score, and the total score was mapped to the prediction axis of the diagnosis, which could reflect the risk factors for mortality of COVID-19. As an example, to better explain the nomogram, if the patient was 70 years old (30 points), PCT of 10 ng/mL (2 points), glucose of 300 mg/dL (3 points), D-dimer of 6 mg/L (2 points), CRP of 20 mg/L (7 points), troponin of 0.2 ng/mL (2 points), BUN of 50 mg/dL (4 points), LOS of 10 days (2 points), MAP of 70 mm Hg (32 points), AST of 1,000 U/L (7 points), temperature of 38°C (14 points), O2Sats of 90% (1 point), platelets of 300 k/mm3 (19 points), Asian of yes (7 points), and stroke of yes (14 points), the total points was 144 and the probability of death was estimated to be more than 90%.
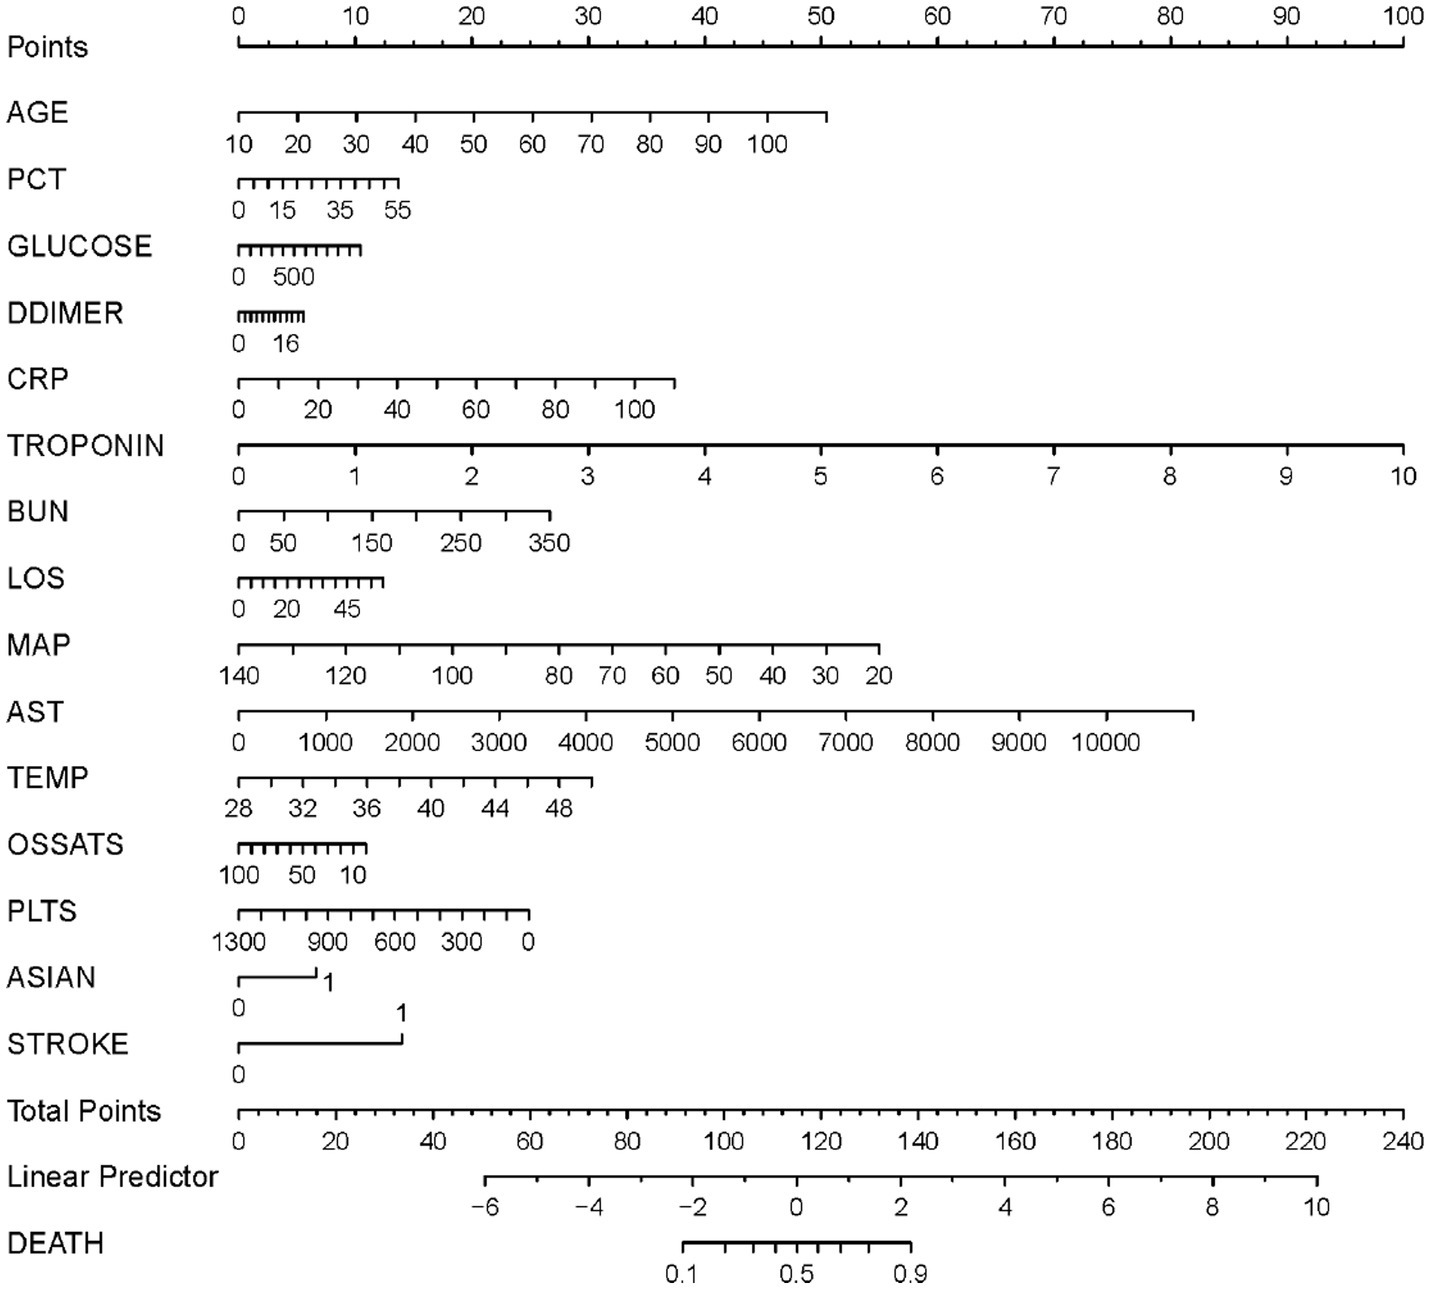
Figure 3. A nomogram prediction model for the probability of mortality in patients with coronavirus disease 2019 (COVID-19). PCT, procalcitonin; CRP, C-reactive protein; BUN, Blood urea nitrogen; LOS, length of stay; MAP, median arterial blood pressure; AST, aspartate aminotransferase; Temp, temperature; O2Sats, oxygen saturation; Plts, platelets.
3.6. Evaluation and validation of the nomogram
1,177 patients constituted the validation cohort. The calibration curves were drawn to assess the model’s calibration in the derivation (Figure 4A) and validation cohort (Figure 4B). An analysis of the ROC curve was conducted to measure the discrimination of the model in the derivation and validation cohort. And the areas under the curves (AUC) were 0.860 and 0.847, respectively (Figure 5). In addition, the DCA curves showed that the novel nomogram also had a higher clinical net (Figure 6).
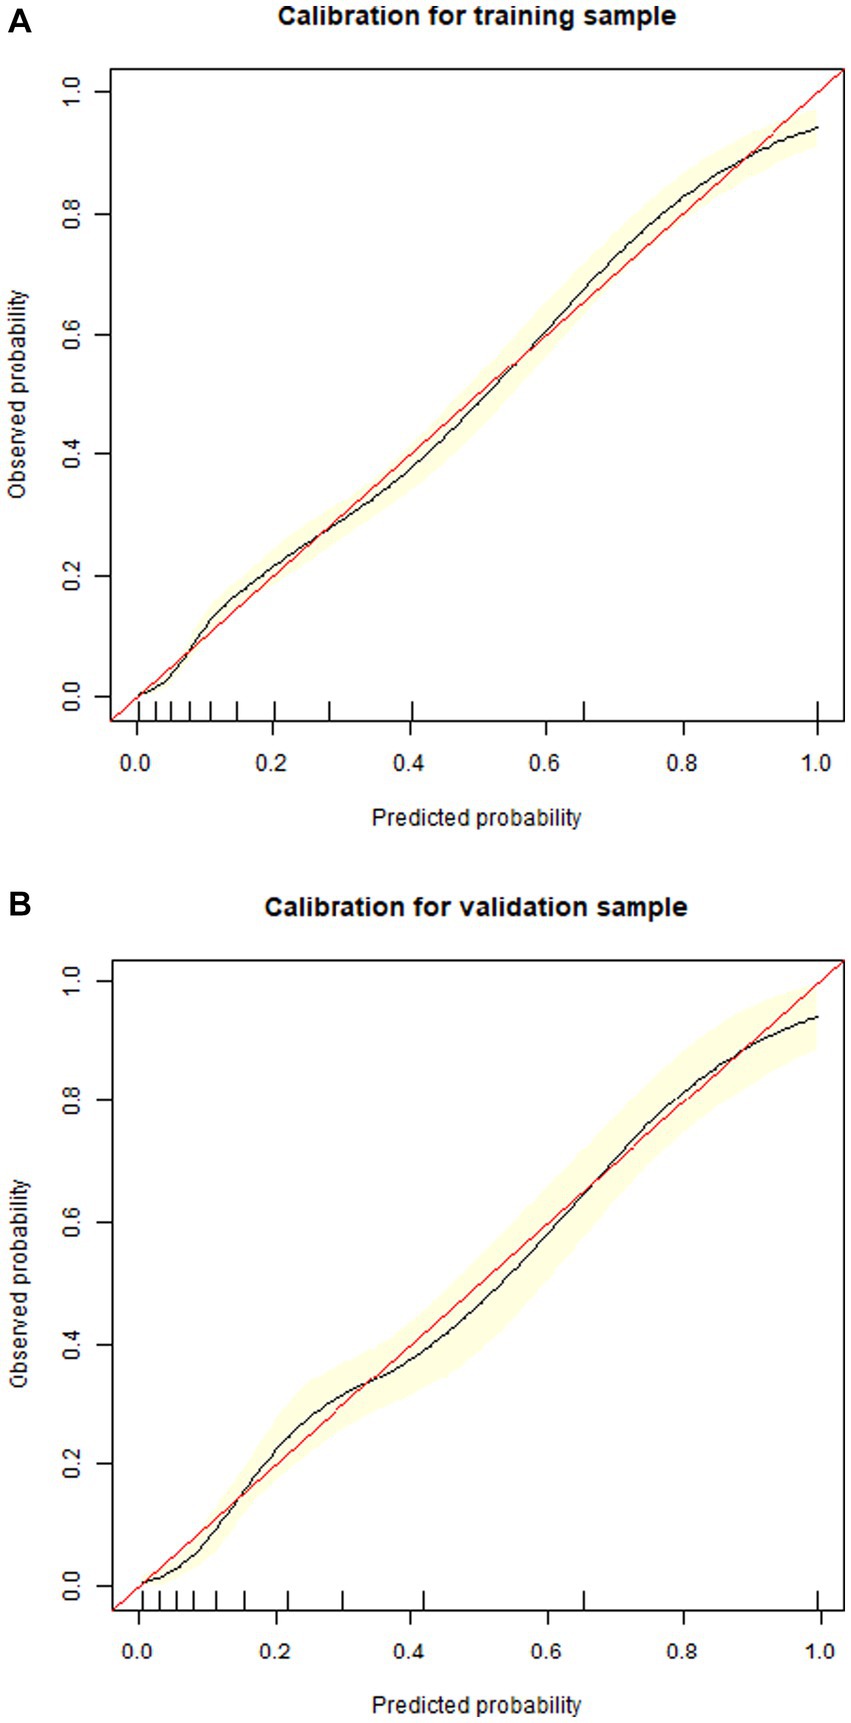
Figure 4. Calibration curves of the nomogram in the derivation cohort (A) and validation cohort (B).
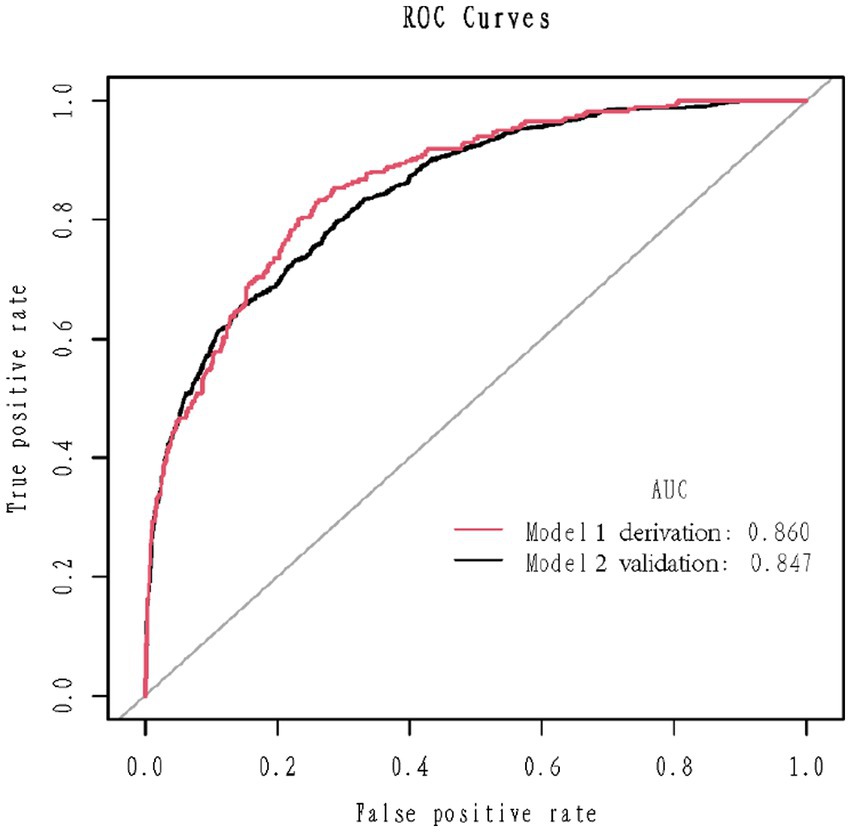
Figure 5. Receiver operating characteristics curve in the derivation cohort (red) and validation (blank) cohort for the nomogram.
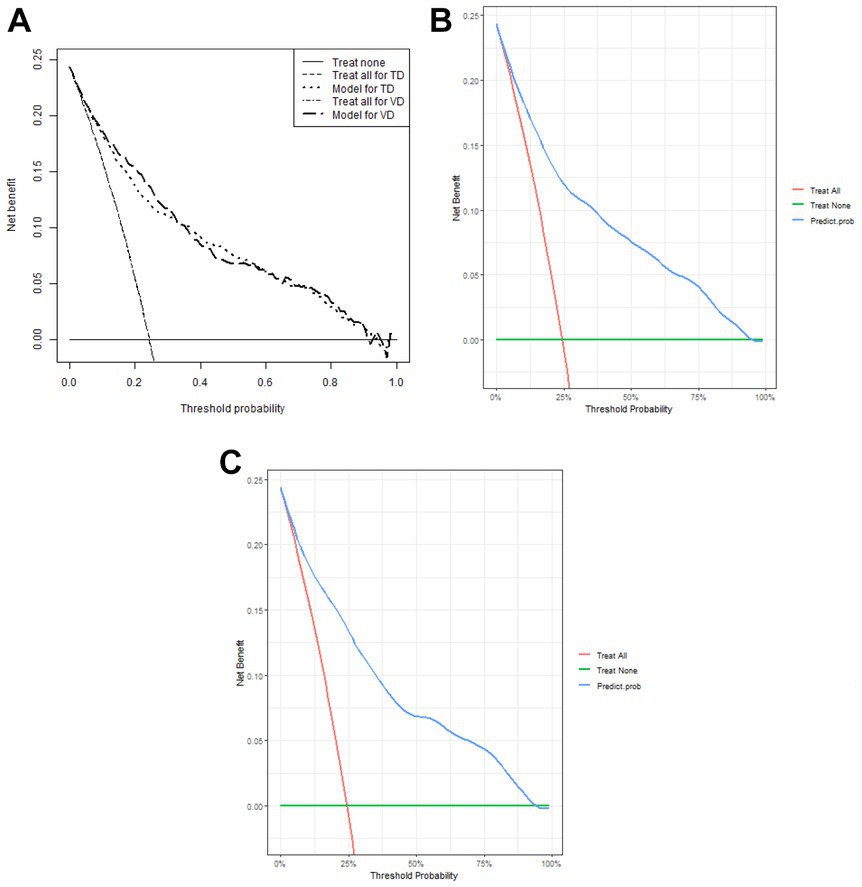
Figure 6. Decision curve analysis of the nomogram (A) and in the derivation cohort (B) and the validation cohort (C), respectively.
4. Discussion
In the current study, by employing a large, multicenter, and well-described population of 4,711 patient cohort, we used LASSO regression and multivariate logistic regression analysis to develop and validate a prediction nomogram. The nomogram was validated by internal 1,000 bootstrap resampling, as well as an internal validation cohort, maintaining an adequate calibration and discrimination capacity, which may enable physicians to predict the mortality of COVID-19 patients early and correctly for taking proactive measures accordingly.
In the research, clinical demographics, characteristics, and laboratory tests were collected and analyzed to investigate the risk of fatal outcomes in COVID-19 patients. Compared with other diseases, COVID-19 progresses more severely and faster, which may not be identified promptly (13). The early symptoms of COVID-19 are insidious and flexible, which creates more challenges to early detection (14). Especially during this time of the severe COVID-19 epidemic, many non-respiratory physicians involved in this critical battle for fighting against the epidemic, a more straightforward method that does not require professional respiratory doctors and radiologists to evaluate the infiltration of multiple lung lobes is practical (15). To make the prognostic nomogram rapid and easy to use in the busy clinical work, we only focused on variables in clinical features and laboratory tests.
The mortality of COVID-19 in our study is 24.4%, in line with the range reported in recent studies (16). In the nomogram, age was one of the most imperative predictors for mortality of COVID-19. Meanwhile, the deceased group was older compared to the surviving group. Previously, researches also reported elders in early risk evaluation for severe COVID-19 (17, 18). The association between age and severe COVID-19 might be related to angiotensin converting enzyme-2 (ACE2) (19). As previously described, ACE2 has essential salutary functions and could decrease several detrimental effects, such as inflammation, vasoconstriction, and thrombosis. However, SARS-CoV-2 can markedly downregulate ACE2 by entering into cells, which might be extra detrimental in the old population via age-related baseline ACE2 deficiency (20). In contrast, there were also several studies that suggested age was not an independent indicator for mortality or severe COVID-19 disease (21). As mentioned in those studies, the reason age was not an independent indicator might be the fact that, rather than age, age-related comorbidities affect mortality (22).
As for inflammation-related factors, including PCT, CRP, and D-dimer they were revealed to be related to the mortality of COVID-19 in our model, which was coincided with previous research (23). PCT and CRP are common inflammation factors in infected diseases (24). D-dimer is not only a fibrinogen-related factor, but also a thromboinflammatory factor (25). A high prevalence of pulmonary embolism and venous thromboembolism had been reported in patients with COVID-19 (26). Moreover, more than macrovascular thrombosis, microthrombotic events in the lungs have been observed by autopsies (27). A thromboinflammatory procedure in the pulmonary capillary vessels might be the major reason for microthrombosis in the lung capillaries, inducing COVID-19-associated coagulation disorder, which is characterized by a raising in procoagulant biomarkers, such as fibrinogen, together with a substantial rise in D-dimer (28).
For other laboratory parameters in the nomogram, blood glucose, BUN, troponin, and AST, which indicated multi-organ dysfunction, represented major predictors of mortality for COVID-19 patients (29). A Chinese meta-analysis demonstrated that diabetes mellitus was related to an increased risk of severity or death in COVID-19 patients, while it was still not clear to what extent diabetes mellitus independently contributed to the increased risk (30). In our model, not the diabetes condition but the glucose level contributed to the mortality of COVID-19. Therefore, controlling the glucose level is vital for neither diabetes or non-diabetes patients. In other nomogram models, high direct bilirubin level was confirmed to be an independent indicator of mortality in COVID-19 (31). Whereas, another research with a larger population revealed that rather than bilirubin, AST elevation was more closely related to COVID-19 mortality risk (32). SARS-CoV-2 mainly attacks the respiratory system. Moreover, previous research has shown evidence of damage to other organs, such as the liver (33). Liver dysfunction in COVID-19 patients might be mainly related to an organ-specific immune response (34). Also, systemic cytokine storm, hypoxemia, and medications can aggravate it (35). It was found that AST was increased in the severe COVID-19 patients (36). This result was coincided with the findings of our research, which indicated that AST was a critical biomarker for clinical outcomes. Besides, recent a study pointed out that acute kidney injury was closely related to severe infection and fatality in COVID-19 patients (37). Additionally, the combination of BUN and D-dimer could predict mortality in 305 COVID-19 patients, with 27.9% mortality (38).
It is noteworthy that, in our model, the race of Asian is a risk score for mortality of COVID-19. Even if we have not observed significant differences in mortality within our Asian population because there were only 97 patients in this database, it was included in the nomogram. Hoping larger datasets with more Asian people will improve the prediction model for our Asian.
In our research, a practical nomogram based on easily accessible variates from routine clinical work, can provide a more accurate evaluation and prediction of mortality for COVID-19 patients. As a result, clinicians can use this intuitive predictive nomogram to draw a few lines promptly to make a prompt calculation of a patient’s prognosis. If a patient with a high mortality rate could be identified properly and rapidly, he or she could be more likely to benefit from close attention in clinical care and nutritional support in nursing care, which would ultimately have a positive effect on recovery. In addition, our model could help doctors rationally allocate medical resources to reduce the mortality of COVID-19 when medical resources are scarce.
5. Limitations
Our study has several limitations. First of all, we found that the race of Asian might be an independent risk factor for the mortality of COVID-19. However, due to the Asian population in this database being too small, further research with larger Asian population are warranted to validate the finding. Second, the model verification method only used internal verification. More extensive studies and external validation should be needed to verify the nomogram.
6. Conclusion
In conclusion, we developed an early warning model based on accessible variates from routine clinical tests to predict the mortality of COVID-19. This nomogram could be conveniently used to facilitate identifying patients who might develop to severe disease at an early stage of COVID-19. Further researches are warranted to validate the prognostic ability of the nomogram.
Data availability statement
The datasets presented in this study can be found in online repositories. The names of the repository/repositories and accession number(s) can be found at: https://doi.org/10.5061/dryad.7d7wm37sz.
Ethics statement
The studies involving human participants were reviewed and approved by Ethics Committee for Clinical Research of the Albert Einstein College of Medicine, Montefiore Medical Center. The patients/participants provided their written informed consent to participate in this study.
Author contributions
YS and JL conceived the study and designed the protocol. YS and ZZ integrated the data and wrote the manuscript. YW, PW, and YL were responsible for the selection of the study, the extraction of data, and the evaluation of the quality of the study. JL critically reviewed the manuscript. All authors contributed to the article and approved the submitted version.
Funding
National Natural Science Fund of China (nos. 82200441, 81970291 and 82170344); Beijing Hospitals Authority Youth Programme (no. QML20230607); Young Elite Scientists Sponsorship Program by BAST (no. BYESS2023238); and the Major State Basic Research Development Program of China (973 Program, no. 2015CB554404) supported this work.
Acknowledgments
We would like to thank Jesse Luo for his help in polishing our paper.
Conflict of interest
The authors declare that the research was conducted in the absence of any commercial or financial relationships that could be construed as a potential conflict of interest.
Publisher’s note
All claims expressed in this article are solely those of the authors and do not necessarily represent those of their affiliated organizations, or those of the publisher, the editors and the reviewers. Any product that may be evaluated in this article, or claim that may be made by its manufacturer, is not guaranteed or endorsed by the publisher.
Footnotes
References
1. Lundstrom, K, Hromić-Jahjefendić, A, Bilajac, E, Aljabali, AAA, Baralić, K, Sabri, NA, et al. COVID-19 signalome: pathways for SARS-CoV-2 infection and impact on COVID-19 associated comorbidity. Cell Signal. (2023) 101:110495. doi: 10.1016/j.cellsig.2022.110495
2. Ekanayake, A, Rajapaksha, AU, Hewawasam, C, Anand, U, Bontempi, E, Kurwadkar, S, et al. Environmental challenges of COVID-19 pandemic: resilience and sustainability – a review. Environ Res. (2023) 216:114496. doi: 10.1016/j.envres.2022.114496
3. Tuttolomondo, D, Frizzelli, A, Aiello, M, Bertorelli, G, Majori, M, and Chetta, A. Beyond the lung involvement in COVID-19 patients. Minerva Med. (2022) 113:558–68. doi: 10.23736/S0026-4806.20.06719-1
4. Rahman, S, Montero, MTV, Rowe, K, Kirton, R, and Kunik, F Jr. Epidemiology, pathogenesis, clinical presentations, diagnosis and treatment of COVID-19: a review of current evidence. Expert Rev Clin Pharmacol. (2021) 14:601–21. doi: 10.1080/17512433.2021.1902303
5. Chen, Y, Klein, SL, Garibaldi, BT, Li, H, Wu, C, Osevala, NM, et al. Aging in COVID-19: vulnerability, immunity and intervention. Ageing Res Rev. (2021) 65:101205. doi: 10.1016/j.arr.2020.101205
6. Guan, WJ, Ni, ZY, Hu, Y, Liang, WH, Ou, CQ, He, JX, et al. Clinical characteristics of coronavirus disease 2019 in China. N Engl J Med. (2020) 382:1708–20. doi: 10.1056/NEJMoa2002032
7. Zhang, Z, and Kattan, MW. Drawing nomograms with R: applications to categorical outcome and survival data. Ann Transl Med. (2017) 5:211. doi: 10.21037/atm.2017.04.01
8. Park, SY. Nomogram: An analogue tool to deliver digital knowledge. J Thorac Cardiovasc Surg. (2018) 155:1793. doi: 10.1016/j.jtcvs.2017.12.107
9. Eskandar, EN, Altschul, DJ, de la Garza, RR, Cezayirli, P, Unda, SR, Benton, J, et al. Neurologic syndromes predict higher in-hospital mortality in COVID-19. Neurology. (2021) 96:e1527–38. doi: 10.1212/WNL.0000000000011356
10. Pascarella, G, Strumia, A, Piliego, C, Bruno, F, Del Buono, R, Costa, F, et al. COVID-19 diagnosis and management: a comprehensive review. J Intern Med. (2020) 288:192–206. doi: 10.1111/joim.13091
11. Altschul, DJ, Unda, SR, Benton, J, de la Garza, RR, Cezayirli, P, Mehler, M, et al. A novel severity score to predict inpatient mortality in COVID-19 patients. Sci Rep. (2020) 10:16726. doi: 10.1038/s41598-020-73962-9
12. Vickers, AJ, and Elkin, EB. Decision curve analysis: a novel method for evaluating prediction models. Med Decis Making. (2006) 26:565–74. doi: 10.1177/0272989X06295361
13. Singhal, T. A review of coronavirus Disease-2019 (COVID-19). Indian J Pediatr. (2020) 87:281–6. doi: 10.1007/s12098-020-03263-6
14. Wojtusiak, J, Bagais, W, Vang, J, Roess, A, and Alemi, F. Order of occurrence of COVID-19 symptoms. Qual Manag Health Care. (2023) 32:S29–s34. doi: 10.1097/QMH.0000000000000397
15. Acosta, E. Global estimates of excess deaths from COVID-19. Nature. (2023) 613:31–3. doi: 10.1038/d41586-022-04138-w
16. Padilha, DMH, Garcia, GR, Liveraro, GSS, Mendes, MCS, Takahashi, MES, Lascala, F, et al. Construction of a nomogram for predicting COVID-19 in-hospital mortality: a machine learning analysis. Informatics in medicine unlocked. (2023) 36:101138. doi: 10.1016/j.imu.2022.101138
17. Gong, J, Ou, J, Qiu, X, Jie, Y, Chen, Y, Yuan, L, et al. A tool for early prediction of severe coronavirus disease 2019 (COVID-19): a multicenter study using the risk nomogram in Wuhan and Guangdong, China. Clin Infect Dis. (2020) 71:833–40. doi: 10.1093/cid/ciaa443
18. Wu, G, Yang, P, Xie, Y, Woodruff, HC, Rao, X, Guiot, J, et al. Development of a clinical decision support system for severity risk prediction and triage of COVID-19 patients at hospital admission: an international multicentre study. Eur Respir J. (2020) 56:2001104. doi: 10.1183/13993003.01104-2020
19. Wang, K, Gheblawi, M, Nikhanj, A, Munan, M, Mac Intyre, E, O'Neil, C, et al. Dysregulation of ACE (angiotensin-converting enzyme)-2 and renin-angiotensin peptides in SARS-CoV-2 mediated mortality and end-organ injuries. Hypertension. (2022) 79:365–78. doi: 10.1161/HYPERTENSIONAHA.121.18295
20. Verdecchia, P, Cavallini, C, Spanevello, A, and Angeli, F. The pivotal link between ACE2 deficiency and SARS-CoV-2 infection. Eur J Intern Med. (2020) 76:14–20. doi: 10.1016/j.ejim.2020.04.037
21. Acar, HC, Can, G, Karaali, R, Börekçi, Ş, Balkan, İ, Gemicioğlu, B, et al. An easy-to-use nomogram for predicting in-hospital mortality risk in COVID-19: a retrospective cohort study in a university hospital. BMC Infect Dis. (2021) 21:148. doi: 10.1186/s12879-021-05845-x
22. Chen, R, Liang, W, Jiang, M, Guan, W, Zhan, C, Wang, T, et al. Risk factors of fatal outcome in hospitalized subjects with coronavirus disease 2019 from a Nationwide analysis in China. Chest. (2020) 158:97–105. doi: 10.1016/j.chest.2020.04.010
23. Huang, G, Kovalic, AJ, and Graber, CJ. Prognostic value of leukocytosis and lymphopenia for coronavirus disease severity. Emerg Infect Dis. (2020) 26:1839–41. doi: 10.3201/eid2608.201160
24. Pink, I, Raupach, D, Fuge, J, Vonberg, RP, Hoeper, MM, Welte, T, et al. C-reactive protein and procalcitonin for antimicrobial stewardship in COVID-19. Infection. (2021) 49:935–43. doi: 10.1007/s15010-021-01615-8
25. Chocron, R, Duceau, B, Gendron, N, Ezzouhairi, N, Khider, L, Trimaille, A, et al. D-dimer at hospital admission for COVID-19 are associated with in-hospital mortality, independent of venous thromboembolism: insights from a French multicenter cohort study. Arch Cardiovasc Dis. (2021) 114:381–93. doi: 10.1016/j.acvd.2021.02.003
26. Poissy, J, Goutay, J, Caplan, M, Parmentier, E, Duburcq, T, Lassalle, F, et al. Pulmonary embolism in patients with COVID-19: awareness of an increased prevalence. Circulation. (2020) 142:184–6. doi: 10.1161/CIRCULATIONAHA.120.047430
27. Tang, N, Li, D, Wang, X, and Sun, Z. Abnormal coagulation parameters are associated with poor prognosis in patients with novel coronavirus pneumonia. J Thromb Haemost. (2020) 18:844–7. doi: 10.1111/jth.14768
28. Connors, JM, and Levy, JH. COVID-19 and its implications for thrombosis and anticoagulation. Blood. (2020) 135:2033–40. doi: 10.1182/blood.2020006000
29. Chen, YM, Zheng, Y, Yu, Y, Wang, Y, Huang, Q, Qian, F, et al. Blood molecular markers associated with COVID-19 immunopathology and multi-organ damage. EMBO J. (2020) 39:e105896. doi: 10.15252/embj.2020105896
30. Guo, L, Shi, Z, Zhang, Y, and Wang, C. Do Vale Moreira NC, Zuo H, Hussain a: comorbid diabetes and the risk of disease severity or death among 8807 COVID-19 patients in China: a meta-analysis. Diabetes Res Clin Pract. (2020) 166:108346. doi: 10.1016/j.diabres.2020.108346
31. Zhang, S, Guo, M, Duan, L, Wu, F, Hu, G, Wang, Z, et al. Development and validation of a risk factor-based system to predict short-term survival in adult hospitalized patients with COVID-19: a multicenter, retrospective, cohort study. Crit Care. (2020) 24:438. doi: 10.1186/s13054-020-03123-x
32. Lei, F, Liu, YM, Zhou, F, Qin, JJ, Zhang, P, Zhu, L, et al. Longitudinal association between markers of liver injury and mortality in COVID-19 in China. Hepatology (Baltimore, Md). (2020) 72:389–98. doi: 10.1002/hep.31301
33. Cai, Q, Huang, D, Yu, H, Zhu, Z, Xia, Z, Su, Y, et al. COVID-19: abnormal liver function tests. J Hepatol. (2020) 73:566–74. doi: 10.1016/j.jhep.2020.04.006
34. Nardo, AD, Schneeweiss-Gleixner, M, Bakail, M, Dixon, ED, Lax, SF, and Trauner, M. Pathophysiological mechanisms of liver injury in COVID-19. Liver Int. (2021) 41:20–32. doi: 10.1111/liv.14730
35. Asselah, T, Durantel, D, Pasmant, E, Lau, G, and Schinazi, RF. COVID-19: discovery, diagnostics and drug development. J Hepatol. (2021) 74:168–84. doi: 10.1016/j.jhep.2020.09.031
36. Mao, R, Qiu, Y, He, JS, Tan, JY, Li, XH, Liang, J, et al. Manifestations and prognosis of gastrointestinal and liver involvement in patients with COVID-19: a systematic review and meta-analysis. Lancet Gastroenterol Hepatol. (2020) 5:667–78. doi: 10.1016/S2468-1253(20)30126-6
37. Shao, M, Li, X, Liu, F, Tian, T, Luo, J, and Yang, Y. Acute kidney injury is associated with severe infection and fatality in patients with COVID-19: a systematic review and meta-analysis of 40 studies and 24, 527 patients. Pharmacol Res. (2020) 161:105107. doi: 10.1016/j.phrs.2020.105107
Keywords: coronavirus disease 2019 (COVID-19), mortality, nomogram, prediction, LASSO
Citation: Shi Y, Zheng Z, Wang P, Wu Y, Liu Y and Liu J (2023) Development and validation of a predicted nomogram for mortality of COVID-19: a multicenter retrospective cohort study of 4,711 cases in multiethnic. Front. Med. 10:1136129. doi: 10.3389/fmed.2023.1136129
Edited by:
Dawei Yang, Fudan University, ChinaReviewed by:
Amirali Karimi, Tehran University of Medical Sciences, IranEugenia M. Bastos, Independent researcher, Sommerville, Massachusetts, United States
Copyright © 2023 Shi, Zheng, Wang, Wu, Liu and Liu. This is an open-access article distributed under the terms of the Creative Commons Attribution License (CC BY). The use, distribution or reproduction in other forums is permitted, provided the original author(s) and the copyright owner(s) are credited and that the original publication in this journal is cited, in accordance with accepted academic practice. No use, distribution or reproduction is permitted which does not comply with these terms.
*Correspondence: Jinghua Liu, liujinghua@vip.sina.com