Uric acid and metabolic syndrome: Findings from national health and nutrition examination survey
 Rodney G. Bowden
 Kathleen A. Richardson2
 - 1Department of Public Health, Baylor University, Waco, TX, United States
- 2Department of Health, Human Performance and Recreation, Baylor University, Waco, TX, United States
- 3ProtaGene US, Inc., Burlington, MA, United States
Introduction: Hyperuricemia commonly associated with Gout has been proposed as an independent risk factor for Metabolic Syndrome (MetS).
Objective: The purpose of the study was to determine if there is a relationship between hyperuricemia and MetS.
Methods: An analysis of cross-sectional data was conducted using the 2013–2018 National Health and Nutrition Examination Survey (NHANES) datasets. Sample weights were assigned by NHANES researchers to each participant allowing researchers to generalize results to all non-institutionalized United States (US) civilians. The analysis included 6,432 individuals, which were representative of 94,729,059 US citizens.
Results: Pearson’s correlations, chi-square tests, and logistic regression equations were calculated to determine the association between hyperuricemia and MetS. In an unadjusted regression analysis, individuals with hyperuricemia (above 7.0 mg/dL in males and 6.0 mg/dL in females) were 3.19 times more likely to have MetS compared to those with normal uric acid (UA) levels. When controlling for various confounding variables those with hyperuricemia were 1.89 and 1.34 times more likely to have MetS than those with normal UA levels in two additional logistic regression models.
Conclusion: In this large cross-sectional study, hyperuricemia was found to be associated with MetS. Additional analyses that controlled for various risk factors previously identified as predictive of MetS still demonstrated hyperuricemia independently associated with MetS. The results of this study suggest a need to understand the metabolic pathways of UA more clearly to further explain the contribution to MetS. Additional research should include prospective clinical trials assessing the effects of UA and the control of UA on MetS and concomitant medical outcomes.
Introduction
Cardiovascular disease (CVD) has historically been associated with developed, wealthy, and industrialized nations primarily affecting higher socioeconomic individuals. Most recently, this leading cause of death has become endemic in developing countries as well (1). Metabolic syndrome (MetS) is a clustering of risk factors that are primarily associated with chronic diseases such as CVD, type II diabetes, hypertension, stroke and contributes to over 15 million deaths a year globally (2). Additional comorbid conditions associated with MetS include dyslipidemia, increases in blood glucose, central adiposity, and insulin resistance (3, 4). MetS continues to increase globally with significant increases in the last two decades and is considered one of the most significant risk factors for CVD (3, 5). The International Diabetes Federation estimates that 25% of the global population has MetS with rates varying based on age, gender and ethnicity (6). Identifying a novel biomarker for MetS to complement existing biomarkers could help identify more at-risk people and help gain a deeper understanding of the complex pathogenesis of MetS (3).
Uric acid (UA) has been postulated as a novel biomarker for MetS and is associated with the end-stage of purine degradation. (6) Normal levels of UA provide a protective effect against free-radical oxidative damage (3). UA is formed by the liver, is excreted by kidneys with some production by the intestines (7). Hyperuricemia (above 7.0 mg/dL in men and 6.0 mg/dL in women) has been reported in previous studies (3–7) to be associated with many of the same biomarkers of MetS and diseases such as diabetes, CVD, and kidney disease. Many studies have suggested hyperuricemia is an established risk factor for MetS, (8–10) while others have not reported a relationship when comparing those with and without Diabetes Mellitus (DM) (11). Study authors have also reported increased prevalence of MetS in patients with hyperuricemia when compared to healthy populations with an increase between 30 and 41% in patients with gout (12–15). It should be noted that gout is a common inflammatory disease associated with hyperuricemia. Therefore, the purpose of the study was to compare a large cohort of participants from the National Health and Nutrition Examination Survey (NHANES) with and without MetS and their corresponding UA levels to understand if hyperuricemia is associated with MetS.
Materials and methods
The present study utilizes data from the 2013 to 2018 NHANES datasets. The data were acquired through the Center for Disease Control and Prevention (CDC) website (16). The study was determined exempt from IRB review by the sponsoring university due to the nature of the secondary data analysis (IRB ID# 1505514-1).
Study sample
The NHANES sample represents civilian, non-institutionalized United States (US) citizens. The sample design includes multi-year, stratified, clustered four-stage samples that are published in 2-year cycles on the CDC website. Underrepresented groups, such as ethnic minorities, the impoverished, children, and older adults, are oversampled to obtain more precise subgroup estimates. The present study utilizes complex survey sample weighting procedures outlined by the NHANES analytic guidelines (17–19). In the NHANES sampling procedure, sample weights are calculated and assigned to everyone in the sample. Weighting considers the known probability of selection, non-responders, and variations between the sample and the US population. Sample weighting allows researchers to produce results that would have been obtained if the entire US population were surveyed. Using this method, the statistics produced for a single individual in the NHANES sample are extrapolated to be representative of many persons in the greater US population.
In the present study we analyzed three 2-year cycles of NHANES which spanned 2013–2018. We began with 29,400 subjects in those three cohorts. Subjects on dialysis in the past 12 months (n = 59), were reported to be or tested positive for being pregnant (n = 190), individuals younger than 18 or older than 79 (n = 12,585), those not having all the data for MetS (n = 10,111) and did not have UA data (n = 23) were excluded from the study for a final sample size of 6,432. Individuals between the ages of 18 and 79 were included for analysis as the upper age limit was set because subjects’ ages in the NHANES dataset are top coded at 80 years to prevent identification. When the survey sample weighting techniques were utilized, the subsample was representative of 94,729,059 US citizens.
Demographic and variable information
The procedure documents for the NHANES questionnaires, exams, and laboratory tests are outlined on the CDC website (20). Trained reviewers administered questionnaires to subjects using a computer-assisted interview system. Socioeconomic status (SES) was considered “low” for individuals who fell at or below 100% of the poverty line. Subjects were classified as smokers if they reported tobacco use within the 5 days prior to the study or if they reported smoking more than 100 cigarettes in their entire life. Subjects were considered physically active if they engaged in 75 or more minutes of vigorous-intensity recreational physical activity, 150 min or more of moderate-intensity physical activity, or an equivalent combination of both (21, 22). International Classification of Diseases, tenth revision (ICD-10) codes were used to classify prescription drug information gathered via questionnaires for the study. “Glucose Medication” included any prescription medication used to treat hyperglycemia (codes R73, E11, E11.2, E11.2P, E11.4, and E11.P), “Cholesterol Medication” included any medication used to treat dyslipidemia (codes E78.0, E78.0P, and E78.1), “Hypertension Medication” included any medication used to treat hypertension (codes I10 and I10.P), and “Hyperuricemia Medication” included any medication used to treat hyperuricemia (codes E79.0, M10.9, M10.9P, and M1A).
Hyperuricemia was defined as a UA level >7.0 mg/dL in men or >6.0 mg/dL in women. The harmonized definition of by Alberti et al. (23) was used to categorize metabolic risk factors (24). Risk factors include: elevated waist circumference (≥102 cm in males, ≥88 cm in females, ≥90 cm in Asian males, or ≥80 cm in Asian females), elevated triglycerides (≥150 mg/dL) or prescription drug treatment for elevated triglycerides, reduced High Density Lipoprotein Cholesterol (HDL-c) (<40 mg/dL in males or <50 mg/dL in females) or prescription treatment for reduced HDL-c, elevated blood pressure (systolic ≥130 mmHg and/or diastolic ≥85 mmHg) or prescription treatment for hypertension, and elevated fasting glucose (≥100 mg/dL) or prescription treatment for hyperglycemia. MetS and “metabolically unhealthy” were defined by three or more metabolic risk factors. Renal function was calculated by the CKD-EPI equation (23).
Statistical analyses
All statistical analyses were conducted in SAS version 9.4 (SAS Institute Inc., Cary, NC, USA). Normality of variables was assessed using measures of skewness and kurtosis and by visual inspection of histograms, P-P, and Q-Q plots. Unweighted, continuous demographic variables were reported as mean () and standard deviation (SD) whereas weighted variables were reported as mean () and standard error (SE). Unweighted, categorical demographic variables were reported as frequency (n) and percentage (%) and weighted variables were reported as percentage (%) and SE. Survey sample weights were assigned to demographic variables and statistical tests using survey procedures in SAS (PROC SURVEY). Individuals meeting the inclusion criteria for the study were included in weighted analyses using a domain statement, which ensured accuracy in the number of elements in the sample and SE values. Differences in categorical variables were assessed using χ2 tests whereas simple regression was used to determine statistical differences between continuous variables. Pearson’s correlation coefficient was calculated to determine the correlation between metabolic risk factors and UA levels. Sample weighting was used in logistic regression models to determine if there is a relationship between hyperuricemia and MetS Probability values were considered significant at the α < 0.05 level. All analyses utilize survey sample weighting unless otherwise noted.
Results
Demographic information for the sample is reported in Table 1. Hyperuricemia was present in 17.66% of individuals in the study and the average UA level was 5.44 mg/dL in the overall weighted sample. Individuals with hyperuricemia had an average UA level of 7.64 mg/dL, whereas those with normal UA levels averaged 5.00 mg/dL (p < 0.0001). As demonstrated in Figure 1, metabolically healthy individuals had an average UA level of 5.15 mg/dL and hyperuricemia was present in 10.69% of the metabolically healthy individuals, whereas 27.83% of individuals with MetS had hyperuricemia (p < 0.0001) and the average UA level was 5.84 in those with MetS. Prescription medication for gout and/or hyperuricemia was reported in 1.20% of the overall sample. There were a significantly greater number of people with CKD in the hyperuricemia group. In those with normal UA, 5.54% had CKD and MetS. In those with hyperuricemia, 17.78% had CKD and MetS.
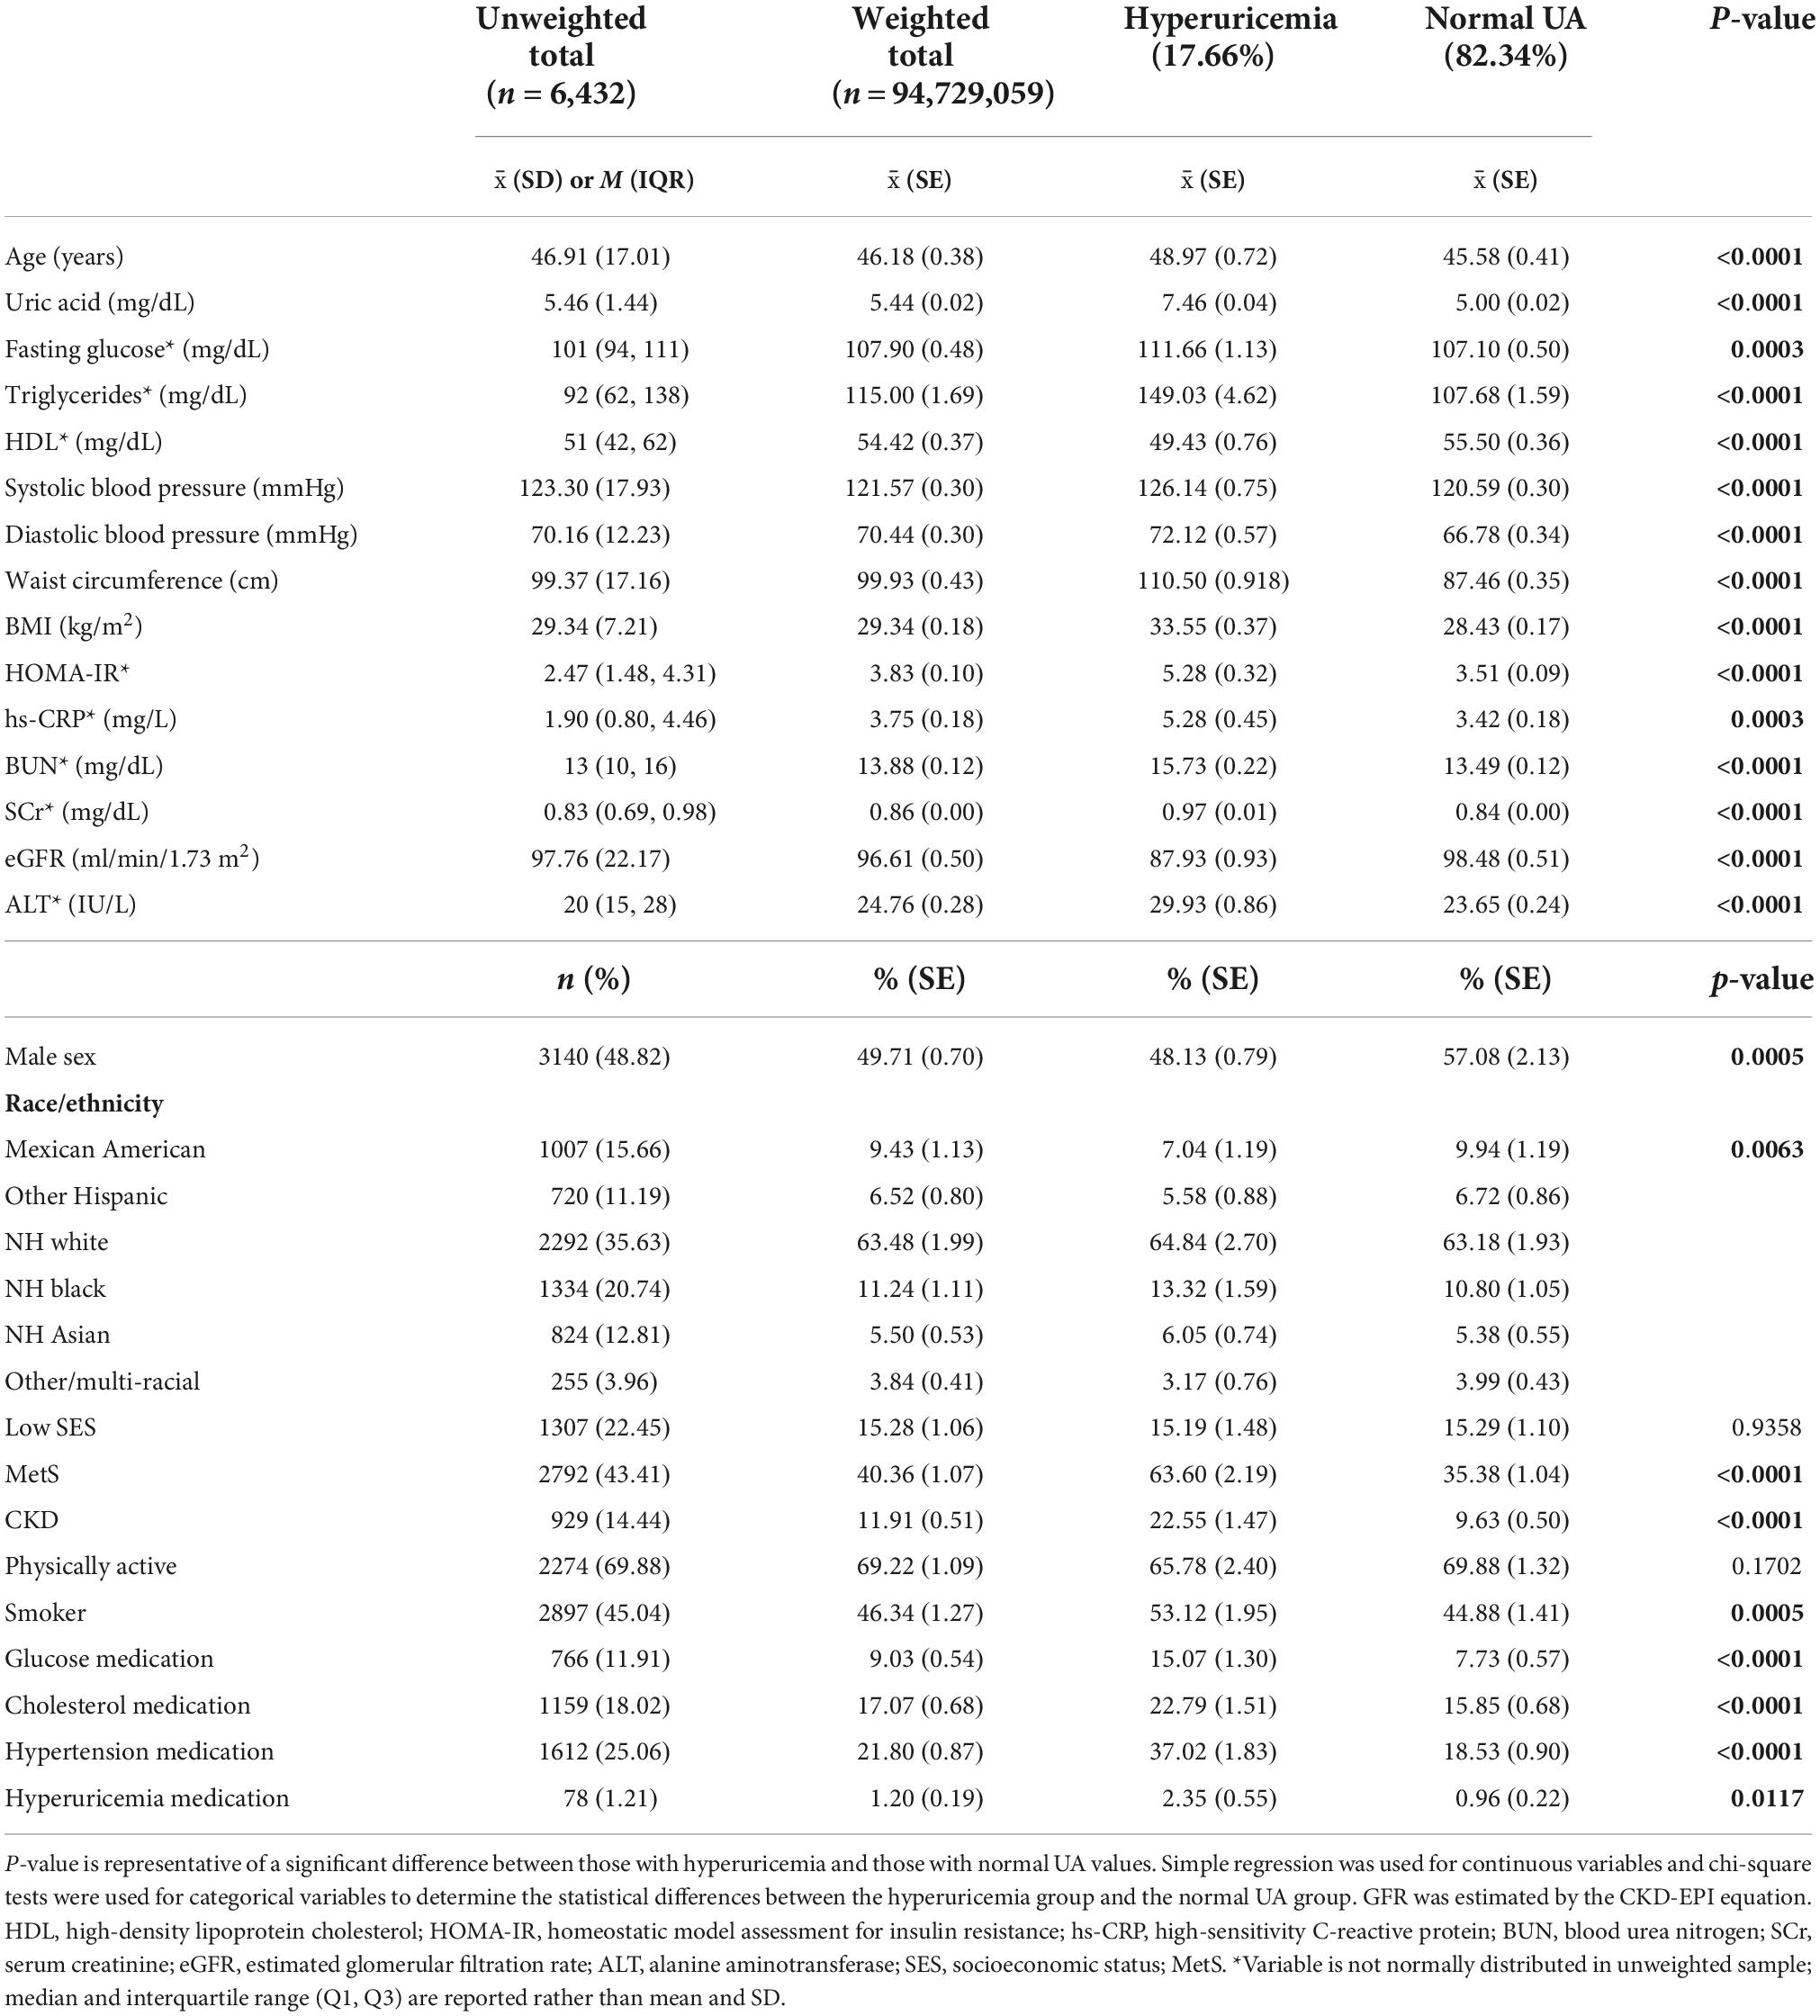
Table 1. Demographic information for the total sample, those with hyperuricemia, and those with normal uric acid (UA) levels.
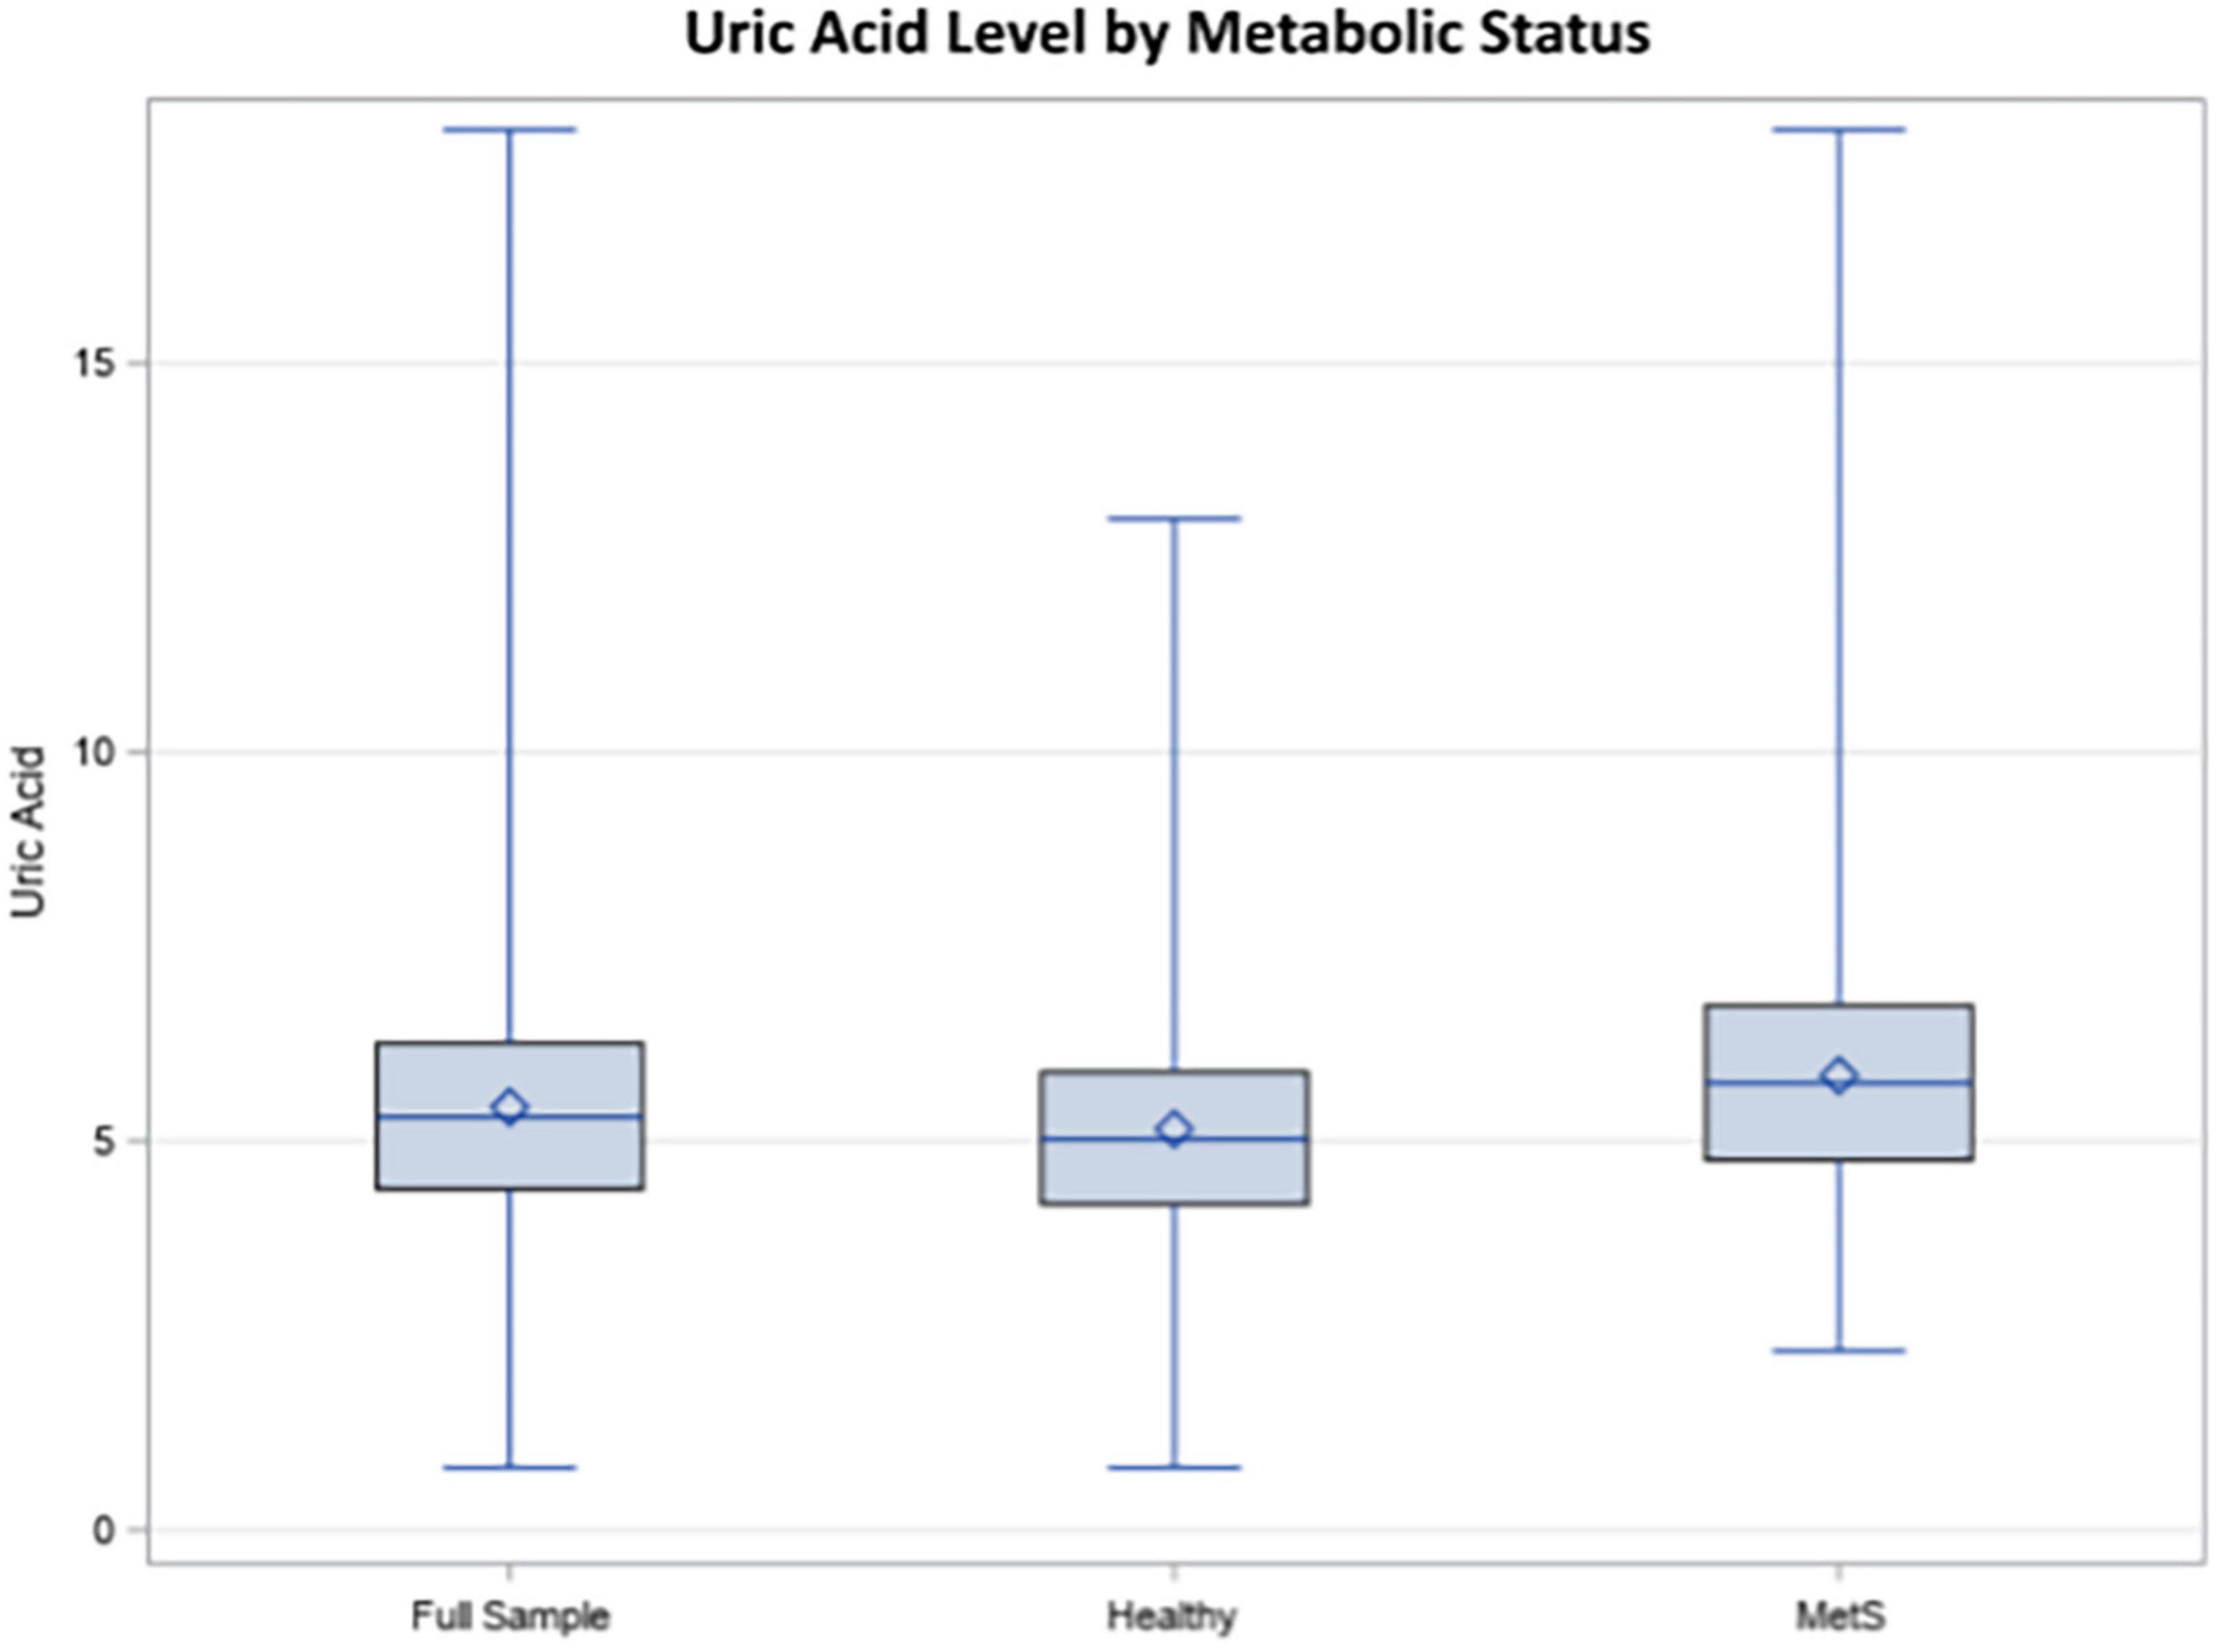
Figure 1. Uric acid (UA) levels in the total sample, healthy individuals, and individuals with metabolic syndrome (MetS).
On average, individuals with hyperuricemia had 4.56 mg/dL higher levels of blood glucose (p = 0.0003), 41.35 mg/dL higher levels of triglycerides (p < 0.0001), 5.55/2.04 mmHg higher blood pressure (p < 0.001), 12.84 cm greater waist circumference (p < 0.0001), and 1.86 mg/dL higher hs-CRP (p = 0.0003) as compared to those with normal UA levels. HDL was 6.07 mg/dL lower (p < 0.0001) and eGFR was 10.55 ml/min/1.73 m2 lower in the hyperuricemia group (p > 0.0001) compared to the normal UA group. Those with hyperuricemia were more likely to be male and non-Hispanic (NH) White, NH Black, or NH Asian. have MetS, smoking, and prescription medications for hyperglycemia, dyslipidemia, hypertension, and hyperuricemia were more frequently reported in those with hyperuricemia. There was no statistical difference in SES and self-reported physical activity level between the hyperuricemia and normal UA groups (p = 0.936 and 0.170, respectively).
The five metabolic risk factors were found to have small to moderate significant correlations to UA levels in the overall group, demonstrated in Table 2. When exclusively analyzing metabolically healthy individuals, all metabolic risk factors were significantly correlated with UA level with the exception of fasting blood glucose (r = 0.0.24, p = 0.146). In individuals with MetS, fasting glucose, triglycerides, HDL, and waist circumference levels were found to have small to moderate correlations, whereas blood pressure was not significantly correlated to UA.
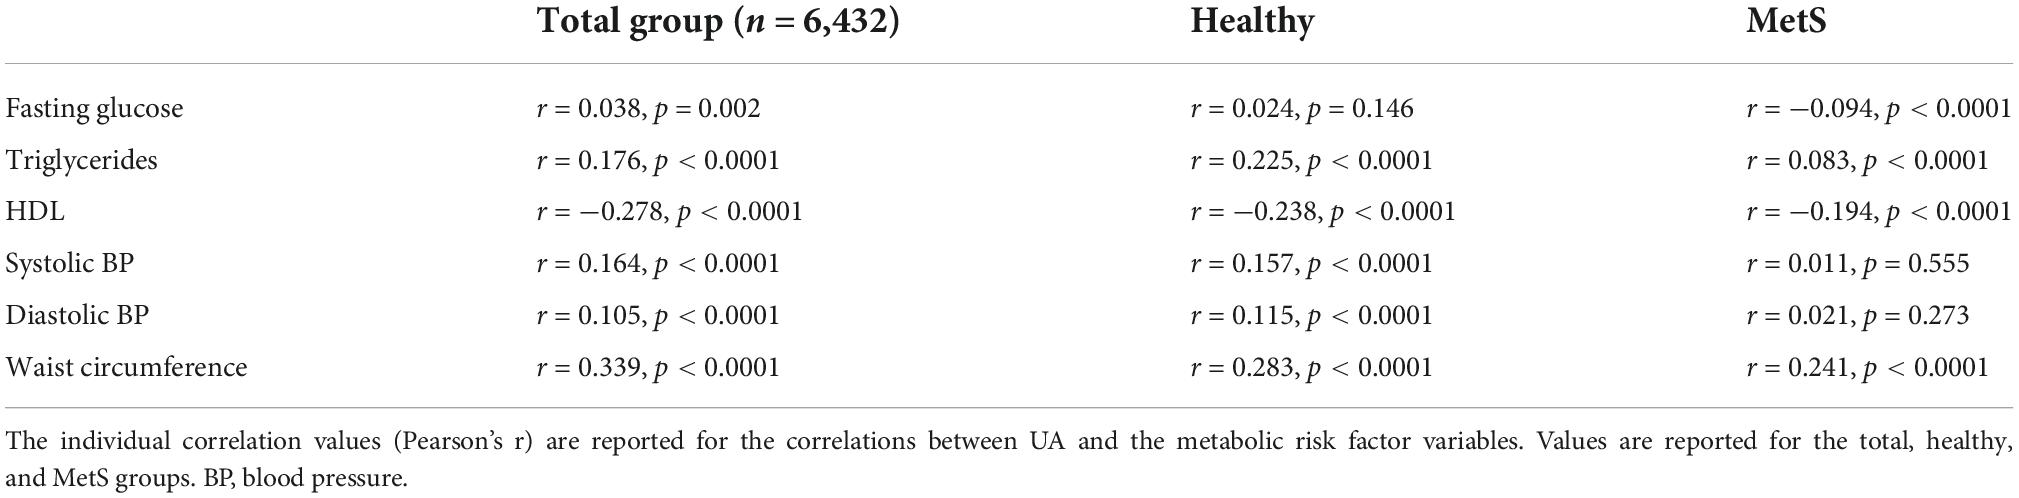
Table 2. Pearson’s correlations with uric acid (UA) levels using an unweighted sample.
The logistic regression models in Table 3 demonstrate that individuals with hyperuricemia are more likely to have MetS. In an individual with hyperuricemia, the unadjusted odds of having MetS are 3.19 (p < 0.0001), demonstrated in Model 1. After adjustment for potentially confounding variables, the relationship was attenuated (OR = 1.88, p < 0.0001 in Model 2 and OR = 1.38, p = 0.297 in Model 3). The strength of the logistic regression models was improved with each addition of potential confounders.
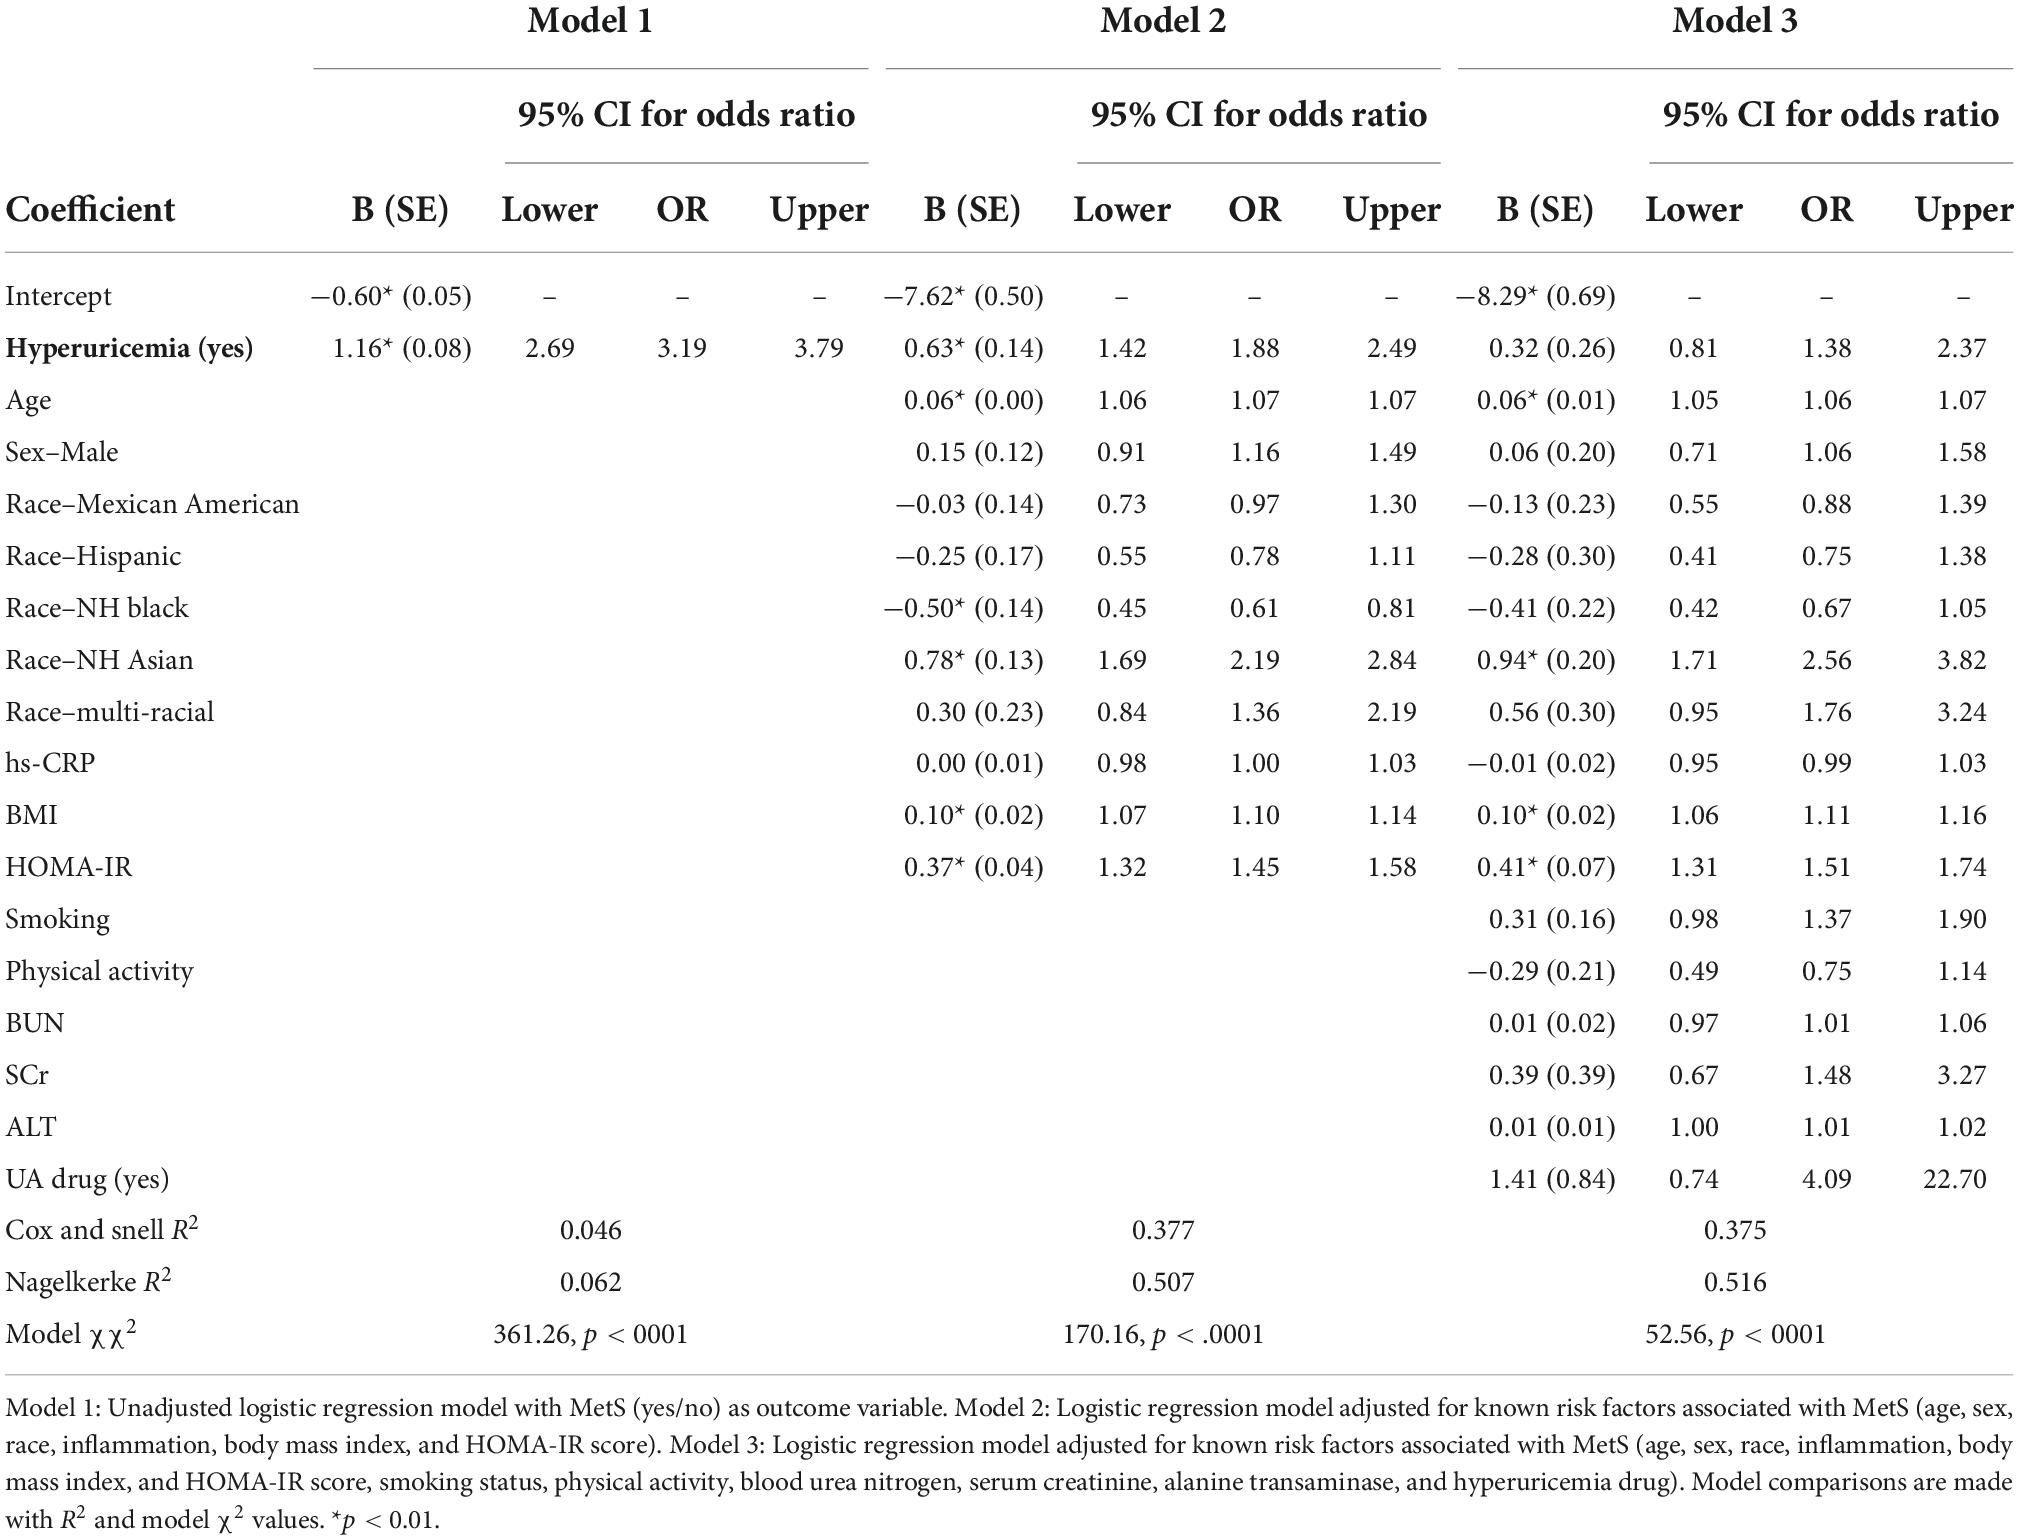
Table 3. Logistic Models demonstrating the odds of having metabolic syndrome (MetS).
Discussion
The purpose of the study was to determine if there was a relationship between hyperuricemia and MetS. Our study findings suggest that hyperuricemia had significant statistical and clinical associations with MetS in participants in the NHANES study. These findings partially support previous studies that reported similar findings (15, 25, 26) but does not support previous studies that did not discover a relationship (11). Those participants with hyperuricemia (>7.0 mg/dL in males and >6.0 in females) in our study were more than three times as likely to have concomitant MetS when compared to those with normal UA levels. When controlling for variables associated with hyperuricemia and MetS, participants with hyperuricemia were still 1.38–1.88 times more likely to have MetS than without hyperuricemia, suggesting that there is a relationship between hyperuricemia and MetS. Understanding the role of UA in MetS can help to identify additional risk for MetS and can help elucidate possible metabolic pathways associated with CVD and other chronic diseases.
Various studies (1–10) have reported a relationship between UA and MetS, supporting the findings of our study. Mahajan et al. (7) reports that UA raises blood pressure levels through the stimulation of intracellular oxidative stress. Additionally, hyperuricemia may increase insulin resistance, vasodilation, increase blood flow, interfere with nitric oxide function, and therefore affect glucose absorption. Previous studies (8, 25, 26) postulate that UA has an antioxidant effect at normal levels but becomes proinflammatory in people with hyperuricemia and increased oxidative stress. Our study findings support this previous research as hs-CRP was significantly and clinically lower in the normal UA group. A previous study (7) suggested that hyperuricemia may cause inflammatory responses in adipose tissues causing increased inflammation and insulin resistance and promote fat storage. Participants in our study in the hyperuricemia group have significantly larger waist circumferences, supporting the previous study findings. These higher levels of inflammation can also have concomitant changes in lipids, blood pressure and kidney function, increasing the risk for other chronic conditions, which is supported by our study.
It should be noted that some previous studies did not support our findings of hyperuricemia being associated with MetS. Those studies that did not support our results primarily involved a small number of participants (11) or utilized Mendelian randomization that failed to show a causal relationship (12, 16) or made comparisons between those with a singular risk factor for MetS (11, 16). Pfister et al. (11) conducted a case-control study of 7,504 patients with diabetes and 8560 controls without diabetes. Their findings did not support an association with UA and DM, but did not make comparisons on other known risk factors for MetS. Adnan et al. (16)reported on findings from a study of 102 primarily older participants focusing a component of MetS rather than all risk factors for MetS as well, in an observational study that was conducted over 3 months. Additionally, Copur et al. (12) reported that previous studies that did not find associations between UA and MetS mostly used Mendelian randomization methods, which was not used by our study. Sample characteristics and findings of each study can be found in Table 4.
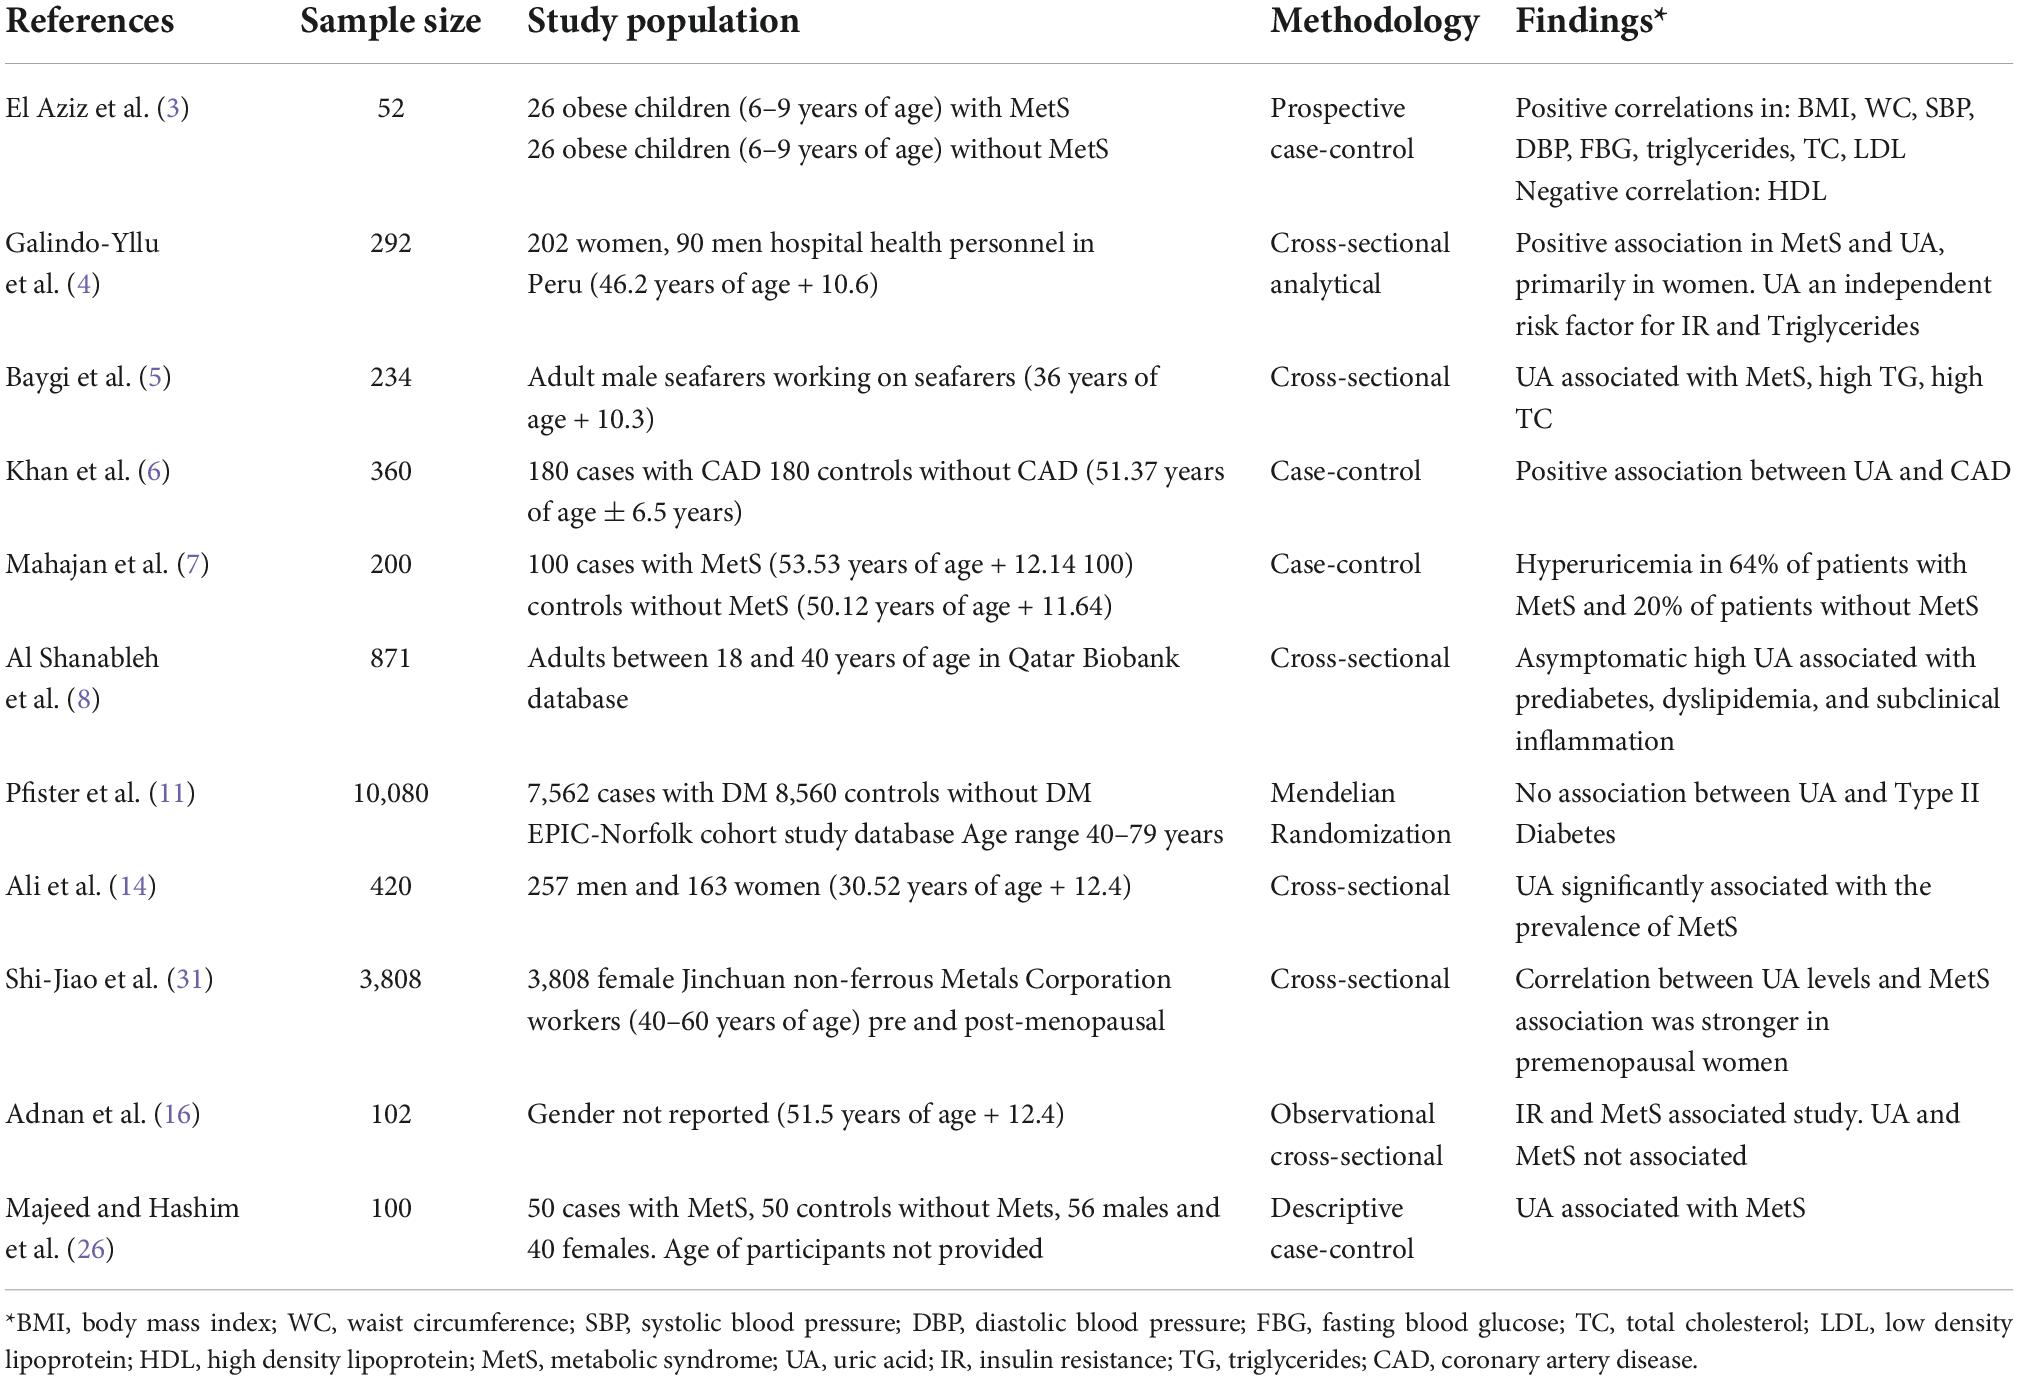
Table 4. Summary of similar studies regarding UA and MetS.
A thorough review of the literature by Caliceti et al. (27) suggests that increasing UA levels associated with MetS may be attributed to increased levels of fructose in the Western diet, which has been adopted in many countries. The increase in fructose is normally associated with increases in added sugars in both food and drink. The corresponding hyperuricemia is caused primarily by the enzyme xanthine oxidase. (28) Though a causal link has yet to be established, further research is needed to further elucidate these findings (29, 30).
Patients from our study with hyperuricemia had significantly elevated levels of most risk factors associated with MetS as noted in Table 1, except for HDL-C which had lower levels in the hyperuricemia group. The only risk factors that were not significantly different included physical activity levels and SES. These findings suggest that UA may be both a risk factor for MetS yet additionally related to other MetS risk factors, CVD, and other chronic conditions such as chronic kidney disease. The correlations in Table 2, while weak to moderate in strength, represent a statistically significant influence of UA on each of the metabolic risk factors. These findings suggest UA could be providing additional risk for the development of MetS.
Findings from the logistic regression in our study suggest that hyperuricemia has a significant relationship with MetS, and when controlling for known risk factors of MetS, those with hyperuricemia were still more likely to have concomitant MetS. In Model 3, the most statistically adjusted model, the results were attenuated, indicating that the relationship between hyperuricemia and MetS was weakened after controlling for additional risk factors. Yet, this still suggests that those with hyperuricemia are more likely to have MetS based on the OR findings.
Inferences from this study are limited due to the cross-sectional nature of the data collection which limited the ability to make causal inferences. Single time point measures occur with NHANES data collection, and the study is therefore not longitudinal. Additionally, some data collected by NHANES surveys are self-reported. However, the sample is a large and diverse sample collected by CDC that is both healthy and unhealthy participants making analyses and findings of importance. Statistical analysis allowed for the sample to be representative of the greater population of the US, yielding sound, generalizable results.
Findings from the logistic regression in our study reported in Table 3 suggests that hyperuricemia has an association with MetS, and when controlling for known risk factors of MetS, those with hyperuricemia were still more likely to have MetS. Further research is needed to better understand the role UA plays in the development of MetS and to elucidate metabolic pathways associated with UA and MetS.
Data availability statement
Publicly available datasets were analyzed in this study. This data can be found here: National Health and Nutrition Examination Survey https://www.cdc.gov/nchs/nhanes/index.htm.
Ethics statement
This study was determined exempt from IRB review by the sponsoring university due to the nature of the secondary data analysis (IRB ID# 1505514-1).
Author contributions
RB and KR created the research study idea, participated in the study design, methodology, wrote the manuscript, and proofed the final manuscript. KR analyzed the data and reported the findings from the results of the study. LR assisted in the analysis of the data, wrote the manuscript, and proofed the final version of the manuscript. All authors contributed to the article and approved the submitted version.
Funding
This Brown Foundation Endowed Fund at Baylor University providing funding for the Post-Doctoral Fellow.
Conflict of interest
LR was employed by ProtaGene US, Inc.
The remaining authors declare that the research was conducted in the absence of any commercial or financial relationships that could be construed as a potential conflict of interest
Publisher’s note
All claims expressed in this article are solely those of the authors and do not necessarily represent those of their affiliated organizations, or those of the publisher, the editors and the reviewers. Any product that may be evaluated in this article, or claim that may be made by its manufacturer, is not guaranteed or endorsed by the publisher.
References
1. Aje T, Miller M. Cardiovascular disease: a global problem extending into the developing world. World J Cardiol. (2009) 1:3–10. doi: 10.4330/wjc.v1.i1.3
2. World Health Organization [WHO]. Global health estimates 2016: deaths by cause, age, sex, by country, by region: 2000-2016. Geneva: World Health Organization (2018).
3. El Aziz L, Morsy S, Ahmed H, El Hameed Ahmed M. Association between serum uric acid and metabolic syndrome components. Egypt J Hosp Med. (2020) 81:1173–7. doi: 10.21608/ejhm.2020.110517
4. Galindo-Yllu B, Rojas-Humpire R, Toro-Huamanchumo C, Gutierrez-Ajalcriña R, Soriano A. Serum uric acid is associated with metabolic syndrome and insulin resistance among health personnel from peru. J Nutr Metab. (2021) 2021:9933319. doi: 10.1155/2021/9933319
5. Baygi F, Herttua K, Sheidaei A, Ahmadvand A, Jensen O. Association of serum uric acid with cardiometabolic risk factors and metabolic syndrome in seafarers working on tankers. BMC Public Health. (2020) 20:442. doi: 10.1186/s12889-020-08466-2
6. Khan G, Zab J, Adnan F, Ahmed N, Akhtar A, Saleemi S. Association of hyperuricemia with critical coronary artery disease. Pakistan Heart J. (2020) 53:147–51. doi: 10.47144/phj.v53i2.1813
7. Mahajan A, Mahajan A, Kotwal S, Tandon V. Relationship of hyperuricemia and metabolic syndrome. JK Sci. (2021) 23: 94–7.
8. Al Shanableh Y, Hussein Y, Saidwali A, Al-Mohannadi M, Aljalham B, Nurulhoque H, et al. Prevalence of asymptomatic hyperuricemia and its association with prediabetes, dyslipidemia, and subclinical inflammation markers among young healthy adults in Qatar. BMC Endocr Disord. (2022) 22:21. doi: 10.1186/s12902-022-00937-4
9. Spahis S, Borys G, Levy E. Metabolic syndrome as a multifaceted risk factor for oxidative stress. Antioxid Redox Signal. (2017) 26:445–61. doi: 10.1089/ars.2016.6756
10. Straface E, Gambardella L, Canali E, Metere A, Gabrielli N, Arcieri R, et al. P-selectin as a new gender associated biomarker in patients with metabolic syndrome. Int J Cardiol. (2010) 145:570–1. doi: 10.1016/j.ijcard.2010.05.043
11. Pfister R, Barnes D, Luben R, Forouhi N, Bochud M, Khaw K, et al. No evidence for a causal link between uric acid and type 2 diabetes: a mendelian randomisation approach. Diabetologia. (2011) 54:2561–9. doi: 10.1007/s00125-011-2235-0
12. Copur S, Atalay D, Kanbay M. Uric acid in metabolic syndrome: does uric acid have a definitive role? Eur J Intern Med. (2022) 103:4–12. doi: 10.1016/j.ejim.2022.04.022
13. Srikanthan K, Feyh A, Visweshwar H, Shapiro J, Sodhi K. Systematic review of metabolic syndrome biomarkers: a panel for early detection, management, and risk stratification in the West Virginian population. Int J Med Sci. (2016) 13:25–38. doi: 10.7150/ijms.13800
14. Ali N, Miah R, Hasan M, Barman Z, Mou A, Hafsa J, et al. Association between serum uric acid and metabolic syndrome: a cross-sectional study in Bangladeshi adults. Sci Rep. (2020) 10:7841. doi: 10.1038/s41598-020-64884-7
15. He S, Chan C, Xie Z, Shi D, Hu X, Li H. The relationship between serum uric acid and metabolic syndrome in premenopausal and postmenopausal women in the Jinchang cohort. Gynecol Endocrinol. (2017) 33:141–4. doi: 10.1080/09513590.2016.1214261
16. Adnan E, Rahman I, Faridin H. Relationship between insulin resistance, metabolic syndrome components and serum uric acid. Diabetes Metab Syndr. (2019) 13:2158–62. doi: 10.1016/j.dsx.2019.04.001
17. Centers for Disease Control and Prevention [CDC], National Center for Health Statistics [PNCHS]. National health and nutrition examination survey questionnaire (or examination protocol, or laboratory protocol). Hyattsville, MD: U.S. Department of Health and Human Services (2019).
18. Chen T, Clark J, Riddles M, Mohadjer L, Fakhouri T. national health and nutrition examination survey, 2015-2018: sample design and estimation procedures. Hyattsville: National Center for Health Statistics (2020).
19. Chen T, Parker J, Clark J, Shin H, Rammon J, Burt V. national health, and nutrition examination survey: estimation procedures, 2011–2014. Hyattsville: National Center for Health Statistics (2018).
20. Johnson C, Dohrmann S, Burt V, Mohadjer L. National health and nutrition examination survey: sample design, 2011–2014. Vital Health Stat. (2014) 2: 1–33.
21. Centers for Disease Control and Prevention [CDC]. NHANES - National health and nutrition examination survey homepage. (2022). Available online at: https://www.cdc.gov/nchs/nhanes/index.htm (accessed November, 2022).
22. Physical Activity Guidelines for Americans. Physical activity guidelines advisory committee report, 2019. Washington, DC: US Department of Health and Human Services (2018).
23. Alberti K, Eckel R, Grundy S, Zimmet P, Cleeman J, Donato K. Harmonizing the metabolic syndrome. Circulation. (2009) 120:1640–5. doi: 10.1161/CIRCULATIONAHA.109.192644
24. Fang J, Zhang Z, Ayala C, Thompson-Paul A, Loustalot F. Cardiovascular health among non-hispanic Asian Americans: NHANES, 2011–2016. J Am Heart Assoc. (2019) 8:e011324. doi: 10.1161/JAHA.118.011324
25. Levey AS, Stevens LA, Schmid CH, Zhang Y, Castro AF, Feldman HI, et al. A new equation to estimate glomerular filtration rate. Ann Int Med. (2009) 150:604–12. doi: 10.7326/0003-4819-150-9-200905050-00006
26. Majeed S, Hashim R. Uric acid as a future biomarker in diagnosing metabolic syndrome patients. Prof Med J. (2019) 26:1911–5. doi: 10.29309/TPMJ/2019.26.11.3191
27. Chiou W, Wang M, Huang D, Chiu H, Lee Y, Lin J. The relationship between serum uric acid level and metabolic syndrome: differences by sex and age in taiwanese. J Epidemiol. (2010) 20:219–24. doi: 10.2188/jea.JE20090078
28. Caliceti C, Calabria D, Roda A, Cicero AFG. Fructose intake, serum uric acid, and cardiometabolic disorders: a critical review. Nutrients. (2017) 9:395. doi: 10.3390/nu9040395
29. Yanai H, Adachi H, Hakoshima M, Katsuyama H. Molecular biological and clinical understanding of the pathophysiology and treatments of hyperuricemia and its association with metabolic syndrome, cardiovascular diseases and chronic kidney disease. Int J Mol Sci. (2021) 22:9221. doi: 10.3390/ijms22179221
30. Nakagawa T, Hu H, Zharikov S, Tuttle KR, Short RA, Glushakova O, et al. A causal role for uric acid in fructose-induced metabolic syndrome. Am J Physiol Renal Physiol. (2006) 290:F625–31. doi: 10.1152/ajprenal.00140.2005
Keywords: NHANES, metabolic syndrome, uric acid, hyperuricemia, cardiovascular disease
Citation: Bowden RG, Richardson KA and Richardson LT (2022) Uric acid and metabolic syndrome: Findings from national health and nutrition examination survey. Front. Med. 9:1039230. doi: 10.3389/fmed.2022.1039230
Received: 07 September 2022; Accepted: 23 November 2022;
Published: 14 December 2022.
Edited by:
Yeonghee Eun, Sungkyunkwan University School of Medicine, South KoreaReviewed by:
Arnulfo Hernan Nava-Zavala, Mexican Social Security Institute (IMSS), MexicoZeid Khitan, Marshall University, United States
Copyright © 2022 Bowden, Richardson and Richardson. This is an open-access article distributed under the terms of the Creative Commons Attribution License (CC BY). The use, distribution or reproduction in other forums is permitted, provided the original author(s) and the copyright owner(s) are credited and that the original publication in this journal is cited, in accordance with accepted academic practice. No use, distribution or reproduction is permitted which does not comply with these terms.
*Correspondence: Rodney G. Bowden, Rodney_Bowden@baylor.edu