Greenhouse gas reduction in a medium-duty compression ignition engine with optimization for B20
 Taemin Kim
  André L. Boehman*
- Department of Mechanical Engineering, College of Engineering, University of Michigan, Ann Arbor, MI, United States
Soy-based biodiesel can reduce well-to-wheels greenhouse gas (GHG) emissions per unit energy (i.e., gCO2e/MJ) by 66%–72% as compared to the petroleum-based diesel fuel with currently adopted agricultural and industrial practices. Biodiesel can reduce particulate matter and carbon monoxide emissions with a manageable degree of increase in NOx emissions. From the perspective of GHG emissions reduction per unit travelling distance (i.e., gCO2e/mile), the application of B20 in compression ignition engines without the adjustment in engine control unit (ECU) settings will not extract the best carbon emissions reduction that B20 could achieve. Optimizing the engine control settings permits re-calibration to achieve the maximum brake fuel conversion efficiency (BFE) based on comprehensive understanding on the impact of both “fuel” and “ECU calibration” on BFE and other criteria pollutant emissions. The maximum GHG emissions reduction with B20 application is experimentally measured with the optimized ECU calibration, thus providing the understanding of the combined impact of biodiesel fuel and calibrations on engine performance and emissions. Six steady operating modes were considered, that can be combined to estimate the US federal test procedure BFE and emissions over the Federal Test Protocol (FTP) 75 cycle. Combined with the weight factors to simulate the EPA FTP 75 cycle from these 6 “mini-map” test points, 0.53% improvement in the energy requirement per unit traveling distance (i.e., MJ/mile) is achieved for B20 with the final ECU calibration, in addition to the degree of GHG emissions reduction on a “gCO2e/MJ” basis from the use of B20 blend of soy biodiesel of ∼12.5% reduction in gCO2e/MJ, for a total GHG emissions reduction of 13%.
1 Introduction
Biodiesel is a low carbon fuel produced from a number of renewable feedstock options. It can be produced from 1st generation feedstocks such as plant-based oils (e.g., soy oil, canola oil, rapeseed oil, etc.) and animal fats (e.g., tallow), or from 2nd generation feedstocks such as algae or lignocellulosic biomass (Huo et al., 2008; Campbell et al., 2011; Thanh et al., 2012). Currently, biodiesel production in the United States (U. S.) is predominantly from the transesterification reaction of soybean oil (DOE, 2020), meanwhile much research is being conducted to reduce the cost and life-cycle impact by exploring better feedstocks and production pathways (Scott et al., 2010; Nautiyal et al., 2014; Piloto-Rodriguez et al., 2017).
Soy-based biodiesel can reduce well-to-wheels (WTW) greenhouse gas (GHG) emissions per unit energy (i.e., gCO2e/MJ) by 66%–72% as compared to the petroleum-based diesel fuel with currently adopted agricultural and industrial practices (Chen et al., 2018). Another more recently published study also report a similar degree of carbon emissions reduction using soy-based biodiesel compared to fossil-based diesel fuel use in internal combustion engine vehicles (Xu et al., 2022). Employing less carbon intensive farming processes and more efficient utilization of its co-product (i.e., soymeal and glycerol) are expected to further improve the life-cycle performance of biodiesel (Chen et al., 2018). Furthermore, the adoption of the higher energy density feedstocks such as algae is expected to reduce the GHG emissions significantly by reducing the land use impact of biodiesel production (Campbell et al., 2011).
In addition to the low carbon emissions, application of biodiesel in compression ignition (CI) engines has other benefits. Biodiesel can reduce particulate matter and carbon monoxide emissions with a manageable degree of increase in NOx emissions (Lapuerta et al., 2008; Wallington et al., 2016). It also improves the oxidation reactivity of the soot inside the diesel particulate filter (DPF), which, in turn, improves the efficiency of the operation of DPF regeneration (Lapuerta et al., 2012). Its energy density (33.0 MJ/L) is about 9% lower than that of the petroleum-based diesel (36.2 MJ/L). Although this moderate decrease in lower heating value (LHV) will require either an increase in fuel tank size or an increase in refueling frequency for the drivers, the degree of the decrease in LHV with biodiesel from the petroleum-based diesel is much better than the LHV gap between bio-ethanol (21.3 MJ/L) and its petroleum-based counterpart, or gasoline fuel (31.3 MJ/L), which is about 32%, thus providing a rationale for widespread adoption of biodiesel in CI engines.
However, neat biodiesel (B100) has operational problems with conventional CI engines (Graboski and McCormick, 1998). It can degrade the performance of the after-treatment system by metal oxide ash accumulation and can degrade the engine oil quality due to its high boiling point (Sappok and Wong, 2008; Ye et al., 2013). It can also clog the fuel injection system due to the poor cold flow properties or due to the peroxidation with air or water (Fang and McCormick, 2006; Lapuerta et al., 2012).
Thus, B20 (i.e., 20 vol% of biodiesel in petroleum-based diesel) is currently the highest accepted blend level of biodiesel in the U. S. for production CI engine applications. Unlike B100, B20 does not impose operational problems listed above when applied to lightly modified diesel engines (i.e., B20-compatible engines) while partially achieving the benefits of neat biodiesel.
However, even for B20, it is still not a good idea to apply it to CI engines without any changes in Engine Control Unit (ECU) settings. From the perspective of GHG emissions reduction per unit travelling distance (i.e., gCO2e/mile), the application of B20 in CI engines without the adjustment in ECU settings will not extract the best carbon emissions reduction that B20 could achieve (Senatore et al., 2006; Larsson and Denbratt, 2007; Murr et al., 2011; Hermitte et al., 2012; Mejia et al., 2020). This is because the difference in fuel properties causes an unintended shift in the ECU settings to increase the fuel energy required per unit mileage (i.e., MJ/mile). Following are examples of the result of the B20 application in CI engines with un-optimized ECU settings.
First, due to the lower energy content of B20, the driver will increase the acceleration pedal angle to meet certain brake torque, which will, in turn, change different input parameter settings in the ECU [e.g., Exhaust Gas Recirculation (EGR) rate, boost pressure, rail pressure, main injection timing (MIT), pilot injection quantity (PIQ), relative distance between MIT and pilot injection timing (RPIT)] (Kurtz et al., 2012). The unintended shifts in ECU input parameter settings can result in un-optimized brake fuel conversion efficiency (BFE) for B20. Secondly, even for the fixed ECU settings, higher fuel oxygen content in B20 can result in higher exhaust oxygen concentration, which will result in higher intake oxygen concentration via EGR. This will make intake charge condition favorable for NOx generation, thus failing to meet criteria pollutant emissions certification standards (Xu et al., 2022).
Thus, to extract the best GHG emissions reduction per unit mileage from B20 while satisfying the criteria pollutant emissions standards, the ECU settings must be re-calibrated to achieve the maximum BFE based on comprehensive understanding on the impact of both “fuel” and “ECU calibration” on BFE and other criteria pollutant emissions.
There has been a number of research focused on the biodiesel “fuel” impact on BFE and emissions in diesel engines. Mueller et al. (2009) investigated the impact of neat biodiesel in a single-cylinder research engine (i.e., Sandia Compression-ignition Optical Research Engine, or SCORE) designed to simulate a Caterpillar Heavy-duty diesel engine. The study provided great fundamental understanding on different origins of the biodiesel NOx increase (i.e., difference in ignition delay, bulk cylinder temperature, lift-off length, and oxygen ratio at the lift-off length between neat biodiesel and petroleum-based diesel) at four different indicated mean effective pressure (IMEP) conditions with and without oxygen dilution. Since the study was focused on the investigation of the fundamental origin of biodiesel NOx increase, the impact of biodiesel in a wide range of ECU settings and the impact of unintended shifts in ECU settings were not covered in the study. Yehliu et al. (2010) investigated the impact of neat biodiesel on BFE and criteria pollutant emissions in a light-duty diesel engine at four different modes [i.e., two different engine speeds at two different brake mean effective pressure (BMEP)] with and without pilot injection. The study provided great understanding on the impact of B100 at different operating conditions [i.e., more intense particulate matter (PM) reduction at higher loads] and with pilot injection event (i.e., decrease in particle concentration and NOx emission than single injection strategy). However, the study did not cover the impact of biodiesel with a more comprehensive range of the ECU settings. Ye and Boehman (2012) investigated the impact of B40 (i.e., 40 vol% biodiesel with petro-diesel) on BFE and criteria pollutant emissions in a medium-duty diesel engine at three different loads with varying MIT and rail pressure. The study narrowed the research by providing biodiesel fuel’s impact at varying input parameters such as MIT (i.e., biodiesel NOx and PM effect is more intense at extremely advanced injection timings) and rail pressure (i.e., biodiesel PM reduction is more intense at lower rail pressure). However, the work still did not provide the impact of biodiesel at different charge gas conditions via varying EGR rate or boost pressure. Thus, it could not provide a fully optimized new ECU calibration for biodiesel application.
There has also been some research to investigate the impact of “ECU calibration” with biofuel application in CI engines to improve the worsening in BFE due to the unintended shift in the ECU settings. Larsson and Denbratt (2007) adjusted the EGR and MIT settings for different types of Fischer-Tropsch (FT) oils and Rapeseed-derived biodiesel to maximize BFE. However, the range of engine operating conditions and ECU input parameters adjusted in the study was not comprehensive enough to suggest a full new set of ECU settings dedicated to biodiesel. Fang and McCormick (2006) invented a calibration system based on a “Fuel Quality Sensor” which can adjust the ECU settings on-board based on different fuel properties diagnosed by the sensor. However, despite the comprehensive range of the engine operating conditions and fuel variability that the sensor could cover, some of the important ECU input parameters such as rail pressure, boost pressure, and pilot injection quantity were still not accounted for in their study, thus leaving the room for further research on the more comprehensive ECU optimization for biodiesel. Senatore et al. (2006) presents a report on how the ECU optimization for each different type of biofuel should generally, or qualitatively, be conducted based on their observation on ECU shifts with those biofuels. However, it does not provide quantitative, or specific optimized ECU settings for each fuel. Murr et al. (2011) presents the optimization of ECU settings for hydrotreated vegetable oils (HVO) in a light-duty diesel engine. The study covers eight different ECU input parameters to cover a comprehensive range of engine operating conditions. It also compares the BFE and emissions characteristics of the diesel and HVO in different “drop-in” scenarios to quantitatively account for the unintended shifts in ECU settings caused by different fuel types. However, because the fuel properties of HVO and biodiesel are still significantly different in that biodiesel contains oxygen atoms while HVO does not, the research for the ECU optimization focused on biodiesel is still required.
Therefore, in this study, the optimization of ECU settings with six to eight different input parameters is conducted in a comprehensive range of engine operating conditions to maximize the GHG emissions reduction with the B20 application based on the comprehensive understanding of both the fuel’s and calibration’s impact on engine performance and emissions. The study can be distinguished into three stages. First, the impact of B20 “fuel” on GHG and criteria pollutant emissions is investigated by comparing the experimental measurements of B20 to petroleum-based diesel at fixed, default ECU calibration. Second, the ECU calibration is optimized for B20 to maximize the GHG emissions reduction while satisfying the criteria pollutant emissions standard. Lastly, the maximum GHG emissions reduction with B20 application is experimentally measured with the optimized ECU calibration, thus providing the understanding of the combined impact of biodiesel fuel and calibrations on engine performance and emissions. The experiment is conducted in a 6.7 L Ford Powerstroke medium-duty turbodiesel engine.
2 Experimental
2.1 Test fuels
Certified ultra-low sulfur diesel (cert-ULSD) obtained from Corrigan Oil Company is used as the baseline fuel. Cert-diesel is chosen against the regular pump-grade diesel to avoid the seasonal differences in fuel properties. During the study, a total of four different batches of the cert-diesel were used while the fuel properties of the different batches were maintained consistent as shown in Table 1.
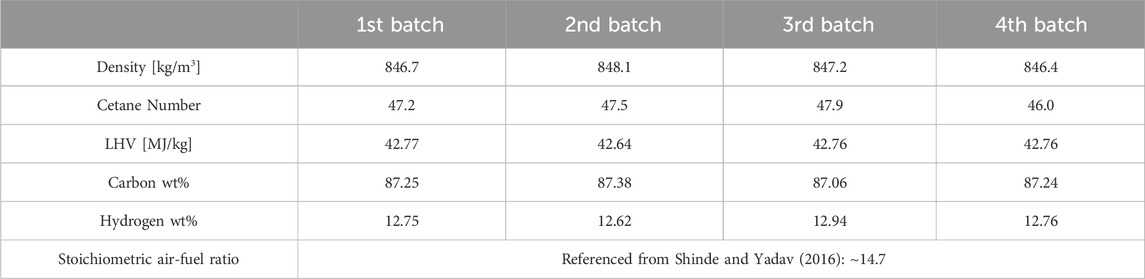
Table 1. Fuel properties of the different batches of the cert-ULSD used for the current study.
Soybean-derived biodiesel obtained from Ag Processing Inc. (AGP) is used as the neat biodiesel blendstock for the B20 used in the current study. The B100 from AGP is sent to Corrigan Oil Company, then it is mixed with the cert-ULSD with 20% volume fraction to form B20. The properties of the B100 are presented in Table 2. Cetane number (CN) and viscosity were moderately higher than the cert-diesel. Lower heating value (LHV) was about 12% lower than that of the cert-diesel. In terms of the molecular composition, the neat soy-biodiesel contained high fractions of polyunsaturated esters (i.e., C 18:2 methyl linoleate and C 18:3 methyl linolenate) and contained about 11% fuel oxygen mass content.
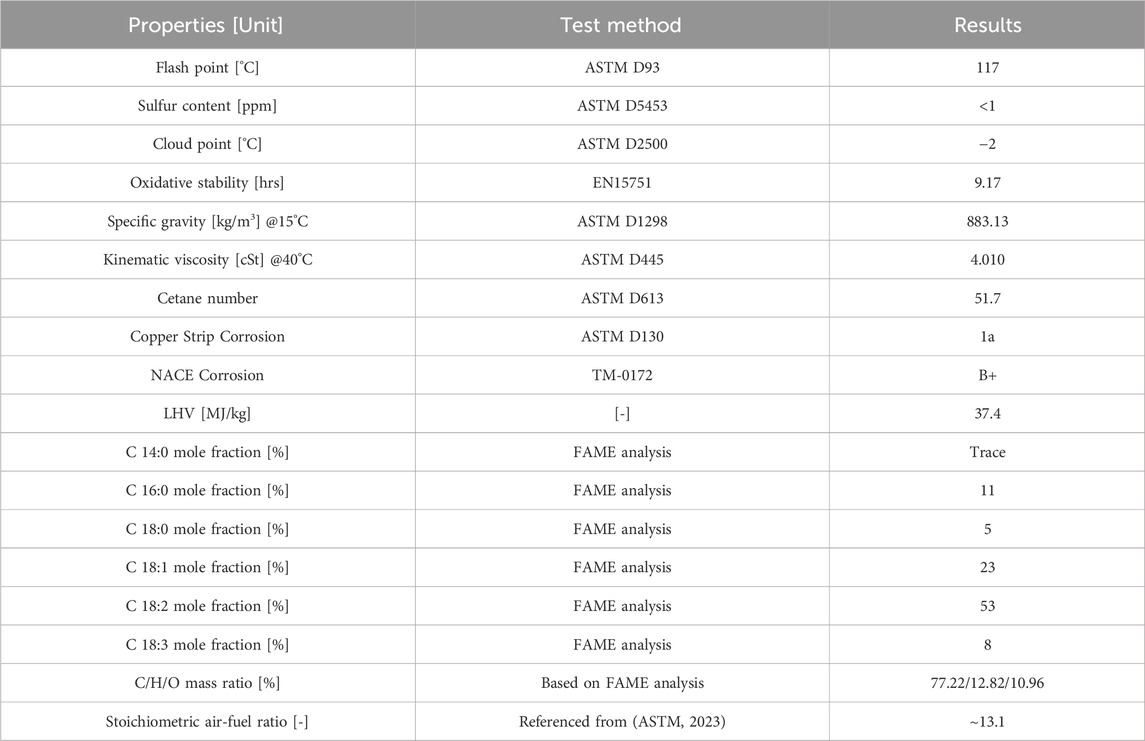
Table 2. Properties and molecular composition of the neat soy biodiesel (B100).
The properties of the B20 used for the current work are presented in Table 3. Density, LHV, and Carbon-Hydrogen-Oxygen mass ratio of the B20 are estimated from the linear interpolation of the properties of the cert-diesel and B100. For the estimation of the ignition quality of the B20, linear interpolation of the cetane numbers of B100 and ULSD could also be used. However, to ensure more reliability on the ignition quality of the test fuels, the derived cetane number (DCN) of B20 and ULSD are directly measured in the Cetane Ignition Delay (CID) equipment based on the ASTM D7668 standard method (ASTM, 2023) The DCN for B20 was 43.88 while the DCN for cert-diesel was 43.76 showing negligible difference.
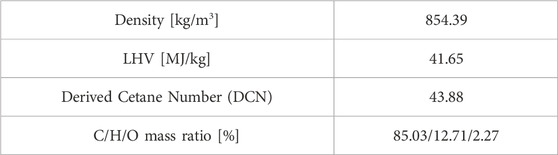
Table 3. Properties of the B20.
2.2 Test equipment
Table 4 presents the selected features of the test engine. An 8-cylinder 2015 Model Year (MY) Ford 6.7 L Powerstroke turbodiesel engine is used for the current work. The engine is turbocharged with a single variable geometry turbocharger (VGT). A high-pressure common rail fuel injection system with a maximum rail pressure of around 2,000 bar controlled the fuel injection via the ECU. The compression ratio is 16.2. For emissions treatment, EGR with high-pressure EGR loop, and the after-treatment system composed of diesel oxidation catalyst (DOC), selective catalytic reducer (SCR) and DPF are used. For the current study, the DPF is replaced with an empty steel can to set the back pressure at ambient. The commercial vehicle application of the test engine is Ford F-250 or 350 medium-duty pickup truck of which gross vehicle weight rating (GVWR) is class 2b (8,501-10,000 lbs) or class 3 (10,001-14,000 lbs).
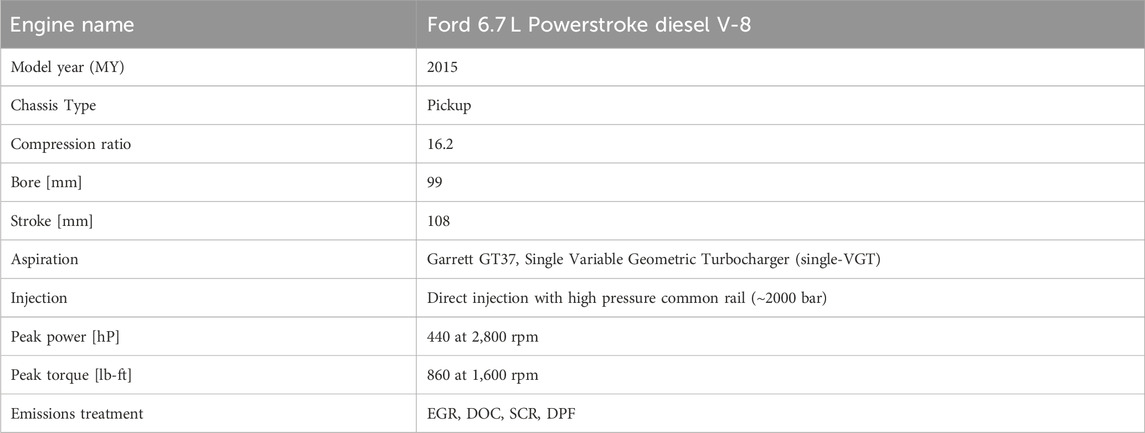
Table 4. Test engine specifications.
Figure 1 is a schematic describing the air flow, EGR flow, and fuel flow inside the test engine. The fresh air first passes through the compressor part of the turbocharger, and it is cooled through the charged air cooler (CAC), then, it mixes with the EGR gas after a throttle valve. The throttle valve is set to 100% wide-open except for one operating condition which will be mentioned in Section 2.3. Test Conditions. Mass flow rate of the intake gas (
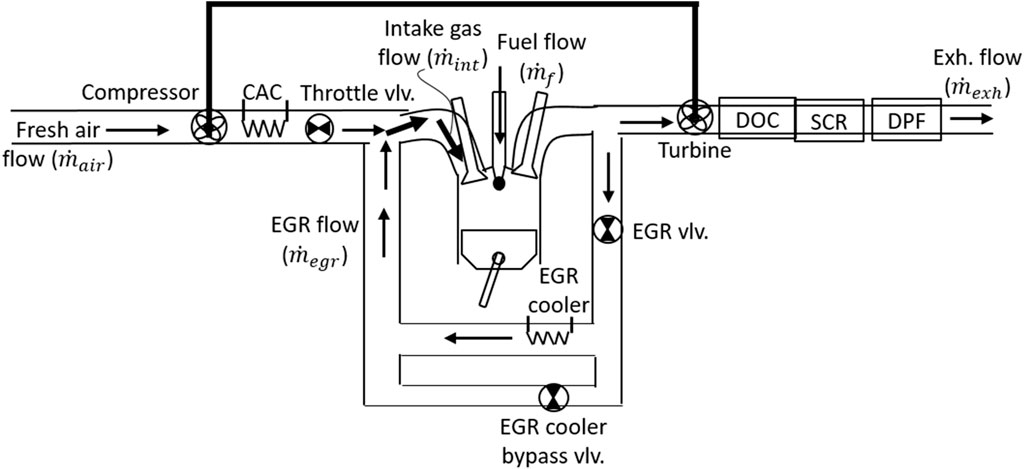
Figure 1. Schematic of the flows of the fresh air, EGR, and fuel inside the test engine.
Intake air temperature and relative humidity is controlled by a combustion air unit (36°C ± 2°C, 25% ± 5% relative humidity). The fresh air from the combustion air unit passes through a laminar flow element (LFE) where the differential pressure over the element is measured and used for the estimation of the mass flow rate of the intake air (
The CAC exit temperature is held constant for each operating condition regardless of the fuel type. The exhaust gas is sampled between the turbine exit and the DOC inlet to measure the engine-out emissions. A fraction of the exhaust gas is sampled by the AVL415S smoke meter for Filter Smoke Number (FSN) measurement while another fraction of the exhaust gas is sampled by an emissions sampling cart, which, then, is analyzed by the AVL SESAM i60FT S2 emissions bench.
The gaseous emissions measured from the exhaust gas sample include total hydrocarbons (THC) using Flame Ionization Detector (FID), CO and NOx using Fourier Transform Infrared Spectroscopy (FTIR), and exhaust O2 using Paramagnetic Detector (O2 PMD). The mole fractions of the above species in the exhaust gas were measured in the unit of parts per million (ppm).
To measure EGR rate, intake gas manifold is sampled downstream of the EGR mixing point. The sampled intake gas passes through the intake sampling cart, then, to the intake CO2 analyzer in the emissions bench. Intake CO2 mole fraction is measured on a dry-mole basis. Thus, to calculate EGR rate on a dry-mole basis, the exhaust CO2 mole fraction measured in a wet-mole basis is also converted into the dry-mole basis.
In-cylinder pressure traces of all eight cylinders are measured by piezoelectric pressure sensors in each of the eight cylinders. Apparent heat release rate and mass burn fraction angles are calculated from the in-cylinder pressure trace based on the first law analysis (Heywood, 1988a).
For data measurement and control interfaces, ETAS INCA software is used to control the ECU input parameters such as EGR rate, engine boost pressure, rail pressure, injection quantity and timing. AVL Indicom software is used to measure the in-cylinder pressure and the parameters relevant to the in-cylinder pressure (e.g., heat release rate, burn fraction angles, mean effective pressures). Other parameters such as compressor inlet temperature and intake manifold temperature are measured and controlled by AVL PUMA interface. The engine coolant temperature was maintained constant at around 90°C (±2°C) and this helped setting the oil temperature constant for each operating condition. Additional information on the test apparatus and procedure can be found elsewhere (Kim, 2020).
2.3 Test conditions
The test engine is subject to either class 2b (8,501-10,000 lbs.) or class 3 (10,001-14,000 lbs.) pickup trucks. These gross vehicle weight ratings (GVWRs) are subject to the 2010 Heavy Duty (HD) chassis certification standard for the criteria pollutants emissions control and to the Phase 1 HD GHG emissions standard for the GHG emissions control. The relevant certification test cycle for both standards is the Environmental Protection Agency (EPA) Federal Test Protocol 75 (FTP 75).
To make a valid comparison of the engine-out emissions between the conventional petroleum-based diesel and B20 at warmed-up, steady-state conditions, the FTP 75 cycle is converted into the six-representative steady-state operating conditions. Table 5 presents the engine speed, brake torque, BMEP, and the default ECU settings for those six points. These six points are defined as the “Mini-map” (MM) points in the current study The emissions, engine combustion noise level (CNL), and BFE of the petroleum-based diesel fuel and B20 will be compared at these 6 MM points.
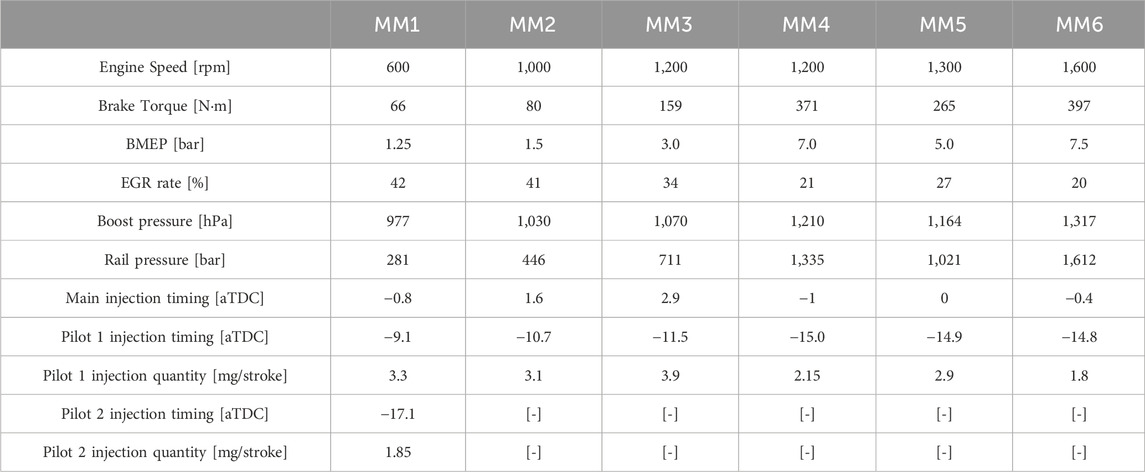
Table 5. Test engine operating conditions and the default ECU settings for 6 MM points.
These MM points are obtained by using the engine cycle analyzer in ETAS ASCMO software. It converts the “speed (mph)–time (s)” trace of the FTP 75 cycle to the “brake torque (N·m)–engine speed (rpm)” trace using the experimental data input given by the user. Ford Motor Company conducted the conversion of the FTP 75 certification cycle corresponding to the test engine to the 6 MM points for the current study, and provided the weight factor for each MM point to simulate the emissions from the FTP 75 cycle.
A set of output parameters are chosen to evaluate the degree of the pump-to-wheels (PTW) GHG emissions reduction from B20 while satisfying other bound criteria such as brake specific (BS) emissions and CNL. The set of output parameters include BFE, BS carbon dioxide (BSCO2) emissions, BSNOx emissions, BS particulate matter (BSPM) emissions, BS carbon monoxide (BSCO) emissions, BS total hydrocarbons (BSTHC) emissions, and CNL.
The BFE in this study is defined as “
Now, energy use per mile (i.e., MJ/mile) of a vehicle is dependent on engine BFE assuming all energy efficiencies converting crankshaft energy to the kinetic energy of a vehicle, which makes BFE a parameter representing the PTW GHG emissions reduction on a gCO2e/mile basis.
Since the fuel mass flow meter measurement inaccuracy is increased at lower loads, BSCO2 from the direct CO2 measurement using the emissions bench is used to confirm the reliability of the BFE measurement. In other words, BSCO2 emission is used as a secondary output parameter to judge the PTW GHG emissions reduction per mile at lower loads. In case the BFE measurement has statistically meaningful discrepancy from the BSCO2 measurement (especially at lower loads), both BFE and BSCO2 are used as the final parameters to determine whether the PTW GHG emissions have been reduced or increased with B20 application.
Four BS emissions of the criteria pollutants defined by the U. S. EPA (i.e., NOx, PM, CO, THC) are used as the output parameters to maintain the criteria pollutant emissions under the certification standard (U. S. Environmental Protection Agency, 2020). The BS emissions of the baseline were used as the upper bounds for the recalibrated ECU settings. Out of the four criteria pollutants BS emissions, BSNOx and BSPM were of the primary interest. Thus, they are set to be the bound criteria for all 6 MM points. BSTHC and BSCO were of secondary interest. Thus, BSTHC is set to be the bound criteria only for lower loads (i.e., MMs 1-3) where THC emissions are at appreciable level. BSCO emission is set to be the “weak” bound criteria for all 6 MM points, thus allowing BSCO at the re-calibrated ECU to exceed up to moderate and acceptable degree.
Since engine noise level is one of the critical factors affecting the commercial value of the engine, the baseline CNL is also used as a bound criterion. It is set to be the bound criteria for all 6 MM points with 0.5–1 dB allowance.
A set of input parameters are chosen as shown in Table 5 to vary the PTW combustion process. The chosen input parameters are EGR rate, intake boost pressure, fuel injection rail pressure, MIT, PIQ, and relative distance between main injection timing and pilot injection timings (RPIT). For MM1, two pilot injection events are applied, and the far pilot from the main injection event is defined as the pilot2 injection while the close pilot event is defined as the pilot one injection. For MMs 2-6, only one pilot injection event is applied. Thus, the total number of the input parameters were eight for MM1 (i.e., EGR rate, boost pressure, rail pressure, MIT, RPIT1, PIQ1, RPIT2, PIQ2) and six for MMs 2-6. More details regarding test methods and approach used are available in the previous work (Heywood, 1988a).
2.4 Optimization of ECU settings
Design of Experiment (DOE) is a method to efficiently plan the testing conditions of which measurement results will be used for the modeling of the impact of multiple input parameters on the measured results. In a conventional “sweep” test planning, if we want to investigate the impact of “n” different input variables on an output variable and need “m” test conditions per each input variable, the total number of data points required becomes “mn”, which can be a huge number depending on the scale of “m” and/or “n”. However, instead of the sweep test planning, the current study used a “space-filling” DOE method that fills up the n-dimensional input variable space with the least number of combinations of the input variables. In this study, the “ETAS ASCMO Static Test Planning” is used for the DOE. The software set 72 data acquisition points to model the impact of six input parameters at the MMs 2-6 and required 120 data points to model the impact of eight input parameters at MM1.
The ranges of the input parameters used in DOE are set as follows. First, regarding the range of EGR rate, the lowest and highest achievable EGR rate at each MM point for the baseline diesel are used. Second, for boost pressure, the turbo-vane position corresponding to the “low boost pressure” and “high boost pressure” at default EGR setting is used as the lower and upper limit of the boost pressure range, respectively, in DOE. The use of turbo-vane position instead of the direct use of the boost pressure was to avoid inoperable combinations of the EGR and boost pressure. Third, the rail pressure corresponding to the 80% and 120% of the default rail pressure setting is used as the lower and upper limits of the range of rail pressure, respectively, in our DOE. Fourth, 5° advanced and retarded injection timings from the default MIT at each MM point are used as the lower and upper limits of the MIT range, respectively, in DOE. Fifth, 1.5–4.0 mg/stroke is used as the range of PIQ1 for all 6 MM points. Then, the same range is applied for PIQ2 at MM1. Lastly, 8–17 CAs is used as the range of the relative distance between MIT and PIT1 in MMs 2-6 while 5–10 CAs is used as the range of the relative distance between MIT and PIT1 and relative distance between PIT1 and PIT2 at MM1.
After the test is conducted at all DOE data points, the test result is used to model the impact of the ECU input parameters by using the “ETAS ASCMO Static Modeling and Optimization” software. The software takes the measurement results in and uses a “Gaussian Process” to model the correlation between the input and output parameters. The Gaussian Process is different from conventional “parametric methods” that have a fixed number of correlation coefficients to fit the data points. It is a non-parametric method that predicts the output result at each input condition with a Gaussian distribution. Thus, it can flexibly determine the number of correlation coefficients and the type of correlation functions depending on the size of the data set and can also put different weights on different training data points.
Once a model is established, “cross-validation” can be conducted in the software to determine the statistical quality of the established model. One of the most common cross-validation methods is the “Leave-One-Out” (LOO) validation where the model is established with N-1 data points (where N is the number of the total training data points) and a data point is left out for the cross validation. Then, the software conducts N times of the LOO validation for each left-out data point and calculates the averaged measures to determine the statistical quality of the model. Based on this LOO validation method, there were several parameters provided from the software regarding the statistical quality of the model. Additional detail on the optimization process, data processing and experimental approach to the “DOE” process and validation are provided elsewhere (Heywood, 1988a).
3 Results and discussion
3.1 Diesel baseline
The baseline experimental results with diesel using four different sweep parameters are presented in this section. The trends of BFE, BSNOx, and BSPM depending on boost pressure and MIT are presented in Figure 2 while those depending on EGR and rail pressure are presented in Figure 3. Both figures represent MM3 as an example. For the results at other MM points or output parameters, please refer to Kim (Heywood, 1988a).
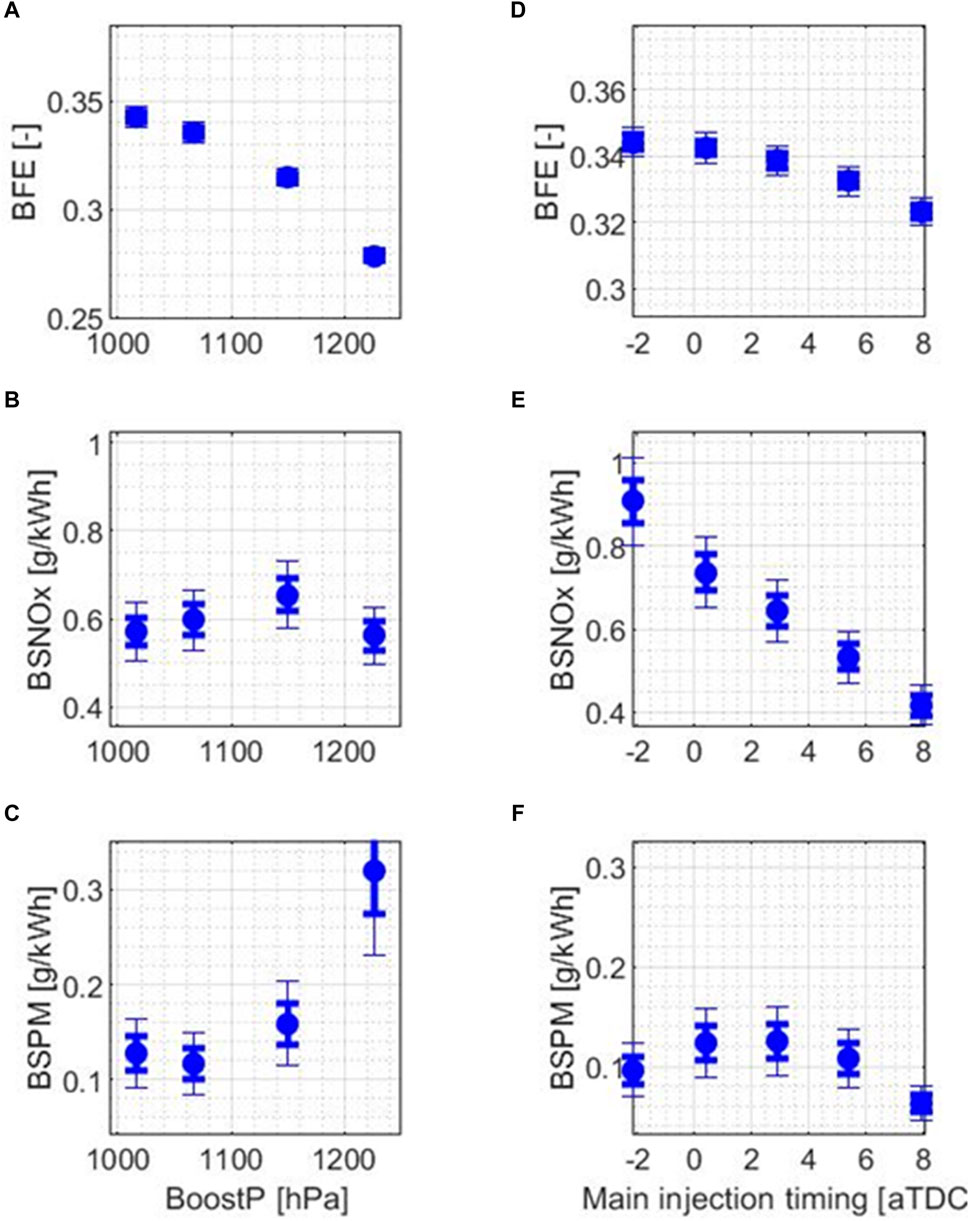
Figure 2. Impacts of boost pressure sweep on (A) BFE, (B) BSNOx, and (C) BSPM, and impacts of MIT sweep on (D) BFE, (E) BSNOx, and (F) BSPM. All results here are obtained at MM3.
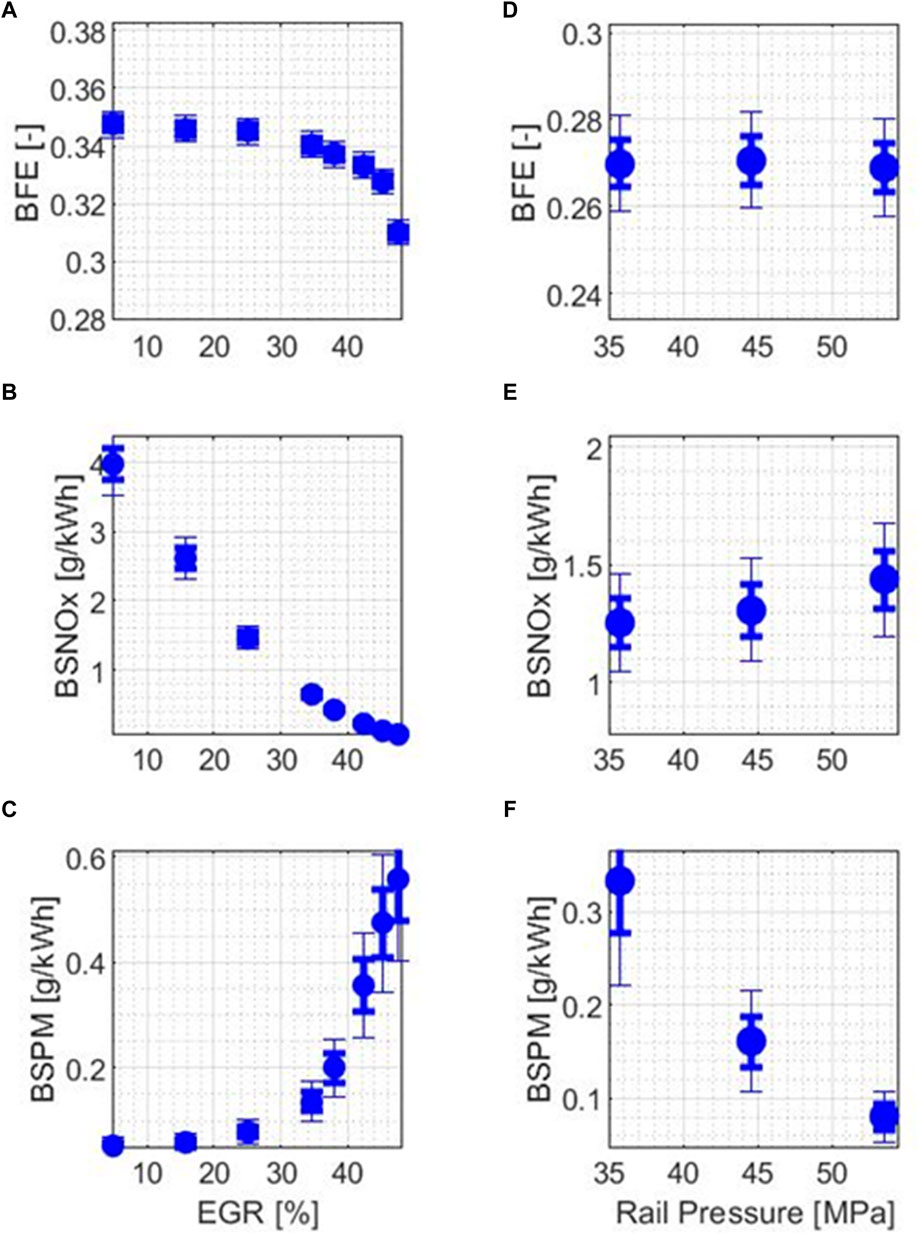
Figure 3. Impacts of EGR sweep on (A) BFE, (B) BSNOx, and (C) BSPM, and impacts of rail pressure sweep on (D) BFE, (E) BSNOx, and (F) BSPM. All results here are obtained at MM3.
In Figures 2A–C, we can see the impacts of boost pressure sweep on BFE, BSNOx, and BSPM, respectively. The BFE decreased with increasing boost pressure due to the increasing pumping loss. The increase in turbine inlet (exhaust valve exit) pressure must be greater than the increment in the intake charge pressure because of the 2nd law of thermodynamics. This results in the increase in the difference in cylinder intake and exhaust pressure, which generates more pumping loss (Heywood, 1988b). The BSNOx trend during the boost pressure sweep is affected by multiple factors, some of which competed with the others. The increase in boost pressure shortened the fuel ignition delay, and advanced the combustion phasing, which can potentially increase NOx emission (Benajes et al., 2004; Colban et al., 2007). However, the increase in boost pressure can also decrease the air-fuel ratio in some operating conditions, thus resulting in the increase in overall equivalence ratio of the charge gas. This could potentially decrease NOx emissions (Heywood, 1988b). In addition, since NOx emissions are also dependent on the local equivalence ratio inside the fuel-rich premixed auto-ignition zone (Ye and Boehman, 2012), the trend of NOx by boost pressure could not be generalized across different MM points. The BSPM trend during the boost pressure sweep could not be generalized across different MM points due to the similar reasons explained above for BSNOx.
In Figures 2D–F, we can see the impacts of MIT sweep on BFE, BSNOx, and BSPM, respectively. During the MIT sweep, the BFE generally increased with the advance in MIT, which was consistent with the results reported in the previous research (Yehliu et al., 2010). This is because the main combustion phasing occurs after Top Dead Center (TDC) with the default MIT setting. Thus, the advance in MIT caused the main combustion phasing to be closer to TDC, which made the main combustion event more like a constant-volume process. Furthermore, with the main start of combustion (SOC) being closer to TDC, the actual compression ratio also increased. These two factors both contributed to the increase in the gross indicated thermal efficiency, thus resulting in the increase in BFE (Pulkrabek, 2004). The BSNOx generally increased with the advance in MIT, which was consistent with the results reported in the previous research (Szybist et al., 2007). Although different MITs can change the initial charge gas temperature at the SOC and affect the NOx generation “rate”, the change in the “duration” of NOx generation is the dominant factor in BSNOx change during the MIT sweep (Pulkrabek, 2004). Since the advanced MIT subsequently advanced the SOC, this allowed more duration for the charge gas to be at high temperature resulting in higher BSNOx emissions. The BSPM generally peaked around the default MIT and decreased for both advanced and retarded MITs. This trend occurred because the oxygen ratio (i.e., the inverse of the local oxygen equivalence ratio, or the ratio of local oxygen presence to the required total oxygen to burn all the injected fuel by stoichiometric combustion) at the lift-off length became minimum around the default MIT, while it increased for both advanced and retarded MITs. The charge gas temperature during the ignition delay peaked around the default MIT, while the other factors affecting the lift-off length (i.e., charge gas density, stoichiometric mixture fraction, fuel jet velocity, injector nozzle hole diameter) remained similar. The high charge gas temperature shortened the lift-off length and resulted in the lowest oxygen ratio around the default injection timing (Pickett et al., 2005). Then, the low oxygen ratio resulted in higher PM generation at default MIT (Ye and Boehman, 2012). A detailed explanation on the fundamentals of lift-off length and oxygen ratio in compression ignition engines and their impact on NOx and PM emission can be found in Kim (Heywood, 1988a).
In Figures 3A–C, we can see the impacts of EGR sweep on BFE, BSNOx, and BSPM, respectively. During the EGR sweep, the BFE generally decreased with increasing EGR rate, which was consistent with the previously reported results (Divekar et al., 2015; De Serio et al., 2017). This is because the 2nd law efficiency of the turbine decreased at a higher EGR rate due to the lower mass flow rate of the exhaust gas through the turbine. It resulted in a higher increment of the turbine inlet pressure to achieve certain increment in the intake boost pressure, which simply means higher pumping loss. The BSNOx generally decreased with increased EGR rate, which was consistent with the results reported in previous study (De Serio et al., 2017). There were two main reasons for the trend. First, increased EGR rate decreased the intake O2 concentration, and the diluted O2 concentration decreased NOx generation rate. Second, since the heat capacity of the tri-atomic molecules (i.e., CO2, H2O) contained in EGR gas is higher than that of the di-atomics (i.e., O2, N2) in the fresh air, the charge gas was thermally diluted with the increase in EGR, thus resulting in lower charge gas temperature suppressing the thermal NOx generation rate (Al-Qurashi et al., 2012). Furthermore, since diluted oxygen and thermal effect both delay the combustion phasing, less time was allowed for the charge gas to be at high temperature to generate NOx, thus resulting in the decrease in NOx emission. Oppositely, the BSPM generally increased with increasing EGR rate because the overall charge intake O2 concentration decreases with EGR rate increase (De Serio et al., 2017). Also, the oxygen equivalence ratio at the liftoff length usually increased with the increase in EGR (Ye and Boehman, 2012), thus resulting in the PM increase in fuel-rich premixed auto-ignition zone.
In Figures 3D–F, we can see the impacts of rail pressure sweep on BFE, BSNOx, and BSPM, respectively. During the rail pressure sweep, the BFE trend depended on different MM points. Increase in rail pressure can increase the friction loss due to the higher work required for fuel pump, but it can, at the same time, advance the combustion phasing by shortening the ignition delay (Yehliu et al., 2010), which, in turn, can increase the gross indicated thermal efficiency. Those competing factors resulted in different trends of BFE depending on different MM points. The BSNOx generally increased with the increase in rail pressure, which was consistent with the previously reported results (Yehliu et al., 2010). This is mainly because of the shortened ignition delay leading to the advance in SOC that allows longer duration of charge gas temperature being at the high temperature producing NOx. It is also because of the increase in fuel jet velocity causing the longer lift-off length (Ye and Boehman, 2012), which increased the oxygen ratio at the lift-off length. Because the lift-off length got longer with the increase in rail pressure causing the increase in the oxygen ratio at the lift-off length, BSPM generally decreased with the increase in rail pressure (Ye and Boehman, 2012). Better atomization of the fuel was another reason why the increase in rail pressure resulted in the decrease in BSPM.
3.2 Shifts in ECU setting with pedal angle increase with B20
The unintended shifts in ECU input parameters when B20 is applied are presented by Kim (Heywood, 1988a).
From MM1-MM4, the final BFE for B20 did not show statistically meaningful difference from the baseline BFE results. However, as shown in Figure 4, at a medium load (MM5) and the highest load (MM6) conditions, there were small improvements in BFE for B20. At MM5, the BFE was improved by 1.31%. At MM6, the BFE was improved by 1.08%. The improvements in BFE at different MM points are also used to calculate the final improvements in “MJ/mile” for B20 with the optimized ECU calibration.
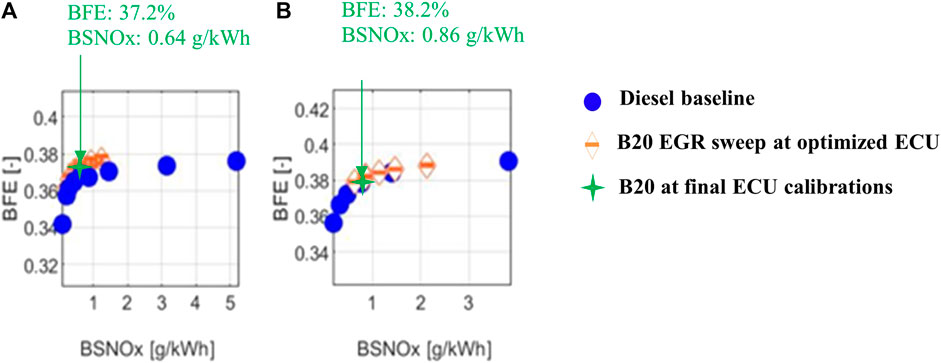
Figure 4. Trend of BFE and BSNOx during the EGR sweep with the optimized ECU calibrations for B20 at (A) MM5 and (B) MM6.
In addition, the significant reduction in BSNOx emissions (up to 53%) with either fixed or moderately decreased BSPM emissions were available at most MM points. At some of the MM points, significant reduction in BSPM (up to 37%) was available with fixed BSNOx emissions. One of the notable reasons for these reductions in BSNOx or BSPM was the optimized ECU calibration that fully utilized the benefits of the increased fuel injection volume for B20, which caused significant decrease in charge gas temperature. This decreased charge gas temperature subsequently caused significant reduction in lift-off length to result in greater PM benefit at NOx parity. Figure 4 shows the B20 test results for BFE and BSNOx at MM5 and MM6 at its final ECU calibration. An EGR sweep results are also presented for comparison purposes. Other emissions results such as BSPM and BSCO emissions with optimized ECU settings can be found in Kim (Heywood, 1988a).
3.3 Optimization results for B20
Figure 5 shows the final change in the ECU settings with B20 application at 6 MM points. Figure 5A shows the change in EGR rate (top-left), rail pressure (middle-left), PIQ1 (bottom-left), boost pressure (top-right), MIT (middle-right), and RPIT1 (bottom-right) at six different MM points while Figure 5B shows the change in PIQ2 and RPIT2 at MM1.
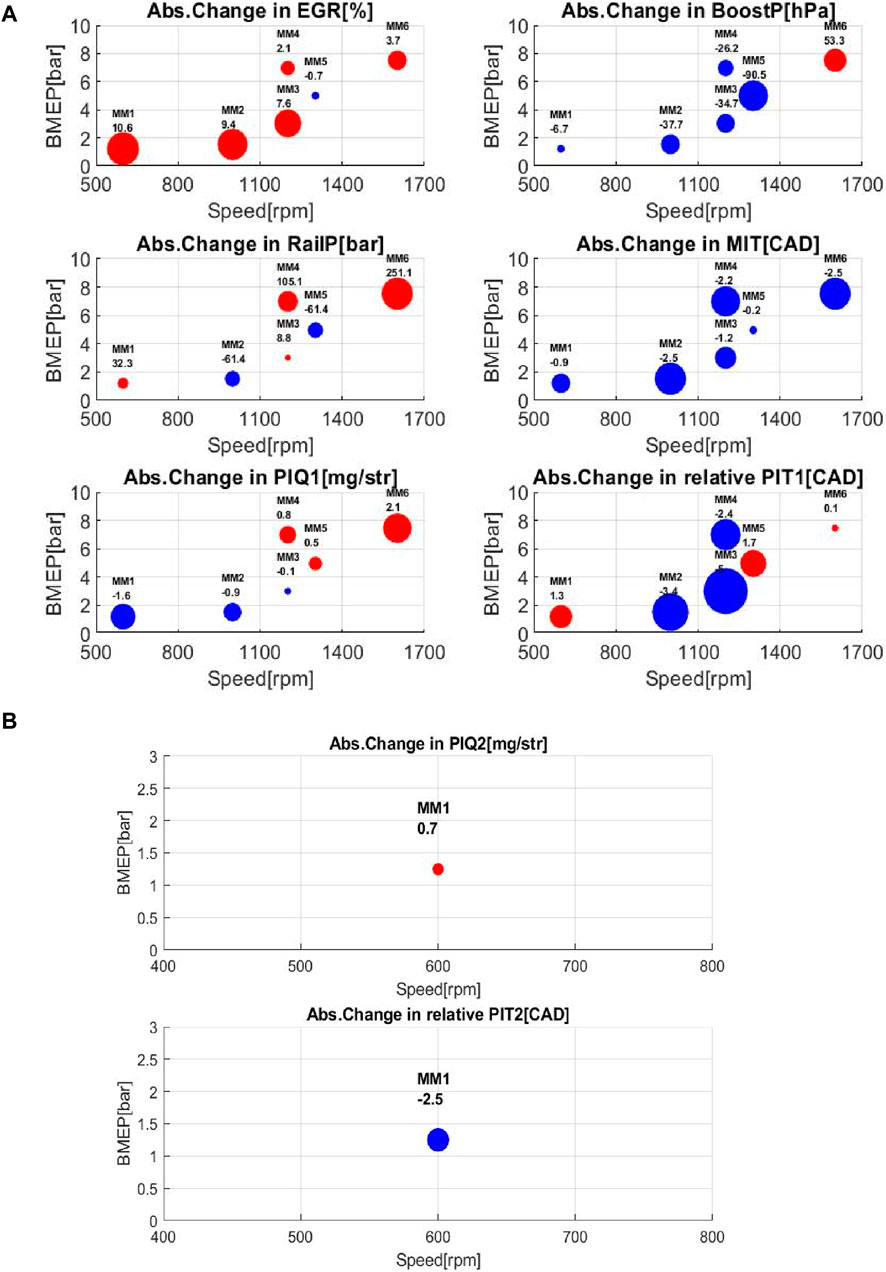
Figure 5. The optimized ECU settings for B20 application at different MM points. Change in (A) EGR, rail pressure, boost pressure, MIT, PIQ1, RPIT1 for MMs 1-6; (B) PIQ2 and RPIT2 for MM1.
The general trend in the optimized ECU settings across M M points provided understanding on how the recalibration achieved better BFE while satisfying other bound criteria. In terms of maximizing BFE, boost pressure and MIT are leveraged to improve BFE: at most MM points (MM1-5), the boost pressure was decreased almost down to the lowest boost pressure level achievable at the imposed EGR rate settings so that the BFE improvements from the boost pressure adjustment can be maximized. Meanwhile, MIT was advanced at all of the 6 MM points since the advance in MIT improved BFE at most MM points.
While boost pressure and MIT are mainly used to improve BFE, the shift in EGR settings was more focused on countering off the BSNOx increase caused by the B20’s impacts and/or by the impacts of the change in other ECU parameters (e.g., advance in MIT). This is why the EGR rate was increased in most MM points while it could be decreased exceptionally at MM5. Since MM5 had neither an aggressive advance in MIT nor statistically meaningful increase in NOx due to B20 at the default ECU settings, the EGR rate could rather be reduced at MM5 to get further improvements in BFE. More detailed explanation on the ECU recalibration results for B20 is available in Kim (Heywood, 1988a).
3.4 Implications for life cycle GHG emissions reduction
3.4.1 GHG emissions reduction in PTW combustion process
Table 6 shows the comparisons in BFE and BSCO2 for the two fuels at different ECU calibrations: baseline diesel at the default ECU calibration vs. B20 at the optimized ECU calibration. The mean difference in BFE and BSCO2 between the two fuels is provided in the table in both absolute and relative differences. The standard deviation shown in the table is the sum of standard deviation of the multiple (3-8 points) repeat points measurements for the baseline fuel at the default ECU calibration and the standard deviation of the multiple (3-4 points) repeat points measurements for B20 with the optimized ECU calibration. It is the measure of the difference in BFE or BSCO2 between the two fuels guaranteeing 68% statistical confidence: if the mean difference in BFE or BSCO2 between the two fuels is greater than the standard deviation, it is more than 68% sure that the difference will be repeated in the next data set obtained. Each MM point in Table 6 is color-coded differently. For each MM point, if there was no statistically meaningful difference in BFE or BSCO2 between the two fuels, the MM point is colored grey. If BFE or BSCO2 is improved or worsened with statistical significance, the MM point is colored blue or red.
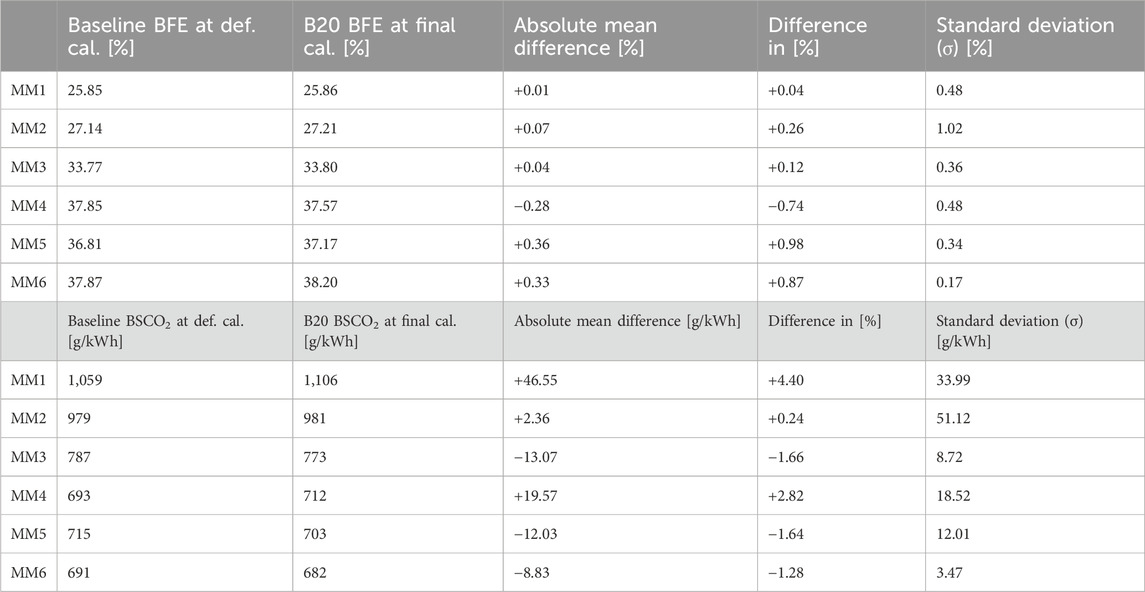
Table 6. Comparison of BFE and BSCO2 for the two fuels at the optimized ECU calibrations of each fuel.
As a result, MMs 1-4 turned out to have no statistically meaningful differences in BFE between the two fuels. Thus, these 4 MM points are concluded to have no differences in the energy requirement per unit travelling distance (i.e., “MJ/mile”) between the two fuels.
MM5 achieved absolute 0.36% improvement in BFE for B20, which is similar to the standard deviation of the repeated measurements of BFE at that MM point (i.e., 0.34%). The absolute 0.36% improvement in BFE at MM5 corresponds to relative 0.98% improvement in BFE as compared to the baseline. Also, BSCO2 from MM5 for B20 was 12.03 g/kWh lower than the baseline result, which was similar to the standard deviation of the repeated measurements of BSCO2 at the MM point (i.e., 12.01 g/kWh). Therefore, at MM5, it is concluded that the MJ/mile metric is improved for B20 by relative 0.98 (based on BFE) - 1.64% (based on BSCO2) from the baseline with low statistical confidence (∼68%). In conclusion, there was relative 1.31% (average of the BFE and BSCO2 results) improvement in “MJ/mile” for B20 with the optimized ECU calibration at MM5.
At MM6, both BFE and BSCO2 had statistically meaningful improvements with high statistical confidence when B20 is applied with the final ECU calibration. BFE was increased by absolute 0.33% for B20 with the final ECU calibration, which was relative 0.87% improvement from the baseline fuel. The degree of improvement in BFE was almost twice of the standard deviation of the repeated BFE measurements at MM6, thus guaranteeing statistical confidence of about 95%. BSCO2 emissions for B20 with the final ECU calibration were decreased by 8.83 g/kWh, which was also greater than twice of the standard deviation of the repeated BSCO2 measurements at MM6. Therefore, it is concluded that, at MM6, B20 achieved the relative 0.87%–1.28% improvement (1.08% on average) in “MJ/mile” as compared to the baseline with statistical confidence of about 95%.
One thing to note in Table 6 is that, at MM1, there was a noticeable difference between when BFE was compared for the two fuels and when BSCO2 was compared for the two fuels. Although the BFE for B20 was improved by relative 0.04% at MM1, BSCO2 for B20 was increased by 4.4% at MM1. This was because of the particularly high measurement inaccuracy for both BFE and BSCO2 at MM1. At idling condition, the fuel flow rate becomes much lower than other operating conditions, which resulted in the increase in fuel flow rate measurement inaccuracy. This, in turn, increased inaccuracy in the BFE calculation. Also, the variation in brake torque setting became greater at MM1 causing greater noise in emissions measurement including CO2. This increased inaccuracy in the BSCO2 measurement as well. There was a difference in the degree of BFE measurement errors for B20 and baseline diesel fuel. Based on a carbon balance error calculation, fuel mass flow rate was more underestimated with B20 than with diesel. The more significant underestimation in the fuel flow rate with B20 could have made a positive bias on the BFE for B20 over the baseline diesel fuel.
Table 7 provides the weight factors for each MM point used to estimate the performance and emissions from the FTP 75 certification cycle. MM3 has the highest weight on the certification cycle followed by MM6, MM5, MM2, MM1, and lastly by MM4. The PTW GHG emissions reduction from the transient certification cycle can be estimated by the linear combination of the improvement in “MJ/mile” at each MM point with these weight factors.
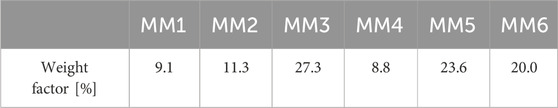
Table 7. Weight factors applied to each MM point to emulate the EPA FTP 75 certification cycle.
Equation 3 is used to estimate the reduction in the “MJ/mile” from FTP 75 transient cycle based on the performances at different MM points. “WF” denotes the weight factor at each MM point while the subscript “i” denotes the MM point “i”.
If there is no statistically meaningful difference in “MJ/mile” between the two fuels at certain MM point, the “MJ/mile” improvement is assumed to be zero at that MM point. The only 2 MM points with statistically meaningful “MJ/mile” were MM5 and MM6. By combining the relative 1.31% improvement at MM5 and 1.08% improvement at MM6 with the weight factors presented in Table 7, relative 0.53% improvement in “MJ/mile” for B20 during the FTP 75 certification cycle was achieved.
The previous studies similar to the current study include the work by Millo et al. (Millo et al., 2011) and Omari et al. (Murr et al., 2011). Millo et al. (Al-Qurashi et al., 2012) compares the criteria pollutant emissions between different biodiesel blends (i.e., B30s and B100s from Rapeseed oil and Jatropha oil) and petroleum-based diesel at the optimized ECU calibration for each fuel. However, their ECU optimization was focused on maximizing the PM reduction at NOx parity than maximizing the BFE to minimize the GHG emissions from the PTW combustion processes. Thus, the improvement in BFE with their optimized ECU calibration was not available from their work. Omari et al. (Murr et al., 2011) compared the BFE and emissions for hydrotreated vegetable oils (HVO) with those for the petroleum-based diesel at the optimized ECU calibrations for each fuel. However, due to the differences in the fuel properties between HVO and biodiesel, the implication on BFE or the GHG emissions improvement from HVO reported in their research should not be extended to the case of biodiesel. The current work is one of the few experimental results showing the improvements in “MJ/mile” for B20 with the comprehensively adjusted ECU calibration over a simulated certification cycle.
3.4.2 GHG emissions reduction from the WTW process
The relative 0.53% improvement in “MJ/mile” means that the optimized ECU calibration for B20 reduced the energy required for unit travelling distance by 0.53% when compared to the conventional diesel. To account for the overall GHGs reduction from WTW process on a “gCO2e/mile” basis, we also need to assess the GHGs reduction from the production and combustion of B20 on a “gCO2e/MJ” basis.
The WTW carbon intensity of B100 per unit energy is 30 gCO2e/MJ (including the biogenic benefit of biodiesel) while it is 95 gCO2e/MJ for the petroleum-based diesel (Chen et al., 2018). Based on these values, the WTW carbon intensity of B20 per unit energy (i.e., gCO2e/MJ) can be calculated as follows.
First of all, the mass fraction of biodiesel in B20 is calculated using Eq. 4.
In Equation 4,
In Equation 6,
As a result, the WTW carbon intensity of B20 per unit energy is calculated to be 82.9 gCO2e/MJ, which is 12.7% reduction from the petroleum-based diesel.
Regarding the WTW GHG emissions per unit travelling distance (i.e., gCO2e/mile), we need to account for the 0.53% savings in “MJ/mile” in addition to the 12.7% reduction in “gCO2e/MJ”. Therefore, there is 12.8% (=12.7%*1.0053) reduction in final WTW GHG emissions per unit travelling distance (i.e., gCO2e/mile) for B20 application with the final optimized ECU calibration.
4 Summary and conclusion
The GHG emissions reduction impact of the B20 application in a production CI engine is investigated in this study. Four different sweep tests (i.e., EGR, boost pressure, rail pressure, MIT) are conducted for the baseline diesel and B20 at the product ECU settings at the six operating conditions (6 MM points) simulating EPA FTP 75 certification cycle to investigate the impacts of four ECU parameters and the impact of B20 on the output parameters of the interest (i.e., BFE, BSNOx, BSPM, BSTHC, BSCO, and CNL). The sweep test results re-confirm most of the well-known impacts of the EGR, boost pressure, rail pressure, and MIT on BFE, BS emissions, and CNL from the previous studies.
The final GHG emissions reduction for B20 with the optimized ECU calibration is measured and the underlying mechanism used by the optimization software to maximize BFE is also suggested in the current study. For MM1 - MM4, the final BFE for B20 did not show statistically meaningful difference from the baseline fuel. However, at MM5 and MM6, there was small improvement in BFE for B20. At MM5, the BFE is improved by 1.31%. At MM6, the BFE is improved by 1.08%. Combined with the weight factors to simulate the EPA FTP 75 cycle from these 6 MM points, 0.53% improvement on a MJ/mile basis is achieved for B20 with the final ECU calibration. Although the degree of improvement on a MJ/mile basis was relatively smaller than the degree of GHG emissions reduction on a gCO2e/MJ basis (∼12.5% reduction in gCO2e/MJ), this study proved that the application of B20 in a production CI engine with “optimized” calibrations can actually reduce GHG emissions in PTW combustion processes.
The optimization software mainly used “the decrease in boost pressure” and “the advance in MIT” to maximize BFE and reduce GHG emissions while mainly used “the increase in EGR rate” to counter off the potential NOx increase due to the fuel oxygen content in B20 and the impact of the change in the other ECU settings. Other ECU variables such as rail pressure, PIQ1, and RPIT1 seem to be used as secondary means to further improve BFE or to reduce other bound criteria parameters such as BS emissions and CNL. One of the notable observations made during the B20 testing with the final ECU calibration was that the sensitivity of the charge gas temperature on EGR rate is significantly increased. This was because the increased injected fuel moles of B20 have partially countered the decrease in the intake gas mole concentration with increasing EGR, thus resulting in the less apparent drop in total charge gas mole count with increasing EGR when B20 is applied. Then, the less apparent decrease in charge gas mole concentration significantly decreased the charge gas temperature with increasing EGR rate, which eventually increased the lift-off length and oxygen ratio at the lift-off length to result in significant reduction in BSPM emissions. It is suggested that the optimization software was able to locate this optimized ECU setting where the impact of increased fuel injection volume of B20 could be exaggerated enough to bring the best PM benefits, which, in turn, could be used to maximize the BFE while satisfying the BSNOx bound criteria.
To further reduce the GHG emissions from the PTW combustion processes of B20 in CI engines, the future work is suggested to be focused on the following two directions. First, the application of higher blends of biodiesel (i.e., >B20) is recommended because it provides more aggressive fuel oxygen content from biodiesel and the more aggressive increase in fuel injection volume, both of which can increase the oxygen ratio at the lift-off length more intensely to result in further PM benefit. Then, this decrease in PM could potentially be leveraged to further improve the BFE. This strategy would work the best for the lower load conditions due to the importance of oxygen ratio in the fuel-rich premixed auto-ignition zone for the lower load conditions. Second, the application of B20 or the similar level of blends at higher engine loads not covered in the current study (e.g., higher load conditions relevant to the engine-dyno certification) is recommended because the highest engine load covered in the current study (i.e., MM6) is still around 35% of the peak torque at its engine speed. According to Yehliu et al. (2010), high load conditions at around 75% of the peak torque showed the most exaggerated PM reduction effect of which underlying mechanism is different from the PM reduction observed in low-to-medium load conditions reported in the current work. Thus, investigating B20’s impact on such high load conditions will also narrow the research gap left from the current work.
Data availability statement
The raw data supporting the conclusion of this article will be made available by the authors, without undue reservation.
Author contributions
TK: Writing–original draft, Writing–review and editing, Data curation, Formal Analysis, Investigation, Methodology, Software, Validation. AB: Writing–original draft, Writing–review and editing, Funding acquisition, Project administration, Resources, Supervision.
Funding
The author(s) declare financial support was received for the research, authorship, and/or publication of this article. This program was funded by the Ford Motor Company through the Ford-UM Alliance program and by the National Biodiesel Board.
Acknowledgments
The authors would like to acknowledge and thank Eric Kurtz (formerly) and Waheed Alashe (formerly) of Ford Motor Company for their supervision of this work, technical assistance and encouragement. The authors wish to acknowledge the support and encouragement of Steve Howell of the Clean Fuels Alliance (formerly the National Biodiesel Board) and Dr. Robert McCormick of the National Renewable Energy Laboratory for their technical support, guidance and encouragement, as well. The authors thank Profs. Herek Clack, Angela Violi and Margaret Wooldridge for their participation in the doctoral committee for TK.
Conflict of interest
The authors declare that the research was conducted in the absence of any commercial or financial relationships that could be construed as a potential conflict of interest.
Publisher’s note
All claims expressed in this article are solely those of the authors and do not necessarily represent those of their affiliated organizations, or those of the publisher, the editors and the reviewers. Any product that may be evaluated in this article, or claim that may be made by its manufacturer, is not guaranteed or endorsed by the publisher.
References
Al-Qurashi, K., Zhang, Y., and Boehman, A. (2012). Impact of intake CO2 addition and exhaust gas recirculation on NOx emissions and soot reactivity in a common rail diesel engine. Energy and Fuels 26, 6098–6105. doi:10.1021/ef201120f
ASTM (2023). Standard test method for determination of derived cetane number (DCN) of diesel fuel oils—ignition delay and combustion delay using a constant volume combustion chamber method. ASTM d7668-17. Available at: https://www.astm.org/d7668-17.html.
Benajes, J., Molina, S., Garcia, J. M., and Novella, R. (2004). Influence of boost pressure and injection pressure on combustion process and exhaust emissions in a HD diesel engine. SAE Tech. Pap., doi:10.4271/2004-01-1842
Campbell, P., Beer, T., and Batten, D. (2011). Life cycle assessment of biodiesel production from microalgae in ponds. Bioresour. Technol. 102, 50–56. doi:10.1016/j.biortech.2010.06.048
Chen, R., Qin, Z., Han, J., Wang, M., Taheripour, F., Tyner, W., et al. (2018). Life cycle energy and greenhouse gas emission effects of biodiesel in the United States with induced land use change impacts. Bioresour. Technol. 251, 249–258. doi:10.1016/j.biortech.2017.12.031
Colban, W. F., Miles, P. C., and Oh, S. (2007). Effect of intake pressure on performance and emissions in an automotive diesel engine operating in low temperature combustion regimes. SAE Tech. Pap. doi:10.4271/2007-01-4063
De Serio, D., de Oliveira, A., and Sodre, J. R. (2017). Effects of EGR rate on performance and emissions of a diesel power generator fueled by B7. J. Braz. Soc. Mech. Sci. Eng. 39, 1919–1927. doi:10.1007/s40430-017-0777-x
Divekar, P., Yang, Z., Ting, D., Chen, X., Zheng, M., and Tjong, J. (2015). Efficiency and emission trade-off in diesel-ethanol low temperature combustion cycles. SAE Tech. Pap. doi:10.4271/2015-01-0845
DOE (2020). Monthly biodiesel production report (with data for may 2020). Washington, D. C.: U. S. Energy Information Administration (EIA) in U. S. Department of Energy DOE.
Fang, H., and McCormick, R. (2006). Spectroscopic study of biodiesel degradation pathways. SAE Tech. Pap. doi:10.4271/2006-01-3300
Graboski, M., and McCormick, R. (1998). Combustion of fat and vegetable oil derived fuels in diesel engines. Prog. Energy Combust. Sci. 24, 125–164. doi:10.1016/s0360-1285(97)00034-8
Hermitte, E., Lunati, A., and Delebinski, T. (2012). Onboard optimisation of engine emissions and ConsumptionAccording to diesel fuel quality. SAE Tech. Pap. 5, 1661–1683. doi:10.4271/2012-01-1694
Heywood, J. (1988a). Chapter 10: combustion in compression-ignition engines. Internal combustion engine fundamentals. Singapore: McGraw Hill, 509–514.
Heywood, J. (1988b). Chapter 6: gas exchange processes. Internal combustion engine fundamentals. Singapore: McGraw Hill, 249–253.
Huo, H., Wang, M., Bloyd, C., and Putsche, V. (2008). Life-cycle assessment of energy and greenhouse gas effects of soybean-derived biodiesel and renewable fuels; ANL/ESD/08-2. Lemont, IL: Argonne National Laboratory.
Kim, T. (2020). Greenhouse gas reduction via Co-optimization of alternative diesel fuels with compression ignition engines. Ph.D. Thesis, department of mechanical engineering, university of Michigan. Available at: https://deepblue.lib.umich.edu/handle/2027.42/167964.
Kurtz, E., Kuhel, D., Anderson, J., and Mueller, S. A. (2012). Comparison of combustion and emissions of diesel fuels and oxygenated fuels in a modern DI diesel engine. SAE Tech. Pap. doi:10.4271/2012-01-1695
Lapuerta, M., Armas, O., and Rodriguez-Fernandez, J. (2008). Effect of biodiesel fuels on diesel engine emissions. Prog. Energy Combust. Sci. 34, 198–223. doi:10.1016/j.pecs.2007.07.001
Lapuerta, M., Oliva, F., Agudelo, J., and Boehman, A. (2012). Effect of fuel on the soot nanostructure and consequences on loading and regeneration of diesel particulate filters. Combust. Flame 159, 844–853. doi:10.1016/j.combustflame.2011.09.003
Larsson, M., and Denbratt, I. (2007). Combustion of fischer-tropsch, RME and conventional fuels in a heavy-duty diesel engine. SAE Tech. Pap. doi:10.4271/2007-01-4009
Mejia, A., Leiva, M., Rincon-Montenegro, A., Gonzalez-Quiroga, A., and Duarte-Forero, J. (2020). Experimental assessment of emissions maps of a single-cylinder compression ignition engine powered by diesel and palm oil biodiesel-diesel fuel blends. Case Stud. Therm. Eng. 19, 100613. doi:10.1016/j.csite.2020.100613
Millo, F., Vezza, D., and Vlachos, T. (2011). Effects of rapeseed and Jatropha methyl ester on performance and emissions of a euro 5 small displacement automotive diesel engine. SAE Tech. Pap. doi:10.4271/2011-24-0109
Mueller, C., Boehman, A., and Martin, G. (2009). An experimental investigation of the origin of increased NOx emissions when fueling a heavy-duty compression-ignition engine with soy biodiesel. SAE Tech. Pap. 2, 789–816. doi:10.4271/2009-01-1792
Murr, F., Winklhofer, E., and Friedl, H. (2011). Reducing emissions and improving fuel economy by optimized combustion of alternative fuels. SAE Tech. Pap. doi:10.4271/2011-28-0050
Nautiyal, P., Subramanian, K. A., and Dastidar, M. G. (2014). Production and Characterization of biodiesel from algae. Fuel Process. Technol. 120, 79–88. doi:10.1016/j.fuproc.2013.12.003
Pickett, L., Siebers, D., and Idicheria, C. (2005). Relationship between ignition processes and the lift-off length of diesel fuel jets. SAE Tech. Pap. doi:10.4271/2005-01-3843
Piloto-Rodriguez, R., Sanchez-Borroto, Y., Melo-Espinosa, E. A., and Verhelst, S. (2017). Assessment of diesel engine performance when fueled with biodiesel from algae and microalgae: an overview. Renew. Sustain. Energy Rev. 69, 833–842. doi:10.1016/j.rser.2016.11.015
Pulkrabek, W. (2004). Chapter3: engine cycles, engineering fundamentals of the internal combustion enigne. Upper Saddle River, NJ: Pearson, 113–118.
Sappok, A., and Wong, V. (2008). Impact of biodiesel on ash emissions and lubricant properties affecting fuel economy and engine wear: comparison with conventional diesel fuel. SAE Tech. Pap. 1, 731–747. doi:10.4271/2008-01-1395
Scott, S. A., Davey, M. P., Dennis, J. S., Horst, I., Howe, C. J., Lea-Smith, D. J., et al. (2010). Biodiesel from algae: challenges and prospects. Curr. Opin. Biotechnol. 21, 277–286. doi:10.1016/j.copbio.2010.03.005
Senatore, A., Cardone, M., Buono, D., Rocco, V., Allocca, L., and Vitolo, S. (2006). Performances and emissions optimization of a CR diesel engine fuelled with biodiesel. SAE Tech. Pap. doi:10.4271/2006-01-0235
Shinde, S., and Yadav, S. D. (2016). Theoretical properties prediction of diesel-biodiesel-DEE blend as a fuel for C.I. Engine with required modifications for optimum performance. Int. J. Curr. Eng. Technol. 6, 1562–1567.
Szybist, J., Song, J., Alam, M., and Boehman, A. (2007). Biodiesel combustion, emissions and emission control. Fuel Process. Technol. 88, 679–691. doi:10.1016/j.fuproc.2006.12.008
Thanh, L. T., Okitsu, K., Van Boi, L., and Maeda, Y. (2012). Catalytic technologies for biodiesel fuel production and utilization of glycerol: a review. Catalysts 2, 191–222. doi:10.3390/catal2010191
U. S. Environmental Protection Agency (2020). EPA home page. Available at: https://www.epa.gov/criteria-air-pollutants (Accessed on August 19, 2020).
Wallington, T., Anderson, J., Kurtz, E., and Tennison, P. (2016). Biofuels, vehicle emissions, and urban air quality. Faraday Discuss. 189, 121–136. doi:10.1039/c5fd00205b
Xu, H., Ou, L., Li, Y., Hawkins, T. R., and Wang, M. (2022). Life cycle greenhouse gas emissions of biodiesel and renewable diesel production in the United States. Environ. Sci. Technol. 56, 7512–7521. doi:10.1021/acs.est.2c00289
Ye, P., and Boehman, A. (2012). An investigation of the impact of injection strategy and biodiesel on engine NOx and particulate matter emissions with a common-rail turbocharged DI diesel engine. Fuel 97, 476–488. doi:10.1016/j.fuel.2012.02.021
Ye, P., Prabhakar, B., and Boehman, A. L. (2013). Experimental investigation of the impact of post-injection on emissions, combustion and lubricant dilution in a diesel engine with B20 fuel. Int. J. Engine Res. 14, 12–22. doi:10.1177/1468087412439837
Keywords: biodiesel, B20, optimization, greenhouse gas, diesel, renewable fuel
Citation: Kim T and Boehman AL (2024) Greenhouse gas reduction in a medium-duty compression ignition engine with optimization for B20. Front. Mech. Eng 10:1376038. doi: 10.3389/fmech.2024.1376038
Received: 24 January 2024; Accepted: 08 April 2024;
Published: 02 May 2024.
Edited by:
Carlos Micó, Universitat Politècnica de València, SpainReviewed by:
Andrea Piano, Polytechnic University of Turin, ItalyTiemin Xuan, Jiangsu University, China
Enrique Sanchis, Universitat Politècnica de València, Spain
Francisco Javier García Gámez, Universitat Politècnica de València, Spain, in collaboration with reviewer ES
Copyright © 2024 Kim and Boehman. This is an open-access article distributed under the terms of the Creative Commons Attribution License (CC BY). The use, distribution or reproduction in other forums is permitted, provided the original author(s) and the copyright owner(s) are credited and that the original publication in this journal is cited, in accordance with accepted academic practice. No use, distribution or reproduction is permitted which does not comply with these terms.
*Correspondence: André L. Boehman, boehman@umich.edu