Technical and economic evaluation of an engine and irrigation pump using a T-type mixer for natural gas
 Waleed Kamel ElHelew1*
  Abdallah Mahmoud Abdelmaqsoud2
  Khaleed Faran ElBagoury1
  Hayder AbdElHussein Shanan3*
- 1Department of Agricultural Engineering, Faculty of Agriculture, Ain Shams University, Cairo, Egypt
- 2Department of Agricultural Economics, Faculty of Agriculture, Ain Shams University, Cairo, Egypt
- 3Department of Agricultural Machines and Equipment, College of Agriculture, University of Basrah, Cairo, Egypt
Energy is regarded as one of the most crucial resources in the industrial process. Numerous measurements were made in the year 2021 in the workshops of the Agricultural Engineering Department, Faculty of Agriculture, Ain Shams University, Egypt, using a gasoline engine (single cylinder with air-cooling) that was used to power an irrigation pump with a discharge diameter of 2 inches, which was manufactured in Egypt. To combine natural gas and air before entering the engine, a variety of mixers were created. Four different types of mixers were employed with iron pipes of various sizes: 90° angle T-mixer (T90), 45° angle T-mixer (T45), 30° angle T-mixer (T30), and venture mixer (VM). The engine shift speeds were set at 1,750, 2,300, 2,900, and 3,500 rpm. The water pump was powered by natural gas and gasoline. The findings in this study focused on the evaluation of technical indicators for several types of mixers that combine natural gas and air to power an irrigation pump, where the actual power (braking power) is superior to all types while operating with gasoline (3.07 kW). A commensurability on every side the report of on the up steam, in the mixer type (T45) (2.83 kW) was 7.8% about than gasoline. The lowest specific fuel consumption (S.fc) for gasoline was 219.025 gm/Kw.h at an engine speed of 2,900 rpm. The T45 mixer had the lowest S.fc of 234.612 gm/KW.h, compared with other types of mixers at an engine speed of 2,900 rpm, an increase of 6.6% compared with gasoline. The T45 mixer had the highest pump discharge of 528.133 L/min, an increase of 2.1% compared with gasoline. Compared with other types of T-mixers, the T45 mixer had the highest actual hydraulic power of 0.6 kW, which was 10.5% lower than that of gasoline. As for the economic indicators, the T90 mixer had the lowest net present value (NPV) of 77219.5, and the T45 mixer had the highest NPV of 106900.7. The mixer-type VM had the lowest benefit–cost ratio (B/C) of 1.38, and the T45mixer had the highest B/C of 1.54.
1 Introduction
Energy plays a vital role in rural development. However, the price of oil has crossed $100 per barrel in the international market and is expected to rise further. A large proportion of the energy used is from oil, but an alternative to partial or total energy consumption is determined by the substation. Alternative energy sources must be economically viable and environmentally friendly. In recent years, the use of cleaner alternative fuels such as natural gas, methanol, and hydrogen has become more popular, as a solution to environmental problems including the global warming and shortage of crude oil reserves in the world. Reduction in power is one of the important issues in converting a gasoline engine to CNG (Fathollah et al., 2013). Alternatives to petroleum-derived fuels for internal combustion engines must be developed due to the depletion of fossil fuel resources. Since compressed natural gas (CNG) is far more plentiful than petroleum, it can be a great alternative fuel (Andrei et al., 2019). It has a high H/C ratio and a high research octane number, leading to cleaner exhaust gasses than those produced by classic fuel combustion. It also has high anti-knocking proprieties but lower flame speed and shorter flammability range (Ma et al., 2010). Due to its relatively high octane number, natural gas has recently been seen as a clean alternative fuel for spark-ignition (SI) engines. In comparison with gasoline, the thermal efficiency and emissions would have increased with the mild burning of natural gas, which is primarily composed of methane, in SI engines. Natural gas enables higher pressure ratio combustion without banging thanks to its high research octane number (RON) of over 120. Due to its high hydrogen-to-carbon ratio, it also emits far less CO2 than conventional hydrocarbon fuels (Saad et al., 2014). The combustion cycle is the most significant and complicated step in the SI four-stroke engine. The fact that the chemical energy of the fuel is transformed into thermal energy during this cycle has a substantial impact on engine performance and pollutant emissions. The duration of combustion is a crucial factor in determining the best combustion process during the combustion cycle. When the combustion time is too lengthy, more thermal energy is wasted due to a longer heat transfer time to the cylinder and piston, or when the combustion time is too short, the fuel will not be entirely burned, preventing the fuel’s chemical energy from being fully transformed into heat energy (Nguyen et al., 2019). A comprehensive review of natural gas as a transportation fuel which is a promising alternative fuel is needed. Although port-injected CNG technology has been tried and tested, it has not become as popular as conventional fuels. One of the reasons besides the lack of infrastructure and refueling stations is the lower torque and power output compared with gasoline in bivalent vehicles. This is due to lower volumetric efficiency as gaseous fuels replace incoming fresh air resulting in lower torque and power (Khan et al., 2016). Mixing devices used in gas engines, generally referred to as carburetors, for mixing air and gaseous fuels are commonly attached to the intake manifold of an internal combustion engine. In a gas carburetor, the mixing of air and gaseous fuels needs to be in a proper ratio for a particular engine load and speed. In designing the producer gas carburetor, simplicity and ruggedness have always been considered as a basic requirement to achieve easy adjustment and reproducible performance (Ani et al., 2006). At a wide throttle position, brake power, torque, and mean effective pressure are typically higher for gasoline and CNG, while CNG operation results in lower brake power, torque, and mean effective pressure. Around low speeds and high speeds, CNG emits less NO, but at 3,000–3,500 rpm, the emission rises. Compared with gasoline, CNG was proven to have lower CO emissions (Saad et al., 2014). Internal combustion engine power and torque are primarily influenced by the mass of the fuel mixture in the engine’s cylinders and, of course, the fuel’s composition. Therefore, compared with other engine parameters, volumetric efficiency plays one of the most crucial roles when dealing with diverse fuel qualities in the same engine (Sulaiman et al., 2013). When the distance between the mixer and the input manifold is small and the mixing time is sufficient, mixing chambers with a higher volume than just a T-joint tube allow longer air and fuel retention time within the chamber. Because the flow velocities are relatively lower, more time may be spent mixing, allowing for the use of a straightforward mixing chamber. Biomethane will be used directly in natural gas engines. Although biomethane is a cleaner fuel than biogas and could be carried across a farm more readily, using biogas to power pumps rather than converting the pumps to run on biomethane is probably still more economical. When compared with gasoline and kerosene, biogas offers a cheap alternative fuel that offers a greater total pump efficiency (58% at 2,500 rpm engine speed). Biogas is used to power an SI engine that powers a water irrigation pump (Abdel-Galil et al., 2008). The main representative exothermic reactions (REXRs) within the high heat release (HHR) region and the dominant formation reactions of CH2O and OH, which are known as the indicators of low heat release (LHR) and high heat release (HHR), respectively, were not significantly affected by the more advanced NG start-of-injection (SOI) timing, which resulted in a higher heat release rate (HRR) (Li et al., 2021).
2 Materials and methods
This article presents the results for the types of mixers used in mixing natural gas with air to operate the irrigation pump. It was produced in the workshop of the Department of Agricultural Engineering/Faculty of Agriculture, Ain Shams University, in Egypt. The following materials and methods were used.
2.1 Equipment and instrument
2.1.1 Engine
A single-cylinder model: AP17OF, air-cooled 4-stroke OHV single cylinder, spark-ignition (SI), bore × stroke: 70 × 54, displacement: 208 cc, starting system: recoil, compression ratio: 8.5:1, and carburetor type: butterfly.
2.1.2 The pump
A pump model: SE-50X, type: SE-50X-BDM-0, connection Dia: 2 inch, delivery volume: 560 L/min, and total head: 30 m. It was manufactured in Egypt.
2.2 Engine modifications
The conversion of the SI (spark-ignition) engine to use natural gas fuel included engine modifications where a gas mixer was used and several types of mixers were manufactured to mix natural gas with air before entering the engine. It was manufactured in the workshop of the Agricultural Engineering Department, Agriculture Faculty, Ain Shams University, in Egypt, using an iron pipe with a diameter of 2.54 cm, length of 20 cm, and thickness of 0.27 cm, and it was welded in the middle with another pipe with a diameter of 1 cm and thickness of 0.27 cm. The small pipe was welded with different angles for natural gas entry, as shown in Figure 1. The mixer was fixed to the motor using screws. The types of mixers were as follows:
• Mixer T-angle 90° (T90), where the pipe angle was 90°, as shown in Figure 2A.
• Mixer T-angle 45° (T45), where the pipe angle was 45°, as shown in Figure 2B.
• Mixer T-angle 30° (T30), where the pipe angle was 30°, as shown in Figure 2C.
• Venture mixer (VM): It is a mixer made of plastic with a length of 27.8 cm and a diameter of 5.08 cm that contains a waistline in the middle with a diameter of 2.54 cm, and a tube with a diameter of 2.54 cm is installed in this waistline, as shown in Figure 2D. This mixer is installed in the engine to mix gas with air, where the gas enters through the small tube in the middle, and thus, the mixture enters the engine, as shown in Figure 3. The pressure was approximated in various ways; we used a gas pressure regulator in order to determine the pressure of the gas leaving the cylinder and reduce it to suit the operation of the engine. The regulator measured high pressure (300 bar) and low pressure (16 bar). Salave et al. (2017) reported the following for high air flow rate:
1. The velocity of air is high.
2. Due to the contracted cross-section, air pressure is low.
3. The pressure difference between fuel gas and airstream is high.
4. Much fuel gas flows through the openings to mix with the airstream. Bernoulli’s equation for pressure difference is given by
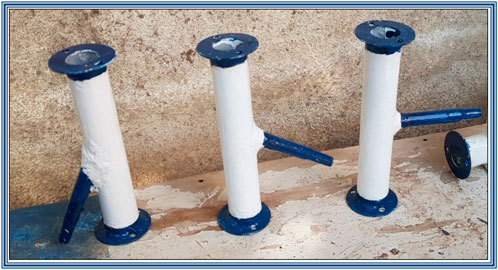
FIGURE 1. Types of gas mixers.
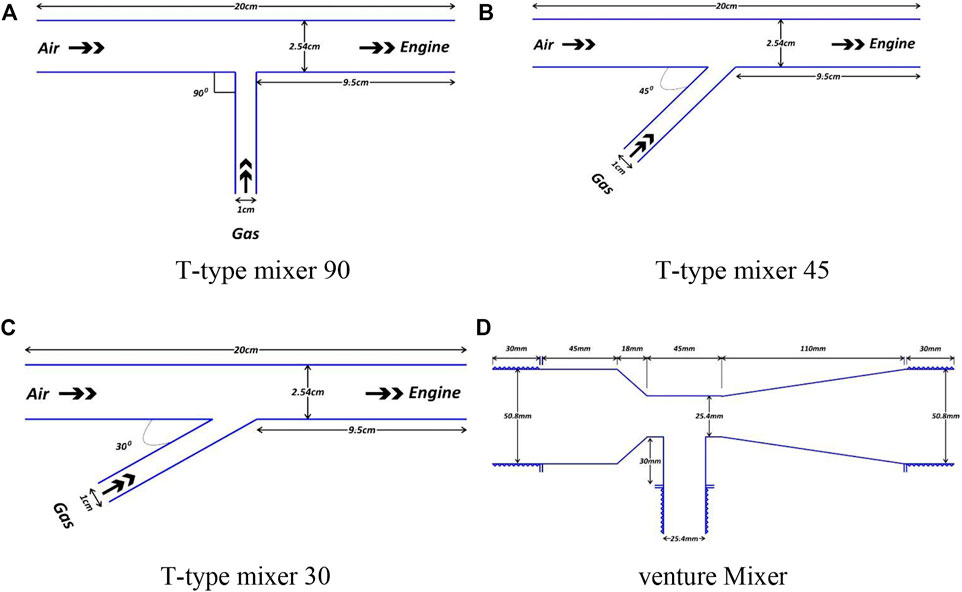
FIGURE 2. Schematic diagram of the types of gas mixers.
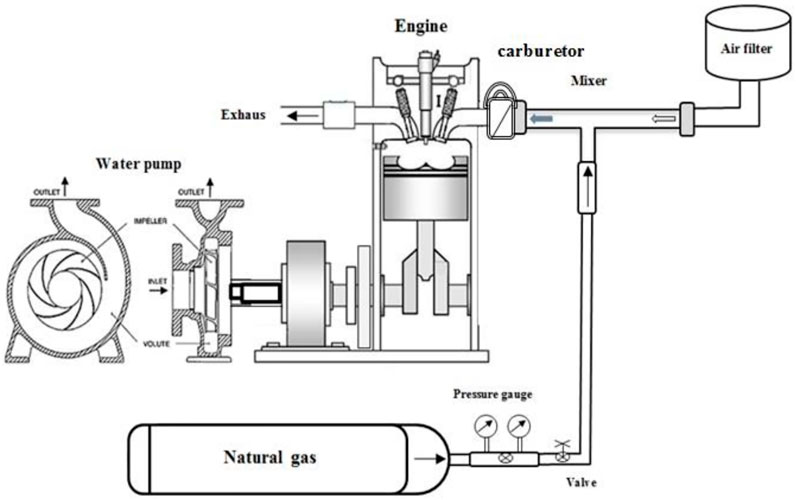
FIGURE 3. Simplified diagram of a natural gas engine for powering a water irrigation pump.
3 Experimental procedures and measurements
To assess the effect of experimental factors and the performance of the engine and pump work using different types of fuel (gasoline–natural gas) at different engine speeds and for all types of mixers, with respect to operating the engine with natural gas, the operation was started with gasoline fuel by closing the gasoline valve and opening the gas valve gradually until the operation of the engine with gas stabilized naturally.
After preparing the engine and filling it with fuel, each water barrel with a capacity of 200 L and the tank of disposal measurement (40 L) was prepared and water hoses (the intake hose and the push hose) with a length of 3 m were installed for each of them with a valve with a diameter of 5.08 cm at the beginning of the push hose to control the amount of water leaving the pump. The engine was started with gasoline to determine the four shaft speeds (1,750 rpm, 2,300 rpm, 2,900 rpm, and 3,500 rpm) using the engine speed-measuring device.
3.1 Engine power
Actual engine power was calculated by measuring engine torque using the Prony brake; the net power of an engine was the power delivered at crankshaft; and the power developed from engine was calculated by using the following equation:
where P is the power (kW), n is the speed of the pulley (rpm), W is the load registered by the spring balance (N), L is the length of the brake arm (m), T is the torque arm (N), and ω is the angular speed (rev./s).
3.2 Fuel consumption
The rate of gasoline fuel consumption was measured and the pump was operated with load for all engine shaft speeds, and the amount of fuel (gasoline) consumed per unit time was calculated.
The rate of gas fuel consumption (natural gas) was measured by placing a wind speed-measuring device on the gas hose between the gas cylinder and the gas entry hole for all types of mixers, where the cross-sectional area and the gas flow speed to determine the amount of gas entering the engine were calculated, and the following equations were used to calculate the fuel consumption rate (Macmillan, 2002): FBC = (V/t) × 0.0036,where V is the volume of consumed gas fuel (cm3), t is the time of operation (s), and FBc is the rate of gas fuel consumption (m3/h).
where s.fc is the specific fuel consumption (gm/kw.h), FC is the fuel consumption (gm/h), and P is the power (kw).
3.3 Pump discharge performance
Pump performance was measured using different fuels (gasoline/natural gas (gasoline starting) at different engine shaft speeds by placing the intake hose in a barrel with a water capacity of 200 L and the outlet (push) hose in the tank to measure the discharge and control the amount of water leaving the valve, by calculating the pump discharge performance Q (m3/s) and taking a reading for each of them (0.1 bar).
3.4 The actual power of water pump
The actual pump power was measured for different types of fuels (gasoline–natural gas) for all types of mixers at different engine speeds and for each pressure (0.1 bar), where, after calculating the pump discharge performance Q (m3/s) and pressure (P), the actual pump power was calculated (hydraulic power) using the following equation:
where P is the hydraulic power or useful water power (kW), ρ is the water density (kg/m3), g is the gravitational acceleration (m/s2), Q is the pump discharge (m3/s), H is the total head of the system (m), and η is the efficiency.
3.5 Economic indicators
Net present value (NPV) is used to analyze the profitability of a project or investment. It is calculated by the difference between the present value of cash inflows and the present value of cash outflows during the life of the project (from the project over its life) (Willis et al., 2018). Benefit–cost ratio (B/C) is used to analyze the profitability of a project or investment. It is calculated by dividing the present value of the cash inflows and the present value of the cash outflows during the life of the project. The following equations were used to calculate B/C and NPV:
B/C = total present benefits/total present costs
NPV = total present benefits − total present costs
PV = FVX (1/(1 + r)n)
PV = present value
FV = future value
r = discount rate
n = number of years
(1/(1 + r) n) = present value coefficient
4 Results and discussion
The results here dealt with the analysis of technical indicators for the types of mixers used in mixing natural gas with air to operate the irrigation pump to save energy, and the analysis of the economic indicators for operating the irrigation pump was carried out.
4.1 Technical indicators
4.1.1 Engine power
Figure 4 shows the relationship between engine speed and actual power (braking power) for gasoline, T30, T45, T90, and VM. The results guarantee that the relationship between engine speed and actual power is a quadratic relationship. During the design of the drivetrain, it is necessary to determine the engine power output and torque as a function of engine speed (full-load characteristics) assuming maximum power output, engine speed, and type of fueling system as the input data (Szpica, 2019). As we noted with the increase in the engine speed, the power increased in all types of mixers. The actual power was superior to all types when operating with gasoline, which was 3.07 kW at an engine speed of 3,500 rpm. In comparison, the use of natural gas, where the T45 mixer gave the highest power compared with the other types of mixers (2.83 kW) at an engine speed of 3500 rpm, was 7.8% less than gasoline. This is due to reduced volumetric efficiency as the gaseous fuel displaces incoming fresh air resulting in reduced peak torque and power; this is consistent with the finding of Khan et al. (2016). The higher the engine speed, the higher the actual pump power in all types of mixers; this is consistent with the result of Ahmet and Rasim (2021).
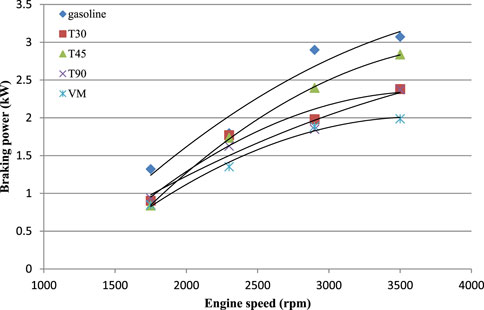
FIGURE 4. The relationship between engine speed and braking power for all types of mixers (gasoline, T30, T45, T90, and VM).
4.1.2 Specific fuel consumption
Figure 5 shows the relationship between engine speed and specific fuel consumption (S.fc) for gasoline, T30, T45, T90, and VM. The relationship between engine speed and specific fuel consumption is of a quadratic function type. When the engine speed is increased, the specific fuel consumption decreases, and the values were 226.109, 533.121, 316.898, 373.209, and 754.596 gm/kW.h; when using mixers (gasoline, T30, T45, T90, and VM), the engine speed was 3,500 rpm.
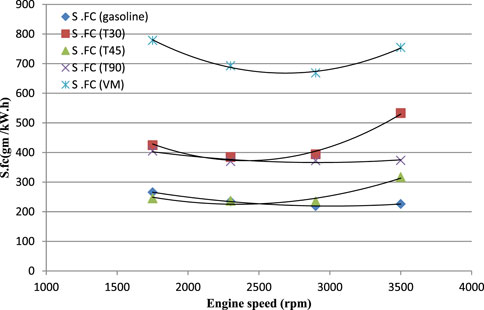
FIGURE 5. The relationship between engine speed and specific fuel consumption for gasoline, T30, T45, T90, and VM.
The specific fuel consumption rate ranged from 265.727 to 219.025 gm/kW.h for gasoline compared with 778.583–234.612 gm/kW.h for natural gas. We note a decrease in fuel consumption with increasing engine speed, which is consistent with Mika et al. (2022). The lowest S.fc for gasoline was 219.025 gm/KW.h at an engine speed of 2,900 rpm. The T45 mixer had the lowest S.fc of 234.612 gm/KW.h compared with other types of mixers at an engine speed of 2,900 rpm, an increase of 6.6% compared with gasoline.
Figure 6 shows the specific fuel consumption (S.fc) for gasoline, T30, T45, T90, and VM at an engine speed of 2,900–3,500 rpm. The results guarantee that specific fuel consumption for the VM mixer (754.596 gm/kW.h) was more than that of gasoline (226.109 gm/kW.h) by 70% at an engine speed of 3,500 rpm. The lowest specific fuel consumption of 316.898 gm/kW.h was obtained for the T45 mixer compared with the other T mixers , an increase of 28.6% compared with gasoline at an engine speed of 3,500 rpm. The lowest S.fc at an engine speed of 2,900 using gasoline was 219.025 gm/kW.h, and while using natural gas, it was 234.613 gm/kW.h for the T45 mixer.
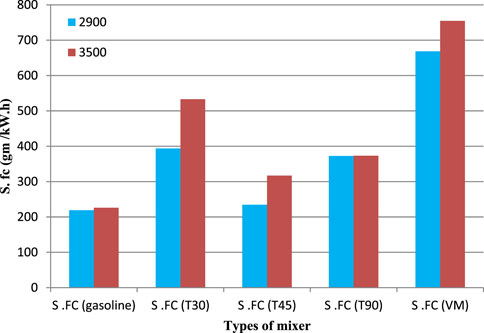
FIGURE 6. Specific fuel consumption for all types of mixers at the engine speed of 2,900–3,500 rpm.
4.2 Pump indicators
4.2.1 Power and discharge of the pump using gasoline
Figure 7 shows the relationship between pump discharge and power and pump pressure for gasoline operating at an engine speed of 3,500 rpm, where the results guarantee that the relationship between pressure and pump discharge is inverse, as the higher the pressure, the lower the pump discharge. The maximum discharge using gasoline was 32.38 m3/h at a pressure of 0.2 bar, and the minimum discharge was 5.66 m3/h at a pressure of 1.8 bar.
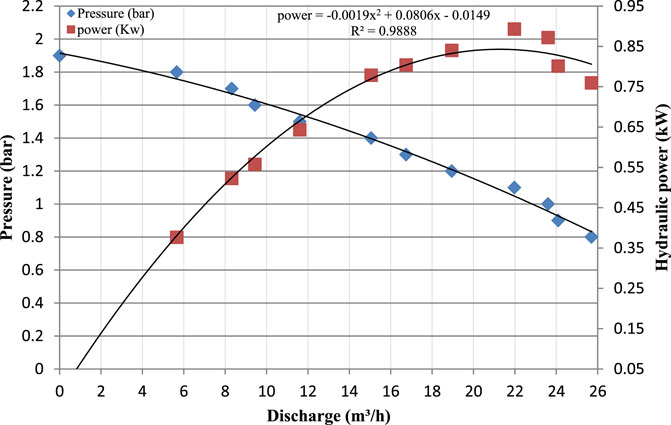
FIGURE 7. The relationship between discharge, pressure, and hydraulic power of a pump operating with gasoline at an engine speed of 3,500 rpm.
Figure 7 shows the relationship between pump discharge and actual hydraulic power to operate using gasoline at an engine speed of 3,500 rpm. The results guarantee that the relationship between pump discharge and actual power is a quadratic relationship. As the pump discharge increases, the actual hydraulic power increases. The maximum actual hydraulic power was 0.89 kW at a pump discharge of 21.97 m3/h. When the pump pressure was 1 bar, the discharge was 23.5 m3/h and the hydraulic power was 0.87 kW. When the pump pressure was 1.7 bar, the discharge was 8.3 m3/h and the hydraulic power was 0.52 kW.
4.2.2 Power and discharge of the pump using the T30 mixer
Figure 8 shows the relationship between pump discharge and power and pump pressure for the T30 mixer operating at an engine speed of 3,500 rpm where the results guarantee that the relationship between pressure and pump discharge is inverse, as the higher the pressure, the lower the pump discharge. The maximum discharge using the T30 mixer was 32.46 m3/h at a pressure of 0.2 bar, and the minimum discharge was 5 m3/h at a pressure of 1.8 bar.
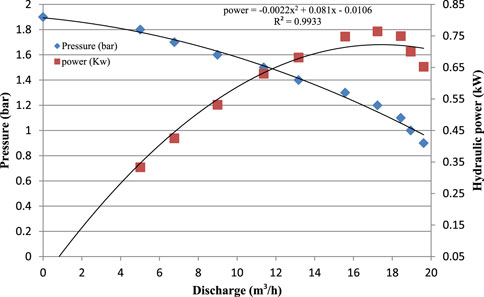
FIGURE 8. The relationship between discharge, pressure, and hydraulic power of a pump operating with the T30 mixer at an engine speed of 3,500 rpm.
Figure 8 shows the relationship between pump discharge and actual hydraulic power to operate using the T30 mixer at an engine speed of 3,500 rpm, where the results guarantee that the relationship between pump discharge and actual power is a quadratic relationship. As the pump discharge increases, the actual hydraulic power increases. The maximum actual hydraulic power was 0.764 kW at a pump discharge of 17.24 m3/h. When the pump pressure was 1 bar, the discharge was 18.95 m3/h and the hydraulic power was 0.7 kW. When the pump pressure was 1.7 bar, the discharge was 6.77 m3/h and the hydraulic power was 0.42 kW. This is suitable for the operation of the drip and sprinkler irrigation system.
4.2.3 Power and discharge of the pump using the T45 mixer
Figure 9 shows the relationship between pump discharge and power and pump pressure for the T45 mixer operating at an engine speed of 3,500 rpm, where the results guarantee that the relationship between pressure and pump discharge is inverse, as the higher the pressure, the lower the pump discharge. The maximum discharge using the T45 mixer was 33.09 m3/h at a pressure of 0.2 bar, and the minimum discharge was 3.6 m3/h at a pressure of 1.8 bar.
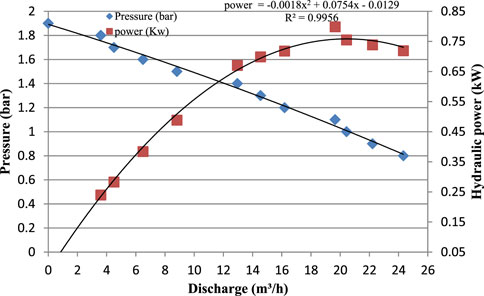
FIGURE 9. The relationship between discharge, pressure, and hydraulic power of a pump operating with the T45 mixer at an engine speed of 3,500 rpm.
Figure 9 shows the relationship between pump discharge and the actual hydraulic power to operate using the T45 mixer at an engine speed of 3,500 rpm, where the results guarantee that the relationship between pump discharge and actual power is a quadratic relationship. As the pump discharge increases, the actual hydraulic power increases. The maximum actual hydraulic power was 0.798 kW at a pump discharge of 19.65 m3/h. When the pump pressure was 1 bar, the discharge was 20.44 m3/h and the hydraulic power was 0.755 kW. When the pump pressure was 1.7 bar, the discharge was 4.5 m3/h and the hydraulic power was 0.28 kW.
4.2.4 Power and discharge of the pump using the T90 mixer
Figure 10 shows the relationship between pump discharge and power and pump pressure for the T90 mixer operating at an engine speed of 3,500 rpm, where the results guarantee that the relationship between pressure and pump discharge is inverse, as the higher the pressure, the lower the pump discharge. The maximum discharge using the T90 mixer was 29.88 m3/h at a pressure of 0.2 bar, and the minimum discharge was 2.08 m3/h at a pressure of 1.8 bar.
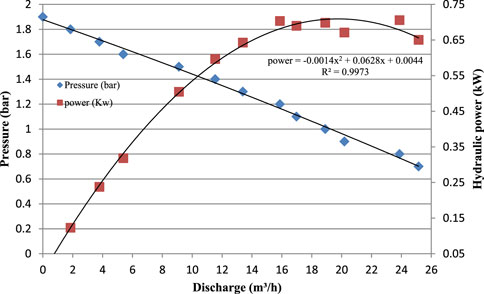
FIGURE 10. The relationship between discharge, pressure, and hydraulic power of a pump operating with the T45 mixer at an engine speed of 3,500 rpm.
Figure 10 shows the relationship between pump discharge and the actual hydraulic power to operate using the T90 mixer at an engine speed of 3,500 rpm, where the results guarantee that the relationship between pump discharge and actual power is a quadratic relationship. As the pump discharge increases, the actual hydraulic power increases. The maximum actual hydraulic power was 0.738 kW at a pump discharge of 18.17 m3/h. When the pump pressure was 1 bar, the discharge was 19.56 m3/h and the hydraulic power was 0.722 kW. When the pump pressure was 1.7 bar, the discharge was 5.61 m3/h and the hydraulic power was 0.35 kW.
4.2.5 Power and discharge of the pump using the mixer-type VM
Figure 11 shows the relationship between pump discharge and power and pump pressure for the mixer VM operating at an engine speed of 3,500 rpm, where the results guarantee the relationship between pressure and pump discharge is inverse, as the higher the pressure, the lower the pump discharge. The maximum discharge using the VM mixer was 31.69 m3/h at a pressure of 0.2 bar, and the minimum discharge was 1.85 m3/h at a pressure of 1.8 bar.
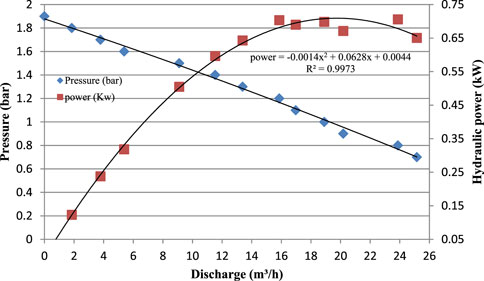
FIGURE 11. The relationship between discharge, pressure, and hydraulic power of a pump operating with the VM mixer at an engine speed of 3,500 rpm.
Figure 11 shows the relationship between pump discharge and actual hydraulic power to operate using the mixer VM at an engine speed of 3,500 rpm, where the results guarantee that the relationship between pump discharge and actual power is a quadratic relationship. As the pump discharge increases, the actual hydraulic power increases. The maximum actual hydraulic power was 0.705 kW at a pump discharge of 23.88 m3/h. When the pump pressure was 1 bar, the discharge rate was 18.9 m3/h and the hydraulic power was 0.698 kW. When the pump pressure was 1.7 bar, the discharge was 3.79 m3/h and the hydraulic power was 0.237 kW.
The highest pump discharge was found with the T45 mixer (33.09 m3/h), an increase of 2.1% compared with gasoline at an engine speed of 3,500 rpm. The highest actual hydraulic power with the T45 mixer compared with other types of T-mixers (0.798 kW) was 10.5% lower than that of gasoline.
5 Economic indicators
5.1 Net present value (NPV)
Net present value is used to analyze the profitability of a project or investment. Figure 12 shows net present value (NPV) with a load for gasoline, T30, T45, T90, and VM, where we noted that the mixer type T90 had the lowest NPV of 77,219.5 and the T45 mixer had the highest NPV of 106,900.7, an increase of 21% compared with gasoline.
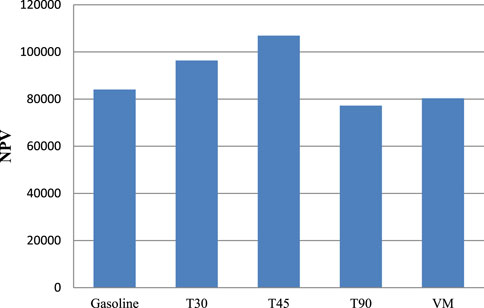
FIGURE 12. Net present value (NPV) for all types of mixers (gasoline, T30, T45, T90, and VM).
5.2 Benefit–cost ratio (B/C)
Benefit–cost ratio is used to analyze the profitability of a project or investment. Figure 13 shows benefit–cost ratio (B/C) with a load for gasoline, T30, T45, T90, and VM, where we noted that the mixer type VM had the lowest B/C of 1.38, and the T45 mixer had the highest B/C of 1.54, an increase of 3.9% compared with gasoline.
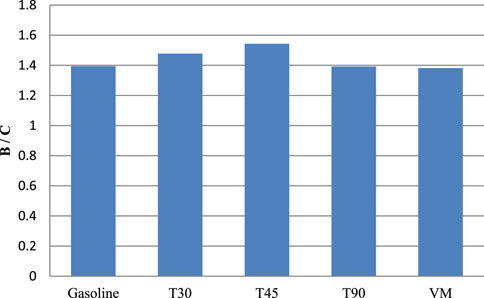
FIGURE 13. Benefit–cost ratio (B/C) for all types of mixers (gasoline, T30, T45, T90, and VM).
6 Conclusion
In this article, an intensive study was presented to solve the deterioration of fuel economy by using natural gas. The goal of this study was to improve the fuel/air mixing and combustion process, and the main conclusions of this study can be summarized as follows:
1. Gasoline engines can be converted to work with natural gas with an efficiency of up to 89.5%. Through this research, a T-type mixer was used to mix natural gas with air.
2. The highest pump discharge was obtained with the T45 mixer (33.09 m3/h), an increase of 2.1% compared with gasoline at an engine speed of 3,500 rpm.
3. The highest actual hydraulic power was obtained with the T45 mixer compared with the other types of T-mixers (0.798 kW), which was 10.5% lower than that of gasoline.
4. It is recommended to use a T-type mixer with a gas mixing angle of 45° to reduce fuel consumption and increase the actual hydraulic power.
5. As for the economic indicators, the use of natural gas gave a good economic return for all mixers, and the best economic efficiency was for the T45 mixer, an increase of 21% compared with gasoline.
Data availability statement
The datasets presented in this study can be found in online repositories. The names of the repository/repositories and accession number(s) can be found in the article/supplementary material.
Author contributions
All authors listed have made a substantial, direct, and intellectual contribution to the work and approved it for publication.
Conflict of interest
The authors declare that the research was conducted in the absence of any commercial or financial relationships that could be construed as a potential conflict of interest.
Publisher’s note
All claims expressed in this article are solely those of the authors and do not necessarily represent those of their affiliated organizations, or those of the publisher, the editors, and the reviewers. Any product that may be evaluated in this article, or claim that may be made by its manufacturer, is not guaranteed or endorsed by the publisher.
References
Abdel-Galil, A., Mostafa, M. M., Elnono, M. A., and Mohamed, M. F. (2008). Biogas utilization for powering water irrigation pump biological engineering. Misr J. Ag. Eng. 25 (4), 1438–1453. doi:10.21608/mjae.2008.190278
AhmetY., , and RasimB., (2021). Effect of different types of fuels tested in a gasoline engine on engine performance and emissions. Int. J. hydrogen energy 46 (2021), 33325–33338. doi:10.1016/j.ijhydene.2021.07.133
Andrei L. N., , LucianM., , and Radu, C. (2019). On the possibility to simulate the operation of a SI engine using alternative gaseous fuels. Energy Rep. 6, 167–176. doi:10.1016/j.egyr.2019.10.035
Ani, T. R., Ravi, S. D., Shashikanth, M., Tewari, P. G., and Rajan, N. K. S. (2006). “CFD analysis of a mixture flow in a producer gas carburetor,” in Proceedings of the International Conference on Computational Fluid Dynamics, Acoustics, Heat Transfer and Electromagnetics CFEMATCON-06, Visakhapatnam INDIA, July 2006 (Andhra University).
Fathollah, O., Ehsan, M., and Kouros, N. (2013). Comparing performance characteristics of a gasoline and cng engines and increasing volume efficiency and power using designed turbocharger. ACTA Tech. CORVINIENSIS – Bull. Eng. 6 (2), Hunedoara (Apr-Jun 2013) (101- 108).
Khan, M. I., Yasmeen, T., Khan, M. I., Farooq, M., and Wakeel, M. (2016). Research progress in the development of natural gas as fuel for road vehicles: A bibliographic review (1991–2016). Renew. Sustain. Energy Rev. 66, 702–741. doi:10.1016/j.rser.2016.08.041
Li, J., Liu, H., Liu, X., Ye, Y., Wang, H., and Yao, M. (2021). Investigation of the combustion kinetics process in a high-pressure direct injection natural gas marine engine. Energy fuels. 35 (8), 6785–6797. . doi:10.1021/acs.energyfuels.1c00353
Ma, F., Naeve, N., Wang, M., Jiang, L., and ChenZhao, R. S. (2010). “Hydrogen-enriched compressed natural gas as a fuel for engines,” in Natural gas (London, UK: Intechopen). ISBN: 978-953-307-112-1. doi:10.5772/9852
Mika, L., Giota, G., Anna, T., Suraj, J., Tuomo, L., and Jussi, S. (2022). General-purpose and scalable internal-combustion engine model for energy-efficiency studies. Machines 10 (26), 1–13. doi:10.3390/machines10010026
Nguyen, X. K., Yujin, K., and OcktaeckL., (2018). “The effects of combustion duration on residual gas, effective release energy and engine power of motorcycle engine at full load,” in Proceedings of the 10th International Conference on Applied Energy (ICAE2018), Hong Kong, China, August 2018, 221835–251841. Energy procedia158 (2019.
Saad, A., Mohd Faizal, M., Shahrir, A., and Yusoff, A. (2014). Comparison of performance and emission of a gasoline engine fuelled by gasoline and CNG under various throttle positions. J. Appl. Sci. 14 (4), 386–390. ISSN 1812-5654/Asian Network for Scientific Information. doi:10.3923/jas.2014.386.390
Salave, H. S., Aniket, V., Vikas, K., Aditya, K., and Palash, J. (2017). Design & optimization of air-fuel mixing device for enriched biogas engine. J. Adv. Res. Appl. Sci., 440–446.
Sulaiman, M. Y., Ayob, M. R., and Meran, I. A. (2013). Performance of single cylinder Spark ignition engine fueled by LPG. Procedia Eng. 53, 579–585. doi:10.1016/j.proeng.2013.02.074
Keywords: natural gas, engine speed, mixer, economic, specific fuel consumption, pump’s discharge
Citation: ElHelew WK, Abdelmaqsoud AM, ElBagoury KF and Shanan HA (2023) Technical and economic evaluation of an engine and irrigation pump using a T-type mixer for natural gas. Front. Mech. Eng 8:1081659. doi: 10.3389/fmech.2022.1081659
Received: 27 October 2022; Accepted: 28 November 2022;
Published: 09 January 2023.
Edited by:
Alpaslan Atmanli, National Defense University, TurkeyReviewed by:
Dariusz Szpica, Bialystok University of Technology, PolandHaifeng Liu, Tianjin University, China
Copyright © 2023 ElHelew, Abdelmaqsoud, ElBagoury and Shanan. This is an open-access article distributed under the terms of the Creative Commons Attribution License (CC BY). The use, distribution or reproduction in other forums is permitted, provided the original author(s) and the copyright owner(s) are credited and that the original publication in this journal is cited, in accordance with accepted academic practice. No use, distribution or reproduction is permitted which does not comply with these terms.
*Correspondence: Waleed Kamel ElHelew, walid.kamel.elhelew@agr.asu.edu.eg; Hayder AbdElHussein Shanan, haydershanan778@gmail.com