Micro- and Nanowear of Self-Mated Steel Generated and Studied With an AFM at the Single Asperity Level
 Manuel Reichelt
 Brunero Cappella
- Federal Institute for Material Research and Testing (BAM), Berlin, Germany
Single asperity nanowear phenomena are fundamental for understanding basic tribological mechanisms. Yet, they are studied mostly through theoretical and simulation works. Few experiments were conducted in the past decades, usually with materials which are commonly used in micro- and nanotechnology, but not for macroscopic components with relevance in tribology. In the present work, we show for the first time tribotests performed with self-mated 100Cr6 steel, a very widespread material at the macroscale, taking advantage of an AFM, employed as a tribometer for the tribotests as well as for the inspection of wear of both tribopartners. Emphasis is put on the morphology of the scars, on wear particles, and on wear of the “colloidal” particles glued on the AFM cantilever. Measurements demonstrate the possibility of characterizing single asperity events leading to very small wear (scars with isolated, down to 1-nm-deep scratches). We highlight several phenomena, for example, transfer of wear particles and their negative contribution to wear volume, which are elementary key constituents of tribological processes. Such phenomena, probably occurring also at the macroscale, can be detected, identified, and characterized with high spatial and time resolution only at the nanoscale, thus giving insight into conditions and causes of their emergence.
Introduction
Friction and wear in macroscopic tribotests are the result of numerous single contact events at the micro- or nanoscale. Several theoretical studies and simulations have been conducted to gain insight into the number of those contacts (Zugelj and Kalin, 2018), their properties (e.g., pressure, duration, and mechanical and chemical properties), and their contribution to friction and wear.
To investigate such nanoscale phenomena experimentally, a stark downscaling of the specimens and measuring tools toward single asperity contact and corresponding forces is necessary. For example, the diameter of available steel spheres varies between some hundred microns and some tens of millimeters, and the lower limit of normal forces applicable with a tribometer is usually above 0.01 N. Hence, common tribometers cannot be employed for the study of nanowear, and the use of an atomic force microscope (AFM) as a tribometer is indispensable. To this purpose, one of the tribopartners must be fixed onto the AFM cantilever like a colloidal probe (Butt, 1991; Ducker et al., 1991; Ducker et al., 1992). For several reasons (morphology, manufacturing, mechanical properties, etc.), only some materials can be used to produce such “colloidal” probes. Thus, tribotests at the nanoscale were usually performed with silicon or similar materials used as standards in microtechnique but rather irrelevant at the macroscale (Bhushan et al., 1995; Bhaskaran et al., 2010; Jacobs et al., 2019). Furthermore, for silicon and diamond tips, the wear was extensively studied, but with the focus on changes of the tip geometry, to ensure a constant measurement accuracy, and not on wear volume or wear coefficient (Khurshudov et al., 1996; Khurshudov et al., 1997; Chung et al., 2005; Strahlendorff et al., 2019). This results in a research gap, since wear at the nanoscale was never studied with materials, which are relevant also at the macroscale.
An AFM presents several advantages compared to a tribometer (Carpick and Salmeron, 1997 and references therein). It can be used to modify the specimens, that is, to perform a tribotest by sliding the “colloidal” probe on a surface under very precisely controlled normal forces and displacements as well as to measure topography, roughness, and wear of both tribopartners at the nanoscale. Both features are mandatory to enable distinct single asperity contacts and very small wear and to detect them with high spatial and time resolution. Additionally, an AFM can be used to determine several sample and system properties. The torsion of the cantilever (lateral signal) enables to characterize the friction between sample and tip or between the tribopartners during the test (Liley et al., 1998); with the help of force–distance curves, Young’s modulus (Cappella, 2016), adhesion (Cappella and Dietler, 1999; Butt et al., 2005), and local thickness of water or lubricant films can be measured (Thundat et al., 1993; Friedrich and Cappella, 2020a); for materials with elastic moduli larger than ca. 20 GPa (which cannot be measured through force–distance curves), other modes (e.g., contact resonance) can be employed (Friedrich and Cappella, 2020b).
In the experiments presented here, we show the first extensive results obtained at the micro- and nanoscale with 100Cr6 steel for both tribopartners. At the macroscale, 100Cr6 was thoroughly investigated and frequently applied. Therefore, it is a suitable material to compare phenomena and properties at both scales. By such a comparison, scaling effects revealed by former studies (Reichelt and Cappella, 2020; Reichelt and Cappella, 2021) can be extended to the nanoscale.
As the surface of steel cannot be prepared as smooth as that of crystals like silicon or pure metals, the roughness of the discs represents a challenging property in generating and detecting wear reliably. Furthermore, the only colloidal particles suitable for gluing onto the cantilever are wear debris particles, that is, random-shaped products of macroscopic wear tests, and not manufactured ones with a well-defined shape. This increases the difficulty in the determination of the particle wear volume.
In this work, we attempted to exhaust the possibilities of reaching the lower limits of the contact area in combination with very low forces to analyze wear events close to “zero” wear and single asperity contact. Besides discussing the technical efforts, we detect the shape of test particles, scars, and wear particles and show which phenomena (e.g., formation and modification of wear debris and their role in the wear of the tribopartners) can be observed by testing steel at the nanoscale. The focus is to measure, image, and interpret the changes in topography of tribopartners under the variation of test parameters and of the random shape of the test particle sections contacting the plane at the beginning of the test. The experimental results represent the base for further studies on a quantitative comparison with macroscopic wear, the detection of the lateral scanning signal can be used to link friction at the nanoscale to respective nanowear events.
Materials and Methods
For all tribotests and topographic measurements, an AFM (Cypher, Asylum Research, Santa Barbara, California) has been employed in contact mode. The cantilevers for the tests were silicon tipless ones (type NSC15/AIBS, µmasch, Sofia, Bulgaria, k = 20–40 N/m). The cantilevers for the characterization of the wear tracks were PPP-CONTSCAuD (Nanosensors, Neuchatel, Switzerland).
The material for the tribotests is for both specimens hardened 100Cr6 steel (AISI 52100, according to DIN EN ISO 683-17). A standard SRV disc (diameter 24 ± 0.5 mm, Optimol Instruments Prüftechnik, Munich, Germany) served as the plane. The upper surface was polished to a very low roughness (ra = 1.2 ± 0.25 nm as mean of 100 measurements over 1 μm2 areas). Afterward, the disc was cleaned for 15 min in an ultrasonic bath at 30°C using petroleum benzine and rinsed with isopropanol.
As no commercial 100Cr6 spheres of appropriate size are available for gluing to the AFM cantilever, suitable debris particles were used as “colloidal tips.” These particles originate from macroscopic tribotests with 100Cr6 specimens (balls and SRV planes). “Suitable” means that the surface of the particles is unoxidated and exhibits metallic reflections and that their size is 2–5 µm. It is unknown which of the former specimens is the origin of the debris and which wear mechanism formed them.
To glue a wear particle to the tip, debris particles were distributed on a glass slide and inspected under an optical microscope. A suitable particle must lie isolated to avoid collecting more than one. The end of the cantilever was then brought into contact with the surface of a drop of the two-component epoxy resin (UHU Plus endfest 300, UHU, Bühl, Germany, in a mixing ratio of 1:1) for approximately 1 s. By contacting repeatedly a blank glass surface, the glue drop on the cantilever was reduced successively until it had approximately the same size as the particle. Thus, the chance to collect the particle via the meniscus force by simply contacting it was maximized. Afterward, the glue was cured for at least 15 h. Four particles were glued to cantilevers. An SEM image (ZEISS Gemini Supra 40, Oberkochen, Germany) of the glued particle (No. 4) is shown as an example in Figure 1. The image was acquired at the end of the tribotest series. The worn section is marked with a yellow circle.
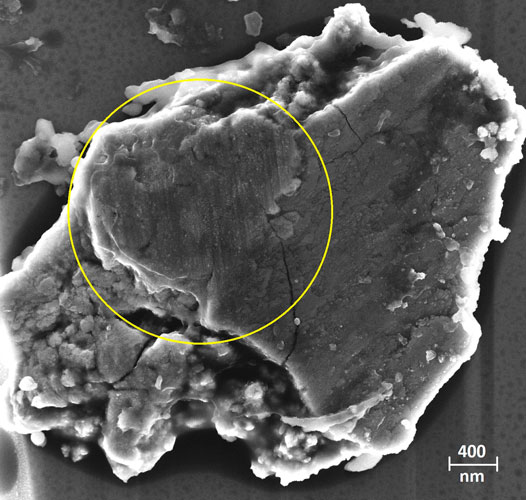
FIGURE 1. SEM image of particle No. 4 glued to a tipless cantilever. The SEM measurement was performed after the series of tribotests. The worn surface is marked with a yellow circle. The glue can be seen as a black region at the borders of the test particle.
Unlubricated tests were conducted on disc sections without anomalies using the highest possible variation in normal force (0.75–12.7 µN). Limiting factors are the elastic constant of the cantilever and the feedback control system of the AFM. The number of cycles was also varied in a wide range (64–102,400). The frequency was set at 9.77 Hz for almost all tests. A lower frequency would influence the stability of the lateral position due to increasing thermal drift effects (Noel et al., 2017). The stroke was either 5 or 25 µm. In order to collect the lateral torsion signal, related to the friction force, all tests were performed by scanning perpendicularly to the longitudinal axis of the cantilever.
In contrast to usual macroscopic reciprocating sliding tests, AFM sliding velocities are, except for short intervals close to the reversal points, constant and rather small. They were not varied intentionally as no significant effect on wear is expected.
A fundamental difference between a tribometer and an AFM concerns the normal force FN. The feedback system of an AFM is far more efficient than that of a macroscopic tribometer. This is particularly owed to the eigenfrequency of the cantilever, exceeding that of every component of a tribometer. This allows to perform tests with very low variations of the normal force, which is almost independent of the surface topography, and hence of roughness. As a consequence, adhesive wear is more likely to occur since abrasive mechanisms are presumably prevented by the fast feedback system. Instead, even fast macroscopic feedback systems are limited by the inert mass and are not able to react to local forces at the level of single asperities. Hence, in macrotests, FN may vary strongly due to motions along the Z-axis resulting from roughness, especially at the scale of asperities.
When applying very small normal forces with an AFM, the attractive force between the specimens cannot be ignored (Cappella and Dietler, 1999; Butt et al., 2005). This force, which is not compensated by the feedback system, depends mainly on the areas of both interacting surfaces and hence varies not only between the tests but also during a test, due to local topography and notably to wear. Yet, rough estimations indicate that the attractive force is in the range 0.1–0.3 µN and thus represents a significant additional load only for tests with applied normal forces in the lower range.
For the characterization of wear, the scars were imaged in contact mode by scanning parallel to the longitudinal axis of the cantilever, that is, perpendicular to the sliding direction of the tribotests. The normal force was always very low to prevent damage of the tip and sample. Images of max. (30 µm)2 were acquired, usually with 512 points per line. For topographies of whole scars with a stroke of 25 μm, several images were stitched (usually six images with 512 points per line over an area of 5 µm2 and hence a resolution of ca. 10 nm). In almost every case, several scans of the same area were necessary to obtain a good image because of loose particles on the surface, which had to be removed mechanically through the cantilever.
For each scar, the wear volume was measured. In case of deep (>10 nm) and wide (>100 nm) scars, this was accomplished by assuming a constant zero level of the unworn flat, determined as average, and calculating the planimetric wear Wq for each row. For smaller scars, mostly consisting of isolated scratches, since the variation of the zero level due to roughness would yield too large relative errors, either Wq was calculated via average geometrical features of the scratches or — in few cases — each row was inspected individually.
As discussed extensively in the “Results” section, scars are covered with a variable number of wear particles, yielding a negative contribution to the wear volume. In several cases, two values of the wear volume were determined: a first value obtained from the topography of the scars “as it is,” and a second value assuming that the topography of the scar under each wear particle is similar to the neighboring regions not covered by wear particles, that is, interpolating Wq for the rows affected by the presence of wear particles.
The accuracy of topography measurements is limited by the well-known convolution of the apex of the AFM tip with the sample surface (Villarrubia, 1997; Dongmo et al., 2000), resulting i.a. in different image qualities depending on blunting and “age” of the tip. An AFM tip can be modeled as a cone with an aperture angle of 30–50° ending with a hemispherical apex. The hemisphere — with a radius of approx. 5 nm for a virgin tip — is also subject to wear and therefore increases in size with the measurement time. Yet, in reality, the apex often presents at least one asperity, enabling to reach atomic resolution on very flat surfaces.
The convolution effect influences the imaging of asperities and wear particles. If a particle is considerably smaller than the tip apex, its image resembles the tip apex; that is, it appears larger. Furthermore, if the distances between particles are smaller than the tip apex and the tip cannot get into the gaps between them, closely packed or agglomerated particles appear like a bulk. This artifact also limits the accuracy of the measurement of depressions and scratches. In particular, the width of a scratch must be larger than the width of the tip at the corresponding height; otherwise, the tip does not contact the bottom of the scratch. As a rule of thumb, scratches narrower than ca. 20 nm are not imaged accurately and appear considerably smaller.
The convolution affects the calculation of the volumes, too. Yet, considering the dimensions of the scars obtained in this work, their morphology, the roughness of the samples, and the resolution of the acquired images, it yields a relatively small error.
For the measurement of the topography of the test particles, a TGT1 test grating (NT-MDT Spectrum Instruments, Moscow, Russia) was employed. It was scanned in contact with 1 Hz and low force (some hundred nanonewton). Depending on the direction, the distance between two pins of the grating is 2.12 µm or 3 μm, which limits the imageable surface of the specimen. Artifacts occur whenever the test particle, imaged with a certain pin, comes in contact with one of the surrounding pins. This phenomenon can be reduced by using the pins at the corners of the grid. Yet, those pins are usually lower, and their radius increases when using them repeatedly, thus worsening image resolution, due to the convolution.
After gluing a particle and curing, cantilever’s eigenfrequencies were measured via the thermal noise spectrum, yielding values between 305 and 325 kHz. Yet, the calculation of the mass loss of the particle during an experiment through the difference of the frequency before and after the test was not possible, due to the small signal-to-noise ratio.
Experimental Results and Discussion
Wear Tracks on the Disc
Morphology
The tracks on the plane can be qualitatively roughly divided into the following three categories of morphologies:
1) Scars exhibiting clearly separated scratches along the entire track (Figure 2A). In this case, only few single asperities on the test particle were in contact with the disc and generated wear either by abrasive or adhesive processes. The real contact area was substantially smaller than the nominal contact area.
2) Scars consisting of a depression across the entire width, usually deeper and wider than tracks with single scratches (Figure 2B). Inside the depression, scratches are possibly present. In this case, a whole portion of the test particle — and not discrete, single asperities — impacted the plane. Compared with the first category, the real contact area was much larger, and its value is closer to the nominal contact area.
3) Scars being a combination of 1. and 2. (Figure 2C), that is, a depression with separated scratches outside.
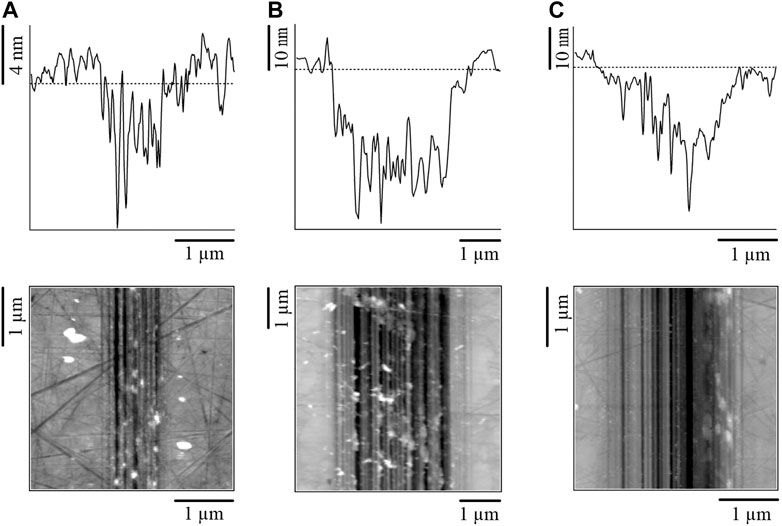
FIGURE 2. Examples of three different categories of scar morphologies. The upper row shows line profiles, the bottom row details of the topographies. Separated scratches [(A), ΔZ = ± 10 nm], a single depression with scratches inside [(B), −35 nm < ΔZ < 15 nm], and scratches next to and within a depression [(C), −30 nm < ΔZ < 20 nm] can be observed.
Figure 2 shows line profiles (top row) and topographies (bottom row) of three examples of the mentioned morphologies of wear tracks. The wear grooves are vertical and parallel to each other. Other scratches with varying angles originate from polishing.
The track on the left side with separate scratches, generated with particle No. 3, N = 5,120, FN = 0.75 µN, and sFN = 0.19 μNm, is considerably flatter and narrower than the other ones. Five major scratches with average depths between 8 and 10 nm and widths between 50 and 100 nm can be detected along the whole scar. Further, 8–10 scratches with a significantly lower depth and width are noncontinuous and not always distinguishable from the local roughness. The importance of local topography and roughness for the measurement of scratch depth becomes evident when considering polishing scratches. Inside the track on the left, between the single scratches, the polishing scratches are still visible and, in some cases, they are deeper than the wear grooves. This is true for the middle and right tracks only at the edges, that is, outside the depression, or for very deep polishing scratches.
The track in the middle panel of Figure 2 was obtained with particle No. 1, N = 25,600, FN = 10 μN, and sFN = 12.8 μNm. It shows a quite large depression of at least 10 nm over a width of ca. 2.9 µm with steep edges; scratches are visible inside the depression.
The right track in Figure 2 was obtained with particle No. 2, N = 25,600, FN = 10.25 µN, and sFN = 13.12 μNm. It consists of a depression with gradual edges between X = 1.3 µm and X = 2.8 µm and, on the left side, two deep and four shallow scratches outside the depression.
Several features of the worn surfaces, notably the numerous distinct and sharp scratches (middle and right panel in Figure 2), are similar to those of well-known macroscopic scars. When neglecting the scales, one could indeed ascribe those pictures to macroscopic wear scars (Wäsche et al., 2014) so that a kind of scale invariance could be assessed for the detected morphologies. Yet, anomalies like W-profiles in macroscopic scars were never observed in nanotests, which could be ascribed to lower pressures and the consequent smaller work hardening.
The analysis of 43 scars shows that
1) Tracks of category 2, that is, with a depression across the whole width, are nearly always the result of tests with relatively large values of sFN and N. For these scars, the depth and the wear volume of the tracks of the plane, Wv,E, correlate with sFN. This statement would apply also to the track width if tests had been performed with counterbodies having a well-defined convex shape (e.g., a sphere) and the same initial nominal contact area for all tests. This is not the case for our tests, since the test particles have irregular shapes and are used repeatedly for several tribotests so that their initial nominal contact area becomes larger and larger.
2) Tracks of category 1, that is, with isolated scratches, result primarily from tests with few cycles. For these scars, the number of scratches is random, because it depends only on the number and local distribution of asperities on the test particle glued to the cantilever. Yet, the depth of the scratches correlates with sFN and N.
Single Asperity Phenomena Toward “Zero Wear”
By reducing the number of cycles, scars with isolated, very shallow scratches were produced. This permits to explore two hitherto hardly investigated fields of tribology, that is, micro- and nanowear down to the limit of “zero” wear and single asperity wear. On the other hand, the depth of those scratches (1–4 nm) is comparable with the roughness of the steel disc, and thus, in those cases, measurements are performed at the limit of the resolution attainable on such specimens with an AFM.
The wear track in Figure 3 was carved with particle No. 4, N = 2,560, FN = 0.78 µN, and sFN = 0.02 μNm. It consists of only three scratches, resulting from three single asperities on the test particle. As can be seen with a higher resolution in the detailed image at the right top, two scratches are side by side on the left; the average depth is 2 nm (left one) and 6 nm, and the width is 50–60 and 100–120 nm. The third scratch, with an average depth of 2 nm and a width of ca. 50 nm, is located further to the right. At the right bottom, an average of all line profiles of the detail image shows the approximately triangular profile of the scratches. The X-distance between the two close scratches on the left is ca. 60 nm; the Y-distance of the bottom ends is approx. 200 nm. Thus, by comparing the relative position of the ends of the scratches with the topography of the test particle, the asperities that originated the scratches can be identified. In the detailed image at Figure 3B, numerous wear particles can be seen, sticking mainly at the very borders of the wear scratches, but not at the borders of or within the polishing scratches.
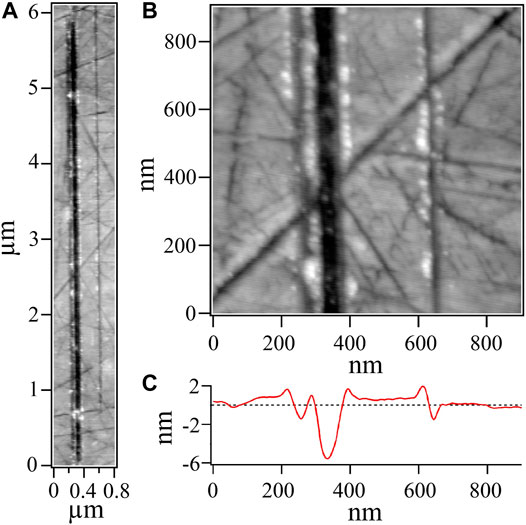
FIGURE 3. Wear track with a single scratche (category 1). The Z-scale is between −10 nm and +5 nm for the overall image (A) and ± 4 nm for the detail image (B). An average of all line profiles of the detail image is shown (C).
Even smaller scratches can be seen in Figure 4, showing a scar produced with particle No. 4, N = 256, FN = 0.865 µN, and sFN = 0.011 μNm. The scar is barely visible in the overall picture; hence, only a detailed picture is shown over an area with few scratches from polishing (Figure 4A). The five visible scratches have again approximately triangular profiles (Figure 4B) with average depths (from left to right) of 1, 1, 2, 2.5, and 3.5 nm. The average widths are 40, 25, 50, 35, and 50 nm. The scratches can be barely distinguished from variations of the topography due to roughness. Again, the five scratches are likely to be the product of single asperities on the test particle. Due to the lower wear, there are significantly fewer wear particles than in Figure 3, and, other than for the previous scar, they are not located mainly at the borders of the scratches, but randomly distributed inside and beside the scratches, most notably the shallower scratches. At the bottom of deep polishing scratches that are crossed by the wear scratches, wear particles can be found as well. An interesting detail of the edges of those polishing scratches is that they — other than in macrotests with larger normal forces — do not present any ridges, breakouts, or swarfs caused by the test particle wearing over them.
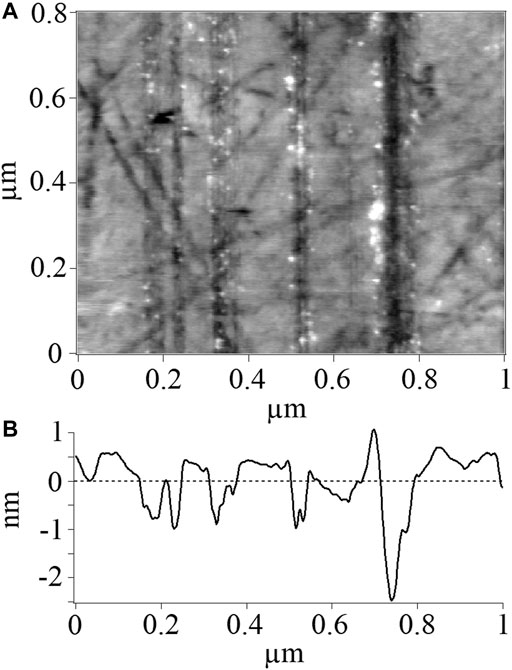
FIGURE 4. (A) A detail of the topography of a wear scar with a single scratch (category 1) with a Z-scale of ± 4 nm. (B) An average of all line profiles is displayed.
In few tests, no scar at all, that is, no measurable modification of the disc topography and no wear particles, could be detected, even with the AFM. This happened for the first two tests with particle No. 1 (sFN = 0.14 and 0.29 μNm) and for the 1st, 3rd, and 5th test with particle No. 2 (sFN ≅ 2.65 μNm in each test). In these cases, the term “zero wear” is indeed pertinent. It must be noted that, with other particles, tests with an even smaller sFN (down to 0.004 μNm) did definitely produce a scar; indeed, after the test particle was worn and the contact area was increased, zero wear was never obtained, even with a stark reduction of sFN. Furthermore, with particle No. 2, the 2nd and the 4th test, with exactly the same operating parameters (stroke, frequency, cycle number, and normal force) as for the other three scars, yielded two shallow but well-defined scars with three isolated scratches or one single scratch, respectively. Hence, no threshold of the operating parameters can be identified for the occurrence of wear.
We conclude that zero wear is a consequence of low probability for single asperity encounters and/or of small volume changes resulting from such encounters. In turn, the probability of asperity encounters is related to the area and the roughness of the surfaces in contact; the effect of asperity encounters is related to the mechanical properties of the materials and to the applied forces and pressures. Furthermore, the contact area is decisive also for the probability that a wear particle is trapped between the counterbodies, increasing the roughness and contributing itself to wear during the proceeding test. Summarizing, low sFN combined with small contact areas may yield no measurable modification of the interacting bodies (zero wear). Yet, as shown by the 2nd and the 4th test with particle No. 2, when, under the same conditions, a phenomenon accidentally initializes a wear process, a small wear track is indeed obtained. In such cases, a sudden change in the lateral signal, correlating with friction, can often be observed. As already said, the analysis of maps of the lateral signal will be the subject of future publications.
Comparison of Successive Tests
Important information about changes of the asperities on the test particles can be obtained through the comparison of two successive wear tracks, produced with the same operating parameters (particle No. 3, N = 512, FN = 0.75 µN, and sFN = 0.019 μNm). Figure 5 shows images of two consecutive wear scars and the line profiles averaged along the direction of sliding, superimposed on the images. Colored lines help comparing the positions of single scratches. Almost all scratches are at approximately the same positions. This shows unambiguously that the system can be modeled as a considerably harder body, that is, the test particle, indenting, furrowing, and wearing the less hard body, that is, the flat, and that the asperities dominating the wear process are those on the test particle.
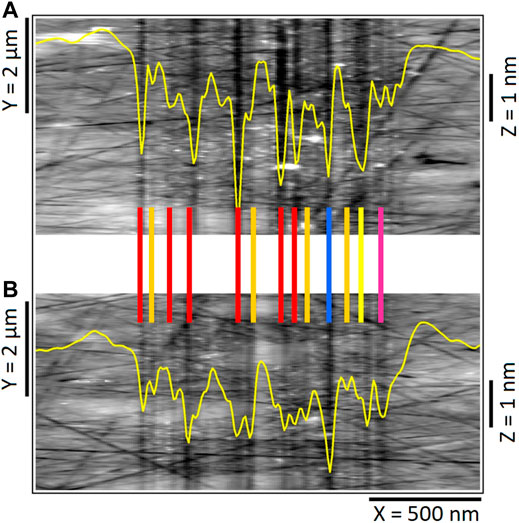
FIGURE 5. Comparison of scratches in two consecutive wear scars. Topography sections of the first (A) and the second (B) track are shown together with their line profiles averaged over the whole track length and superimposed onto the topographies. The blue line marks a deeper unchanged scratch, green lines mark shallow unchanged scratches, red lines tag flattened ones, the yellow line indicate a split scratch, and the magenta one denotes the merging of two scratches.
With only one exception (blue line), the deeper scratches (red lines) are flatter (1 nm instead of 2–3 nm) in the second scar, which indicates blunting of the corresponding asperities. This is not the case for the smaller asperities producing shallower scratches. Except the extremely shallow scratch at the right border of the first scar, which has disappeared in the second one, shallower scratches (green lines) are almost identical. In one case, splitting of a scratch into two new ones takes place (yellow line). Finally, two scratches at the right end of the scar (magenta line) merge into a single one, indicating major changes of the corresponding asperities.
While the flattening of the scratches is clearly due to wear of asperities, different scenarios for splitting of scratches or occurring of new ones can be outlined. For example, a grain or particle at the very end of an asperity can be broken off, adhesively removed, or even buried so that two new asperities are formed. Also, due to wear, a neighboring asperity can come into contact for the first time and carve a new scratch next to the old one. Finally, a new asperity next to an old one can be formed by a sticking wear particle.
In general, profile lines of scars of successive tests vary considerably, also as a consequence of the variation of test parameters. Nevertheless, we could show that short tests yielding scars with similar profiles give the opportunity to examine changes of single asperities on the test particle. Yet, an estimation of the probability of single asperity wear events and their outcomes, needed, for example, for simulations, requires a better characterization of the topography and properties of the interacting bodies at the very nanoscale. To this aim, smaller strokes are necessary as well as imaging of the disc before and after the tribotest with nanometer resolution, enabling detection of even very small changes of the topography.
Carbides
Some wear scars are crossing chromium carbides, being part of 100Cr6. Carbides are clearly visible in the topographies of worn surfaces, as shown in the middle of both images in Figure 6. In the image at the top, the carbide has a semicircular shape with various scratches originating from the wear test (vertical) and from polishing (varying angles). The cross section of the carbide in the bottom picture is slightly smaller and circular with four wear scratches and few scratches from polishing. The surfaces of both carbides are smoother and higher (by 1–2 nm) than the rest of the worn surface, and the wear grooves on them are sharper and less deep and exhibit a more regular profile. This applies also for scratches from polishing and was observed on several scars. The reason for those morphological differences lies most likely in the higher hardness of carbides. The very small wear particles in both pictures seldom adhere onto the carbide surfaces; rather, they are located very frequently at their borders, front and behind in the sliding direction, which can be observed also in Figure 7. The reason for the lower adhesive forces on carbides can be attributed either to chemical properties or to the fact that wear particles do not lock in the scratches because of the different elastic properties and/or roughness.
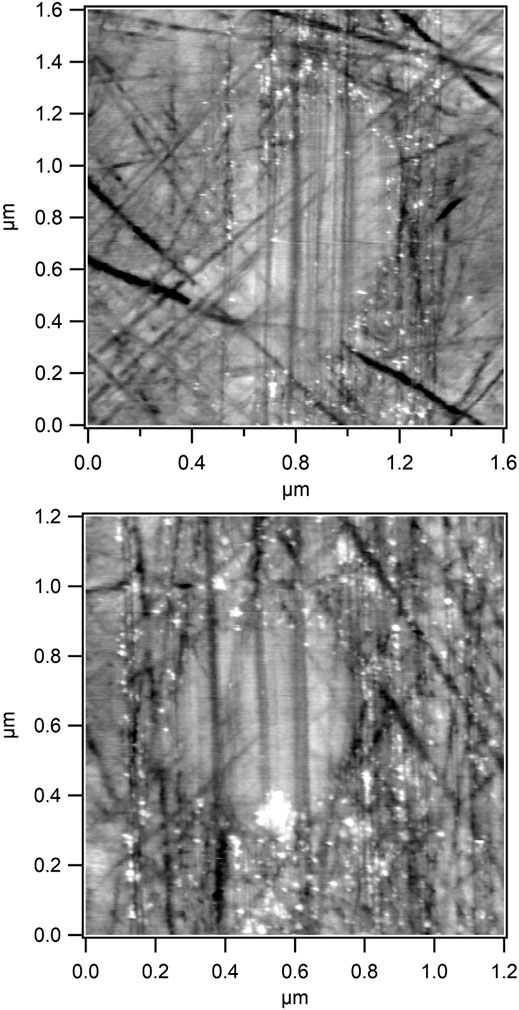
FIGURE 6. Topographies of worn carbides. The Z-scale of both images is ± 4 nm.
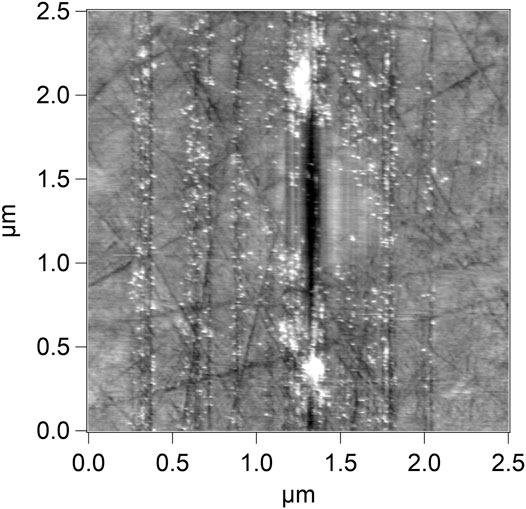
FIGURE 7. Wear track with nine isolated scratches, some of which run over a carbide in the middle of the image. The Z-scale is ± 8 nm. Numerous small wear particles are sticking mainly close to the grooves and are agglomerated before and after the circular carbide in the middle.
Another interesting detail in Figure 7 is the main scratch in the middle. Other than in most cases, on the carbide, this scratch is deeper and wider than outside (8–9 nm depth instead of 6 nm and 150–160 nm width instead of ca. 90 nm). Since the scratches beside the carbide do not exhibit such changes in depth and width, a larger indentation of the test particle in this region of the disc, for example, because of local mechanical properties, can be excluded. A possible explanation is a wear process caused by the wear particles being collected by an asperity from the pile before the carbide and pushed over it, carving a deeper and larger groove, and sticking again to the metallic surface after sliding past the carbide.
Wear Particles
As already shown in the last examples, images of the wear tracks show several important details about wear particles. They are sticking mainly onto the wear track or next to their border and exhibit very different sizes, shapes, and spatial distributions. It must be emphasized that only those wear particles which adhere strongly enough to the surface and cannot be removed by the AFM tip can be properly detected. This depends also on the normal force applied by the cantilever. If wear particles are attracted to the sides of the AFM tip without influencing the deflection of the cantilever and hence the measurement, they cannot even be detected at all.
Particles outside the tracks can often be displaced by the AFM tip even with relatively low normal forces, which is not related to the size of the particles and seems to happen randomly.
In general, it is not possible to ascertain whether a given particle originates from the flat or from the test particle. Due to the much larger amount of wear (see next Section), more wear particles are likely to originate from the flat. Yet, since the test particle is rougher than the disc, at least at the beginning of the test series, and no significant traces of origin could be detected on the surface of the plane, larger wear particles probably come from the test particle.
In the following, we address properties related to the size of wear particles, divided roughly into three groups.
Small Wear Particles
Small wear particles with a diameter of up to 30 nm are sticking almost only onto the wear scratches and not onto the polishing scratches (Figures 6–8). Usually, small wear particles are randomly distributed over the surface of the scars. Before and after a carbide, they are often agglomerated, as demonstrated in Figure 6 (bottom panel) and Figure 7. Small wear particles cannot be displaced by the AFM tip, independently from the normal force applied. This strong adhesion is probably related to the larger contact area via the increased roughness in the track but may be also due to chemical changes of the worn surface or to mechanical effects such as clamping.

FIGURE 8. Topography of a wear track with numerous small wear particles sticking onto the scratches. The Z-scale is ± 5 nm.
Due to the convolution between the AFM tip and the topography, for radii smaller than ca. 10 nm, the size of wear particles can be determined only with a very large relative error. Moreover, no reliable information can be gathered about the shape of small wear particles. This is not the case for particles of medium size. Like small particles, most medium particles cannot be moved by the AFM tip, independently of the applied force. They are often themselves subject to wear and are incorporated into the wear scar again, as can be observed in the right panel of Figure 2 and more detailed in Figure 9.
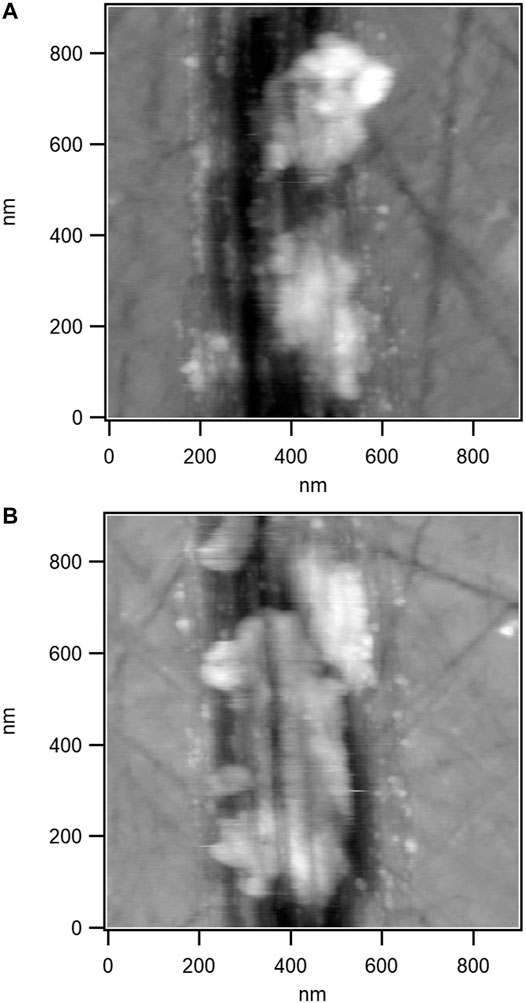
FIGURE 9. Wear debris at different stages of embedding into a wear track. (A) (−12 nm < ΔZ < 16 nm) An early stage of incorporation with almost undamaged and prominent particles with few scratches is shown. (B) (−14 nm < ΔZ < 12 nm) A wear particle, which has been worked in and therefore is larger and flatter (rolled out), exhibits clear wear scratches.
Medium Wear Particles and Their Incorporation into the Tracks
The pictures in Figure 9 show medium-sized wear particles (>50 nm) at different stages of embedding into the wear track. At the top, two particles at an early stage of embedding can be seen. They are rather undamaged and have a protruding shape with few scratches on their surface. The image at the bottom shows an embedded wear particle in an advanced stage of incorporation into the track. The particle is larger, flatter (rolled out), and exhibits deeper scratches on its full length.
Medium particles are removed from the test particle or from the disc through abrasive or adhesive phenomena at a specific moment in time during a test, that is, during a specific cycle. Once separated from one of the bulk bodies, depending on their size and on their original position, such particles may be pushed to the sides or to the ends of the scar or else stick onto it. In this latter case, wear particles are in the gap between the counterbodies (or get into it) and may be crushed and/or flattened and furrowed during the proceeding tribotest. Hence, the particle area increases, and the particle is embedded into the track and may finally be buried in the worn surface.
The analysis of the topographies of the scars provides hints about the described possible stages of wear (detachment, deposition, incorporation, and burying) and their probabilities. In other words, the inspection of wear scar trough AFM yields information about adhesive wear processes, investigated with nanometer resolution, and fragmented in their time development. This gives insight into fundamental wear phenomena, such as the formation of the third body (Godet, 1984; Arnaud and Fouvry, 2018), that is, the intermediate body, in which the counterbodies, lubricant, and atmosphere interact with each other. From the moment a particle has been transferred, it is per definition a part of the third body. It is known that grains in the third body are usually deformed, as the particles in Figure 9, and exhibit smaller sizes (grain refinement). As shown in Figure 7, particles in the third body may themselves wear the interacting bodies.
Since transfer occurs with medium particles, which become over time increasingly difficult to distinguish from the scar surface, it is likely to occur also with small particles. Other than larger ones, small particles are probably incorporated in the track very fast, that is, after few cycles, and cannot be distinguished from the surface of the rough scars, also because of the lack of other contrast sources. Together with artifacts due to the convolution effect, the incorporation of small particles into the tracks affects the measurement of size distributions of wear debris severely. Nanosized grains in the third body of macroscopic tribosystems may also result from the incorporation of small wear particles.
The incorporation of the already worn material has a great significance for the time development of the wear volume and for the interpretation of its measurement. Let us consider the detachment of a wear particle of volume Vp, for example, from the test particle glued on the cantilever, as an elementary wear event. Once detached, the particle either gets out of the wear track or adheres to the scar. Let ΔWv,p be the change of the wear volume of the test particle, ΔWv,f the change of the wear volume of the flat, and ΔWv = ΔWv,p + ΔWv,f the change of the total wear volume. In the first case, ΔWv,p = Vp, ΔWv,f = 0, and ΔWv = Vp. In the second case, it is again ΔWv,p = Vp, but ΔWv,f = −Vp, resulting in ΔWv = 0. Hence, considering the time development of the volumes, it may happen that, through transfer of wear particles, Wv stays constant and Wv,f even decreases, though the number of cycles and hence sFN increase, which is totally counterintuitive.
The negative contribution of wear particles to the wear volume of the flat is illustrated in Figure 10. The upper part shows a scar produced with particle No. 4 (N = 5,120, FN = 0.78 µN, and sFN = 0.04 μNm). Several wear particles stick inside the track. The bottom part shows the planimetric wear Wq (cross-sectional area and hence wear volume per unit length), which exhibits negative peaks in correspondence with each medium sized wear particle, decreasing by up to 60%.
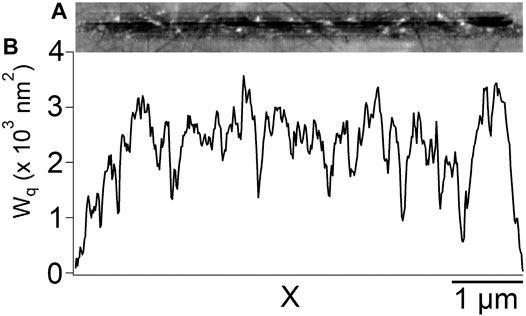
FIGURE 10. (A) A scar obtained with particle No. 4 (N = 5,120, FN = 0.78 µN, and sFN = 0.04 μNm) with several wear particles adhering onto the scar surface. The Z-scale is ± 10 nm (B) Planimetric wear Wq (cross-sectional area of the track) vs. X position. Negative peaks of Wq correspond to wear particles.
At an early stage of the wear process, as for the track in Figure 10, the wear particles are still recognizable as such. Hence, it is still possible to “correct” the effect of deposition, that is, the negative wear, by assuming that the scar under the particle has the same cross section (and hence the same Wq) as next to the particle. In practice, this is possible only with a limited number of wear particles, not covering almost the entire surface of the scar. If particles are adhering to the scar along the whole length, this “correction” method is impossible. For the track shown in Figure 10, the volumes obtained with and without such an approximation are 1.1 × 10⁻³ μm3 and 1 × 10⁻³ μm3, showing that already relatively few wear particles engender a decrease of the volume of about 10%.
At an advanced stage of the wear process, as shown before, wear particles are flattened, furrowed, crushed, and finally incorporated into the track. Hence, they cannot any longer be distinguished from the wear track. This means that deposition cannot any longer be accounted for and that wear particles definitely reduce the wear volume. Detachment and deposition of wear particles depend intrinsically on the local properties of the interacting surfaces, notably morphology, topography, and roughness; it may even occur that, in the same scar, some sectors are almost completely covered with wear particles and some others are completely free. Hence, the incorporation of wear particles increases the scattering of wear volume values. The effect of incorporation is relatively larger for nanotracks. Thus, a rather large scattering toward a lower wear volume is expected for such scars.
The processes that can be detected through measurements at the nanoscale are very likely to take place in macrotests as well. However, at the macroscale, they usually remain undetected due to insufficient imaging and “time” resolution, that is, resolution in the wear progress. Thus, the volume, number, and size of removed wear particles, and their time evolution when being fractured and embedded into the third body can be detected with great difficulty, if at all. However, these parameters are of great importance for the characterization, simulation, and understanding of adhesive wear. For example, a low macroscopic wear volume can result even in case of strong adhesive wear, if the majority of the removed material is deposited and embedded in the scar and is not recognized as wear. In this case, the amount of adhesive wear is underestimated. Also, the characterization of the size of wear particles is of fundamental importance for the understanding of basic wear processes (Frérot et al., 2018; Milanese et al., 2020). For example, as pointed out by Popov and Pohrt (Popov and Pohrt, 2018), large wear particles cannot be detected experimentally, although their occurrence is predicted by the theory. This discrepancy can be explained through our observations, when supposing that large particles disappear completely as they are buried into the track or else they are crushed before they get out of the gap between the counterbodies.
Large Wear Particles
Large wear particles can be measured seldom by AFM as they are mostly loose at the surface and are displaced by the tip, thus damaging it. In some cases, they are a part of agglomerations at the reversal points of the wear scars and hence fixed to them and stable (Figure 11). Thus, some information about them could be collected after removing loose particles with an ultrasonic bath or with the AFM tip. Large wear particles are some hundred nanometers wide. They can appear as flakes, plates, or swarfs with steps (ca. 10 nm high for the particle in Figure 11). Due to their irregular shape and size, large particles have probably not been created in the gap between the tribopartners, but rather detached from the bulk bodies outside the contact area and then pushed aside since they did not fit into the gap.
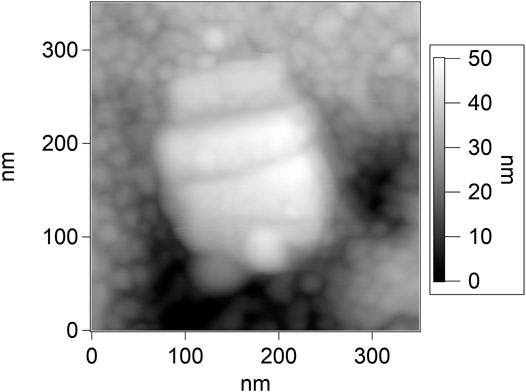
FIGURE 11. Large particle inside an agglomeration of wear particles at the reversal point of a wear track.
The mentioned agglomerations of wear particles (Figure 12) are found at every wear tracks. An unknown loose amount can be displaced by the AFM tip. The rest adheres to the plane mainly close to the reversal points with a roughly semicircular shape but also, in smaller quantities, aligned at the side borders of the tracks. Such agglomerations are significantly higher than single particles (up to some hundred nanometers) and consist primarily of small wear particles (up to ca. 50 nm), embedding some medium and few larger ones. As already discussed in the Section “Materials and Methods,” the visibility of gaps between the small particles inside an agglomerate is limited by the finite dimensions of the AFM tip.
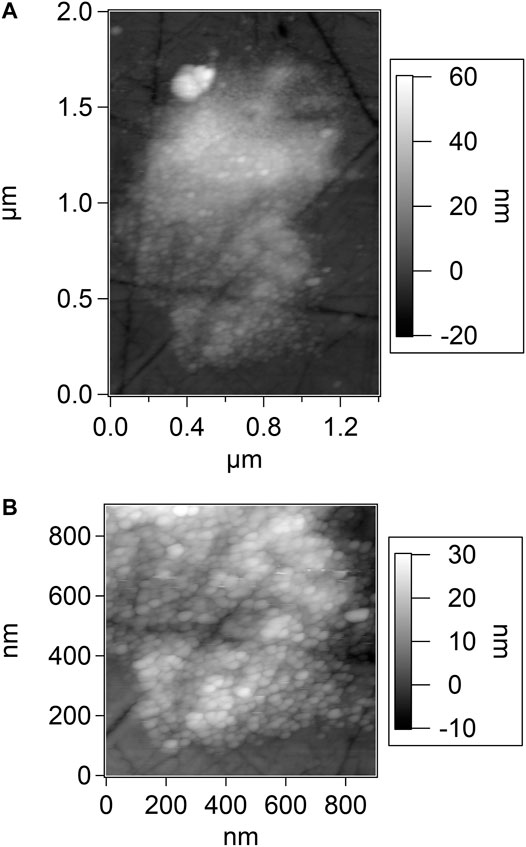
FIGURE 12. Agglomeration of wear particles close to the reversal points of a track. (A) is an overall image, (B) a detail.
The particles in the agglomerations are “cemented” together very strongly. Even scanning a line repeatedly with very high force causes just moderate modifications of the piles. Those cohesive forces cannot be explained by capillary forces, rather by chemical bonds caused by large binding enthalpies gained by new particle surfaces created during the tribotest.
The borders of the tracks and the wear accumulations are always separated by an empty area of some ten to some hundred nanometers width. Even assuming a very small gap between the sliding bodies next to the scratches, at least small wear particles should be found there. This is not the case, which favors the hypothesis that smaller wear particles agglomerate or else stick to the test particle.
Test Particles
As described in the section “Materials and Methods,” topographies of the test particles were acquired at the beginning of each test series and after each test with evident wear on the plane. In many cases, the surface of the test particle was imaged also after tests without any trace on the plane. In those cases, no changes of the surface of the glued particle could be detected.
In almost all other cases, changes of the test particles were present. By superimposing the topographies, the history of the surface can be visualized, as demonstrated with test particle No. 2 in Figure 13. The topography of the unworn particle is shown on the left, whereby the slow scanning coincides with the sliding direction and the Y-axis in the figure. Two volumes, worn in two successive tests, are plotted in red and yellow scales from black (low) to white (high). Four horizontal straight lines dashed in black and white denote the positions of the line profiles presented in the right panel (A–D). Black lines represent the surface profiles before testing. The red and yellow areas mark the two worn cross sections. The white area represents the test particles body after the tests, corresponding to the volume in the gray scale in the left panel.
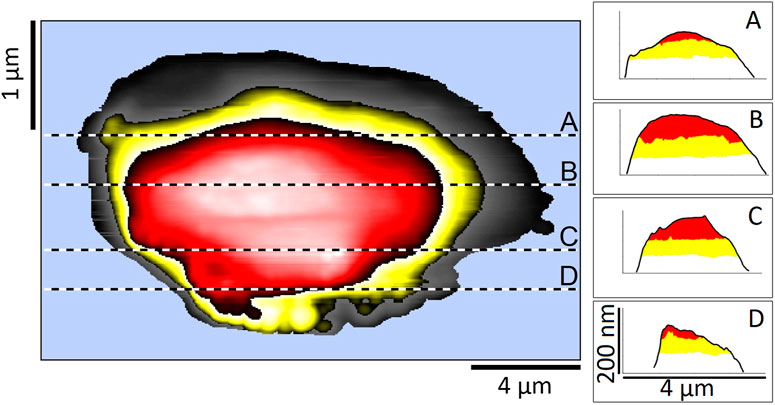
FIGURE 13. Topography (left) and four line profiles [right panel, (A–D)] of test particle No. 2 before testing. Two volumes, worn in two successive tests, are plotted in red and yellow scales from black (low) to white (high). Black and white dashed lines in the topography denote the positions of the profile lines. In the four line profiles with the same X- and Y-ranges, black lines correspond to the unworn particle; the red (yellow) areas mark the worn cross sections after the first (second) test. The sliding direction coincides with the vertical axis of the topography.
The top part of the unworn particle with a height of ca. 180 nm is approximately an ellipsoid cap with cross-sectional axes a = 13.7 µm (X) and b = 4.7 µm (Y). The roughness is ra = 5.6 ± 1.8 nm. After the first test, it becomes rougher (ra = 9.3 ± 1.8 nm). The surface of the worn section is nearly a flat with an average height of ca. 260 nm. After the second test, the surface of the worn section has a height of ca. 200 nm and is even flatter and less rough (ra = 2.7 ± 0.5 nm).
The products of normal force and sliding distance were 16 and 13 μNm and the worn volumes of the particle were 0.175 and 0.2 µm³. The first test yielded, with 0.16 µm³, a considerably smaller wear volume on the disc than the second one (0.7 µm³). The ratio of the particle wear volume to the one of the plane in the first test is close to 1, and hence by far the largest one. In all other experiments, this ratio is smaller (ca. 0–0.22).
Figure 13 demonstrates that, thanks to the exact measurement of the surface before each test, the worn volume of the test particle can be determined with great accuracy. Thereby, a very important factor is the alignment of the respective images through pregnant and unchanged features on the surface. The advantages of this method become even more evident in the next images.
Large changes in wear volume of the test particle can be well examined also in 3D-topographies, as shown for particle No. 4 in Figure 14, where the zero point and the color scale are the same for all topographies. For a better comparison of the topographies, the level between the blue and the brown color scale (200 nm) was put to the height of the worn surface at the end of the experiment (D). The images show both the considerable volume and matter loss due to high sFN values and details concerning the morphology of the contact region including increasing size, flattening, and development of scratches.
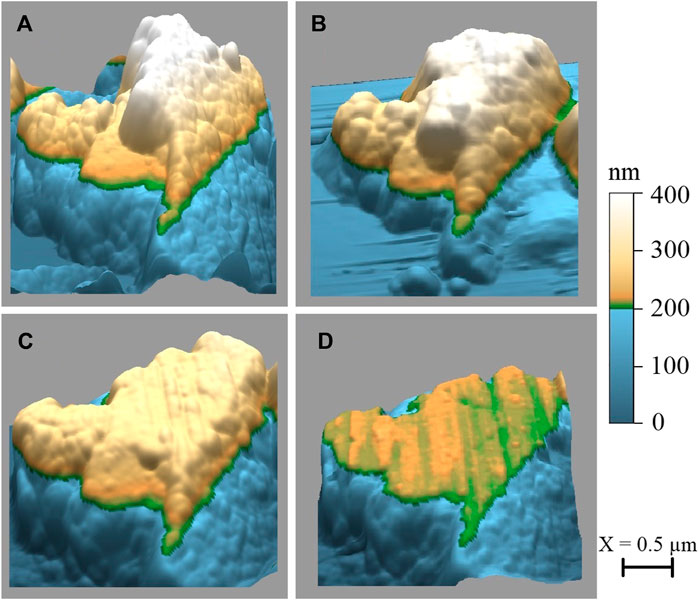
FIGURE 14. Topographies of test particle No. 4 before testing (A) and after eight tests with a total sFN = 5.66 μNm (B), one test with sFN = 54.9 μNm (C), and two tests with a total sFN = 10.6 μNm (D). The separation level between the blue and the brown scale at 200 nm was adjusted to the final height of the worn surface (D) for a better comparison of the four topographies.
It must be noticed that the image of the test particle, obtained with a certain pin of the test grid, due to the additional contact with the surrounding pins, presents artifacts at the borders, which are apparently a part of the particle. This depends on both the angle of the grid respective to the cantilever and on the height of the pins.
Image A in Figure 14 shows the unworn particle before the first test, exhibiting a rather sharp and rough ridge oriented approximately vertically in the sliding direction with steep flanks and a maximum height of ca. 400 nm. The nominal contact area for each test was measured as the area of the worn surface after the test. Since the first test yielded no modifications of the test particle, the first value of the nominal contact area that we could determine was that after the second test (performed with sFN = 0.02 μNm) and resulted to be 0.1 µm2.
Image B shows the particle after eight tests with a total sFN = 5.66 μNm. The top surface has become flatter with slight scratches in the sliding direction and has an approximately triangular shape. It is significantly larger (ca. 0.65 µm2), whereby the maximum height decreased by ca. 50 nm. The sum of the wear volumes of the particle after those eight tests is 27.9 × 10⁻³ μm³; thereby, three tests yielded no wear. The wear volume of the particle is considerably smaller (ca. 10%) than those generated at the plane (between 200 and 350 × 10−3 μm³ depending on corrections due to wear particles).
Significantly larger values of sFN (one test with sFN = 54.9 μNm resp. two tests with a total sFN = 10.6 μNm) yield the topographies shown in the bottom row. Note that panel D depicts the final state of particle No. 4, already presented as SEM image in Figure 1. In both cases (C and D), the top surfaces are flatter and less rough (ra = 2.3 ± 0.2 nm resp. 2.2 ± 0.4 nm), larger, and exhibit evident scratches. The wear volumes of the test particle (Wv,p) are 70 resp. 64.5 × 10⁻³ μm³, those of the plane (Wv,f) are 0.348 (0.148) resp. 1.11 µm³, where the value in brackets was obtained without correction of the contribution of wear particles. Hence, Wv,p/Wv,f is ca. 0.2 (0.5) resp. 0.06. The maximum heights are ca. 260 resp. 215 nm. The nominal contact area has increased to 1.4 resp. 1.9 µm2. Together with the increasingly flat profile of the particle, notably in panel D, the large contact area indicates that particle and plane match better and better after a long series of tests with a large sFN. This is likely to increase the average number of asperities in contact and consequently to affect the local pressure distribution.
The peculiarity of AFM is the possibility to detect and measure very small changes of the particle topography. Therefore, in Figure 15, we present results obtained with particle No. 3 and a test with 10,240 cycles and FN = 6.25 µN, yielding sFN = 3.2 μNm.
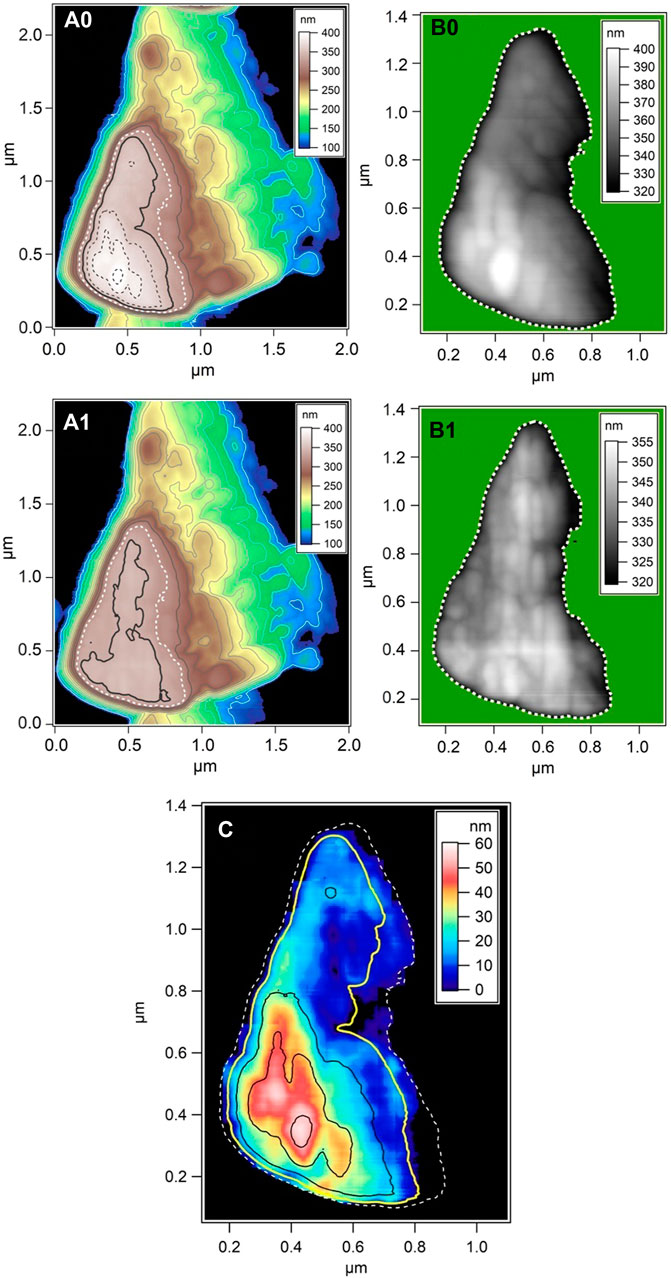
FIGURE 15. Topographies of test particle No. 3 before (A0, B0) and after a test (A1, B1) and heights of the material worn during the test (C). Panels (A0) and (A1) show the overall topographies and panels (B0) and (B1) the section of the surface that has changed in the test. The origin of all axes is the same, except the Z-axis in panel (C). Contours are shown as follows: as colored lines in panels (A0) and (A1) every 20 nm from 100 to 300 nm, as white dashed lines at 320 nm in all images (being the highest unchanged one), as black dashed lines in (A0) or black continuous lines in (C) every 20 nm from 360 to 400 nm (being worn away in A1), and finally as black bold (A0, A1) or yellow lines (C) at 340 nm, being the contour that changed significantly.
At the left, the topography of particle No. 3 is depicted before (A0) and after (A1) the test with 15 and 12 contour lines, respectively. The color scales, the levels of the contours, and the zero points are the same for both topographies. The three highest contours in A0 are absent in A1 since the particle has become lower; the bold black contour has a significantly different shape. All other contours match very precisely. It is evident that imaging with a test grid, though affected by errors due to convolution with the pins, provides an outstanding precision in detecting topographies and wear volumes, which is essential for the examination of nanowear events. Through comparison of the contours, the worn region can be delimited very precisely (white dashed contours), and its topography, shown in panels B0 and B1, can be observed in detail before and after the test. Furthermore, subtracting the two topographies in this region yields the height of the worn material, shown in panel C with contours of the unworn topography at 320 nm (dashed white), 340 nm (yellow), and at 360, 380, and 400 nm (black). The maximum difference in height is about 60 nm. The deviation from the topography before the test is relatively low due to the very flat surface after the test. The characterization of the worn slice can be achieved with remarkable resolution, as shown by the worn grain (highest asperity in image C) as well as by the shallow ridges in the vertical (sliding) direction on the top surface of the particle after the test (B1).
The nominal contact area of the test particle is 0.527 µm2, and the wear volume Wv,p is 0.01 µm³, that is, ca. 10 resp. 5% of the total wear volume (Wv = 0.1 µm³ taking wear particles sticking to the wear track into account or Wv = 0.19 µm³ if they are neglected).
Conclusion
In the present article, we could show for the first time that it is possible to generate and analyze wear of self-mated 100Cr6 steel at the nanoscale using an AFM. To this aim, four random-shaped wear particles were glued to tipless cantilevers and tribotests were performed by scanning them in contact with a steel disc under the variation of test parameters, notably of the normal force and number of cycles. Each test particle was used several times on distinct sections of the plane, in a total of 48 experiments. The worn surfaces of both tribopartners were imaged after each experiment with the AFM, too. The possibility of imaging surfaces with a lateral resolution of some nanometers and of detecting wear phenomena at the nanometer scale – also for rough steel specimens – was demonstrated.
We were able to show that wear can be generated even with normal forces significantly below 1 µN. The imaged wear tracks were qualitatively divided into three morphological categories (1. separated scratches, 2. depressions, and 3. combinations of 1. and 2.). It was found that category 2 occurs more likely for larger normal forces FN and/or number of cycles N and that, for category 1, the depth correlates with FN and N. Instead, the number of scratches depends rather on the number and local distribution of asperities on the test particle.
Consequently, through the reduction of the number of cycles, we were able to generate very shallow wear scars consisting of few isolated scratches with a depth of ca. 1 nm (close to zero wear), which was solely limited by the roughness of the steel disc. Such scars are the product of only few asperities on the test particle. Zero wear was actually obtained in few cases. Unexpectedly, it does not depend on the force or on the form of the test particle.
We examined successive tracks generated with a small sFN and found very similar wear track profiles exhibiting changes like, for example, flattening or splitting of scratches. Hence, blunting and deformation of the asperities on the test particles can be traced with nanometer resolution. We proved that, by examining their position, the scratches on the disc can be ascribed to specific asperities of the test particle.
The observed results in the field of single asperity and zero wear are of fundamental overall importance in tribology, since they demonstrate the possibility of experimental, quantitative studies in this domain, which, though being at the origin of every tribological phenomenon, has been hitherto investigated only through macroscopic tests or simulations.
The observed morphologies were attributed mostly to adhesive wear mechanisms, which seems to be a consequence of small and feedback controlled normal forces. Only few swarf-like wear particles indicate abrasive mechanisms. For macroscopic tests, this is more likely to occur with conformal contacts yielding evenly distributed and hence small pressures, such as after a long running-in phase.
It was also possible to visualize wear particles of different sizes, shapes, and distributions on and beside the wear tracks. Wear particles could roughly be divided into three groups. Small particles (<30 nm) stick mainly on scratches or at their very borders. Medium-sized ones (>50 nm) are often flattened, furrowed, and embedded or even buried into the wear track. Finally, large ones (some hundred nanometers), being presumably the result of abrasion, stick in piles of debris at the reversal points of the scars. Smaller scars and imaging in the tapping mode, thereby reducing tip blunting and mechanical remotion of debris, will be central steps for comprehensive statistics of the size of wear particles at the nanoscale, which is of fundamental importance for simulations.
Especially the analysis of medium wear particles gives insights into fundamental stages of the “history” of wear. Those stages, particularly the incorporation of wear particles in the scar, are of basic importance, as they significantly influence the time development of the wear volume. In particular, we proposed a second way of calculating the wear volume to highlight the contribution of transfer.
Several processes, for example, transfer of wear particles and their incorporation in the scars, made evident at the submicron-scale by our novel measurements, are very difficult to be identified and understood at the macroscopic scale. Therefore, the general importance of this work consists in the preliminary detection, visualization, investigation, and understanding of those isolated nanowear processes, which are likely to be relevant at the macroscopic scale as well.
Future studies will address friction and wear volume. An intriguing question is whether changes in friction and wear values are detectable and quantifiable for single tribological events at the nanoscale. A further reduction of scar sizes as well scanning of discs before and after the tribotests with nanometer resolution will be probably necessary. In addition, the relationship between the wear volume and the product sFN will be an important area of investigation, since extensive experiments and data with 100Cr6 at the macroscopic level are available for comparison.
Data Availability Statement
The raw data supporting the conclusion of this article will be made available by the authors, without undue reservation.
Author Contributions
Both authors have performed in equal parts the experiments and the analysis and have written together the present manuscript.
Conflict of Interest
The authors declare that the research was conducted in the absence of any commercial or financial relationships that could be construed as a potential conflict of interest.
Publisher’s Note
All claims expressed in this article are solely those of the authors and do not necessarily represent those of their affiliated organizations, or those of the publisher, the editors and the reviewers. Any product that may be evaluated in this article, or claim that may be made by its manufacturer, is not guaranteed or endorsed by the publisher.
Acknowledgments
The authors wish to thank Karsten Zieger for sample preparation and Sigrid Benemann for SEM measurements.
References
Arnaud, P., and Fouvry, S. (2018). A Dynamical FEA Fretting Wear Modeling Taking into Account the Evolution of Debris Layer. Wear 412-413, 92–108. doi:10.1016/j.wear.2018.07.018
Bhaskaran, H., Gotsmann, B., Sebastian, A., Drechsler, U., Lantz, M. A., Despont, M., et al. (2010). Ultralow Nanoscale Wear through Atom-By-Atom Attrition in Silicon-Containing diamond-like Carbon. Nat. Nanotech. 5, 181–185. doi:10.1038/nnano.2010.3
Bhushan, B., Israelachvili, J. N., and Landman, U. (1995). Nanotribology: Friction, Wear and Lubrication at the Atomic Scale. Nature 374, 607–616. doi:10.1038/374607a0
Butt, H.-J., Cappella, B., and Kappl, M. (2005). Force Measurements with the Atomic Force Microscope: Technique, Interpretation and Applications. Surf. Sci. Rep. 59, 1–152. doi:10.1016/j.surfrep.2005.08.003
Butt, H.-J. (1991). Electrostatic Interaction in Atomic Force Microscopy. Biophysical J. 60, 777–785. doi:10.1016/S0006-3495(91)82112-9
Cappella, B. (2016). Mechanical Properties of Polymers Measured through AFM Force−distance Curves. Berlin: Springer. doi:10.1007/978-3-319-29459-9
Cappella, B., and Dietler, G. (1999). Force-distance Curves by Atomic Force Microscopy. Surf. Sci. Rep. 34, 1–104. doi:10.1016/S0167-5729(99)00003-5
Carpick, R. W., and Salmeron, M. (1997). Scratching the Surface: Fundamental Investigations of Tribology with Atomic Force Microscopy. Chem. Rev. 97, 1163–1194. doi:10.1021/cr960068q
Chung, K.-H., Lee, Y.-H., and Kim, D.-E. (2005). Characteristics of Fracture during the Approach Process and Wear Mechanism of a Silicon AFM Tip. Ultramicroscopy 102, 161–171. doi:10.1016/j.ultramic.2004.09.009
Dongmo, L. S., Villarrubia, J. S., Jones, S. N., Renegar, T. B., Postek, M. T., and Song, J. F. (2000). Experimental Test of Blind Tip Reconstruction for Scanning Probe Microscopy. Ultramicroscopy 85, 141–153. doi:10.1016/S0304-3991(00)00051-6
Ducker, W. A., Senden, T. J., and Pashley, R. M. (1991). Direct Measurement of Colloidal Forces Using an Atomic Force Microscope. Nature 353, 239–241. doi:10.1038/353239a0
Ducker, W. A., Senden, T. J., and Pashley, R. M. (1992). Measurement of Forces in Liquids Using a Force Microscope. Langmuir 8, 1831–1836. doi:10.1021/la00043a024
Frérot, L., Aghababaei, R., and Molinari, J.-F. (2018). A Mechanistic Understanding of the Wear Coefficient: From Single to Multiple Asperities Contact. J. Mech. Phys. Sol. 114, 172–184. doi:10.1016/j.jmps.2018.02.015
Friedrich, S., and Cappella, B. (2020). Application of Contact-Resonance AFM Methods to Polymer Samples. Beilstein J. Nanotechnol. 11, 1714–1727. doi:10.3762/bjnano.11.154
Friedrich, S., and Cappella, B. (2020). Study of Micro- and Nanoscale Wetting Properties of Lubricants Using AFM Force-Distance Curves. Tribol. Lett. 68, 36. doi:10.1007/s11249-020-1275-3
Godet, M. (1984). The Third-Body Approach: A Mechanical View of Wear. Wear 100, 437–452. doi:10.1016/0043-1648(84)90025-5
Jacobs, T. D. B., Greiner, C., Wahl, K. J., and Carpick, R. W. (2019). Insights into Tribology from In Situ Nanoscale Experiments. MRS. Bull. 44, 478–486. doi:10.1557/mrs.2019.122
Khurshudov, A. G., Kato, K., and Koide, H. (1996). Nano-wear of the diamond AFM Probing Tip under Scratching of Silicon, Studied by AFM. Tribol Lett. 2, 345–354. doi:10.1007/BF00156907
Khurshudov, A. G., Kato, K., and Koide, H. (1997). Wear of the AFM diamond Tip Sliding against Silicon. Wear 203-204, 22–27. doi:10.1016/S0043-1648(96)07447-9
Liley, M., Gourdon, D., Stamou, D., Meseth, U., Fischer, T. M., Lautz, C., et al. (1998). Friction Anisotropy and Asymmetry of a Compliant Monolayer Induced by a Small Molecular Tilt. Science 280, 273–275. doi:10.1126/science.280.5361.273
Milanese, E., Brink, T., Aghababaei, R., and Molinari, J.-F. (2020). Role of Interfacial Adhesion on Minimum Wear Particle Size and Roughness Evolution. Phys. Rev. E 102, 043001. doi:10.1103/PhysRevE.102.043001
Noel, O., Vencl, A., and Mazeran, P.-E. (2017). Exploring Wear at the Nanoscale with Circular Mode Atomic Force Microscopy. Beilstein J. Nanotechnol. 8, 2662–2668. doi:10.3762/bjnano.8.266
Popov, V. L., and Pohrt, R. (2018). Adhesive Wear and Particle Emission: Numerical Approach Based on Asperity-free Formulation of Rabinowicz Criterion. Friction 6, 260–273. doi:10.1007/s40544-018-0236-4
Reichelt, M., and Cappella, B. (2020). Influence of Relative Humidity on Wear of Self-Mated 100Cr6 Steel. Wear 450-451, 203239. doi:10.1016/j.wear.2020.203239
Reichelt, M., and Cappella, B. (2021). Large Scale Multi-Parameter Analysis of Wear of Self-Mated 100Cr6 Steel - A Study of the Validity of Archard's Law. Tribology Int. 159, 106945. doi:10.1016/j.triboint.2021.106945
Strahlendorff, T., Dai, G., Bergmann, D., and Tutsch, R. (2019). Tip Wear and Tip Breakage in High-Speed Atomic Force Microscopes. Ultramicroscopy 201, 28–37. doi:10.1016/j.ultramic.2019.03.013
Thundat, T., Zheng, X.-Y., Chen, G. Y., and Warmack, R. J. (1993). Role of Relative Humidity in Atomic Force Microscopy Imaging. Surf. Sci. Lett. 294, L939–L943. doi:10.1016/0167-2584(93)91119-9
Villarrubia, J. S. (1997). Algorithms for Scanned Probe Microscope Image Simulation, Surface Reconstruction, and Tip Estimation. J. Res. Natl. Inst. Stand. Technol. 102, 425–454. doi:10.6028/jres.102.030
Wäsche, R., Hartelt, M., and Cappella, B. (2014). The Use of AFM for High Resolution Imaging of Macroscopic Wear Scars. Wear 309, 120–125. doi:10.1016/j.wear.2013.11.009
Keywords: nanowear, atomic force microscope, 100Cr6 (AISI 52100) steel, wear particles, single asperity contact, particle transfer, zero wear
Citation: Reichelt M and Cappella B (2021) Micro- and Nanowear of Self-Mated Steel Generated and Studied With an AFM at the Single Asperity Level. Front. Mech. Eng 7:722434. doi: 10.3389/fmech.2021.722434
Received: 08 June 2021; Accepted: 12 July 2021;
Published: 25 August 2021.
Edited by:
Alessandro Ruggiero, University of Salerno, ItalyReviewed by:
T. V. V. L. N. Rao, Madanapalle Institute of Technology and Science (MITS), IndiaStanisław Legutko, Poznań University of Technology, Poland
Copyright © 2021 Reichelt and Cappella. This is an open-access article distributed under the terms of the Creative Commons Attribution License (CC BY). The use, distribution or reproduction in other forums is permitted, provided the original author(s) and the copyright owner(s) are credited and that the original publication in this journal is cited, in accordance with accepted academic practice. No use, distribution or reproduction is permitted which does not comply with these terms.
*Correspondence: Manuel Reichelt, manuel.reichelt@bam.de