Challenges in Microfluidic and Point-of-Care Phenotypic Antimicrobial Resistance Tests
 Sarah H. Needs1
  Sultan I. Donmez1 Stephanie P. Bull1 Conor McQuaid2 Helen M. I. Osborn1 Alexander D. Edwards1*
- 1Reading School of Pharmacy, University of Reading, Reading, United Kingdom
- 2Department of Neuroscience, University of Rochester, Rochester, NY, United States
To combat the threat to public health of antimicrobial resistance, there is a need for faster, more portable diagnostic tools to aid in antibiotic selection. Current methods for determining antimicrobial resistance of pathogens in clinical samples take days to result and require high levels of user input. Microfluidics offers many potential benefits, reducing time to result, user input, and allowing point of care testing. This review focuses on the challenges of developing functional or phenotypic microfluidic antimicrobial susceptibility tests; such methods complement other vital tools such as nucleic acid detection. Some of the most important challenges identified here are not unique to microfluidics but apply to most antimicrobial susceptibility testing innovations and relate to the nature of the sample being tested. For many high priority samples, mixtures of bacteria, highly variable target cell density, and the sample matrix can all affect measurements, and miniaturization can create sensitivity problems if target bacteria are dilute. Recent advances including smartphone capability, new sensors, microscopy, and a resurgence in paper microfluidics offer important opportunities for microfluidic engineering to simplify functional and phenotypic antimicrobial susceptibility testing. But the complexity of most clinical samples remains one of the biggest barriers to rapid uptake of microfluidics for antimicrobial resistance testing.
Background: Why are Antibiotic Susceptibility Tests Important and What are the Limitations of Current Methods?
Many infectious diseases are caused by microorganisms that can be effectively treated using antibiotics. However, antimicrobial resistance (AMR) remains a global threat as pathogens become drug resistant, with estimates of 10 million deaths caused by AMR annually by 2050 (Tagliabue and Rappuoli, 2018). One key priority identified by the World Health Organization (WHO) action plan to tackle AMR is increased testing and surveillance (Mendelson and Matsoso, 2015). Laboratory tests used to determine the antimicrobial sensitivity of these organisms are called antimicrobial susceptibility tests (AST). Traditional AST include broth microdilution, to determine minimum inhibitory concentration (MIC), and disc diffusion on agar. Both methods involve the initial isolation of a bacterial colony from a clinical sample after overnight incubation on solid medium. For broth microdilution, this monomicrobial cell suspension is grown in a microtitre plate in 2-fold dilutions of target antibiotics. The MIC is described as the lowest concentration of antibiotic for which bacterial growth is not seen, and growth is usually measured by light scattering or absorbance. For disc diffusion assays a lawn of the isolated bacteria is plated onto an agar plate and filter discs containing a fixed concentration of antibiotic are placed, allowing antibiotic to diffuse into the solid medium, and the size of the zone of inhibition is measured after overnight growth. These methods have been used for over 50 years and are used both for surveillance (to identify common resistance and inform empirical treatment guidelines) and diagnostics (to select effective treatments for bacterial infections) but are not without their challenges. For example, these methods require multiple rounds of culturing the sample, isolating colonies and growth before and during testing. Time to result is more than 48 h, delivering results after the start of treatment by empirical prescription of antibiotics. Evidence has suggested that up to one fifth of antibiotics prescribed in the UK from 2013–15 were inappropriate (Smieszek et al., 2018). One such way to reduce this figure is to have better diagnostic tools to identify AMR in infections prior to start of treatment, to reduce the inappropriate or ineffective use of antibiotics.
Microfluidic technologies have the potential to be faster and smaller than traditional microbiology phenotypic tests that identify bacteria and determine antimicrobial susceptibility. A number of preliminary microfluidic devices have demonstrated that time to result could be reduced to same day predictions. There are several strategies for the detection of bacteria and bacterial resistance profiles (Figure 1). This review focusses on the challenges of implementing rapid, miniaturized functional or phenotypic measurements of antimicrobial susceptibility.
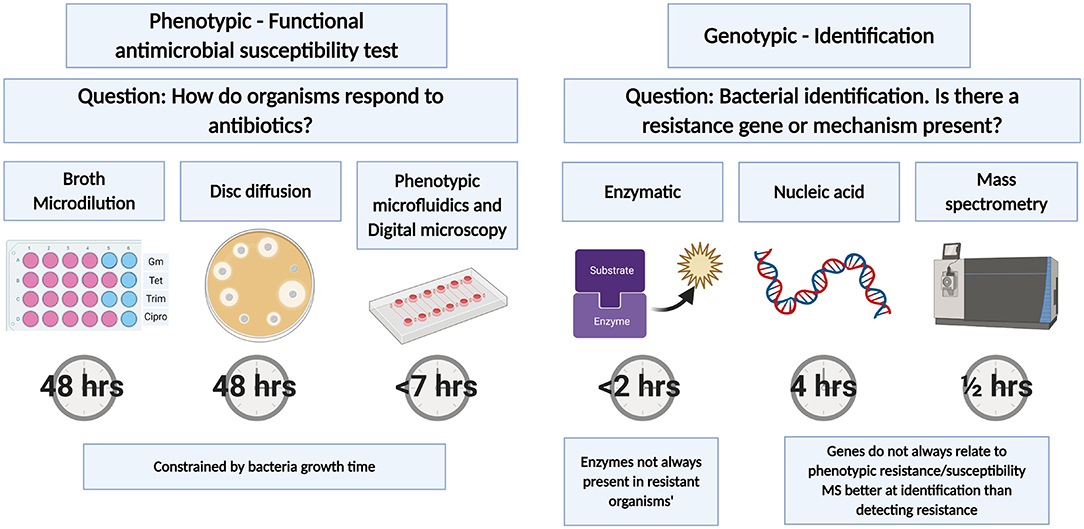
Figure 1. Antimicrobial susceptibility tests. Tests can be split into phenotypic or genotypic tests with traditional AST relying on bacterial growth. Phenotypic microfluidics test times based on commercially available Accelerate PhenoTest™ BC Kit. Genotypic tests are typically faster than phenotypic tests and are more suited to bacterial identification and the identification of genes or enzymes that confer antibiotic susceptibility. Created with BioRender.com.
Current Conventional AST Measurements
Traditional AST measurements are dominated by broth microdilution and disc diffusion. While these are time consuming and labor intensive, they are built on decades of refining and standardizing the measurement of bacterial susceptibility, increasing reproducibility across labs. The European Committee on Antimicrobial Susceptibility testing (EUCAST) provides detailed guidance on correct media preparation to interpretation of results. For broth microdilution, results are only valid if there is clear growth in the positive control (i.e., no antibiotic), the sample is of a pure culture and is inoculated at or near to 5 × 10⁵ CFU/mL. Variation from these exact conditions can significantly affect the MIC measured by these measures and despite standardized approaches, high variation between labs has been recorded (Conville et al., 2012; Espinel-Ingroff et al., 2013; Kavanagh et al., 2019).
Some innovations have accelerated the time to result for conventional methods. For example, the Clinical and Laboratory Standards Institute (CLSI) have identified that direct disc diffusion may be used for some clinical isolates such as blood. Positive blood culture samples are typically monomicrobial as blood is sterile apart from the pathogen (Chandrasekaran et al., 2018). The main variation from gold standard methodology is variation in the inoculum number. Categorical agreement for 20 isolates ranged from 87.8 to 92.2% depending on the media used. Earlier read times were also evaluated, however using both traditional method and direct disc diffusion lead to > 20% of plates being too difficult to read due to light growth at 6 h. Direct testing was found to have the best readability at 7.6 × 1 07-5 × 10⁸ CFU/mL, indicating that a wider range of bacterial inoculums may be able to be used for categorical identification, but not MIC. While this increases the time to result by around 24 h this method does not improve upon standard AST methodology but adapts it.
The Need for Faster Time to Result
The WHO has identified a lack of near-patient testing of bacterial identification and AST, such that antibiotics cannot be prescribed based on evidence, as a gap in existing diagnostics. This is a particular challenge within the context of sepsis, multidrug resistant gonorrhoeae, and distinguishing between bacterial and non-bacterial infections (World Health Organization, 2019). There is no “easy to use” platform for testing samples including blood, urine, stool or respiratory specimens without first culturing the organisms.
Depending on the type of infection, healthcare systems have different requirements for testing. There are a number of bacterial infections for which delaying treatment for 4–6 h does not impact patient outcome, (Naucler et al., 2020) but it would lead to increased workload by either withholding prescriptions or changing prescription based on results. For example, suspected urinary tract infections (UTI) are usually presented in a primary care setting. Because point of care (POC) testing to determine resistance profiles are not readily available, antibiotics are prescribed empirically. Studies using currently available POC tests have received mixed results depending on how they are used. One study considered the use of Flexicult® SSI urinary kits for bacterial identification and determining antimicrobial resistance in primary care settings in the UK. This test uses traditional agar techniques to grow bacteria directly from urine samples and can be used as a POC test without significant investment (37°C incubator). However, the test still requires overnight incubation. The agar contains chromogenic dyes allowing approximate bacterial identification. Portions of the plate contain antibiotics to determine resistant profiles. This study found no difference in patient recovery, UTI recurrence or hospitalization when managed with standard care or with a Flexicult® test (Butler et al., 2018). Comparing the gold standard and Flexicult® test identified a good agreement in resistance profiles, indicating the technique was technically accurate even if no direct patient benefit was found. Although these tests are unlikely to improve patient recovery or hospitalization of patients presenting at primary care with uncomplicated infections, they may still be useful in improving surveillance and reducing sample load for central microbiology labs. A similar study was conducted in Denmark using Flexicult® SSI urinary kit and Flexicult® ID in a general practice for women presenting with UTI symptoms. Similarly there was no improvement in prescription and patient outcome when using these tests however, resistance levels in this area were low and the biggest patient benefit would be expected where higher frequency of resistant bacteria are present, or where empirical selection guidelines are incomplete (Holm et al., 2017). Automated systems have been implemented in secondary care to decrease the hands-on user time. These allow higher throughput but are not used as a point-of-care decision making tool. Many of these involve simple inoculation systems using 96 well plates preloaded with antibiotic solutions, or combined incubation with analysis systems to monitor growth. The Mast Uri® dot (Mast Group Ltd) is an automated inoculator that transfers multiple urine samples to plates containing pre-loaded media allowing for AST and bacterial identification. While the test still requires 18–24 h incubation it decreases user time as liquid handling and analysis are automated.
Beyond UTI, there are other infections such as sepsis where antibiotics cannot be withheld and time to treatment severely impacts patient outcome. These require sampling of different biological matrices with different challenges: for sepsis, a major problem is the very low bacterial concentration in blood (<50 CFU/mL) (Opota et al., 2015; Stranieri et al., 2018) making culture diagnosis difficult, necessitating high sample volume (recommended sample volume for sepsis diagnosis is between 10 and 30 mL Bouza et al., 2007) and long incubation times.
For phenotypic AST, there are alternative ways to measure bacterial growth. Instead of direct detection of bacteria by light scattering (e.g., absorbance in microplates), colorimetric or fluorogenic metabolic dyes can be used to detect growth at earlier timepoints before cell density is high enough detectable light scattering. Furthermore, microscopy can be used to examine cell growth directly, making it possible to measure cell growth even faster.
While growth-based detection tests require long incubation times, there are other important tools to detect AMR (Figure 1) many of which can be faster. Nucleic acid-based detection is fast but cannot directly detect functional resistance—instead, known resistance genes are detected. Likewise, some mass spectrometry microbiology methods have extended beyond bacterial species identification into detecting mass fingerprints of resistance. Finally, many resistance mechanisms are enzymatic (e.g., beta-lactamase) and can be detected with colorimetric or fluorogenic substrates. These methods share the same limitation, that not all resistance genes, enzymes or profiles for pathogens are known and the presence of a known resistant gene or enzyme does not always translate to resistant bacterial phenotype (let alone clinical treatment outcomes), and so functional phenotypic methods remain essential.
Technical Challenges to Phenotypic AST Innovation Relate to Sample Composition
There are many technical difficulties in miniaturizing or speeding up these universally accepted gold standard conventional tests: we focus on several specific technical challenges related to the sample in the following sections. Phenotypic AST methods are constrained fundamentally by the measurement of bacterial cell growth, with or without antibiotics. Different infections are associated with different bacteria with distinct growth rates and resistance profiles. This leads to a need for many distinct protocols. For a diagnostic test, either a flexible platform is required, or tests have to be designed for a very specific and narrow use case. When considering UTI tests, it is unlikely that one single test could be developed that is suitable for UTI diagnosis and AMR identification in all clinical presentations (uncomplicated v complicated, primary v secondary v community care). The most common causative agent for UTI is uropathogenic E. coli (UPEC) with up to 90% of infections caused by Gram-negative bacteria (Kline and Lewis, 2016). But polymicrobial infections are more likely to occur in complicated UTI, such as immunocompromised individuals, those with catherization, and the elderly (Kline and Lewis, 2016). Therefore, a novel AST for uncomplicated UTI may be much easier to develop than for complicated UTI; yet the latter may place a higher burden of morbidity and mortality than uncomplicated UTI that often resolves without treatment.
Alongside technical barriers, the field is also highly regulated and has clinical conventions that can be challenging and expensive to align with when developing new technology. Over many decades, overarching groups such as EUCAST have identified specific and reproducible methods for determining the AST conditions for many organisms that have known clinical implications. Any new device entering the market may need to demonstrate the same susceptibility profiles as current protocols approved by regulators. Aligning the results of novel microfluidic tests with the outputs of “gold standard” conventional methods such as disc diffusion that are widely familiar to clinicians and public health systems may require expensive wide-scale clinical trials. Innovative devices can use diverse measurements that can be difficult to align with inhibition zone diameters. The most directly comparable results should be the more quantitative MIC that are typically measured by broth microdilution, as these are designed to be directly linked to growth in clinically significant concentrations of antibiotic related to therapeutic levels achieved in patients. However, many devices use single concentration breakpoints to identify susceptibility profiles of multiple antibiotics; it becomes critical to ensure these breakpoint concentrations are aligned to clinically accepted values.
Influence of Sample Matrix on Assays
The first step in using gold standard methods of AST is the overnight culture and isolation of bacteria from the sample. Using a sample directly for AST tests without plating and colony isolation immediately reduces the time to result by 18–24 h, cuts labor in picking colonies, and simplifies sample preparation. Together, direct sample testing is an attractive target and represents a “holy grail” for AST innovation. However, biological samples are a complex mixture of molecules many of which can significantly affect most biological analysis methods. This is even more problematic as samples can vary significantly between individuals. Samples can vary widely in pH, nutrient composition, inoculum number, the number of bacterial species (polymicrobial populations). They can also contain varying levels of components that directly affect bacterial growth, not only antimicrobial agents but also components that can bind and inactivate the test antibiotic. Different patient groups (catheterized, elderly, pregnant) and clinical history (diet, medication, liquid intake before sampling, complicated or uncomplicated infection etc.) can dramatically alter sample matrix composition, making the composition of clinical samples from patients often very different from healthy controls. Studies looking at the growth of E. coli in different canine urine composition found that increased urine concentration (higher urine specific gravity) and higher pH levels showed decreased levels of E. coli growth after 4 h (Thornton et al., 2018).
Urine components such as high levels of ascorbic acid can lead to false negative results in dipstick tests (Mambatta et al., 2015). Resazurin dye reduction is commonly used to detect metabolism changing from blue to a pink color and from non-fluorescent to a strong red fluorescence in the presence of metabolically active bacteria. Resazurin has been incorporated in a number of AMR microfluidic devices as well as traditional broth microdilution methods (Boedicker et al., 2008; Elavarasan et al., 2013; Elshikh et al., 2016; Hsieh et al., 2018; Kao et al., 2020). However, the fluorescence of resorufin (the product of resazurin) is suspectable to changes in pH. Furthermore, high ascorbic acid levels can directly reduce resazurin in the absence of bacteria (Natto et al., 2012). Urine pH also causes complications for many diagnostic tests. Other chromogenic dyes used to detect bacterial growth are pH dependent. Urine pH can range from pH 4–9 with more alkaline pH associated with P. mirabilis in contrast to E. coli that is associated with more acidic pH (Lai et al., 2019). Devices using pH dependent dyes to monitor bacterial growth such as phenol red (Cira et al., 2012; Reis et al., 2016; Lee et al., 2019) may risk false positive results when using direct urine samples. The application of the microfluidic test is an important factor when choosing which indicator to use.
Agar based methods are good for direct sampling as this dilutes the biological sample such as urine or blood with the solid agar medium and can provide semi-quantitative measurement of bacteria number. Flexicult® Vet is used in veterinary surgeries to determine UTI and AST on direct urine samples from cats and dogs (Guardabassi et al., 2015). The sample is applied to the plate and excess sample is removed. The plates do not provide an MIC or zone of inhibition but can functionally identify which bacteria grow or are inhibited by certain antibiotics which can aid in prescription practices. Similar products using agar methods for adaptable point of care testing include Diaslide, Uricult Trio, and Dipstreak. But the benefits of solid media are offset by the need for 18–24 h incubation, likely to be too slow in a primary care setting to change current prescription practices. The ease of use and availability does make it attractive for decentralized surveillance schemes or in areas with high prevalence of resistant bacteria or limited data to inform empirical antibiotic selection.
Polymicrobial Populations in Samples
Measuring bacterial growth directly in samples also raises the challenge of potential polymicrobial populations. This can be a pathogen plus harmless commensal organisms, or multiple pathogens. Many tests do not distinguish between different bacterial species because they are designed for single colony isolates. Isolation of bacteria from a sample using agar plates provides partial identification, either using chromogenic agar to identify enzyme activity of different bacteria (Chaux et al., 2002) or selective agar plus identification of colony morphology. Antibiotic treatment of polymicrobial infections is not fully understood and treatment is made to target the most likely organism (Lasa and Solano, 2018; Hebert et al., 2020). UTI infections that involve two or more pathogens are much rarer and analysis of mixed cultures is unclear. Public Health England (PHE) determines a polymicrobial infection if each isolate is 105 CFU/mL but for analytical technology polymicrobial culture should be considered to also include a single pathogen mixed with commensal contaminants (Lough et al., 2019). There is a lack of consensus as to the definition and role of polymicrobial infections (Garg and Garg, 2017). This can make the need for bacterial identification more or less important depending on the infection. For UTIs polymicrobial infections are more common in complicated infections making identification more important than uncomplicated infections. It may be possible and advantageous for infections with a high risk to be paired with a rapid genotypic method to positively identify certain specific target pathogenic bacteria that are associated with the most patient harm.
Inoculum Effect
The initial inoculum cell density significantly affects MIC determination as higher cell densities of susceptible organisms may still show measurable growth in the presence of an inhibitory concentration of antibiotic (Postek et al., 2018; Smith and Kirby, 2018). This poses a significant challenge for direct testing measurements as the initial concentration of bacteria in patient samples is unknown. The inoculum effect (IE) refers to decreased antibiotic efficacy on increasing bacterial numbers, and this effect is more pronounced for measuring β-lactam susceptibility in β-lactamase positive bacteria (Smith and Kirby, 2018). The Clinical and Laboratory Standards Institute (CLSI) define the accepted range of inoculum number between 2 × 10⁵−8 × 10⁵ CFU/mL. Within this accepted inoculum range, when Enterobacteriaceae were tested against meropenem, an 8-fold-difference in MIC was observed (Smith and Kirby, 2018). Many potential diagnostic tools for AMR use a single breakpoint concentration based on EUCAST guidelines. EUCAST breakpoints are calculated from MIC results and categorizes bacteria as susceptible, resistant or intermediate for different antibiotics (Turnidge and Paterson, 2007). However, using an unknown inoculum concentration with a fixed breakpoint antibiotic concentration may lead to errors in susceptibility classification.
To control for this effect, some microfluidic devices include an initial inoculum normalization step such as sample filtering and dilutions. One example uses a pre-filtering step using syringe filters to trap bacteria followed by resuspension, manual counting and final dilution to EUCAST guidelines in growth media. While this still requires a lot of user time, it reduces the overnight culture step from 18 to 24 h to under 1 h and eliminates the matrix effect. The bacteria are then grown in nanoliter volumes using resazurin to detect bacterial growth in the presence of antibiotics (Avesar et al., 2017). Using time-lapse fluorescence microscopy, a different in growth curves is evident within 5.5 h.
This effect can also be overcome using microfluidic bacterial counting techniques. Due to the miniaturized nature of microfluidics, hundreds of conditions in microlitre-picolitre volumes can be run simultaneously in a single device. The multi-RAPiD method takes serial dilutions of a sample loaded into picochambers on chip in the presence of resazurin. Chambers with bacteria present become fluorescent and using Poisson distribution of the positive and negative chambers the initial inoculum number can be determined. This method identified good match between expected and counted positive chambers for both E. coli and S. aureus (Hsieh et al., 2018). The same outcome can be achieved using time-lapse imaging to build growth curves with dilutions of starting inoculum number. The time taken to reach a certain density or fluorescence intensity if using a dye such as resazurin can be used to calculate the starting inoculum (Travnickova et al., 2019). These counting methods can be incorporated with devices containing antibiotics to generate AST or MIC results.
Analytical Sensitivity Following Miniaturization
Miniaturization can reduce detection times and allow detection of single cells. However, the cell concentration in some samples may not be directly compatible with some microdevices because the smaller the sample volume tested, the fewer cells will be present and for example 103 CFU/mL is equivalent to only 1 CFU per 1 microlitre of sample (Figure 2). The clinical range for UTI diagnosis can range from ≥ 103 CFU/mL (Wilson and Gaido, 2004). A device that has an average of 1 CFU/device with a sample volume of 1 μL can potentially detect 103 CFU/mL. Therefore, it is important when engineering microdevices that the sample volume tested will have sufficient bacterial cells at the clinically relevant pathogen concentration for that infection. Within this range, speed of detection can be increased by increasing sample volume because for cell-growth based analysis the more bacteria per device the faster the detection will be (Elshikh et al., 2016).
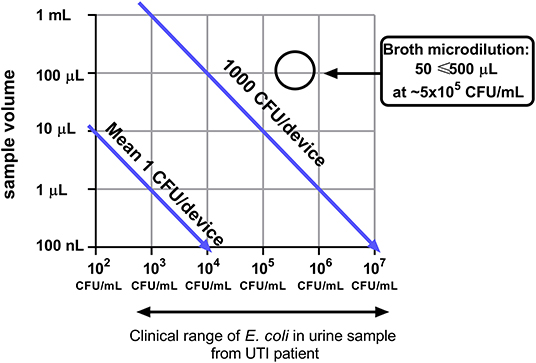
Figure 2. Device miniaturization limits the number of bacterial cells sampled. Broth microdilution conditions from EUCAST are highlighted (EUCAST, 2003).
Microfluidics uses different approaches for miniaturization of reactions including microdroplet formation (Idelevich et al., 2018) and microchambers in fabricated devices (Avesar et al., 2017; Azizi et al., 2018). The high surface to volume ratios of microdevices have shown increased bacterial growth rates compared to larger volume containers (10 μL v 13 mL) such as conical flasks (Chen et al., 2010). Studying the single cell dynamics in these high surface area to volume devices allow faster bacterial growth detection and therefore divergence of growth curves in the presence of antibiotics will be able to determine AST faster than bulk analysis relying on color change or OD measurements. However, using smaller sample volumes also reduces the number of bacteria in the devices. Some microfluidic devices enhance bacterial detection by flowing larger sample volumes through the device, capturing or trapping bacteria. This can be achieved by immunocapture (Olanrewaju et al., 2017; Pereiro et al., 2017; Alves and Reis, 2019) or by physical boundaries (Pitruzzello et al., 2019).
The majority of these challenges are innate to the sample tested rather than the methodology. The power of conventional AST methods becomes clearer as they overcome these challenges by apparently simple steps. For example, plating on agar plates simultaneously removes the sample matrix, normalizes cell number, and provides a monomicrobial culture, before subsequent AST measurements. Rapid AST devices must either bypass some of these steps or optimize the speed for each step.
New Opportunities for Microfluidic Antibiotic Susceptibility Testing
In spite of these challenges, recent developments around microfluidic devices still offer massive potential for rapid portable AST. Although some microfluidic devices still require laboratory equipment to record results (e.g., fluorescence microscopy), the increased availability of low-cost yet high performance hardware—such as imaging devices and other optoelectronics—makes developing microfluidic reader systems more affordable (Needs et al., 2019). For instance, smartphone cameras combined with imaging systems built from microscopy components make POC fluorescence microscopy affordable (Chen et al., 2019). A summary of recent phenotypic AST microfluidic devices is shown in Table 1.
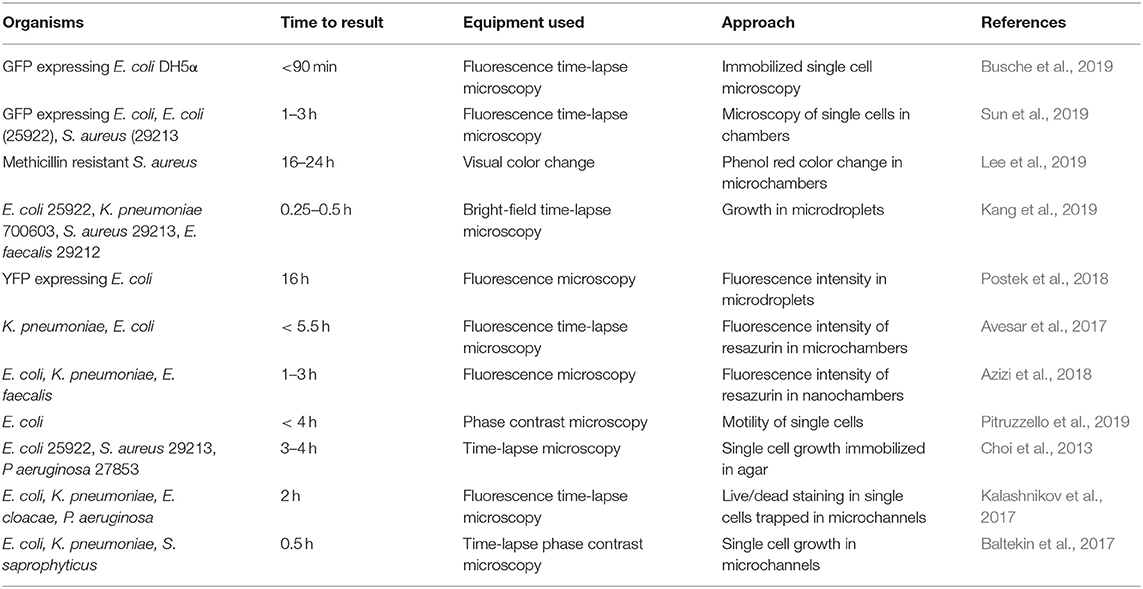
Table 1. Summary of phenotypic antimicrobial susceptibility tests.
Digital Microscopy
Digital microscopy is used to monitor changes in microfluidic devices allowing imaging of single cells and monitoring color or fluorescence changes in microchambers. Visually monitoring motile bacteria such as E. coli using microscopy can be a fast, but a user intensive method to identify urine bacteraemia. After an incubation with different antibiotics, changes in cell motility can be observed by eye. However, to increase throughput and reproducibility automated analysis systems are required. The majority of imaging-based detection methods of AST use time-lapse imaging to identify the earliest divergence in bacterial growth in reaction to different antibiotic exposure. The Accelerate PhenoTest BC system received FDA approval in 2017 for determining susceptibility in direct, positive blood cultures within 7 h. This approved method uses time-lapse imaging to follow bacterial growth in the presence of antibiotics. For life threatening infections like blood infections this advance is needed (Charnot-Katsikas et al., 2018). This automated microscopic AST system illustrates the opportunities for cell imaging.
Microfluidics and digital microscopy can be combined with computation to examine cell behavior in the presence of antibiotics and to automate the analysis of antibiotic susceptibility. One such device uses cup-shaped traps to monitor the motility of single bacteria in the presence of different antibiotics to identify susceptible strains within 2 h of exposure. Phase contrast microscopy is used to monitor the individual traps, and simple pixel intensity of the trap over time monitors the motility of the bacteria (Pitruzzello et al., 2019). Other devices use physical traps in conjunction with time lapse imaging of single cells to monitor growth rather than motility. These methods both accumulate bacteria from a sample and can potentially replace the biological sample matrix (i.e., blood/urine) with growth media. GFP expressing E. coli were trapped in a channel-based device using hydrodynamic pressure. Parallel channels linked by a nanogap allowed media exchange while retaining cells along the edge of a single channel. The cells were monitored every 30 s for 90 min and cell chain length was calculated for bacterial growth. Within 90 min it was possible to determine decreased growth in samples with media containing 200 μg/mL kanamycin (Busche et al., 2019). Other trap designs have used narrow channels (1.25 × 1.25 × 50 μm) with a block at one end that captures bacteria but maintains media flow. Using phase contrast microscopy, the length of the channel occupied with bacterial cells is calculated over time with either growth media or in the presence of the antibiotic of choice. Using this method, differences in growth time are detected within 30 min (Baltekin et al., 2017). Alternatives to physical traps include non-specific binding to epoxide modified microchannels. Antibiotic containing media can then be flowed through the channels and live/dead cells were monitored by time-lapse microscopy using phase contrast and SYTOX orange fluorescence marker (Kalashnikov et al., 2017). This method was able to detect susceptibility of Gram-negative bacteria within 60 min.
Additional approaches for bacterial immobilization in microfluidic devices use agar based techniques. The microfluidic agarose channel device flows liquid agarose and bacteria mix into the device which solidifies. Antibiotic containing media flows over the agarose layer and diffuses into the agarose/bacteria mix. Bacterial growth is monitored using time-lapse imaging and simple image analysis generating binary images the area of bacteria growth in different channels can be calculated. MIC and AST measurements can be detected within 4 h (Choi et al., 2013).
Other single cell microscopy methods have combined antibiotic gradient generators with bacteria cell culture microchambers (Li et al., 2014b; Kim et al., 2015; Malmberg et al., 2016). GFP-expressing E. coli were monitored by fluorescence microscopy in cultivation chambers linked to an antibiotic gradient device (Sun et al., 2019). The challenge of using this method is to create a gradient of significant range for clinical relevance as many gradient generators have a small range. Broth microdilution methods use a 2-fold dilution series over multiple dilutions (between 8 and 11 dilutions). This has been demonstrated by using a gradient generator that provides 2-fold dilutions over 7 channels (Kim et al., 2015).
Trap-based assays are less likely to be affected by sample matrix or inoculum effect. The biological sample is flowed through the device, the bacterial cells are captured/immobilized, and the biological sample is replaced with nutrient media or a constant flow of nutrient media. These techniques reduce the effects of sample matrix on results and can rapidly detect differentials in growth curves. They are also beneficial for samples containing low levels of bacteria, such as blood infections as higher volumes of sample can be passed through the devices. Other methods, such as the agarose immobilization, do not allow this and the bacteria measured are limited to the concentration in the sample (Figure 2). The use of high-resolution fluorescence microscopy and liquid handling machinery makes the usage of these devices in a clinical setting unlikely since they require high investment, user training and are unlikely to provide high throughput testing capacity.
Smartphone Imaging
Smartphone use is being explored to enhance the usability or analysis of POC testing. Many microfluidic and POC tests are based on color changes which can be read by the eye while with devices using micro- or picochambers this can be challenging. Adding an imaging technique, can allow devices to use automatic image analysis techniques or provide quantitative or semi-quantitative data based on the level of color or fluorescence intensity relating to the level of biomarkers/growth. Recent advances in smartphone camera systems and the combination of microscopy accessories can be added to provide low-cost, portable microscopy systems for bright-field, dark-field or fluorescence imaging (Hernández-Neuta et al., 2019; Kheireddine et al., 2019). Smartphones have also been used for complex analysis, increased usability through patient interface for home testing or as a controller to drive mechanical parts of microfluidic devices (Li et al., 2014a; Arango et al., 2018; Temiz and Delamarche, 2018). As many microfluidics devices are targeting POC tests, the readability of the results is an important aspect of the overall system. When used as a companion to microfluidic tests, smartphones are a prospective low-cost clinical device. The images obtained can be analyzed either by a custom app or processed manually.
One example of quantitative smartphone detection uses immunocapture of E. coli in synthetic urine in microcapillaries. This sandwich-based ELISA device uses fluorescent substrate to detect captured bacteria. Using a simple LED and emission filter setup, the fluorescent intensity of the microcapillaries were detected using a smartphone camera with magnification lens (Alves and Reis, 2019). This technique can determine quantitative levels of bacteria in samples based on the fluorescence production. Similarly, smartphone imaging has been used for the immuno-detection of norovirus on a paper microfluidic device. An external objective lens was added with low-cost filters to detect fluorescent color changes (Chung et al., 2019). The virus particles are captured by antibodies and particle aggregation allows detection of single viral particles enabling an extremely low limit of detection (LOD).
One challenge when using smartphone camera detection is that software embedded in the camera often automatically adjusts the settings to deliver the “best” image for a consumer user. Different images may be recorded with different exposure settings. The camera settings may be fixed (Chung et al., 2019) which can be challenging for different models and requires the same model phone to be used with the specific test, limiting potential users of the device, and making the use of personal phones unlikely. Others include a color chart (Shen et al., 2012) or reference sample of known fluorescence intensity so images can be normalized during image analysis (Alves and Reis, 2019).
Bacteriophage Based Sensors
While antibiotic susceptibility tests dominate the diagnostic need, developments are being made for the exploration of bacteriophage treatments (Kutateladze and Adamia, 2010). Bacteriophages have a different mechanism of action to antibiotics. To fully take advantage of this method as a therapy, complimentary systems for the rapid, low-cost, and reliable detection of bacteria and determination of phage specificity of an infectious organism are needed (Farooq et al., 2018). Bacteriophage can also be engineered and used as tools for bacterial detection. Bacteriophage can bind to bacteria with high specificity potentially determining bacterial identification and AST. This is already being put into practice in the Smarticles (Roche) system. Bacteriophage reporters containing luciferase genes are used to measure viable bacterial growth measuring luminescence instead of turbidity. This method was also used in conjunction with a model of blood infections. Bacteria were separated from red blood cells using an acoustophoretic microfluidic chip comprised of a single channel with side and center inlets and outlets. The acoustophoresis causes the red blood cells but not the bacteria to move to the center channel and these are discarded via the center outlet, while the bacterial cells are collected via the side outlets. After bacteria collection a plate based luminescent bacteriophage assay was performed (Dow et al., 2018), indicating microfluidic devices can be used for the rapid purification of bacteria from samples which can be adapted into an AST workflow.
Paper Microfluidics
Microfluidic paper-based analytical devices (μPADs) are another alternative for AMR detection. These are especially robust for transport and storage and are typically made of low-cost fabrication materials. They can be produced in a wide variety of sizes, shapes and layers, and desired molecules can be easily immobilized onto the paper, so the area of use and the target cell can be diverse. Hydrophilic regions provide a spontaneous microfluidic platform on μPADs reducing the need for complex laboratory equipment such as pumps for liquid handling and are therefore easy to use (one-step procedure). Colourimetric methods are generally preferred for μPADs so the results can be visualized by eye and do not require a dedicated reader (Martinez et al., 2010; Hu et al., 2014).
A panel of four common antibiotics was tested against E. coli using a laser-patterned paper based device. This device used chromogenic agar as a nutrient source and to visualize the bacteria when incubated at 37°C overnight (He et al., 2020). A filter paper layer then wicks the sample via capillary action and distributes throughout the device without the need for additional equipment. The final layer contains laser-patterned wells containing different antibiotics. Another paper-based device was used to measure β-lactam resistance in bacterial samples taken from wastewater. This study used enzyme based β-lactamase detection using the substrate nitrocefin for color change which was captured by camera phone and was able to quantify the color change in nitrocefin which was found to deliver the same LOD as measured in a microtitre plate and plate reader. In another paper-based system, antibiotic susceptibilities of E. coli and S. typhimurium were examined using resazurin-based detection. The system uses standard culture media in a reservoir and requires 18 h incubation (Deiss et al., 2014). Paper microfluidics may not provide a faster detection method, although researchers are exploring direct sampling methods such as urine and environmental samples for bacterial detection and AST. The strength of these methods relies on portability, stability and reduced need for laboratory equipment. Paper microfluidics offer a cheap alternative at a cost of $ 0.20 (Boehle et al., 2017). They are also more likely to be useful in samples that have a higher density of bacteria and where a high volume of sample is available, such as UTI.
Conclusion
Microfluidic techniques have many benefits for developing portable, point-of-care diagnostics but there are significant hurdles to overcome to develop rapid AST methods. Sample matrix, inoculum effect and polymicrobial populations are still challenges for conventional AST measurements. Whilst aPOC phenotypic AST is a long way off, significant improvements in the use of digital microscopy and smartphone imaging and novel sensors are likely to increase the use of single cell detection for rapid AST. An important factor in deciding which microfluidic strategy to use is the type of infection being targeted, and the clinical pathway it is expected to add to or disrupt. For instance, devices which accumulate bacteria may be useful for low concentration threshold infections such as blood stream infections and would be expected to join a secondary care setting whereas POC tests for uncomplicated UTI would need minimal sample preparation and equipment. The use of paper microfluidic in this area can provide stable point of care testing. Not only are these devices needed for the effective treatment of life-threatening infections and effective treatment of disease, surveillance of antibiotic resistance in health, agriculture, and environmental samples are also needed to monitor and better tackle the emergence of antimicrobial resistance.
Author Contributions
SN, SB, SD, and AE were involved in writing—original draft preparation. SN, SB, SD, HO, CM, and AE were involved in writing—review and editing. SN, CM, and AE were involved in visualization. AE was responsible for funding acquisition. All authors contributed to the article and approved the submitted version.
Funding
This work was funded by grants from the EPSRC reference number EP/R022410/1 and EP/S010807/1.
Conflict of Interest
The authors declare that the research was conducted in the absence of any commercial or financial relationships that could be construed as a potential conflict of interest.
References
Alves, I. P., and Reis, N. M. (2019). Microfluidic smartphone quantitation of Escherichia coli in synthetic urine. Biosens. Bioelectron. 145:111624. doi: 10.1016/j.bios.2019.111624
Arango, Y., Temiz, Y., Gökçe, O., and Delamarche, E. (2018). Electrogates for stop-and-go control of liquid flow in microfluidics. Appl. Phys. Lett. 112:153701. doi: 10.1063/1.5019469
Avesar, J., Rosenfeld, D., Truman-Rosentsvit, M., Ben-Arye, T., Geffen, Y., Bercovici, M., et al. (2017). Rapid phenotypic antimicrobial susceptibility testing using nanoliter arrays. Proc. Natl. Acad. Sci. U.S.A. 114:E5787. doi: 10.1073/pnas.1703736114
Azizi, M., Zaferani, M., Dogan, B., Zhang, S., Simpson, K. W., and Abbaspourrad, A. (2018). Nanoliter-sized microchamber/microarray microfluidic platform for antibiotic susceptibility testing. Anal. Chem. 90, 14137–14144. doi: 10.1021/acs.analchem.8b03817
Baltekin, Ö., Boucharin, A., Tano, E., Andersson, D. I., and Elf, J. (2017). Antibiotic susceptibility testing in less than 30 min using direct single-cell imaging. Proc. Natl. Acad. Sci. U.S.A. 114:201708558. doi: 10.1073/pnas.1708558114
Boedicker, J. Q., Li, L., Kline, T. R., and Ismagilov, R. F. (2008). Detecting bacteria and determining their susceptibility to antibiotics by stochastic confinement in nanoliter droplets using plug-based microfluidics. Lab Chip 8, 1265–1272. doi: 10.1039/b804911d
Boehle, K. E., Gilliand, J., Wheeldon, C. R., Holder, A., Adkins, J. A., Geiss, B. J., et al. (2017). Utilizing paper-based devices for antimicrobial-resistant bacteria detection. Angew. Chem. Int. Ed. Engl. 56, 6886–6890. doi: 10.1002/anie.201702776
Bouza, E., Sousa, D., Rodríguez-Créixems, M., Lechuz, J. G., and Muñoz, P. (2007). Is the volume of blood cultured still a significant factor in the diagnosis of bloodstream infections? J. Clin. Microbiol. 45, 2765–2769. doi: 10.1128/JCM.00140-07
Busche, J. F., Moller, S., Stehr, M., and Dietzel, A. (2019). Cross-flow filtration of Escherichia coli at a nanofluidic gap for fast immobilization and antibiotic susceptibility testing. Micromachines 10:691. doi: 10.3390/mi10100691
Butler, C. C., Francis, N. A., Thomas-Jones, E., Longo, M., Wootton, M., Llor, C., et al. (2018). Point-of-care urine culture for managing urinary tract infection in primary care: a randomised controlled trial of clinical and cost-effectiveness. Br. J. Gen. Pract. 68, e268–78. doi: 10.3399/bjgp18X695285
Chandrasekaran, S., Abbott, A., Campeau, S., Zimmer, B. L., Weinstein, M., Thrupp, L., et al. (2018). Direct-from-blood-culture disk diffusion to determine antimicrobial susceptibility of gram-negative bacteria: preliminary report from the clinical and laboratory standards institute methods development and standardization working group. J. Clin. Microbiol. 56, e01678–17. doi: 10.1128/JCM.01678-17
Charnot-Katsikas, A., Tesic, V., Love, N., Hill, B., Bethel, C., Boonlayangoor, S., et al. (2018). Use of the accelerate pheno system for identification and antimicrobial susceptibility testing of pathogens in positive blood cultures and impact on time to results and workflow. J. Clin. Microbiol. 56, e01166–17. doi: 10.1128/JCM.01166-17
Chaux, C., Crepy, M., Xueref, S., Roure, C., Gille, Y., and Freydiere, A. M. (2002). Comparison of three chromogenic agar plates for isolation and identification of urinary tract pathogens. Clin. Microbiol. Infect. 8, 641–645. doi: 10.1046/j.1469-0691.2002.00433.x
Chen, C. H., Lu, Y., Sin, M. L. Y., Mach, K. E., Zhang, D. D., Gau, V., et al. (2010). Antimicrobial susceptibility testing using high surface-to-volume ratio microchannels. Anal. Chem. 82, 1012–1019. doi: 10.1021/ac9022764
Chen, K. L., Ven, T. N., Crane, M. M., Chen, D. E., Feng, Y. C., Suzuki, N., et al. (2019). An inexpensive microscopy system for microfluidic studies in budding yeast. Transl. Med. Aging 3, 52–56. doi: 10.1016/j.tma.2019.05.001
Choi, J., Jung, Y. G., Kim, J., Kim, S., Jung, Y., Na, H., et al. (2013). Rapid antibiotic susceptibility testing by tracking single cell growth in a microfluidic agarose channel system. Lab Chip 13, 280–287. doi: 10.1039/C2LC41055A
Chung, S., Breshears, L. E., Perea, S., Morrison, C. M., Betancourt, W. Q., Reynolds, K. A., et al. (2019). Smartphone-based paper microfluidic particulometry of norovirus from environmental water samples at the single copy level. ACS Omega 4, 11180–11188. doi: 10.1021/acsomega.9b00772
Cira, N. J., Ho, J. Y., Dueck, M. E., and Weibel, D. B. (2012). A self-loading microfluidic device for determining the minimum inhibitory concentration of antibiotics. Lab Chip 12, 1052–1059. doi: 10.1039/C2LC20887C
Conville, P. S., Brown-Elliott, B. A., Wallace, R. J. Jr., Witebsky, F. G., Koziol, D., Hall, G. S., et al. (2012). Multisite reproducibility of the broth microdilution method for susceptibility testing of Nocardia species. J. Clin. Microbiol. 50, 1270–1280. doi: 10.1128/JCM.00994-11
Deiss, F., Funes-Huacca, M. E., Bal, J., Tjhung, K. F., and Derda, R. (2014). Antimicrobial susceptibility assays in paper-based portable culture devices. Lab Chip 14, 167–171. doi: 10.1039/C3LC50887K
Dow, P., Kotz, K., Gruszka, S., Holder, J., and Fiering, J. (2018). Acoustic separation in plastic microfluidics for rapid detection of bacteria in blood using engineered bacteriophage. Lab Chip 18, 923–932. doi: 10.1039/C7LC01180F
Elavarasan, T., Chhina, S. K., Parameswaran, M., and Sankaran, K. (2013). Resazurin reduction based colorimetric antibiogram in microfluidic plastic chip. Sens. Actuators B Chem. 176, 174–180. doi: 10.1016/j.snb.2012.10.011
Elshikh, M., Ahmed, S., Funston, S., Dunlop, P., Mcgaw, M., Marchant, R., et al. (2016). Resazurin-based 96-well plate microdilution method for the determination of minimum inhibitory concentration of biosurfactants. Biotechnol. Lett. 38, 1015–1019. doi: 10.1007/s10529-016-2079-2
Espinel-Ingroff, A., Arendrup, M. C., Pfaller, M. A., Bonfietti, L. X., Bustamante, B., Canton, E., et al. (2013). Interlaboratory variability of Caspofungin MICs for Candida spp. Using CLSI and EUCAST methods: should the clinical laboratory be testing this agent? Antimicrob. Agents Chemother. 57, 5836–5842. doi: 10.1128/AAC.01519-13
EUCAST (2003). Determination of minimum inhibitory concentrations (MICs) of antibacterial agents by broth dilution. Clin. Microbiol. Infect. 9, ix–xv. doi: 10.1046/j.1469-0691.2003.00790.x
Farooq, U., Yanga, Q., Ullah, M. W., and Wang, S. (2018). Bacterial biosensing: recent advances in phage-based bioassays and biosensors. Biosens. Bioelectron. 118, 204–216. doi: 10.1016/j.bios.2018.07.058
Garg, S. K., and Garg, P. (2017). Polymicrobial blood stream infection: consensus definition is required. Indian J. Crit. Care Med. 21, 712–713. doi: 10.4103/ijccm.IJCCM_129_16
Guardabassi, L., Hedberg, S., Jessen, L. R., and Damborg, P. (2015). Optimization and evaluation of Flexicult(R) Vet for detection, identification and antimicrobial susceptibility testing of bacterial uropathogens in small animal veterinary practice. Acta Vet. Scand. 57:72. doi: 10.1186/s13028-015-0165-4
He, P. J. W., Katis, I. N., Kumar, A. J. U., Bryant, C. A., Keevil, C. W., Somani, B. K., et al. (2020). Laser-patterned paper-based sensors for rapid point-of-care detection and antibiotic-resistance testing of bacterial infections. Biosens. Bioelectron. 152:112008. doi: 10.1016/j.bios.2020.112008
Hebert, C., Gao, Y., Rahman, P., Dewart, C., Lustberg, M., Pancholi, P., et al. (2020). Prediction of antibiotic susceptibility for urinary tract infection in a hospital setting. Antimicrob. Agents Chemother. 64:e02236-19. doi: 10.1128/AAC.02236-19
Hernández-Neuta, I., Neumann, F., Brightmeyer, J., Ba Tis, T., Madaboosi, N., Wei, Q., et al. (2019). Smartphone-based clinical diagnostics: towards democratization of evidence-based health care. J. Intern. Med. 285, 19–39. doi: 10.1111/joim.12820
Holm, A., Cordoba, G., Møllersørensen, T., Rem Jessen, L., Frimodt-Møller, N., Siersma, V., et al. (2017). Effect of point-of-care susceptibility testing in general practice on appropriate prescription of antibiotics for patients with uncomplicated urinary tract infection: a diagnostic randomised controlled trial. BMJ Open. 7:e018028. doi: 10.1136/bmjopen-2017-018028
Hsieh, K., Zec, H. C., Chen, L., Kaushik, A. M., Mach, K. E., Liao, J. C., et al. (2018). Simple and precise counting of viable bacteria by resazurin-amplified picoarray detection. Anal. Chem. 90, 9449–9456. doi: 10.1021/acs.analchem.8b02096
Hu, J., Wang, S., Wang, L., Li, F., Pingguan-Murphy, B., Lu, T. J., et al. (2014). Advances in paper-based point-of-care diagnostics. Biosens. Bioelectron. 54, 585–597. doi: 10.1016/j.bios.2013.10.075
Idelevich, E. A., Storck, L. M., Sparbier, K., Drews, O., Kostrzewa, M., and Becker, K. (2018). Rapid direct susceptibility testing from positive blood cultures by the matrix-assisted laser desorption ionization-time of flight mass spectrometry-based direct-on-target microdroplet growth assay. J. Clin. Microbiol. 56, e00913–18. doi: 10.1128/JCM.00913-18
Kalashnikov, M., Mueller, M., Mcbeth, C., Lee, J. C., Campbell, J., Sharon, A., et al. (2017). Rapid phenotypic stress-based microfluidic antibiotic susceptibility testing of Gram-negative clinical isolates. Sci. Rep. 7:8031. doi: 10.1038/s41598-017-07584-z
Kang, W., Sarkar, S., Lin, Z. S., Mckenney, S., and Konry, T. (2019). Ultrafast parallelized microfluidic platform for antimicrobial susceptibility testing of gram positive and negative bacteria. Anal. Chem. 91, 6242–6249. doi: 10.1021/acs.analchem.9b00939
Kao, Y. T., Kaminski, T. S., Postek, W., Guzowski, J., Makuch, K., Ruszczak, A., et al. (2020). Gravity-driven microfluidic assay for digital enumeration of bacteria and for antibiotic susceptibility testing. Lab Chip 20, 54–63. doi: 10.1039/C9LC00684B
Kavanagh, A., Ramu, S., Gong, Y., Cooper, M. A., and Blaskovich, M. A. T. (2019). Effects of microplate type and broth additives on microdilution mic susceptibility assays. Antimicrob. Agents Chemother. 63, e01760–18. doi: 10.1128/AAC.01760-18
Kheireddine, S., Sudalaiyadum Perumal, A., Smith, Z. J., Nicolau, D. V., and Wachsmann-Hogiu, S. (2019). Dual-phone illumination-imaging system for high resolution and large field of view multi-modal microscopy. Lab Chip 19, 825–836. doi: 10.1039/C8LC00995C
Kim, S. C., Cestellos-Blanco, S., Inoue, K., and Zare, R. N. (2015). Miniaturized antimicrobial susceptibility test by combining concentration gradient generation and rapid cell culturing. Antibiotics 4, 455–466. doi: 10.3390/antibiotics4040455
Kline, K. A., and Lewis, A. L. (2016). Gram-positive uropathogens, polymicrobial urinary tract infection, and the emerging microbiota of the urinary tract. Microbiol. Spectr. 4. doi: 10.1128/microbiolspec.UTI-0012-2012
Kutateladze, M., and Adamia, R. (2010). Bacteriophages as potential new therapeutics to replace or supplement antibiotics. Trends Biotechnol. 28, 591–596. doi: 10.1016/j.tibtech.2010.08.001
Lai, H. C., Chang, S. N., Lin, H. C., Hsu, Y. L., Wei, H. M., Kuo, C. C., et al. (2019). Association between urine pH and common uropathogens in children with urinary tract infections. J. Microbiol. Immunol. Infect. doi: 10.1016/j.jmii.2019.08.002. [Epub ahead of print].
Lasa, I. A. O., and Solano, C. (2018). Polymicrobial infections: do bacteria behave differently depending on their neighbours? Virulence 9, 895–897. doi: 10.1080/21505594.2018.1426520
Lee, W. B., Chien, C. C., You, H. L., Kuo, F. C., Lee, M. S., and Lee, G. B. (2019). An integrated microfluidic system for antimicrobial susceptibility testing with antibiotic combination. Lab Chip 19, 2699–2708. doi: 10.1039/C9LC00585D
Li, B., Li, L., Guan, A., Dong, Q., Ruan, K., Hu, R., et al. (2014a). A smartphone controlled handheld microfluidic liquid handling system. Lab Chip 14, 4085–4092. doi: 10.1039/C4LC00227J
Li, B., Qiu, Y., Glidle, A., Mcilvenna, D., Luo, Q., Cooper, J., et al. (2014b). Gradient microfluidics enables rapid bacterial growth inhibition testing. Anal. Chem. 86, 3131–3137. doi: 10.1021/ac5001306
Lough, M. E., Shradar, E., Hsieh, C., and Hedlin, H. (2019). Contamination in adult midstream clean-catch urine cultures in the emergency department: a randomized controlled trial. J. Emerg. Nurs. 45, 488–501. doi: 10.1016/j.jen.2019.06.001
Malmberg, C., Yuen, P., Spaak, J., Cars, O., Tängdén, T., and Lagerbäck, P. (2016). A novel microfluidic assay for rapid phenotypic antibiotic susceptibility testing of bacteria detected in clinical blood cultures. PLoS ONE 11:e0167356. doi: 10.1371/journal.pone.0167356
Mambatta, A. K., Jayarajan, J., Rashme, V. L., Harini, S., Menon, S., and Kuppusamy, J. (2015). Reliability of dipstick assay in predicting urinary tract infection. J. Family Med. Prim. Care 4, 265–268. doi: 10.4103/2249-4863.154672
Martinez, A. W., Phillips, S. T., Whitesides, G. M., and Carrilho, E. (2010). Diagnostics for the developing world: microfluidic paper-based analytical devices. Anal. Chem. 82, 3–10. doi: 10.1021/ac9013989
Mendelson, M., and Matsoso, M. P. (2015). The world health organization global action plan for antimicrobial resistance. S Afr. Med. J. 105, 325–325. doi: 10.7196/SAMJ.9644
Natto, M. J., Savioli, F., Quashie, N. B., Dardonville, C., Rodenko, B., and De Koning, H. P. (2012). Validation of novel fluorescence assays for the routine screening of drug susceptibilities of Trichomonas vaginalis. J. Antimicrob. Chemother. 67, 933–943. doi: 10.1093/jac/dkr572
Naucler, P., Huttner, A., Van Werkhoven, C. H., Singer, M., Tattevin, P., Einav, S., et al. (2020). Impact of time to antibiotic therapy on clinical outcome in patients with bacterial infections in the emergency department: implications for antimicrobial stewardship. Clin. Microbiol. Infect. doi: 10.1016/j.cmi.2020.02.032. [Epub ahead of print].
Needs, S. H., Diep, T. T., Bull, S. P., Lindley-Decaire, A., Ray, P., and Edwards, A. D. (2019). Exploiting open source 3D printer architecture for laboratory robotics to automate high-throughput time-lapse imaging for analytical microbiology. PLoS ONE 14:e0224878. doi: 10.1371/journal.pone.0224878
Olanrewaju, A. O., Ng, A., Decorwin-Martin, P., Robillard, A., and Juncker, D. (2017). Microfluidic capillaric circuit for rapid and facile bacteria detection. Anal. Chem. 89, 6846–6853. doi: 10.1021/acs.analchem.7b01315
Opota, O., Jaton, K., and Greub, G. (2015). Microbial diagnosis of bloodstream infection: towards molecular diagnosis directly from blood. Clin. Microbiol. Infect. 21, 323–331. doi: 10.1016/j.cmi.2015.02.005
Pereiro, I., Bendali, A., Tabnaoui, S., Alexandre, L., Srbova, J., Bilkova, Z., et al. (2017). A new microfluidic approach for the one-step capture, amplification and label-free quantification of bacteria from raw samples. Chem. Sci. 8, 1329–1336. doi: 10.1039/C6SC03880H
Pitruzzello, G., Thorpe, S., Johnson, S., Evans, A., Gadêlha, H., and Krauss, T. F. (2019). Multiparameter antibiotic resistance detection based on hydrodynamic trapping of individual E. coli. Lab Chip 19, 1417–1426. doi: 10.1039/C8LC01397G
Postek, W., Gargulinski, P., Scheler, O., Kaminski, T. S., and Garstecki, P. (2018). Microfluidic screening of antibiotic susceptibility at a single-cell level shows the inoculum effect of cefotaxime on E. coli. Lab Chip 18, 3668–3677. doi: 10.1039/C8LC00916C
Reis, N. M., Pivetal, J., Loo-Zazueta, A. L., Barros, J. M. S., and Edwards, A. D. (2016). Lab on a stick: multi-analyte cellular assays in a microfluidic dipstick. Lab Chip 16, 2891–2899. doi: 10.1039/C6LC00332J
Shen, L., Hagen, J. A., and Papautsky, I. (2012). Point-of-care colorimetric detection with a smartphone. Lab Chip 12, 4240–4243. doi: 10.1039/c2lc40741h
Smieszek, T., Pouwels, K. B., Dolk, F. C. K., Smith, D. R. M., Hopkins, S., Sharland, M., et al. (2018). Potential for reducing inappropriate antibiotic prescribing in English primary care. J. Antimicrob. Chemother. 73, ii36–ii43. doi: 10.1093/jac/dkx500
Smith, K. P., and Kirby, J. E. (2018). The inoculum effect in the era of multidrug resistance: minor differences in inoculum have dramatic effect on MIC determination. Antimicrob. Agents Chemother. 62, e00433–18. doi: 10.1128/AAC.00433-18
Stranieri, I., Kanunfre, K. A., Rodrigues, J. C., Yamamoto, L., Nadaf, M. I. V., Palmeira, P., et al. (2018). Assessment and comparison of bacterial load levels determined by quantitative amplifications in blood culture-positive and negative neonatal sepsis. Rev. Inst. Med. Trop. São Paulo 60, e61–e61. doi: 10.1590/s1678-9946201860061
Sun, H., Chan, C. W., Wang, Y., Yao, X., Mu, X., Lu, X., et al. (2019). Reliable and reusable whole polypropylene plastic microfluidic devices for a rapid, low-cost antimicrobial susceptibility test. Lab Chip 19, 2915–2924. doi: 10.1039/C9LC00502A
Tagliabue, A., and Rappuoli, R. (2018). Changing priorities in vaccinology: antibiotic resistance moving to the top. Front. Immunol. 9, 1068–1068. doi: 10.3389/fimmu.2018.01068
Temiz, Y., and Delamarche, E. (2018). Sub-nanoliter, real-time flow monitoring in microfluidic chips using a portable device and smartphone. Sci. Rep. 8:10603. doi: 10.1038/s41598-018-28983-w
Thornton, L. A., Burchell, R. K., Burton, S. E., Lopez-Villalobos, N., Pereira, D., Macewan, I., et al. (2018). The effect of urine concentration and pH on the growth of Escherichia coli in canine urine in vitro. J. Vet. Intern. Med. 32, 752–756. doi: 10.1111/jvim.15045
Travnickova, E., Mikula, P., Oprsal, J., Bohacova, M., Kubac, L., Kimmer, D., et al. (2019). Resazurin assay for assessment of antimicrobial properties of electrospun nanofiber filtration membranes. AMB Expr. 9:183. doi: 10.1186/s13568-019-0909-z
Turnidge, J., and Paterson, D. L. (2007). Setting and revising antibacterial susceptibility breakpoints. Clin. Microbiol. Rev. 20, 391–408. doi: 10.1128/CMR.00047-06
Wilson, M. L., and Gaido, L. (2004). Laboratory diagnosis of urinary tract infections in adult patients. Clin. Infect. Dis. 38, 1150–1158. doi: 10.1086/383029
Keywords: microfluidics, antimicrobial resistance, antimicrobial susceptibility tests, smartphone, microbiology
Citation: Needs SH, Donmez SI, Bull SP, McQuaid C, Osborn HMI and Edwards AD (2020) Challenges in Microfluidic and Point-of-Care Phenotypic Antimicrobial Resistance Tests. Front. Mech. Eng. 6:73. doi: 10.3389/fmech.2020.00073
Received: 05 May 2020; Accepted: 29 July 2020;
Published: 15 September 2020.
Edited by:
Xavier Munoz-Berbel, Instituto de Microelectrónica de Barcelona (IMB-CNM, CSIC), SpainReviewed by:
Michael Mauk, University of Pennsylvania, United StatesStefano Pagliara, University of Exeter, United Kingdom
Copyright © 2020 Needs, Donmez, Bull, McQuaid, Osborn and Edwards. This is an open-access article distributed under the terms of the Creative Commons Attribution License (CC BY). The use, distribution or reproduction in other forums is permitted, provided the original author(s) and the copyright owner(s) are credited and that the original publication in this journal is cited, in accordance with accepted academic practice. No use, distribution or reproduction is permitted which does not comply with these terms.
*Correspondence: Alexander D. Edwards, a.d.edwards@reading.ac.uk