Shear Characteristics of Gravel Soil With Different Fillers
 Huahua Zhang
 Yi Luo3
 - 1Huazhong University of Science and Technology, Wuhan, China
- 2Housing and Urban-Rural Development Bureau, Yichang, China
- 3Hubei Communications Planning and Design Institute CO., LTD., Yichang, China
- 4Hubei Institute of Geosciences, Wuhan, China
- 5China Nuclear Industry 22ND Construction Co., LTD., Wuhan, China
- 6The Seventh Geological Brigade of Hubei Geological Bureau, Yichang, China
In recent years, China has established many large water conservancy projects in the western mountainous areas. However, dam foundation excavation produces a huge amount of waste rock mixture. A soil-rock mixture with unique structural characteristics can easily cause geological disasters, such as collapse, landslide, and debris flow following an earthquake, rainfall, and engineering disturbance. Therefore, research on the strength and shear characteristics of the soil-rock mixture is beneficial to avoiding soil-rock mixture disasters. In this study, the soil-rock mixture in the slag dump site of Jinping Hydropower station is taken as the research object. The influence of different fillers on the gravel soil shear characteristics is investigated through a large-scale triaxial test of coarse-grained soil. The slope stability of the slag dump site is analyzed using Midas GTS. Then, the most unfavorable sliding surface of the slag dump site is discovered and the slope stability coefficient under the most unfavorable conditions is calculated. The results lay a scientific foundation for the design and construction of a slag dump slope.
1 Introduction
China’s geological disaster situation is complex (Cui et al.,2022) and can easily cause geological disasters, such as landslides and debris flow under poor geological conditions and extreme weather. In particular, China has a significant number of soil-rock aggregate slopes (Bai et al.,2021a). These slopes are generally composed of white collapse deposits, residual deposits, landslide deposits, moraine deposits, and slope deposits. The solid component of these loose slopes is usually a mixture of soil and gravel, which is called the soil-rock mixture in China (Cui et al.,2019; Medley, 1994). The soil-rock mixture is ubiquitous. It is not only widely used in human production practice but has also become a source of many habitats for human production and life (Paduana, 1966; Georgiannou et al.,1990; Bai et al.,2022). Additionally, the soil-rock mixture is widely used in practical project construction because of the easy access to materials (Lupini et al.,1981; Bai et al.,2019). For example, the soil-rock mixtures obtained by local mountain excavation and dam foundation excavation are broadly applied to slope engineering and soil-rock dam filling when road subgrade is built in mountainous areas (Cheng et al., 2018; Bai et al., 2020).
The solid phase of the soil-rock mixture is composed of coarse particles and fine particles, with great differences in mechanical properties, particle size, and chemical composition (Schlosser and Long, 1974). Its physical and mechanical properties have a bigger difference than those of single soil and rock. In practical engineering, the physical and mechanical properties of the soil-rock mixture should be analyzed under the consideration of not only the main composition of soil-rock-mixture physical and mechanical performance but also the stone spatial distribution (Hall, 1951; Donaghe and Townsend, 1976), material composition, particle morphology, and other meso-structure characteristics. The special engineering characteristics of the soil-rock mixture lead to several related engineering issues, such as the soil-rock slope mixture collapsing (Lindquist and Goodman, 1994). Specifically, under adverse geological conditions, a shallow accumulation composed of soil and rock mixture is prone to adverse geological disasters, such as collapse, landslide, and debris flow (Strack and Cundall, 1978; Kaneko et al.,2003).
Soil-rock mixture is a kind of special rock mass with certain safety risks and should be properly handled in actual engineering (Chang et al., 2016). At present, engineers usually assume that the mechanical strength of a soil-rock mixture is equal to a matrix material (Cundall, 1971b; Drescher and De Jong, 1972). However, this assumption can only be realistic when the content of the coarse phase in the soil-rock mixture is low. The soil-rock mixture will exhibit completely different mechanical behavior when the content of its coarse phase is high (Jefferies and Ben, 2015).
While the research theory of soil-rock mixture has become more mature worldwide, the test equipment is getting ever more sophisticated. Moreover, there are some deficiencies and defects in the present test methods (Cundall, 1971a; Bagi, 2005). For example, the traditional direct shear instrument artificially controls the shear surface, which leads to certain errors in the test results (Simoni and Houlsby, 2006). Large triaxial apparatus can overcome the shear stress concentration and uneven shear stress distribution in the energetic test, while strictly controlling the drainage condition in the test process (Mulilis et al.,1977). Thus, researchers are increasingly interested in this area. Furthermore, there is no fixed failure surface in the large-scale triaxial test and the test result is better than the direct shear test (Marsal, 1973; Bai et al., 2021b). Therefore, a large-scale triaxial test is adopted in this study to investigate the shear behavior of a soil-rock mixture (Nemat-Nasser and Tobita, 1982).
Jinping hydropower station dam is the highest arch dam in the world, with a dam height of 305 m. The storage capacity below normal water level is 760 million cubic meters, which forms the Yalong River hydropower development control reservoir. The dam foundation excavation waste volume of Jinping hydropower station is 14.44 million cubic meters, and the strata at the dam site are marble.
The Yinbazi Slag site is located about 6 km from the Jinping hydropower station dam site and is the main slag field of Jinping hydropower station. It is expected to pile up about 14 million cubic meters. According to the topographic map, the slope height will exceed 250 m and the scale of the slope is unusual. Additionally, it is located in a high earthquake incidence area. Therefore, the slope’s safety needs a special design, and the slope design requires friction Angle φ and cohesion c of the mixture. The dam’s foundation and the geological conditions of the two sides of the slope are different. Dam foundation excavation and slope excavation are performed by blasting in different ways. The slag that is abandoned after blasting is mainly soil-rock mixture, gravel soil, and sand-soil mixture. As a result, its composition, particle size, and grading are complex. Field soil samples are collected for an indoor triaxial experiment. Following the experimental results, the influence of the composition in different mixtures on the shear properties of the material is analyzed to reveal the slag with the best mechanical properties, which provides a theoretical basis for design and construction.
2 Research Status
In recent years, gravel soil research methods have mainly concentrated on field tests, laboratory tests, and numerical simulations. Xinhua You prepared soil-rock mixture in situ horizontal shear test and obtained different stone content, moisture content, size, and failure mode under stress state, as well as the change law of shear strength parameters. Weishu Li performed in situ direct shear test and researched the variation of shear strength parameters of a soil-rock mixture under different water contents. The relationship between the shear strength index and water content was established based on extensive experiments, and the weakening formula of the shear strength index with water content was derived. Mingjian Hu conducted a large indoor triaxial test of a soil-rock mixture, and calculated its shear strength index and shear strength with the stone content, moisture content, and confining pressure. Xingrui Li compared the trend differences of stress-strain curves and designed a method to destroy a turning point to define the way. Jincheng Ning obtained the regular decay of the soil-rock mixture’s shear strength by changing these indexes. Zhenhua Ouyang conducted large-scale shear tests under flexible boundary conditions to explore the effects of stone content, stone size, and stone arrangement. The stone arrangement affected the performance of soil-rock mixture shear: the stone size had the greatest influence, followed by stone content, and then stone arrangement. Jiacheng Wang studied the influence of the soil-rock shear strength parameters on moisture content and particle level matching through laboratory large-scale direct shear tests. Xianming Hu researched the residual strength of gravel soils with water content and shear rate under different conditions through the indoor ring shear test, and set up the residual strength criteria of gravel soils under different shear rates based on the Bingham model. Xiuli Ding performed biaxial numerical tests of different samples using the PFC program and depicted the stress-strain curves of the soil-rock mixture, most of which exhibited “stepped” distribution.
The research on accumulated gravel soil is not comprehensive enough at present. Moreover, the construction speed is fast, and the final filling slope height exceeds the limit. These are the design principles for slope safety. In this study, unconsolidated and undrained shear tests are performed. In combination with the representative grading of abandoned gravel soil in the Jinping hydropower station, the law, failure mode, and corresponding shear strength index of the soil-rock principal differential stress-strain curve under different rock contents and confining pressures are analyzed to further reveal the complex, discontinuous, and non-uniform material shear properties. The results of this research can help to lay a theoretical foundation for landslide prevention and the control of similar projects.
3 Laboratory Triaxial Test
3.1 Test for Grading
Because the particle size of the soil sample collected on site is too large, a larger triaxial compression test apparatus is required. The test result will be inaccurate when the maximum particle size of the sample exceeds the maximum allowed by the instrument. When the maximum particle size of the material used for laboratory testing is limited, it is necessary to scale down the mixture above the maximum allowable size in the test. The mechanical properties of the actual material are then determined from the scaled-down material. The commonly used coarse-grain scaling method is described as follows: following the provisions of “soil test code” SL 237-1999, there are four kinds of elimination method, equivalent substitution method, similar gradation method, and mixture method. The elimination method removes the overdrawn diameter particles, which is simple and convenient. However, some super-particle size particles are removed, leading to increased fine grain content. The equivalent substitution method suggests that soil particles larger than 5 mm are allowed according to the maximum size of the instrument. Supersized particles are replaced with equal mass in proportion. The advantage of the equivalent substitution method is to keep the original coarse-grain content, fine material content, and properties unchanged. In this experiment, the equivalent substitution method is used. The gradation of the three mixtures is illustrated in Figures 1–3.
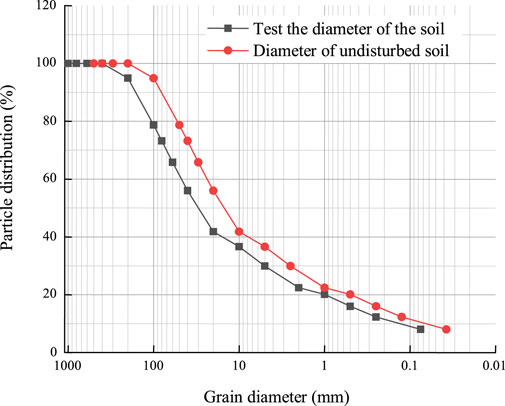
FIGURE 1. Grading curve of whole stone slag diagram.
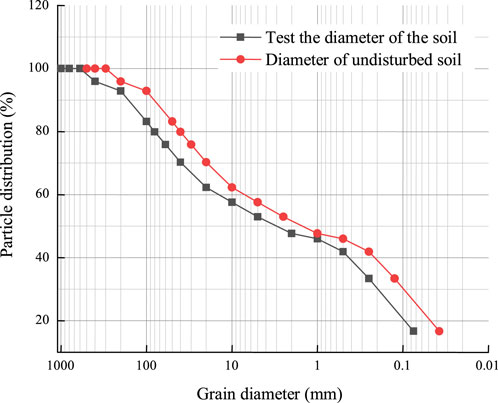
FIGURE 2. Gradation curve of gravel slag and sand-soil mixture diagram.
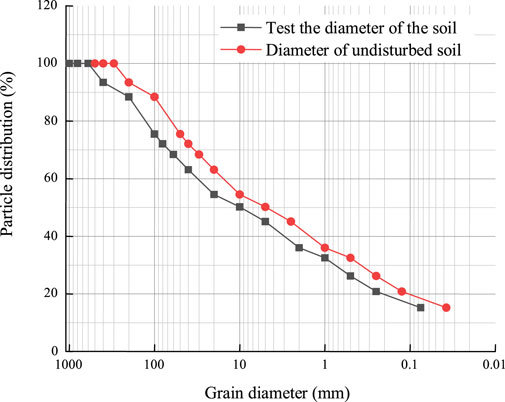
FIGURE 3. Gradation curve of slag-soil mixture diagram.
3.2 Preparation of Dry Density
Laboratory test sample loading dry density should be consistent in the field sampling dry density in principle, and the dry density of samples in this test is the average dry density of the three pits sampled on site. The samples are prepared in accordance with the requirements of the specification “Standard for Geotechnical Test Methods”. The average density of the whole-rock slag was 2.15 tons per cubic meter, the average density of the rock ballast-sand mixture was 2.10 tons per cubic meter, and the average density of the rock ballast-soil mixture was 1.81 tons per cubic meter.
3.3 Shear Strength Test Method
Shear strength test method: slag dump site construction speed is fast, and the final filling slope height exceeds the limit. These are the design principles for slope safety. Besides, the test method should adopt non-consolidation and non-drainage shear to finally determine the total strength of the filling material. The test equipment and materials are shown in Figure 4.
1) Test equipment: the test adopts a microcomputer with a size of φ300 × 600 mm to control the 1000 kN triaxial instrument.
2) Test confining pressure selection: the maximum ambient pressure is preliminarily determined to be 1,200 kPa, and the ambient pressure of the remaining samples is 300, 600, and 900 kPa.
3) Rate selection: axial shear is performed at the rate of 0.5%–1% axial strain per minute, and the shear rate is 2 mm per minute.
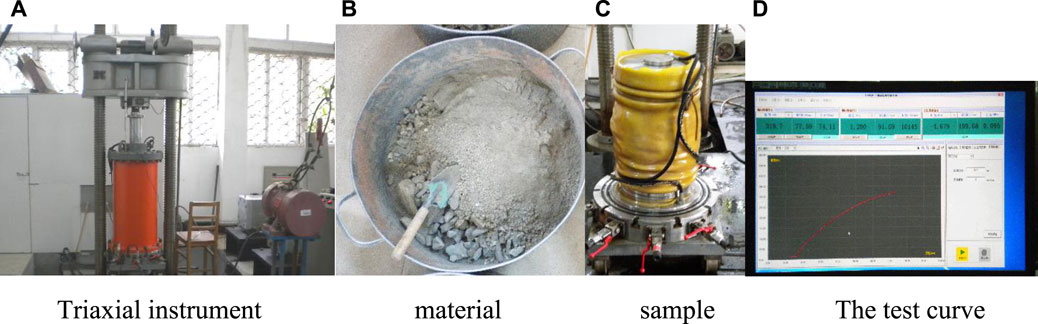
FIGURE 4. Testing equipment: (A) Triaxial instrument; (B) material; (C) sample; (D) The test curve.
3.4 Triaxial Test Results
3.4.1 Stress-Strain Test Curve
The results of the unconsolidated and undrained shear triaxial test are presented in Figures 4–6. In this figure, the horizontal axis is the axial strain
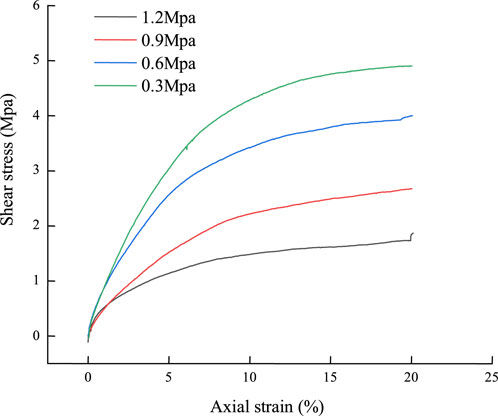
FIGURE 5. Results of unconsolidated and undrained shear triaxial test of whole stone slag diagram.
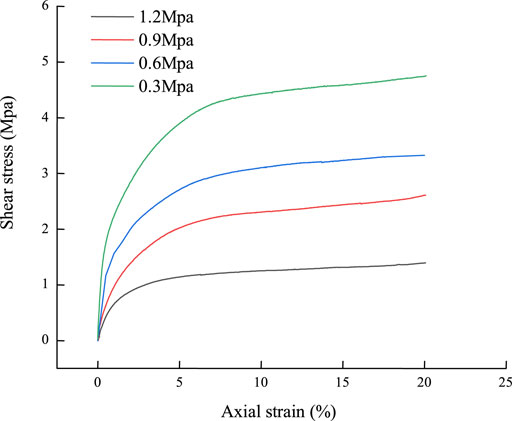
FIGURE 6. Results of unconsolidated and undrained shear triaxial test of gravel slag and sand-soil mixture diagram.
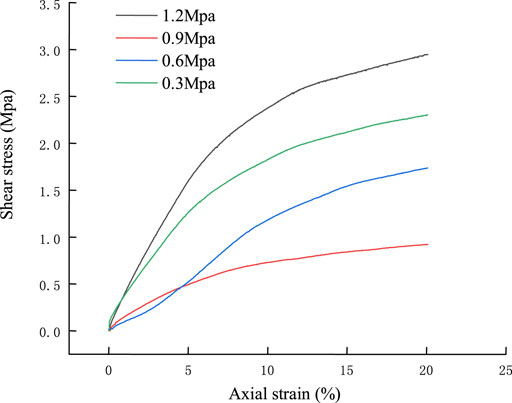
FIGURE 7. Results of unconsolidated and undrained shear triaxial test of rock-slag and soil mixture diagram.
3.4.2 Mohr Circle
According to the unconsolidated and undrained shear tests of three kinds of abandoned slag materials, the Mohr circles are provided in Figures 7–9. The horizontal axis is axial stress
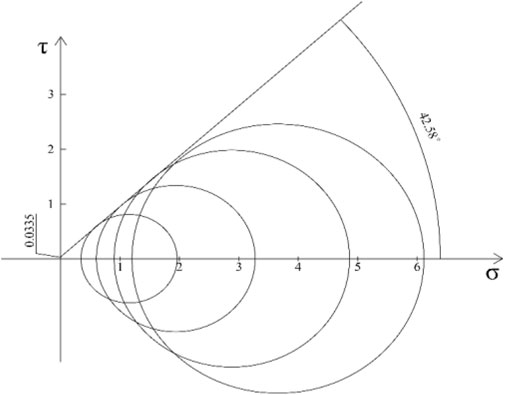
FIGURE 8. Mohr circle of whole stone slag diagram.
3.4.3 Cohesion and Friction Angle
Cohesion C and friction Angle φ of the three mixtures can be obtained from Figures 7–9, as listed in Table.1.
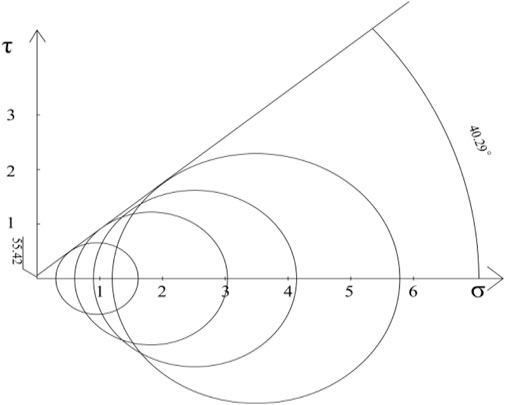
FIGURE 9. Mohr circle of stone slag and sand mixture diagram.
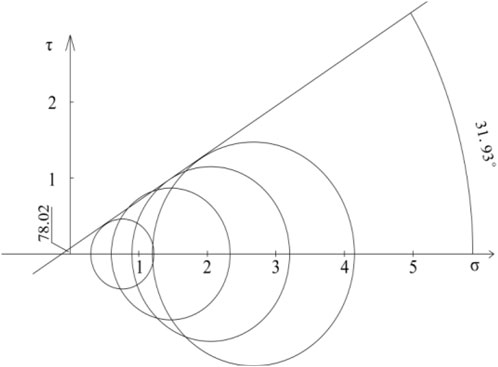
FIGURE 10. Mohr circle of rock-slag and soil mixture diagram.
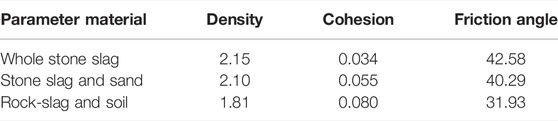
TABLE.1. Statistical table of cohesion and friction angle of three kinds of abandoned slag.
According to the above experimental data, the following conclusions can be drawn:
1) Density has a great influence on cohesion and friction angle. The greater the original density of the soil, the stronger the interlocking action between soil materials. The occlusal action must be overcome when the shear is applied to produce relative sliding. The high density of the soil indicates that the pores between soil grains are small, the contact is close, and the original cohesion is large. Therefore, the original density has a significant influence on the shear strength. The higher the density of the soil, the greater the friction angle and cohesion. Finally, the particle size of coarse aggregate in the mixture is bigger, its shape is more irregular, the surface is coarser, and the friction angle is larger. Generally, the thicker the particle, the more irregular the shape, the worse the degree of grinding and polishing, and the larger the friction angle.
2) Although the gradation of whole stone slag, stone slag, and sand-soil mixture is different, the friction angles are close because the densities are close.
3) According to the test results, adding sand can improve the cohesion of slag. The density of the slag-sand mixture is lower than that of slag, while its cohesion is slightly higher compared to stone slag. Because it is mixed with fine aggregate, fine aggregate surface-bound water and electrical molecular forces are different, resulting in increased cohesion. It can be concluded from Table 1 that adding an amount of sand to the slag can reduce the friction angle. This is favorable for relative sliding between coarse aggregates because the fine aggregate provides some lubrication between the coarse aggregate skeletons. The friction angle is remarkably reduced when fine aggregates are replaced with silt or finer materials. Moreover, the fine aggregate strength is lower, and the fine aggregate is closer to a spherical shape, contributing to the relative sliding between the coarse aggregate.
4) The test results of three different slag discarding materials are accurate, and the cohesion and friction angles obtained by the Mohr circle are regular.
4 Theory of Shear Strength Reduction Coefficient Method
The traditional slope stability analysis methods are mainly various stability analysis methods based on the limit equilibrium theory. These methods ignore the internal stress-strain relationship of soil, making it impossible to analyze the occurrence and development process of slope failure. The finite difference method can not only satisfy the balance condition of the force but can also consider the stress-strain relation of material, generating more accurate and reasonable calculation results. Finite element software is widely used in geotechnical engineering numerical simulation, and traditional analysis methods are adopted to predict the stability of gravel soil slope. Starting from the physical and mechanical properties of slope soil, the relationship between physical and mechanical parameters and slope stability safety factors is explored to provide an effective theoretical basis for slope optimization design and safety construction. The failure envelope of the model corresponds to the Mol Coulomb criterion (shear yield function) and the upper tensile separation point (tensile stress yield function). This is related to the tensile stress flow law but not to the shear flow. Midas GTS NX numerical software based on the strength reduction method is feasible in slope stability analysis. The calculation results of safety factors are closer to those obtained by the traditional Bishop method and better than those obtained by the traditional method.
4.1 The Concept of the Shear Strength Reduction Coefficient Method
The definition of the Shear Strength Reduction Factor is the ratio of the maximum shear strength exerted by the soil on the slope to the actual shear stress generated by the external load on the slope when the external load remains unchanged. The shear strength reduction factor defined in this article is consistent with the slope stability safety factor defined in the limit equilibrium analysis.
4.2 Specific Content of the Shear Strength Reduction Coefficient Method
The shear strength reduction technique of shear strength of soil is based on indexes c and Φ. The reduction coefficients F, σ and τ represent the normal stress and the shear stress reduction, respectively, such as Eqs 1, 2 in the form of reduction. Then, use virtual shear strength indexes c’ and φ′ after reduction instead of shear strength indexes c and Φ. σ′ and φ′ denote the normal stress and shear stress after reduction, respectively, as expressed in Eq. 3:
Among:
4.3 Advantages of the Shear Strength Reduction Coefficient Method
The shear strength reduction coefficient method combined with the finite difference method has the following advantages when compared with the traditional method:
1) It can calculate the slope with complex geomorphology and geology.
2) The constitutive relation of soil and the effect of deformation on stress are considered.
3) It can simulate the slope process of soil slope and the shape of slip surface (usually the shape and position of slip surface are determined by sheer strain increment or displacement increment).
4) It can simulate the joint action of soil and support structure (advance support, soil nail, and surface layer).
5) When solving the safety factor, it is not necessary to assume the shape of the slip surface nor perform striping.
The core idea of the strength reduction method in finite element calculation of slope stability has been widely accepted. It is not necessary to assume a sliding surface, while the computer can find the most unfavorable sliding surface and the minimum slope stability factor through multiple calculations.
The criterion of slope failure calculated by the finite element method is detailed as follows:
1) Complete transfixion of a plastic zone on the sliding surface: the beginning of progressive failure.
2) The displacement and strain on the sliding surface change abruptly, resulting in a large and unlimited plastic flow.
3) Double convergence criterion of force and displacement: the model calculation does not converge from the convergence criterion of force or displacement.
According to the comparative analysis, two kinds of materials (stone slag and stone slag) and sand soil are employed to analyze the stability of the slope of the slag discarding site. The Midas GTS NX model is utilized to investigate the stability of the two kinds of the mixture. The analysis results of the whole rock slag slope model are illustrated in Figure 11.
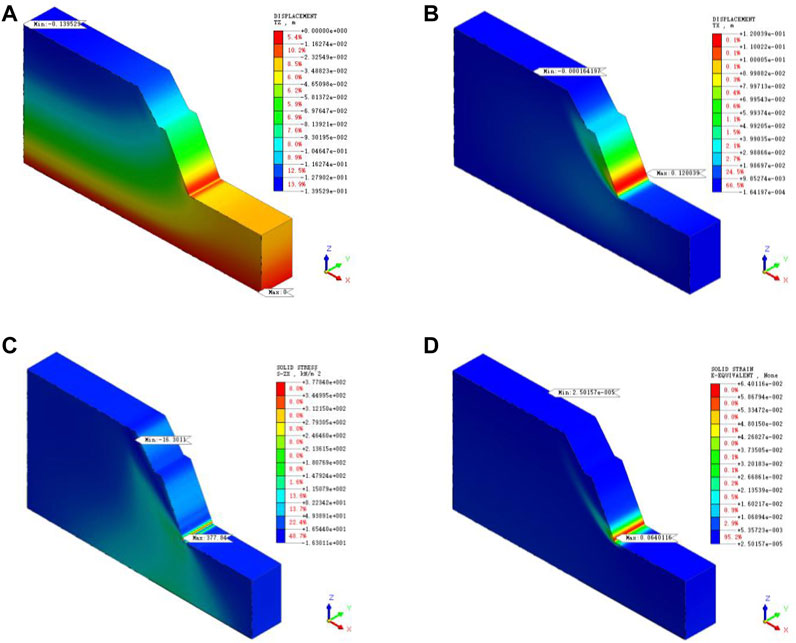
FIGURE 11. Rock-slag slope model calculates results: (A) vertical displacement diagram of whole-rock slag; (B) horizontal displacement diagram of whole-rock slag; (C) XZ plane strain diagram of whole-rock slag; (D) plastic strain diagram of whole stone slag.
The calculation results demonstrate that the maximum vertical displacement of the slope is 0.14 m, the maximum horizontal displacement is 0.12 m, and the maximum stress in the XZ plane is 377.84 kPa. The plastic zone of the slope is completely through and the slope safety factor of 1.3 does not meet the requirements of the code. Thus, a special design for the slope is needed. Anti-slide piles with a side length of 1.2 m were added to the slope toe, 1.2 m intervals were arranged, and anchor bolts with a length of 15 m were added to the slope surface, with longitudinal intervals of 3 m and transverse intervals of 1.2 m. The results of slope stability analysis after the establishment of the finite element model are presented in Figure 12.
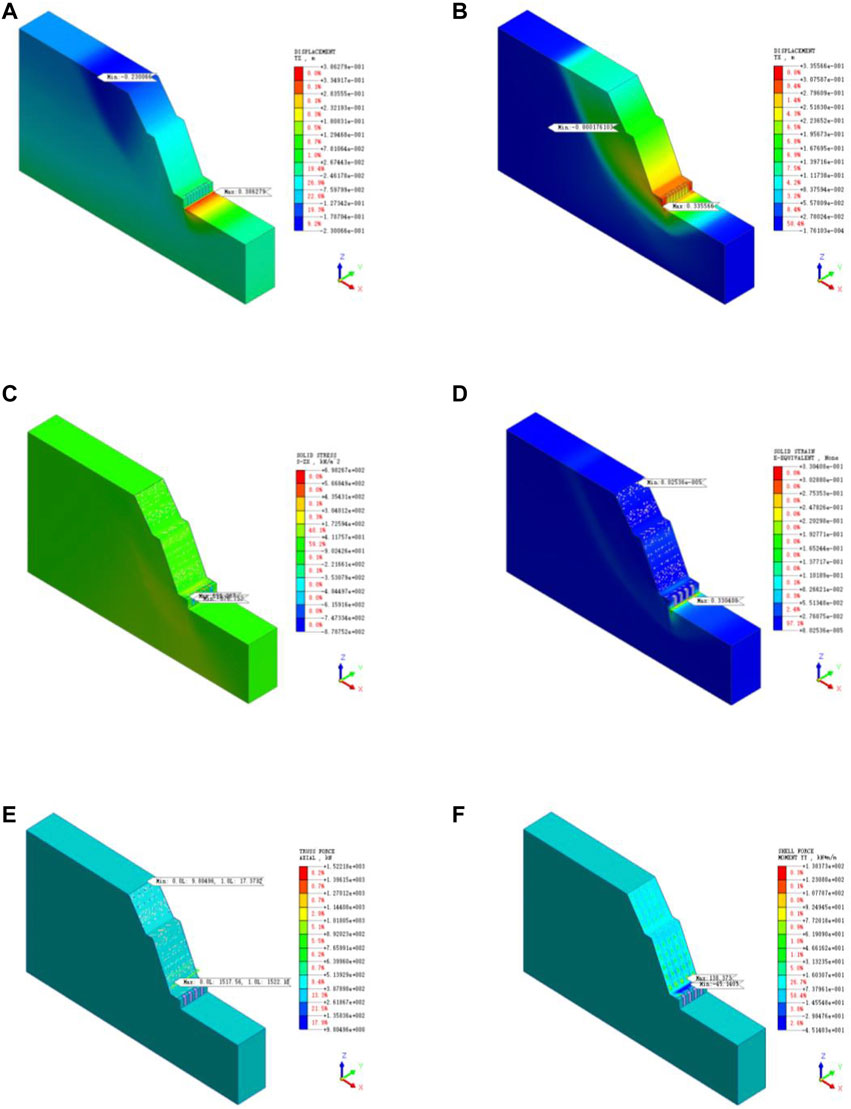
FIGURE 12. Calculation results of rock-slag slope after construction of supporting structure: (A) vertical displacement diagram of whole-rock slag support; (B) horizontal displacement diagram of whole-rock slag support; (C) strain diagram in XZ plane after rock cinder slope construct support; (D) plastic strain diagram of rock-slag slope after construct support; (E) axial diagram of anchor bolt after construct support of rock cinder slope; (F) bending moment diagram of shotcrete on rock-slag slope.
The calculation results reveal that the maximum vertical displacement of the slope is 0.386 m, the maximum horizontal displacement is 0.336 m, and the maximum stress in the XZ plane is 698.27 kPa. The plastic zone of the slope is not completely through and the safety factor of the slope is 2.35, which meets the requirements of the code. The mechanical characteristics of the rock-slag and sand mixture are modeled and analyzed. The analysis results are illustrated in Figure 13.
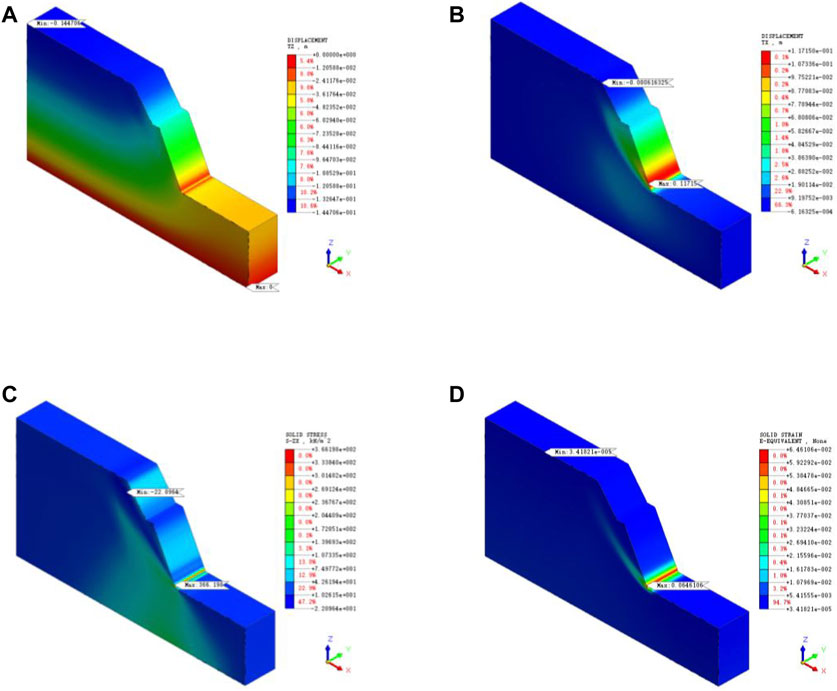
FIGURE 13. Rock-slag and sand slope model calculate results: (A) vertical displacement diagram of rock-slag and sand soil without support; (B) horizontal displacement diagram of whole-rock slag; (C) XZ plane strain diagram of whole-rock slag; (D) plastic strain diagram of whole stone slag.
The calculation results suggest that the maximum vertical displacement of the slope is 0.148 m, the maximum horizontal displacement is 0.117 m, and the maximum stress in the XZ plane is 336.198 kPa. The slope plastic zone is completely through and the slope safety factor is 1.58, which fails to meet the requirements of the code. The friction angle of the whole stone slag is slightly larger than that of the mixture of stone slag and stone powder, while the cohesion is slightly smaller than that of the latter. Hence, the same slope support scheme with whole stone slag is adopted to establish the finite element model for slope stability after support. The analysis results are provided in Figure 14.
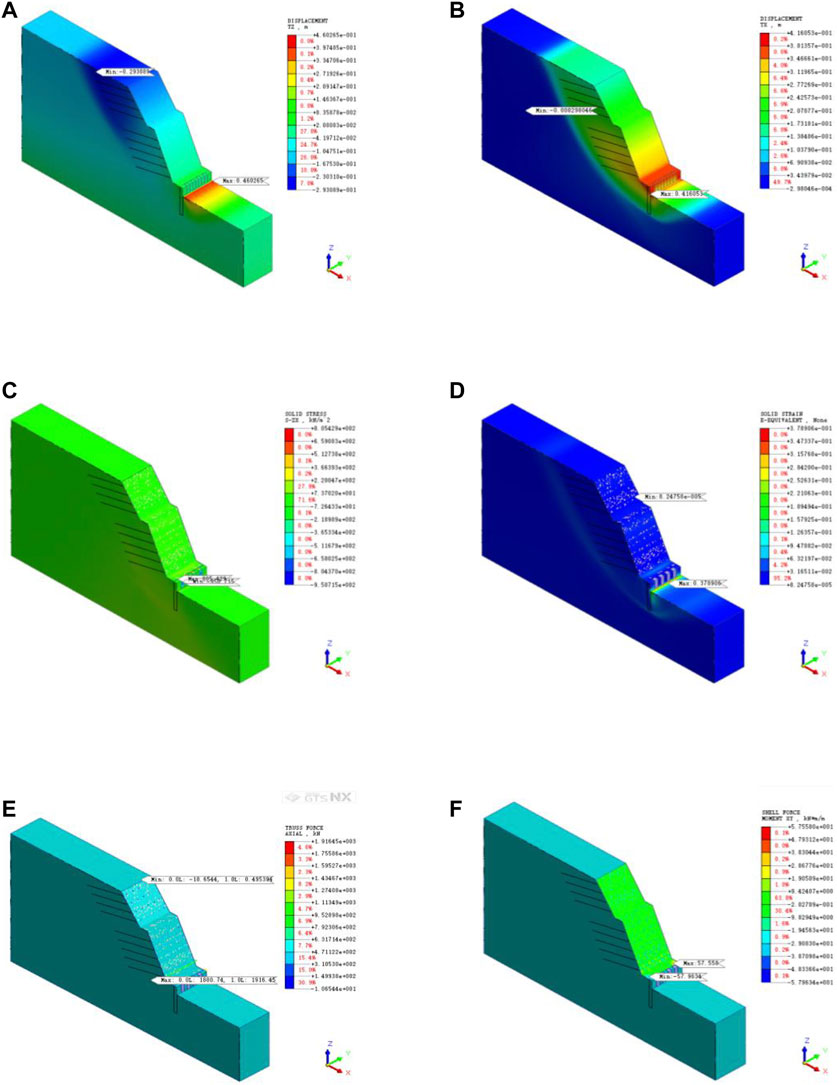
FIGURE 14. Calculation results after construction of supporting structure of rock-slag and sand slope: (A) vertical displacement diagram of rock-slag and sand slope after construct support; (B) horizontal displacement diagram of rock-slag and sand slope after construct support; (C) axial diagram of anchor bolt after construct support of rock-slag and sand slope; (D) plastic strain diagram of rock-slag and sand slope after construct support; (E) axial diagram of anchor bolt after construct support of rock-slag and sand slope; (F) bending moment diagram of shotcrete on a slope.
The calculation results imply that the maximum vertical displacement of the slope is 0.460 m, the maximum horizontal displacement is 0.416 m, and the maximum stress in the XZ plane is 805.43 kPa. Due to the failure of the plastic zone in the slope, the slope safety factor is 2.67, which meets the requirements of the code. The indicators after the construction of the supporting structure of the two materials are exhibited in Figure 15.
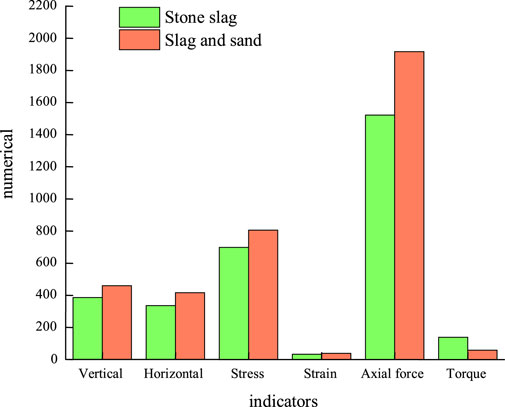
FIGURE 15. Comparison chart of each index of the two materials.
It can be concluded from this figure that the maximum bending moment of the shotcrete panel of the rock-slag material slope is greater than that of the rock-slag and sand-soil mixture, while other engineering indexes are smaller than the latter. The friction angle of stone slag is higher than that of stone slag and sand mixture, and the cohesion is smaller than the latter. The numerical simulation results show that the stability of the coarse-grained soil slope is significantly affected by the friction angle of the material and is less affected by the cohesion of the material; that is, the friction angle directly affects the slope sliding fracture angle. The smaller the friction angle, the smaller the slope sliding fracture angle, the further the sliding surface extension, and the stronger the cohesion of the resistance. Nonetheless, the coarse-grained soil friction angle is extremely large, and the cohesion is relatively small. Thus, the stability of the coarse-grained soil slope is mainly affected by the friction angle and stone slag should be selected as the pile material of the abandoned soil site (Simoni and Houlsby, 2006).
5 Conclusion
1) Influence of stone content on cohesion: when water content remains unchanged, the cohesion decreases as the stone content increases, and the decrease in cohesion increases. The cohesion of accumulated gravel soil mainly depends on sample density and fine soil content. The cohesion increases as the density increases, and decreases as the fine soil content decreases. Due to the increase in stone content, the decrease in cohesion caused by the decrease in fine particle content is much larger than the increase in cohesion caused by density increase. The hydraulic and electric force molecules on the surface of the fine aggregate increase the cohesion, which is far greater compared to increasing the density to enhance the interlocking (interlocking) effect between soils.
2) Influence of stone content on internal friction angle: when the water content is unchanged, the internal friction angle increases with the increase in stone content, and the increase in the internal friction angle increases. Rubble acts as a skeleton and fine-grained soil coats the surface of the gravel. Hence, it plays the lubrication function. When the water content remains unchanged, with the increase in stone content, fine soil content decreases, more gravel is in direct contact, and the friction angle increases.
3) The influence of initial dry density on strength: under different confining pressures, with the increase in initial dry density, the ability of coarse-grained soil to resist shear increases gradually because the coarse-grained soil becomes more compact. Macroscopically, this demonstrates relatively large strength. Meanwhile, the greater the confining pressure, the stronger the lateral constraint of soil, the longer the contraction phaser, the stronger the capability of the soil to resist shear, and the higher the value of (σ1-σ3)max.
Data Availability Statement
The original contributions presented in the study are included in the article/Supplementary Material; further inquiries can be directed to the corresponding author.
Author Contributions
HZ, responsible for reference writing and calculation. YL, responsible for contacting lab to do test and record data. QZ, responsible for making pictures and tables. FZ, responsible for making test samples and testing.
Funding
This research was supported by the Open Research Program of MOE Key Laboratory of Groundwater Circulation and Environmental Evolution, China University of Geosciences (Beijing) (Grant No. 2021-001). The data used in this article are available upon request from the corresponding author.
Conflict of Interest
Author YL is employed by Hubei Communications Planning and Design Institute CO. LTD. Author FZ is employed by China Nuclear Industry 22ND Construction CO. LTD.
The remaining authors HZ, SY, QZ, YZ and WF declare that the research was conducted in the absence of any commercial or financial relationships that could be construed as a potential conflict of interest.
Publisher’s Note
All claims expressed in this article are solely those of the authors and do not necessarily represent those of their affiliated organizations, or those of the publisher, the editors, and the reviewers. Any product that may be evaluated in this article, or claim that may be made by its manufacturer, is not guaranteed or endorsed by the publisher.
References
Bagi, K. (2005). An Algorithm to Generate Random Dense Arrangements for Discrete Element Simulations of Granular Assemblies. Granul. Matter 7 (1), 31–43. doi:10.1007/s10035-004-0187-5
Bai, B., Yang, G.-c., Li, T., and Yang, G.-s. (2019). A Thermodynamic Constitutive Model with Temperature Effect Based on Particle Rearrangement for Geomaterials. Mech. Mater. 139, 103180. doi:10.1016/j.mechmat.2019.103180
Bai, B., Xu, T., Nie, Q., and Li, P. (2020). Temperature-driven Migration of Heavy Metal Pb2+ along with Moisture Movement in Unsaturated Soils. Int. J. Heat Mass Transf. 153, 119573. doi:10.1016/j.ijheatmasstransfer.2020.119573
Bai, B., Zhou, R., Cai, G., Hu, W., and Yang, G. (2021a). Coupled Thermo-Hydro-Mechanical Mechanism in View of the Soil Particle Rearrangement of Granular Thermodynamics. Comput. Geotechnics 137 (8), 104272. doi:10.1016/j.compgeo.2021.104272
Bai, B., Nie, Q., Zhang, Y., Wang, X., and Hu, W. (2021b). Cotransport of Heavy Metals and SiO2 Particles at Different Temperatures by Seepage. J. Hydrology 597, 125771. doi:10.1016/j.jhydrol.2020.125771
Bai, B., Wang, Y., Rao, D., and Bai, F. (2022). The Effective Thermal Conductivity of Unsaturated Porous Media Deduced by Pore-Scale SPH Simulation. Front. Earth Sci. 10, 943853. doi:10.3389/feart.2022.943853
Cui, X., Fan, Y., Wang, H., and Huang, S. (2019). Experimental Investigation of Suspended Particles Transport in Porous Medium under Variable Temperatures. Hydrol. Process. 33 (7), 1117–1126. doi:10.1002/hyp.13390
Cui, X., Wu, D., Wang, H., Ding, S., and Fan, Y. (2022). Pore Features and Seepage Characteristics of Natural Gap-Graded Sand with Two Size Distributions. Géotechnique, 1–12. doi:10.1680/jgeot.21.00213
Chang, I., Im, J., and Cho, G. C. (2016). Geotechnical Engineering Behaviors of Gellan Gum Biopolymer Treated Sand. Can. Geotech. J. 53 10, 1658–1670. doi:10.1139/cgj-2015-0475
Cheng, S. Y., Fu, M. Y., and Kulacki, F. A. (2018). Characterization of a Porous Transducer Using a Capillary Bundle Model: Permeabilityand Streaming Potential Prediction. Int. J. Heat Mass Transf. 118, 349–354.
Cundall, P. A. (1971b). The Measurement and Analysis of Accelerations in Rock Slopes. London: Imperial College of Science and Technology.
Donaghe, R. T., and Townsend, F. C. (1976). “Scalping and Replacement Effects on the Compaction Characteristics of Soil-Rock Mixtures,” in Soil Specimen Preparation for Laboratory Testing (Vicksburg, Miss: ASTM International), 248.
Drescher, A., and de Josselin de Jong, G. (1972). Photoelastic Verification of a Mechanical Model for the Flow of a Granular Material. J. Mech. Phys. Solids 20 (5), 337–340. doi:10.1016/0022-5096(72)90029-4
Georgiannou, V. N., Burland, J. B., and Hight, D. W. (1990). The Undrained Behaviour of Clayey Sands in Triaxial Compression and Extension. Géotechnique 40 (3), 431–449. doi:10.1680/geot.1990.40.3.431
Hall, E. (1951). “A Triaxial Apparatus for Testing Large Soil Specimens,” in Triaxial Testing of Soils and Bitminous Mixtures (Sausalito, Calif: ASTM International), 152.
Jefferies, M., and Been, K. (2015). Soil Liquefaction: A Critical State Approach. Beijing, China: CRC Press.
Kaneko, K., Terada, K., Kyoya, T., and Kishino, Y. (2003). Global-local Analysis of Granular Media in Quasi-Static Equilibrium. Int. J. Solids Struct. 40 (15), 4043–4069. doi:10.1016/s0020-7683(03)00209-9
Lindquist, E. S., and Goodman, R. E. (1994). Strength and Deformation Properties of a Physical Model Melange: 1st North American Rock Mechanics Symposium. Austin, Texas: American Rock Mechanics Association.
Lupini, J. F., Skinner, A. E., and Vaughan, P. R. (1981). The Drained Residual Strength of Cohesive Soils. Géotechnique 31 (2), 181–213. doi:10.1680/geot.1981.31.2.181
Marsal, R. J. (1973). Mechanical Properties of Rockfill. Incorporated: Publication of: Wiley John and Sons, 109–200.
Medley, E. W. (1994). The Engineering Characterization of Melanges and Similar Block-In-Matrix Rocks (Bimrocks). Berkeley: California.
Mulilis, J. P., Seed, H. B., Chan, C. K., Mitchell, J. K., and Arulanandan, K. (1977). Effects of Sample Preparation on Sand Liquefaction. J. Geotech. Engrg. Div. 103 (2), 91–108. doi:10.1061/ajgeb6.0000387
Nemat-Nasser, S., and Tobita, Y. (1982). Influence of Fabric on Liquefaction and Densification Potential of Cohesionless Sand. Mech. Mater. 1 (1), 43–62. doi:10.1016/0167-6636(82)90023-0
Paduana, J. A. (1966). The Effect of Type and Amount of Clay on the Strength and Creep Characteristics of Clay-Sand Mixtures. Berkeley: California.
Schlosser, F., and Long, N.-T. (1974). Recent Results of French Research on Reinforced Earth. J. Constr. Div. 100, 223–237. doi:10.1061/jcceaz.0000429
Simoni, A., and Houlsby, G. T. (2006). The Direct Shear Strength and Dilatancy of Sand-Gravel Mixtures. Geotech. Geol. Eng. 24 (3), 523–549. doi:10.1007/s10706-004-5832-6
Keywords: shear characteristics, soil-rock mixture, cohesion, friction angle, triaxial test
Citation: Zhang H, Luo Y, Yuan S, Zhou Y, Zhou Q, Zeng F and Feng W (2022) Shear Characteristics of Gravel Soil With Different Fillers. Front. Mater. 9:962372. doi: 10.3389/fmats.2022.962372
Received: 06 June 2022; Accepted: 20 June 2022;
Published: 11 August 2022.
Edited by:
Xianze Cui, China Three Gorges University, ChinaReviewed by:
Yongshui Kang, Institute of Rock and Soil Mechanics (CAS), ChinaYalong Jiang, East China Jiaotong University, China
Copyright © 2022 Zhang, Luo, Yuan, Zhou, Zhou, Zeng and Feng. This is an open-access article distributed under the terms of the Creative Commons Attribution License (CC BY). The use, distribution or reproduction in other forums is permitted, provided the original author(s) and the copyright owner(s) are credited and that the original publication in this journal is cited, in accordance with accepted academic practice. No use, distribution or reproduction is permitted which does not comply with these terms.
*Correspondence: Wei Feng, fw500@163.com