Microstructure-Sensitive Uncertainty Quantification for Crystal Plasticity Finite Element Constitutive Models Using Stochastic Collocation Methods
 Anh Tran
  Tim Wildey 1
  Hojun Lim
 - 1Scientific Machine Learning, Sandia National Laboratories, Albuquerque, NM, United States
- 2Computational Materials and Data Science, Sandia National Laboratories, Albuquerque, NM, United States
Uncertainty quantification (UQ) plays a major role in verification and validation for computational engineering models and simulations, and establishes trust in the predictive capability of computational models. In the materials science and engineering context, where the process-structure-property-performance linkage is well known to be the only road mapping from manufacturing to engineering performance, numerous integrated computational materials engineering (ICME) models have been developed across a wide spectrum of length-scales and time-scales to relieve the burden of resource-intensive experiments. Within the structure-property linkage, crystal plasticity finite element method (CPFEM) models have been widely used since they are one of a few ICME toolboxes that allows numerical predictions, providing the bridge from microstructure to materials properties and performances. Several constitutive models have been proposed in the last few decades to capture the mechanics and plasticity behavior of materials. While some UQ studies have been performed, the robustness and uncertainty of these constitutive models have not been rigorously established. In this work, we apply a stochastic collocation (SC) method, which is mathematically rigorous and has been widely used in the field of UQ, to quantify the uncertainty of three most commonly used constitutive models in CPFEM, namely phenomenological models (with and without twinning), and dislocation-density-based constitutive models, for three different types of crystal structures, namely face-centered cubic (fcc) copper (Cu), body-centered cubic (bcc) tungsten (W), and hexagonal close packing (hcp) magnesium (Mg). Our numerical results not only quantify the uncertainty of these constitutive models in stress-strain curve, but also analyze the global sensitivity of the underlying constitutive parameters with respect to the initial yield behavior, which may be helpful for robust constitutive model calibration works in the future.
1 Introduction
Uncertainty quantification (UQ) has been a cornerstone in applied mathematics to verify and validate forward models, with application ranging from subsurface flow, climate change, integrated computational materials engineering (ICME) developments, advanced manufacturing, and many more. In the context of materials design, process-structure-property-performance relationship plays a critical role in establishing the linkage between manufacturing and desired properties, to which materials can be tailored for specific applications. Across the spectrum of length- and time-scales, from quantum to macro-scale, multiple ICME models have been developed in the quest of accurate prediction of materials properties and performance. Notable ICME models for deformation of metals includes, but are not limited to, concurrent or hierarchical couplings of density functional theory, molecular dynamics, kinetic Monte Carlo, dislocation dynamics, crystal plasticity, phase-field, finite element, and any sort of multi-physics and hybrid approaches. Despite its success, there are still much room and open questions for UQ research with respect to microstructure-induced mechanical response in metal alloys.
The concept of ICME models is particularly important because with the predictive capability, engineers can numerically approximate material properties and performance under different operating conditions, without actually performing physical experiments. With the rise of high-performance parallel computing, this step is often hailed as the third paradigm of science Agrawal and Choudhary (2016), supporting prior empirical and experimental, as well as theoretical research. However, as in any forward computational model that relies on deterministic calculations, there is a necessary need to quantify the uncertainty that is associated with the numerical predictions, in order to sufficiently enhance its fidelity and robustness. For the case of crystal plasticity finite element method (CPFEM) as an ICME model that bridges microstructure and materials properties and performance, the question of uncertainty is even more relevant because microstructures are well known to be stochastic, high-dimensional in image or volume representations, and may be anisotropic and heterogeneous.
Numerous UQ studies in computational solid mechanics have been conducted over the last decade. Given the critical importance of optimization and UQ for a wide variety of problems in materials science, several frameworks have been developed, see e.g., Panchal et al. (2013); McDowell (2007); Kalidindi et al. (2016), to provide robust predictions under uncertainty. A comprehensive review of UQ applications in ICME-based simulations can be found in Honarmandi and Arróyave Honarmandi and Arróyave (2020). For example, Zhao et al. Zhao et al. (2022) incorporated measurement and parametric uncertainty to quantify the uncertainty of critical resolved share stress for hcp Ti alloys from nano-indentation. Lim et al. Lim et al. (2019) investigated the mesh sensitivity and polycrystalline representative volume element (RVE), where initial textures, hardening models, and boundary conditions are uncertain, and showed that an adequate polycrystalline RVE is obtained by capturing 1,000 or more grains. Tran and Wildey Tran and Wildey (2020) applied data-consistent inversion method to infer a distribution of microstructure features from a distribution of yield stress, where the push-forward density map via a heteroscedastic Gaussian process approximation is consistent with a target yield stress density. Kotha et al. Kotha et al. (2019a,b, 2020b,a) developed uncertainty-quantified parametrically homogenized constitutive models to capture uncertainty in microstructure-dependent stress-strain curve, as well as stochastic yield surface, which has been broadly applied for modeling multi-scale fatigue crack nucleation in Ti alloys Ozturk et al. (2019b,a) and for single-crystal Ni-based superalloys with support vector regression as an underlying machine learning model Weber et al. (2020). Sedighiani et al. Sedighiani et al. (2020, 2022) applied genetic algorithm and polynomial approximation to various constitutive models, including phenomenological and dislocation-density-based models. Tran et al. Tran A. V. et al. (2019) applied stochastic collocation (SC) method to quantify uncertainty for dendrite morphology and growth via phase-field model. Acar et al. (2017) proposed a linear programming approach to maximize a mean of materials properties under the assumption of Gaussian distribution for both inputs and outputs. Fernandez-Zelaia et al. (2018) utilized Bayesian inference to quantify the uncertainty in stress-strain curves, where model parameters are treated as random variables. Tallman et al. (2019, 2020) applied Gaussian process regression and the Materials Knowledge System framework to predict a set of homogenized materials properties with uncertainty from a distribution function for crystallography orientations and textures. Inductive design exploration method (IDEM) Ellis and McDowell (2017); McDowell et al. (2009); Choi et al. (2008) has been introduced as a materials design methodology to identify feasible and robust design for microstructure features, which has been broadly applied to many practical problems. From a methodological perspective, numerous applied mathematical UQ techniques have been developed over a few decades. While both intrusive and non-intrusive options are available, non-intrusive polynomial chaos expansion (PCE) Xiu and Karniadakis (2002); Najm (2009), which is also known as non-intrusive spectral projection PCE, is one of the most widely used UQ methods to propagate uncertainty in physical models and computational simulations. Global sensitivity analysis methods, which is arguably constructed on top of the high-dimensional model representation, have also well studied. And apparently, numerous studies connecting PCE and global sensitivity analysis, for example, Sudret (2008), Crestaux et al. (2009), and Saltelli et al. (2010), have been conducted. Despite the fact that numerous UQ application works have been carried out in the materials literature and more specifically, in the structure-property relationship, to the knowledge of the authors, none has been applied to quantify the uncertainty related to the underlying constitutive models used in CPFEM.
In this work, we adopt crystallographic textures from Kocks et al. (1998)(cf. Table 1, Chapter 5, pg 185) and Wenk and Van Houtte (2004)(Tables 1 and 2), Raabe et al. (2002), Raabe and Roters (2004), Pham et al. (2017), and Mangal and Holm (2018). We limit the scope of UQ on the microstructure-mechanical property linkage, where the crystal plasticity finite element is widely regarded as the microstructure-aware multi-scale ICME model, and adopt the DREAM.3D Groeber and Jackson (2014) and DAMASK Roters et al. (2019) workflow as previously demonstrated by Diehl et al. (2017), as well as two constitutive models described in Sedighiani et al. (2020, 2022), to perform uncertainty quantification via DAKOTA Eldred (2009); Dalbey et al. (2021).
The rest of the paper is organized as follows. Section 2 introduces PCE and SC as the UQ backbone methodology used in this paper. Section 3 describes the integrated UQ workflow and how they are implemented in practice. Section 4 shows the first case study of 5d UQ for fcc Cu using phenomenological constitutive model with slipping. Section 5 shows the second case study of 16d UQ for hcp Mg using phenomenological constitutive model with slipping and twinning. Section 6 shows the last case study of 7d UQ for bcc W using dislocation-density-based constitutive model. Section 7 discusses and Section 8 concludes the paper, respectively.
2 Uncertainty Quantification Background
In this section, we describe UQ background for CPFEM. In Section 2.1, we summarize the theoretical foundation for generalized polynomial chaos expansion as a non-intrusive spectral projection method. In Section 2.2, we provide the mathematical background for Smolyak sparse grid construction for high-dimensional interpolation and integration, as well as some comparison to full tensor grid highlighting the computational advantage in SC method. We refer interested readers to Babuška et al. (2007); Nobile et al. (2008); Xiu (2009) for a more rigorous mathematical characterization of the SC method.
2.1 Generalized Polynomial Chaos Expansion
The generalized Wiener-Askey PCE Xiu and Karniadakis (2002) represents the second-order random process f(θ) as
where
where there is a one-to-one correspondence between the function
where δij is the Kronecker delta and ⟨⋅, ⋅⟩ denotes the weighted-average, which is defined as the inner product in the Hilbert space of the variable ξ with respect to the weighting function W(ξ), described in Table 1, as
Here,
The PCE coefficients

TABLE 1. Relationship between the types of Wiener-Askey polynomial chaos and their underlying random variables θ.
Table 1 describes the relationship between the types of Wiener-Askey polynomial chaos and their corresponding underlying random variables. For uniformly distributed variables ξ used in this paper, the Wiener-Askey scheme Xiu and Karniadakis (2002) requires Legendre polynomials as the polynomial basis {Φj}.
2.2 Stochastic Collocation
Sparse grid methods Novak and Ritter (1996, 1997, 1999); Barthelmann et al. (2000) are a cornerstone in high-dimensional interpolation and integration that have been used in a variety of disciplines. In concert with the generalized polynomial chaos expansion Xiu and Karniadakis (2002) as a non-intrusive spectral projection approach, SC methods Babuška et al. (2007); Nobile et al. (2008); Xiu (2009) are developed to improve the efficiency of the generalized polynomial chaos expansion on high-dimensional problems using Smolyak sparse grids for integration. In the nutshell, the polynomial chaos expansion coefficients are computed based on the sparse grid framework that significantly reduces the effect of the curse-of-dimensionality.
Following Nobile et al. (2008), let i ≥ 1 and
where
which requires
Let
the isotropic Smolyak quadrature formula Smolyak (1963) is given by
or equivalently as,
where q ≥ n is an integer denoting the level of the construction Wasilkowski and Woźniakowski (1995). To compute the operator
where
To illustrate the benefits in using the Smolyak sparse grid, compared to the full tensor grid, Table 2 compares the number of simulations required to achieve the same level of accuracy. The dimensionalities are chosen according to the case studies in this paper. The equivalent number points on full tensor grid point is computed as
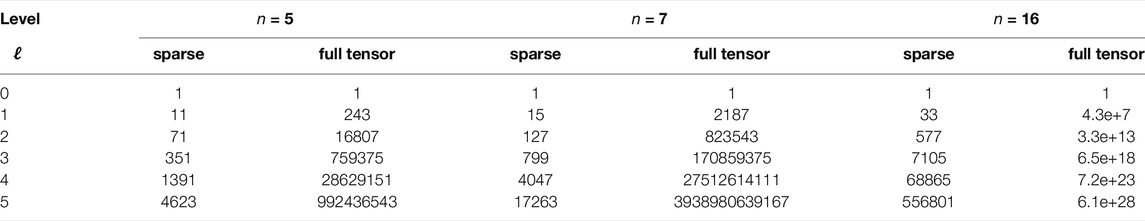
TABLE 2. The number of collocation points used by sparse grid and full tensor grid.
2.3 Variance-Based Global Sensitivity Analysis
Following Sudret (2008), Crestaux et al. (2009), and Saltelli et al. (2010), we summarize the variance-based global sensitivity analysis based on Sobol’ decomposition as follows. In the spirit of generalized polynomial chaos expansion (i.e. Eq. 1 after finite truncation), the Sobol’ decomposition of f(ξ) into the summands of increasing dimensions as
Given a model of the form y = f (ξ1, ξ2, … , ξn), with y as a scalar, a variance-based first order effect for a generic factor ξi can be written as
It is relatively well-known that
and therefore, the total effect sensitivity index can be obtained as
In global SA, the importance of parameter ξi is measured by comparing its variance of the conditional expectation
3 Uncertainty Quantification Workflow for Crystal Plasticity
In this paper, we limit the scope of the UQ studies to cases with a unique RVE. As discussed in Section 7, relaxing this restriction will be the subject of future work. DREAM.3D Groeber and Jackson (2014) is used to generate polycrystalline RVE with a specific crystallographic texture, depending on the material considered. DAKOTA Adams et al. (2009) and Python scripts are used to generate inputs for constitutive models, where DAMASK Roters et al. (2019) is employed as the CPFEM forward model. Results are collected and post-processed in DAKOTA.
Figure 1 describes the integrated framework coupling DAKOTA uncertainty quantification code and DREAM.3D + DAMASK workflow. Based on the sparse grid construction specifications, such as anisotropic/isotropic, sparse grid level, as well as other sensitivity analysis options, DAKOTA sets up a list of input parameters to be determined and evaluated by the coupled DREAM.3D + DAMASK workflow. The sets of simulations are then deployed on high-performance computing systems and evaluated in parallel to accelerate the process. Typically, for a fixed input parameter vector, an ensemble of microstructural RVEs are used; however, to reduce the computational cost in this study, we limit the scope of our investigation to one microstructure RVE. It should be noted that, if the initial microstructure is fixed, then DAKOTA would interact directly with DAMASK, and the role of DREAM.3D can be conveniently ignored. Figure 2 shows an isotropic Smolyak sparse grid with Gaussian abscissas in a d=2 problem at various sparse grid level ℓ from 1 to 5, which results in a nested structure that can be exploited to efficient evaluate interpolation or integration in high-dimensional spaces.
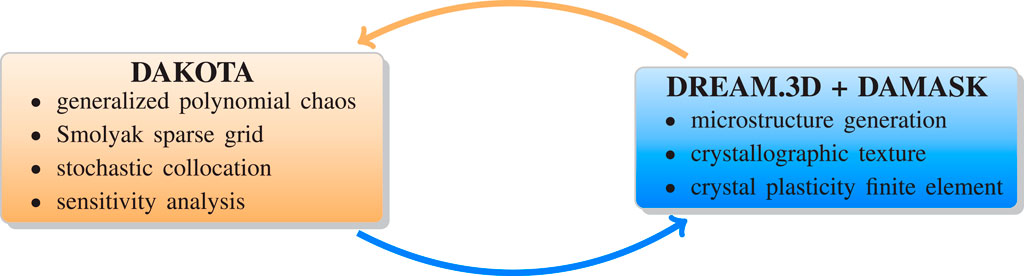
FIGURE 1. Integrating DAKOTA uncertainty quantification workflow to DREAM.3D and DAMASK crystal plasticity finite element simulations. In this framework, DAKOTA queries input parameters to the DREAM.3D + DAMASK automatic workflow, and receives output(s)/quantity (quantities) of interest from DREAM.3D + DAMASK.
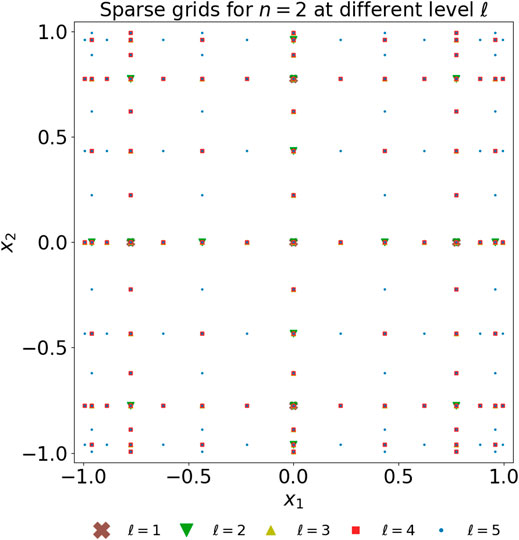
FIGURE 2. Comparison of 2D Smolyak nested sparse grids at various level ℓ, 1 ≤ ℓ ≤ 5, with the number of abscissas varies at 5, 17, 49, 97, 161, respectively, using Gaussian abscissas for quadrature.
In this section, Section 3.1 briefly describes the fundamentals of CPFEM model, whereas Section 3.2 describes the UQ workflow for CPFEM based on DAKOTA UQ package as the wrapper and DREAM.3D and DAMASK as a forward ICME model.
3.1 Crystal Plasticity Model
Consider each point X in the reference configuration being mapped to the current configuration x by a linear transformation with the deformation gradient tensor F, where
The total deformation gradient F can be multiplicatively decomposed into an elastic and plastic parts,
The velocity gradient, which measures the deformation rate, is defined as
where Lp is the plastic velocity gradient evaluated in the intermediate configuration. The second Piola-Kirchoff stress measure S is defined as
where Ee is the elastic Green-Lagrange strain tensor, and
Constitutive equations representing the flow stress, such as the phenomenological slip-based hardening model and the dislocation density-based hardening model, differ on Lp are calculated based on a specific microstructure and a set of internal state variables. The grain size d in the RVE is a random variable characterized by a log-normal distribution, i.e.,
where μD and σD are materials-dependent parameters.
3.2 Forward Uncertainty Quantification Problem
In this work, we consider a forward UQ problem for a fixed set (or ensemble) of microstructures using the SC method, where the set of internal state variables for constitutive model parameters are considered stochastic with some inherent uncertainty. While the non-intrusive PCE approach allows an arbitrary probability density of parameters, in this work, uniform distributions are imposed on the constitutive model parameters due to lack of prior knowledge. With the choice of uniform distributions on bounded intervals, according to the Wiener-Askey scheme shown in Table 1, Legendre polynomials are used to approximate the quantities of interest.
In the initial yield regime, we focus on the estimated yield strain ɛY and yield stress σY. From the homogenized stress-strain curve ɛvM − σvM obtained from a CPFEM simulation, the monotonic cubic interpolation via PCHIP method Fritsch and Butland (1984) is utilized to interpolate ɛvM − σvM curve. From the approximated stress-strain curve, an estimation of modulus of elasticity is obtained by simple linear regression. An offset at ɛ = 0.002 with the estimated modulus of elasticity is drawn, where the coordinates of the intersection are (ɛY, σY). Statistics of these two quantities of interest are obtained and returned to DAKOTA package.
To set up the UQ study, a pre-processing compilation of constitutive model parameters are obtained from DAKOTA using a numerical toy model. The sets of constitutive model parameters are then appropriately parsed into DAMASK using Python scripts, along with the output of DREAM.3D for setting up the geometric file. With the correct setup of DAMASK simulations, the set of DAMSASK simulations are then performed in a massively parallel manner on a high-performance computing cluster. The post-processing results are then collected from DAMASK, and parsed back to DAKOTA package using a Python interface. DAKOTA then performs the UQ and sensitivity analysis, concluding the UQ workflow for CPFEM based on DREAM.3D and DAMASK.
4 Phenomenological Constitutive Model With Slipping in fcc Cu
4.1 Constitutive Law
We adopt the summary and tabulated parameters from Sedighiani et al. (2020, 2022) (Tables 1, 2). In the phenomenological constitutive model, the shear on each slip system α is modeled as
where τ0 is the slip resistance,
where
h0, a, and τ∞ are slip hardening parameters for all 12 slip systems in fcc materials.
4.2 Design of Numerical Experiments
We conducted our analysis with one RVE shown in Figure 3A, where the crystallographic texture is shown in Figure 3B. Average grain size of 60.9467 μm is used, where an RVE of size 256μm3 is generated. A finite element mesh of 163 is created to approximate the microstructure RVE. In DREAM.3D, the texture crystallography of Copper-type with Euler angles (ϕ1, θ, ϕ2) = (90°, 35°, 45°) is used, the grain size parameters are set as μD = 4.09, σD = 0.2, which results in a RVE with 182 grains, shown in Figure 3A. For DAKOTA, we set the sparse grid level ℓ = 3, dimensionality n = 5, which results in 351 inputs. For each set of input parameters, a CPFEM simulation is performed, followed by the post-process. The results are analyzed in the following section. A uniaxial loading condition is applied in the [100] direction with
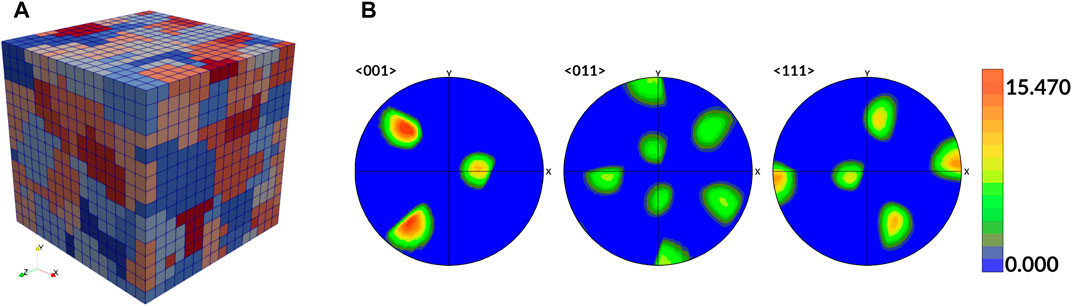
FIGURE 3. (A) Representative volume element for Cu. (B) Copper-type of texture component with Euler angles (ϕ1, θ, ϕ2) = (90°, 35°, 45°).
To compare with the default parameter, a single CPFEM simulation is performed with constitutive parameters described in Table 3. The stress-strain equivalent curve is shown in Figure 4. As a reference to experimental data1, modulus of elasticity for polycrystalline Cu is reported at 110 GPa, whereas its yield strength is reported as 33.3 MPa. Compared to the experiment, the computed modulus and yield strength σY are on the same scale, but off roughly by a factor of 1.5×, possibly due to different processing conditions resulting in slightly different alloys.
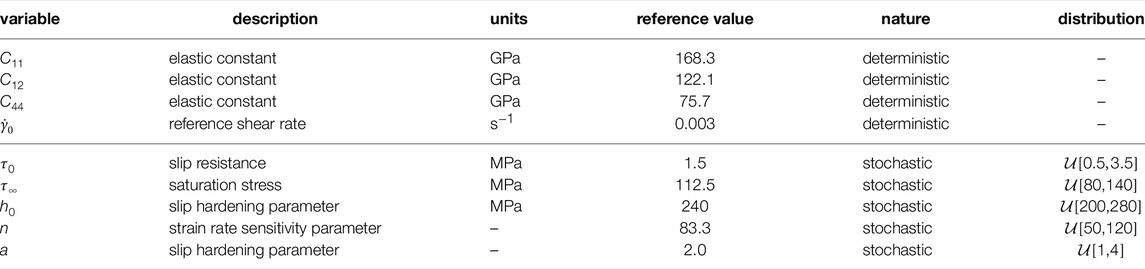
TABLE 3. Parameters for Cu used in this case study [cf. Table 4 Roters et al. (2019) and Tables 1, 2 Sedighiani et al. (2020, 2022)].
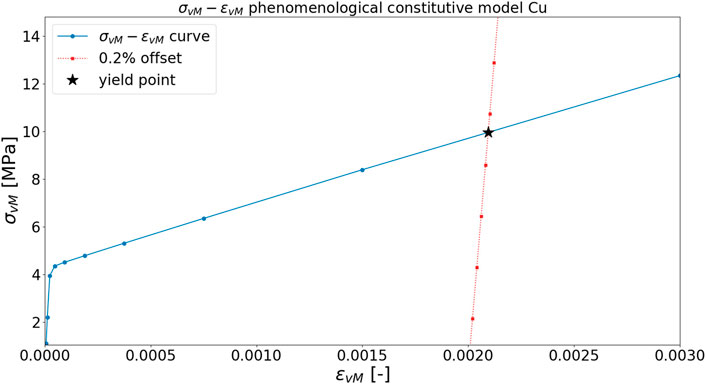
FIGURE 4. Stress-strain equivalent curve for Cu with default parameters and determination of yield point. Modulus of elasticity is estimated as 188.5919 GPa, while (ɛY, σY) are estimated as (0.002052, 9.8527 MPa).
4.3 Numerical Results
Figure 5 shows a compilation of stress-strain curve for 351 simulations, where each corresponds to a unique set of constitutive parameters for fcc Cu. As shown in this figure, the constitutive model effects not only the initial yield behavior, but also the modulus of elasticity and the hardening behavior.
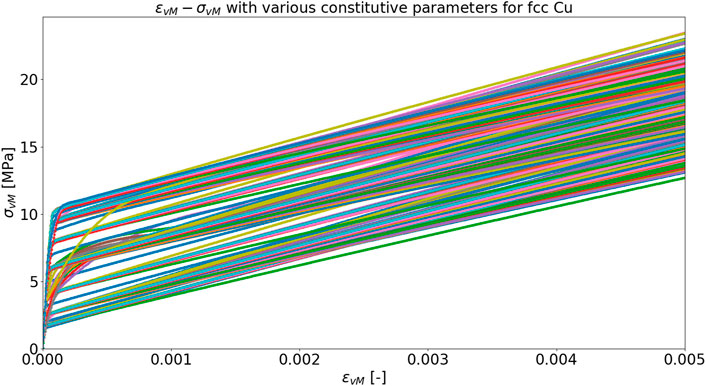
FIGURE 5. Equivalent ɛvM—σvM plots for fcc Cu.
Figures 6A,B show the probability density function for ɛY and σY, respectively. The mode for ɛY is approximately 0.00207, whereas the mode for σY is approximately 11.65 MPa. It should be noted that with the current sparse grid level ℓ = 3, the approximation for ɛY may be imprecise. One of the possible reasons is that the elastic regime of copper is very small (as shown in Figure 5), and therefore, a more accurate approximation may be required to accurately capture the yield strain.
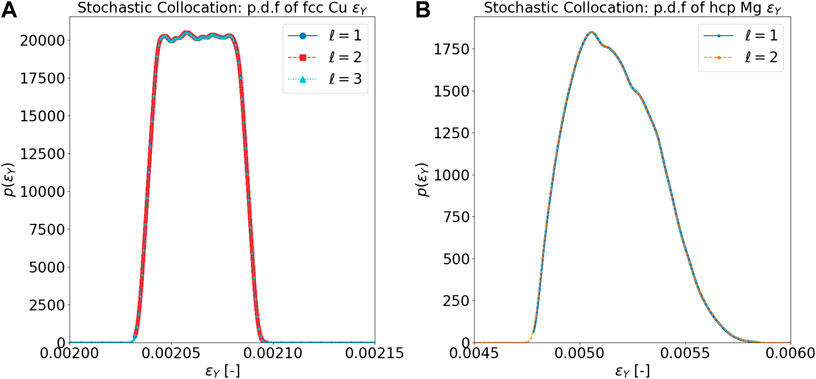
FIGURE 6. (A) SC probability density function of ɛY for fcc Cu. (B) SC probability density function of σY for fcc Cu.
Figure 7 and Figure 8, respectively, show the Sobol’ indices for ɛY and σY. Ranking from the most influential parameters to the least influential parameters for ɛY from the Sobol indices for main effects,
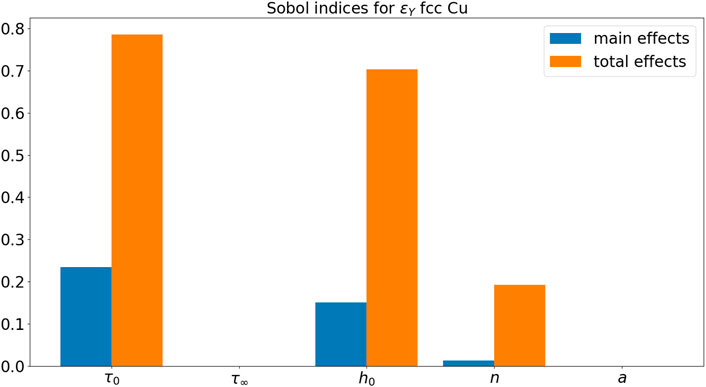
FIGURE 7. Sobol’ indices for ɛY for fcc Cu.
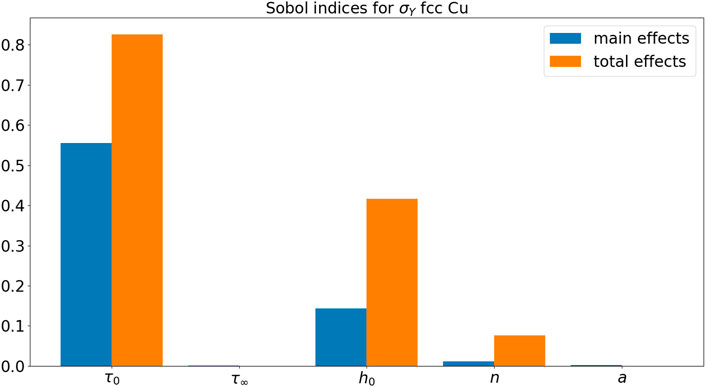
FIGURE 8. Sobol’ indices for σY for fcc Cu.
5 Phenomenological Constitutive Models With Dislocation Slip and Deformation Twinning in hcp Mg
5.1 Constitutive Law
Firstly introduced by Hutchinson (1976) and extended for twinning by Kalidindi (1998), the resistance on α = 1, … , Ns slip systems evolve from ξ0 to a system-dependent saturation value and depend on shear on slip and twin systems according to
where h denotes the components of the slip-slip and slip-twin interaction matrices,
The resistances on the β = 1, … , Ntw twin systems evolve in a similar way,
where
where slip due to mechanical twinning accounting for the unidirectional character of twin formation is computed slightly differently,
where
where γchar is the characteristic shear due to mechanical twinning and depends on the twin system. Interested readers are referred to Section 6.2.2 from Roters et al. (2019).
5.2 Design of Numerical Experiments
Similar to the previous section we restrict the scope to one RVE shown in Figure 9A, where the crystallographic texture is shown in Figure 9B. Average grain size of 204.037 μm is used, where an RVE of size 2048μm3 is generated. A mesh of 643 is created to approximate the microstructure RVE. In DREAM.3D, the texture crystallography with Euler angles (ϕ1, θ, ϕ2) = (90°, 0°, 0°) is used, the grain size parameters are set as μD = 5.2983, σD = 0.2, which results in a RVE with 1706 grains, shown in Figure 9A. For DAKOTA, we set the sparse grid level ℓ = 2, dimensionality n = 16, which results in 577 inputs. For each set of input parameters, a CPFEM simulation is performed, followed by the post-processing steps. The results are analyzed in the following section. A uniaxial loading condition is applied in the [100] direction with
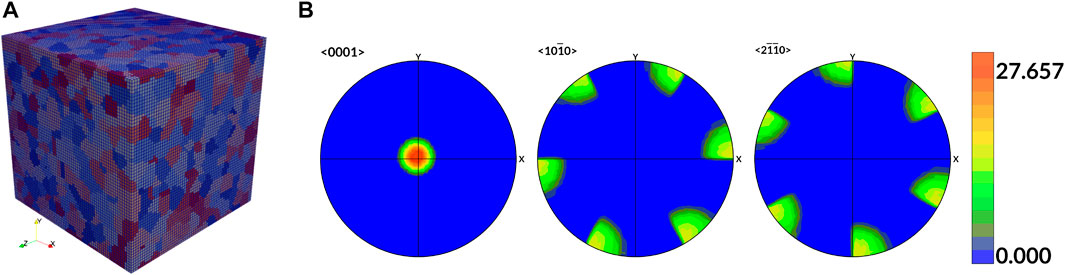
FIGURE 9. (A) Representative volume element for Mg. (B) Magnesium texture component with Euler angles (ϕ1, θ, ϕ2) = (90°, 0°, 0°) Mangal and Holm (2018).
To compare with the default parameter, a single CPFEM simulation is performed with constitutive parameters described in Table 4. The stress-strain equivalent curve is shown in Figure 10. As a reference to experimental data2, the modulus of elasticity for polycrystalline Mg is reported at 44 GPa, whereas its yield strength is reported as 90–105 MPa. Compared to the experiment, the computed modulus and yield strength σY are well calibrated, as the computational results agree very well with the experimental data.
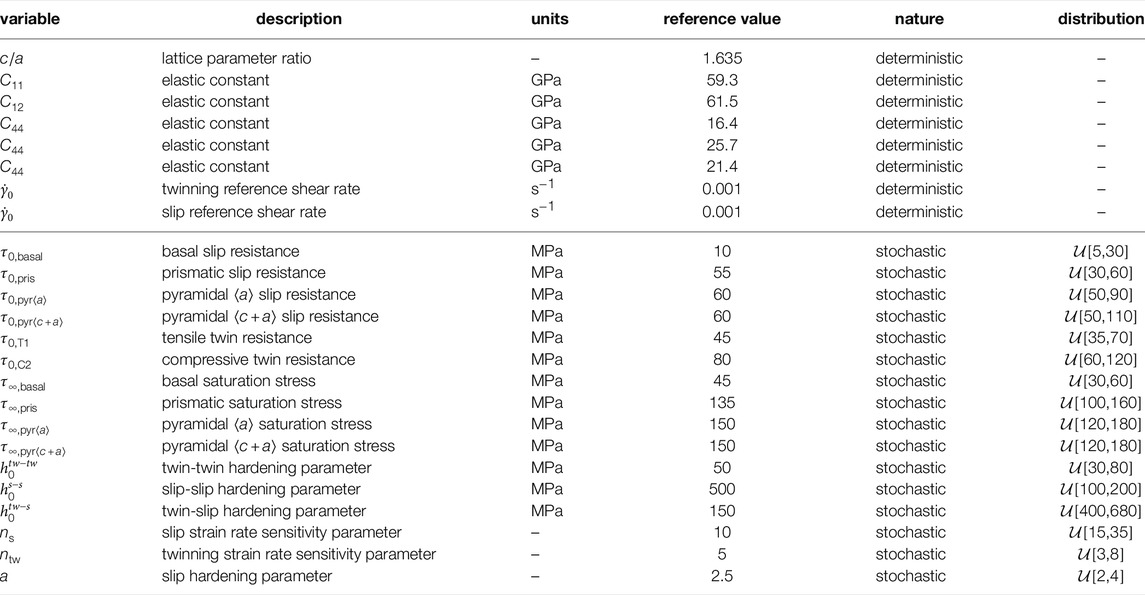
TABLE 4. Parameters for Mg used in this case study (cf. Tables 7 and 8 Sedighiani et al. (2020, 2022), Wang et al. (2014); Tromans (2011); Agnew et al. (2006)).
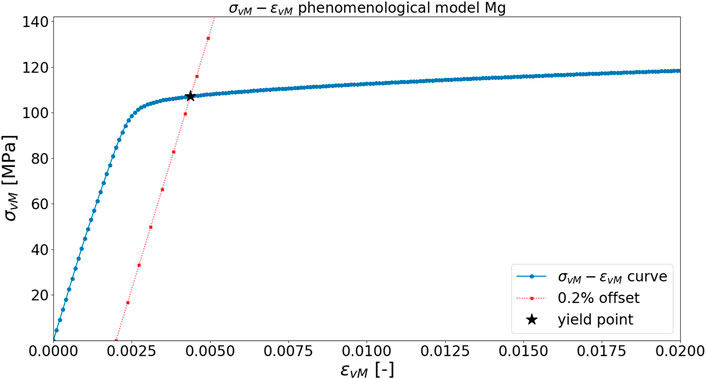
FIGURE 10. Stress-strain equivalent curve for Mg with default parameters and determination of yield point. Modulus of elasticity is estimated as 45.1172 GPa, while (ɛY, σY) are estimated as (0.004375, 107.2 MPa).
5.3 Numerical Results
Figure 11 shows a compilation of stress-strain curves for 577 simulations, where each corresponds to a unique set of constitutive parameters for hcp Mg. As shown in this figure, the constitutive model has a minor effect on the effective modulus of elasticity, and more profound effect on the yield stress σY.

FIGURE 11. Equivalent ɛvM—σvM plots for hcp Mg.
Figures 12A,B, respectively, show the probability density function for ɛY and σY. The mode for ɛY is approximately 0.0054, whereas the mode for σY is approximately 99 MPa. The uncertainty explained in σY reasonably agree with experimental data.
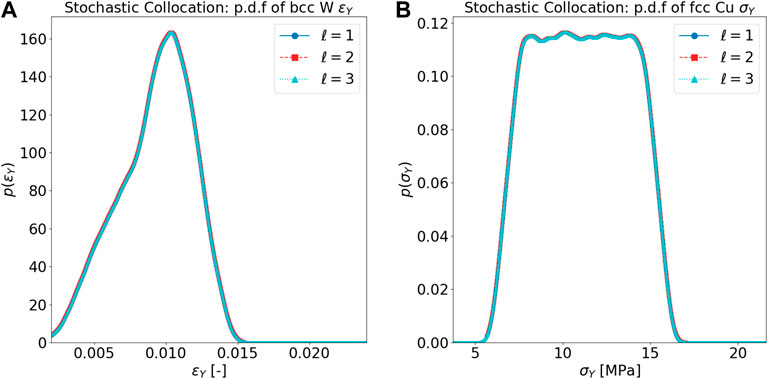
FIGURE 12. (A) SC probability density function of ɛY for hcp Mg. (B) SC probability density function of σY for hcp Mg.
Figure 13 and Figure 14, respectively, show the Sobol’ indices for ɛY and σY. Ranking from the most influential parameters to the least influential parameters for ɛY from the Sobol indices for main effects,
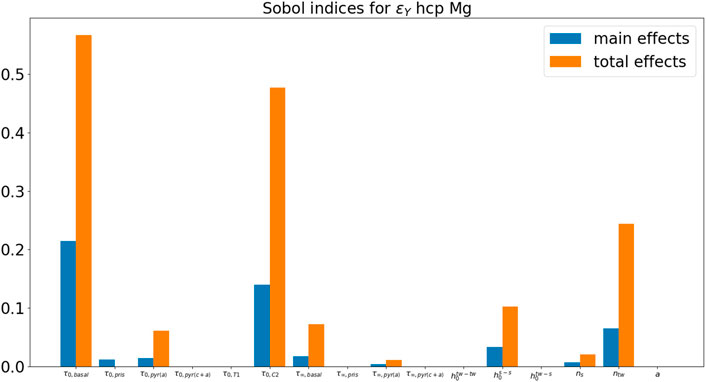
FIGURE 13. Sobol’ indices for ɛY for hcp Mg.
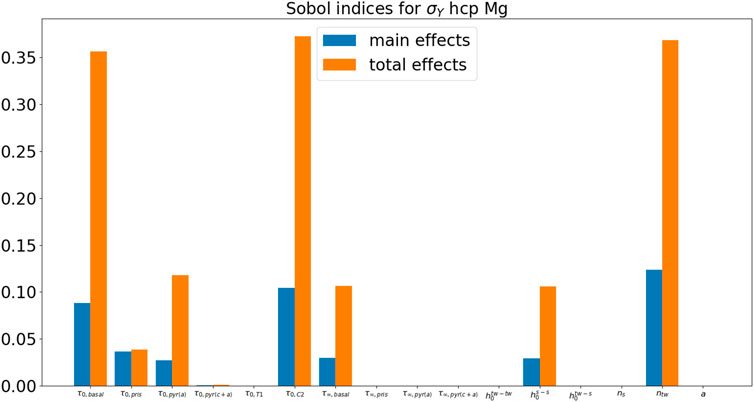
FIGURE 14. Sobol’ indices for σY for hcp Mg.
6 Dislocation-Density-Based Constitutive Model for bcc W
6.1 Constitutive Law
For the sake of completeness, we adopt the dislocation-density-based constitutive law description from Cereceda et al. (2016, 2015), Stukowski et al. (2015), and summarize it here. Interested readers are further referred to Cereceda et al. (2016, 2015, 2013), Stukowski et al. (2015), especially Cereceda et al. (2016) for a complete formulation.
It is assumed that all the plastic deformation is due to dislocation slip, i.e.
where α is a slip system, mα and nα are unit vectors in the normalized slip direction and the normal to the slip plane of the system α, respectively,
where
where
Under the assumption that kink relaxation is significantly faster than kink-pair nucleation, the total time tt required for a kink pair to form and sweep a rectilinear screw dislocation segment of length λα is
where tn is the mean time to nucleate a kink pair, tk is the time needed for a kink to sweep half a segment length, J is the kink-pair nucleation rate, w is the kink-pair separation, vk is the kink velocity.
The kink-pair nucleation rate is modeled by an Arrhenius formulation as
where v0 is an attempt frequency, ΔHkp is the activation enthalpy of a kink pair stress τα, k is Boltzmann’s constant. The kink velocity is modeled as
where B is simplified to a constant. The dislocation velocity can be modeled as
where
It is further elaborated in Sedighiani et al. (2020) that
where p and q determine the shape of the short-range activation energy.
Following the Kocks-Mecking family of dislocation density evolution models Mecking and Kocks (1981), the mobile dislocation density on slip system α evolves in time is modeled as
with the initial dislocation density
λα is defined as
where dg is the grain size, c is a hardening constant,
Dislocation annihilation occurs spontaneously when dipoles approach within a spacing of dedge
The resolved shear stress τα is corrected by replacing with
where τh is the hardening stress,
6.2 Design of Numerical Experiments
For dislocation-density-based CPFEM simulations, we used an RVE shown in Figure 15A, with the crystallographic texture shown in Figure 15B and Euler angles (ϕ1, θ, ϕ2) = (0, 0, 45). Average grain size of 3.0339 μm is used, where an RVE of size 32 μm3 is generated. A mesh of 323 is created to approximate the microstructure RVE. In DREAM.3D, the texture crystallography with Euler angles (ϕ1, θ, ϕ2) = (0°, 0°, 45°) is used, the grain size parameters are set as μD = 1.0986, σD = 0.15, which results in a RVE with 2089 grains, shown in Figure 15A. For DAKOTA, we set the sparse grid level ℓ = 3, dimensionality n = 17, which results in 799 inputs. For each set of input parameters, a CPFEM simulation is performed, followed by the post-process. The results are analyzed in the following section. A uniaxial loading condition is applied in the [100] direction with
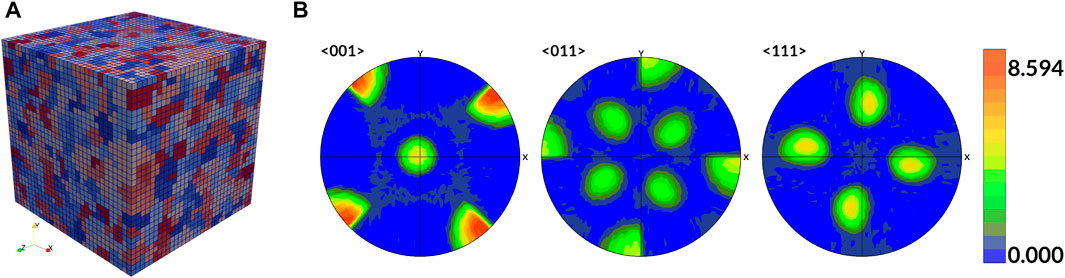
FIGURE 15. (A) Representative volume element for W. (B). Rotated Cube type of texture component with Euler angles (ϕ1, θ, ϕ2) = (0°, 0°, 45°).
To compare with the default parameter, a single CPFEM simulation is performed with constitutive parameters described in Table 5. The stress-strain equivalent curve is shown in Figure 16. As a reference to experimental data3, the modulus of elasticity for polycrystalline W is reported at 400 GPa, whereas its yield strength is reported as approximately 750 MPa. Compared to the experiment, the computed modulus agrees very well, but the yield strength σY differs, possibly due to the constitutive model is calibrated for single crystal W, whereas the experimental data is reported for polycrystalline W.
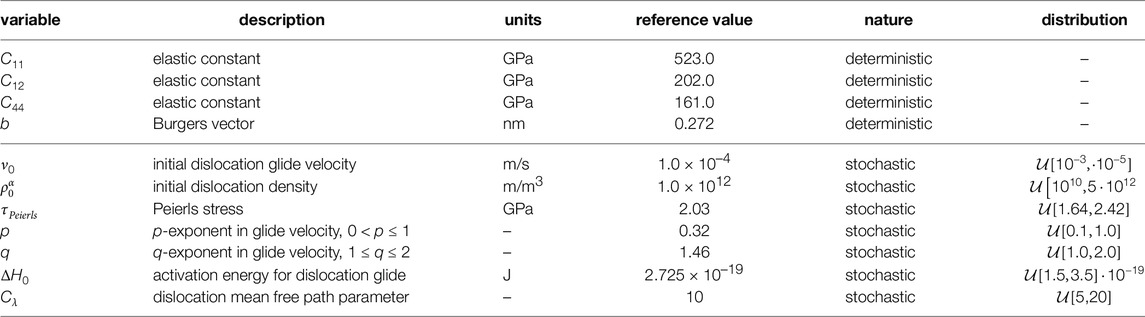
TABLE 5. Parameters for W used in this case study (cf. Tables 2 and 3 in Cereceda et al. Cereceda et al. (2016, 2015), Section 6.2.4 Roters et al. (2019)). Bounds for τPeierls are devised based on Samolyuk et al. Samolyuk et al. (2012) and Cereceda et al. Cereceda et al. (2016).
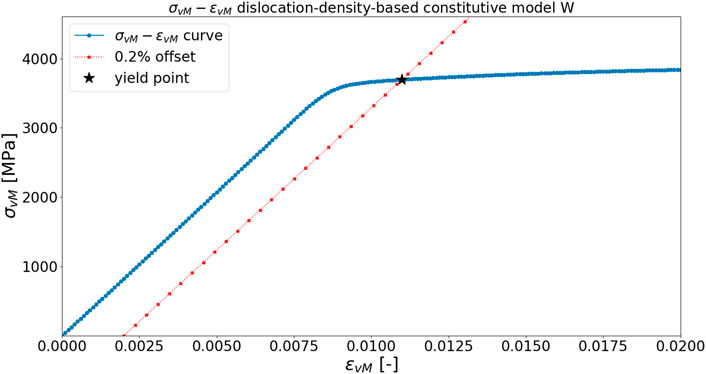
FIGURE 16. Stress-strain equivalent curve for W with default parameters and determination of yield point. Modulus of elasticity is estimated as 411.3528 GPa, while (ɛY, σY) are estimated as (0.01098, 3695 MPa).
6.3 Numerical Results
Figure 17 shows a compilation of stress-strain curves for 799 simulations, where each corresponds to a unique set of constitutive parameters for bcc W. As shown in this figure, the constitutive model has a minor effect on the effective modulus of elasticity, and more profound effect on the yield stress σY.
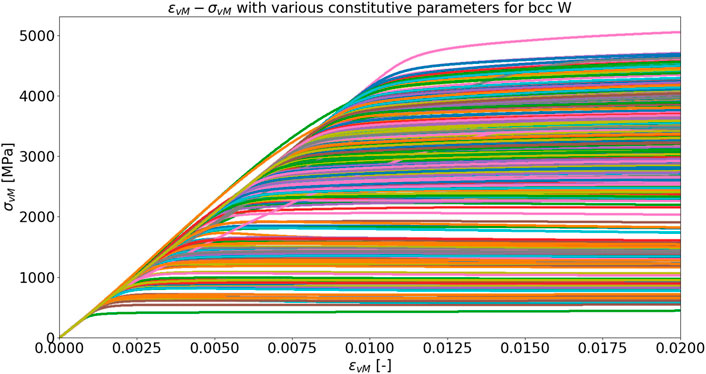
FIGURE 17. Equivalent ɛvM − σvM plots for bcc W.
Figures 18A,B shows the probability density function for ɛY and σY, respectively. The mode for ɛY is approximately 0.01010, whereas the mode for σY is approximately 3350 MPa. The uncertainty explained in σY reasonably agree with experimental data. For experimental data with σY ≈ 750 MPa, fairly a few set of parameters can reproduce and calibrate accordingly, as shown in Figure 17.
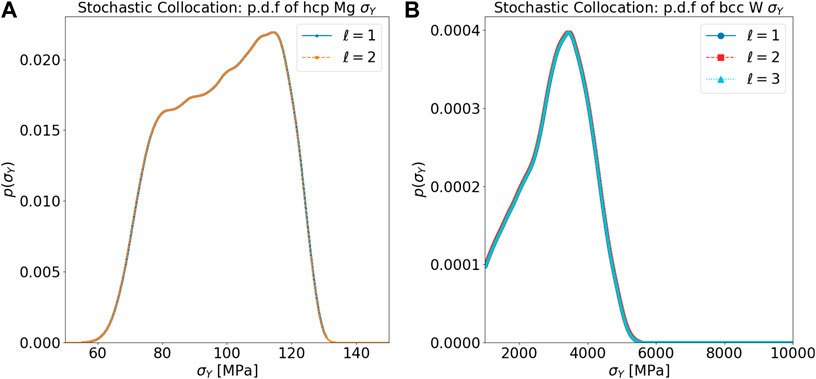
FIGURE 18. (A) SC probability density function of ɛY for bcc W. (B) SC probability density function of σY for bcc W.
Figure 19 and Figure 20, respectively, show the Sobol’ indices for ɛY and σY. Ranking from the most influential parameters to the least influential parameters for ɛY from the Sobol indices for main effects, Tp = 0.7356,
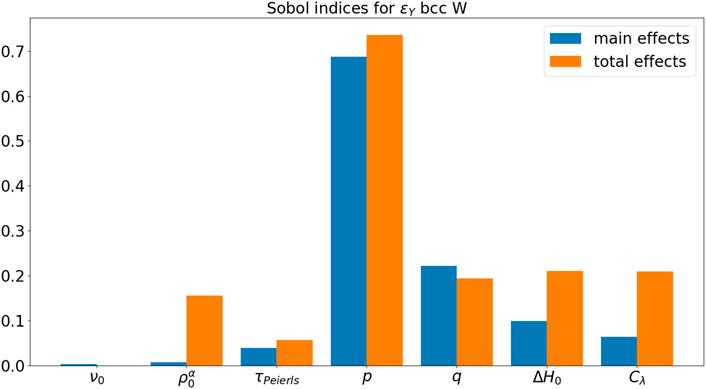
FIGURE 19. Sobol’ indices for ɛY for bcc W.

FIGURE 20. Sobol’ indices for σY for bcc W.
7 Discussion
In this paper, we conducted several UQ studies for constitutive models in CPFEM with a single microstructure RVE for each case study. Three case studies are performed with different crystal structures, namely fcc, hcp, and bcc, for Cu, Mg, and W, respectively. In this paper, three materials systems with different crystal structures (fcc, bcc, and hcp) are studied. Depending on the crystal structure, there may be different slipping and twinning systems in terms of slipping and twinning directions in plastic deformation, leading to interesting materials behaviors and mechanisms. The quantities of interest are selected as the initial yield strain ɛY and the initial yield stress σY. For fcc Cu, parameter τ0 is the most influential parameter for the initial yield behavior. For hcp Mg, all τ0,basal, τ0,C2, and ntw parameters are influential for the initial yield behavior. For bcc W, p parameter in the short-range activation energy model is the most influential parameter for the initial yield behavior.
UQ studies, such as those described in this manuscript, play an important role in constitutive model calibration for unknown material system in the future. Since there are only a limited number of physical constitutive models, it is important to conduct a UQ study to observe the range of quantities of interest, and to numerically rank the influence of constitutive model parameters. Based on the stress-strain compilation curve conducted for various constitutive model parameters, the material behaviors can be rigorously quantified. The obtained UQ results provide a foundational step for further constitutive model calibration for future works, mostly conducted via digital image correlation techniques Turner et al. (2015); Reu et al. (2018, 2021).
Compared to polynomial approximation with full tensor grid, sparse grid approaches have a significant computational advantages, where this advantage grows with increasing dimensionality thanks to a slower growth rate Nobile et al. (2008). In the context of constitutive models, the computational reduction is mostly profound in the case of hcp system (as opposed to bcc and fcc), such as Mg and Ti, and in the case of dislocation-density-based constitutive model (as opposed to phenomenological model), where many parameters require careful calibration to obtain a sufficient agreement with experiments. For simple system with a relatively simple phenomenological constitutive model, the computational reduction is less severe. It is noteworthy that the level of the Smolyak sparse grid in this study has a little effect on the resulting probability density function of QoIs. This implies that the underlying function is perhaps mostly low-order. This observation can also be confirmed by the Sobol’ indices, where the first-order Sobol’ indices are much more dominant, compared to higher-order Sobol’ indices.
To construct the response surface model, stochastic collocation provides a significant advantage for reducing the curse of dimensionality. However, when it comes to accuracy, Gaussian process regression, which is also the underlying surrogate model for Bayesian optimization, is arguably one of the best approaches in shallow machine learning. The direction of coupling Bayesian optimization, e.g., Tran A. et al. (2019, 2020, 2021); Tran (2019); Tran et al. (2022), for robust constitutive model calibration remains open for future research.
The scope of this manuscript is to quantify the microstructure-sensitive uncertainty. Obviously, it can be expanded to account for the entire stress-strain curve. However, due to the number of parameters involved in each constitutive model, there are hundreds to thousands of runs needed for a single microstructure RVE. Such computationally expensive numerical experiments require careful planning and execution, and therefore, remain a potential topic for future studies. It is important to point out that by restricting to one RVE per case study, this work does not address microstructure-sensitive uncertainty that either is related or induced by the underlying stochastic nature of microstructures. The direction of investigating a microstructure ensemble with many RVEs remain open for future work.
8 Conclusion
In this paper, we applied SC to quantify uncertainty associated with the initial yield behavior, mainly the estimated yield strain ɛY and the estimated yield stress σY for fcc Cu, hcp Mg, and bcc W. A variety of constitutive models are used, resulting with different parameterization and dimensionalities for the constitutive models considered. To mitigate the curse of dimensionality, Smolyak sparse grid is employed for high-dimensional integration to evaluate the PCE coefficients. Variance-based global sensitivity analysis is used to study the sensitivity analysis of the constitutive model parameters.
In light of the computational results presented in previous sections, there are several influential parameters that may have a significant effect on the initial yield behavior. For the phenomenological constitutive model, the slip resistance τ0, the slip hardening parameter h0, and the strain rate sensitivity parameter n are the most influential parameters, ranking in descending order. For the dislocation-density-based constitutive model, the p-exponent in glide velocity is the most influential parameter, followed by the activation energy for dislocation glide ΔH0, the dislocation mean free path parameter Cλ, the q-exponent in glide velocity, and the initial dislocation density
Data Availability Statement
The raw data supporting the conclusions of this article will be made available by the authors, without undue reservation.
Author Contributions
AT conceptualizes, performs simulations, analyzes data, and drafts the manuscript. BT and TW consults in uncertainty quantification aspect. HL consults in crystal plasticity finite element aspect.
Author Disclaimer
The views expressed in the article do not necessarily represent the views of the United States Department of Energy or the United States Government. Sandia National Laboratories is a multimission laboratory managed and operated by National Technology and Engineering Solutions of Sandia, LLC., a wholly owned subsidiary of Honeywell International, Inc., for the United States Department of Energy’s National Nuclear Security Administration under contract DE-NA-0003525.
Conflict of Interest
Authors AT, TW, HL are employed by the company Sandia National Laboratories Giorgia.
Publisher’s Note
All claims expressed in this article are solely those of the authors and do not necessarily represent those of their affiliated organizations, or those of the publisher, the editors and the reviewers. Any product that may be evaluated in this article, or claim that may be made by its manufacturer, is not guaranteed or endorsed by the publisher.
Footnotes
1https://www.matweb.com/search/DataSheet.aspx?MatGUID=9aebe83845c04c1db5126fada6f76f7e.
2https://www.matweb.com/search/DataSheet.aspx?MatGUID=7b49605d472d40d393ffe87ea224980c.
3http://www.matweb.com/search/DataSheet.aspx?MatGUID=41e0851d2f3c417ba69ea0188fa570e3.
References
Acar, P., Srivastava, S., and Sundararaghavan, V. (2017). Stochastic Design Optimization of Microstructures with Utilization of a Linear Solver. AIAA J. 55, 3161–3168. doi:10.2514/1.j056000
Adams, B. M., Bohnhoff, W., Dalbey, K., Eddy, J., Eldred, M., Gay, D., et al. (2009). Dakota, a Multilevel Parallel Object-Oriented Framework for Design Optimization, Parameter Estimation, Uncertainty Quantification, and Sensitivity Analysis: Version 5.0 User’s Manual. https://dakota.sandia.gov/.
Agnew, S., Brown, D., and Tomé, C. (2006). Validating a Polycrystal Model for the Elastoplastic Response of Magnesium Alloy AZ31 Using In Situ Neutron Diffraction. Acta mater. 54, 4841–4852. doi:10.1016/j.actamat.2006.06.020
Agrawal, A., and Choudhary, A. (2016). Perspective: Materials Informatics and Big Data: Realization of the “Fourth Paradigm” of Science in Materials Science. Apl. Mat. 4, 053208. doi:10.1063/1.4946894
Babuška, I., Nobile, F., and Tempone, R. (2007). A Stochastic Collocation Method for Elliptic Partial Differential Equations with Random Input Data. SIAM J. Numer. Analysis 45, 1005–1034.
Barthelmann, V., Novak, E., and Ritter, K. (2000). High Dimensional Polynomial Interpolation on Sparse Grids. Adv. Comput. Math. 12, 273–288. doi:10.1023/a:1018977404843
Cereceda, D., Diehl, M., Roters, F., Raabe, D., Perlado, J. M., and Marian, J. (2016). Unraveling the Temperature Dependence of the Yield Strength in Single-Crystal Tungsten Using Atomistically-Informed Crystal Plasticity Calculations. Int. J. Plasticity 78, 242–265. doi:10.1016/j.ijplas.2015.09.002
Cereceda, D., Diehl, M., Roters, F., Shanthraj, P., Raabe, D., and Perlado, J. M. (2015). Linking Atomistic, Kinetic Monte Carlo and Crystal Plasticity Simulations of Single-Crystal Tungsten Strength. Mittl. 38, 213–227. doi:10.1002/gamm.201510012
Cereceda, D., Stukowski, A., Gilbert, M., Queyreau, S., Ventelon, L., Marinica, M.-C., et al. (2013). Assessment of Interatomic Potentials for Atomistic Analysis of Static and Dynamic Properties of Screw Dislocations in W. J. Phys. Condens. Matter 25, 085702. doi:10.1088/0953-8984/25/8/085702
Choi, H.-J., Mcdowell, D. L., Allen, J. K., and Mistree, F. (2008). An Inductive Design Exploration Method for Hierarchical Systems Design under Uncertainty. Eng. Optim. 40, 287–307. doi:10.1080/03052150701742201
Crestaux, T., Le Maıtre, O., and Martinez, J.-M. (2009). Polynomial Chaos Expansion for Sensitivity Analysis. Reliab. Eng. Syst. Saf. 94, 1161–1172. doi:10.1016/j.ress.2008.10.008
Dalbey, K., Eldred, M., Geraci, G., Jakeman, J., Maupin, K., Monschke, J. A., et al. (2021). Dakota A Multilevel Parallel Object-Oriented Framework for Design Optimization Parameter Estimation Uncertainty Quantification and Sensitivity Analysis: Version 6.14 Theory Manual. Albuquerque, NM (United States): Sandia National Lab.(SNL-NM. Tech. rep.
Diehl, M., Groeber, M., Haase, C., Molodov, D. A., Roters, F., and Raabe, D. (2017). Identifying Structure–Property Relationships through DREAM.3D Representative Volume Elements and DAMASK Crystal Plasticity Simulations: An Integrated Computational Materials Engineering Approach. JOM 69, 848–855. doi:10.1007/s11837-017-2303-0
Eldred, M., and Burkardt, J. (2009). “Comparison of Non-intrusive Polynomial Chaos and Stochastic Collocation Methods for Uncertainty Quantification,” in 47th AIAA aerospace sciences meeting including the new horizons forum and aerospace exposition, 976. doi:10.2514/6.2009-976
Eldred, M. (2009). “Recent Advances in Non-intrusive Polynomial Chaos and Stochastic Collocation Methods for Uncertainty Analysis and Design,” in 50th AIAA/ASME/ASCE/AHS/ASC Structures, Structural Dynamics, and Materials Conference 17th AIAA/ASME/AHS Adaptive Structures Conference 11th AIAA No, 2274. doi:10.2514/6.2009-2274
Ellis, B. D., and McDowell, D. L. (2017). Application-specific Computational Materials Design via Multiscale Modeling and the Inductive Design Exploration Method (IDEM). Integrating Mater. Manuf. innovation 6, 9–35. doi:10.1007/s40192-017-0086-3
Fernandez-Zelaia, P., Joseph, V. R., Kalidindi, S. R., and Melkote, S. N. (2018). Estimating Mechanical Properties from Spherical Indentation Using Bayesian Approaches. Mater. Des. 147, 92–105. doi:10.1016/j.matdes.2018.03.037
Fritsch, F. N., and Butland, J. (1984). A Method for Constructing Local Monotone Piecewise Cubic Interpolants. SIAM J. Sci. Stat. Comput. 5, 300–304. doi:10.1137/0905021
Groeber, M. A., and Jackson, M. A. (2014). DREAM. 3D: a Digital Representation Environment for the Analysis of Microstructure in 3D. Integrating Mater. Manuf. innovation 3, 5. doi:10.1186/2193-9772-3-5
Honarmandi, P., and Arróyave, R. (2020). Uncertainty Quantification and Propagation in Computational Materials Science and Simulation-Assisted Materials Design. Integrating Mater. Manuf. Innovation, 1–41. doi:10.1007/s40192-020-00168-2
Hutchinson, J. W. (1976). Bounds and Self-Consistent Estimates for Creep of Polycrystalline Materials. Proc. R. Soc. Lond. A. Math. Phys. Sci. 348, 101–127. doi:10.1098/rspa.1976.0027
Kalidindi, S. R. (1998). Incorporation of Deformation Twinning in Crystal Plasticity Models. J. Mech. Phys. Solids 46, 267–290. doi:10.1016/s0022-5096(97)00051-3
Kalidindi, S. R., Medford, A. J., and McDowell, D. L. (2016). Vision for Data and Informatics in the Future Materials Innovation Ecosystem. JOM 68, 2126–2137. doi:10.1007/s11837-016-2036-5
Kocks, U. F., Tomé, C. N., and Wenk, H.-R. (1998). Texture and Anisotropy: Preferred Orientations in Polycrystals and Their Effect on Materials Properties. Cambridge University Press.
Koester, A., Ma, A., and Hartmaier, A. (2012). Atomistically Informed Crystal Plasticity Model for Body-Centered Cubic Iron. Acta Mater. 60, 3894–3901. doi:10.1016/j.actamat.2012.03.053
Kotha, S., Ozturk, D., and Ghosh, S. (2019a). Parametrically Homogenized Constitutive Models (PHCMs) from Micromechanical Crystal Plasticity FE Simulations, Part I: Sensitivity Analysis and Parameter Identification for Titanium Alloys. Int. J. Plasticity 120, 296–319. doi:10.1016/j.ijplas.2019.05.008
Kotha, S., Ozturk, D., and Ghosh, S. (2019b). Parametrically Homogenized Constitutive Models (PHCMs) from Micromechanical Crystal Plasticity FE Simulations: Part II: Thermo-Elasto-Plastic Model with Experimental Validation for Titanium Alloys. Int. J. Plasticity 120, 320–339. doi:10.1016/j.ijplas.2019.05.007
Kotha, S., Ozturk, D., and Ghosh, S. (2020a). Uncertainty-quantified Parametrically Homogenized Constitutive Models (Uq-phcms) for Dual-phase α/β Titanium Alloys. npj Comput. Mater. 6, 1–20. doi:10.1038/s41524-020-00379-3
Kotha, S., Ozturk, D., Smarslok, B., and Ghosh, S. (2020b). Uncertainty Quantified Parametrically Homogenized Constitutive Models for Microstructure-Integrated Structural Simulations. Integrating Mater. Manuf. Innovation 9, 322–338. doi:10.1007/s40192-020-00187-z
Lim, H., Battaile, C. C., Bishop, J. E., and Foulk, J. W. (2019). Investigating Mesh Sensitivity and Polycrystalline RVEs in Crystal Plasticity Finite Element Simulations. Int. J. Plasticity 121, 101–115. doi:10.1016/j.ijplas.2019.06.001
Mangal, A., and Holm, E. A. (2018). A Dataset of Synthetic Hexagonal Close Packed 3d Polycrystalline Microstructures, Grain-wise Microstructural Descriptors and Grain Averaged Stress Fields under Uniaxial Tensile Deformation for Two Sets of Constitutive Parameters. Data brief 21, 1833–1841. doi:10.1016/j.dib.2018.10.172
McDowell, D. L., Panchal, J., Choi, H.-J., Seepersad, C., Allen, J., and Mistree, F. (2009). Integrated Design of Multiscale, Multifunctional Materials and Products. Butterworth-Heinemann.
McDowell, D. L. (2007). Simulation-assisted Materials Design for the Concurrent Design of Materials and Products. JOM 59, 21–25. doi:10.1007/s11837-007-0111-7
Mecking, H., and Kocks, U. (1981). Kinetics of Flow and Strain-Hardening. Acta metall. 29, 1865–1875. doi:10.1016/0001-6160(81)90112-7
Najm, H. N. (2009). Uncertainty Quantification and Polynomial Chaos Techniques in Computational Fluid Dynamics. Annu. Rev. Fluid Mech. 41, 35–52. doi:10.1146/annurev.fluid.010908.165248
Nobile, F., Tamellini, L., and Tempone, R. (2016). Convergence of Quasi-Optimal Sparse-Grid Approximation of Hilbert-space-valued Functions: Application to Random Elliptic PDEs. Numer. Math. 134, 343–388. doi:10.1007/s00211-015-0773-y
Nobile, F., Tempone, R., and Webster, C. G. (2008). A Sparse Grid Stochastic Collocation Method for Partial Differential Equations with Random Input Data. SIAM J. Numer. Analysis 46, 2309–2345. doi:10.1137/060663660
Novak, E., and Ritter, K. (1996). High Dimensional Integration of Smooth Functions over Cubes. Numer. Math. 75, 79–97. doi:10.1007/s002110050231
Novak, E., and Ritter, K. (1999). Simple Cubature Formulas with High Polynomial Exactness. Constr. Approx. 15, 499–522. doi:10.1007/s003659900119
Novak, E., and Ritter, K. (1997). “The Curse of Dimension and a Universal Method for Numerical Integration,” in Multivariate Approximation and Splines (Springer), 177–187. doi:10.1007/978-3-0348-8871-4_15
Ozturk, D., Kotha, S., Pilchak, A. L., and Ghosh, S. (2019a). Parametrically Homogenized Constitutive Models (PHCMs) for Multi-Scale Predictions of Fatigue Crack Nucleation in Titanium Alloys. JOM 71, 2657–2670. doi:10.1007/s11837-019-03554-0
Ozturk, D., Kotha, S., Pilchak, A. L., and Ghosh, S. (2019b). Two-way Multi-Scaling for Predicting Fatigue Crack Nucleation in Titanium Alloys Using Parametrically Homogenized Constitutive Models. J. Mech. Phys. Solids 128, 181–207. doi:10.1016/j.jmps.2019.04.009
Panchal, J. H., Kalidindi, S. R., and McDowell, D. L. (2013). Key Computational Modeling Issues in Integrated Computational Materials Engineering. Computer-Aided Des. 45, 4–25. doi:10.1016/j.cad.2012.06.006
Pham, M.-S., Creuziger, A., Iadicola, M., and Rollett, A. D. (2017). Roles of Texture and Latent Hardening on Plastic Anisotropy of Face-Centered-Cubic Materials during Multi-Axial Loading. J. Mech. Phys. Solids 99, 50–69. doi:10.1016/j.jmps.2016.08.011
Raabe, D., and Roters, F. (2004). Using Texture Components in Crystal Plasticity Finite Element Simulations. Int. J. Plasticity 20, 339–361. doi:10.1016/s0749-6419(03)00092-5
Raabe, D., Zhao, Z., Park, S.-J., and Roters, F. (2002). Theory of Orientation Gradients in Plastically Strained Crystals. Acta Mater. 50, 421–440. doi:10.1016/s1359-6454(01)00323-8
Reu, P., Blaysat, B., Andò, E., Bhattacharya, K., Couture, C., Couty, V., et al. (2021). DIC Challenge 2.0: Developing Images and Guidelines for Evaluating Accuracy and Resolution of 2D Analyses Focus on the Metrological Efficiency Indicator. Exp. Mech. 58 (7), 1067–1099. doi:10.1007/s11340-017-0349-0
Reu, P. L., Toussaint, E., Jones, E., Bruck, H. A., Iadicola, M., Balcaen, R., et al. (2018). DIC Challenge: Developing Images and Guidelines for Evaluating Accuracy and Resolution of 2d Analyses. Exp. Mech. 58, 1067–1099. doi:10.1007/s11340-017-0349-0
Roters, F., Diehl, M., Shanthraj, P., Eisenlohr, P., Reuber, C., Wong, S. L., et al. (2019). DAMASK–The Düsseldorf Advanced Material Simulation Kit for Modeling Multi-Physics Crystal Plasticity, Thermal, and Damage Phenomena from the Single Crystal up to the Component Scale. Comput. Mater. Sci. 158, 420–478. doi:10.1016/j.commatsci.2018.04.030
Saltelli, A., Annoni, P., Azzini, I., Campolongo, F., Ratto, M., and Tarantola, S. (2010). Variance Based Sensitivity Analysis of Model Output. Design and Estimator for the Total Sensitivity Index. Comput. Phys. Commun. 181, 259–270. doi:10.1016/j.cpc.2009.09.018
Samolyuk, G. D., Osetsky, Y., and Stoller, R. (2012). The Influence of Transition Metal Solutes on the Dislocation Core Structure and Values of the Peierls Stress and Barrier in Tungsten. J. Phys. Condens. Matter 25, 025403. doi:10.1088/0953-8984/25/2/025403
Sedighiani, K., Diehl, M., Traka, K., Roters, F., Sietsma, J., and Raabe, D. (2020). An Efficient and Robust Approach to Determine Material Parameters of Crystal Plasticity Constitutive Laws from Macro-Scale Stress–Strain Curves. Int. J. Plasticity 134, 102779. doi:10.1016/j.ijplas.2020.102779
Sedighiani, K., Traka, K., Roters, F., Raabe, D., Sietsma, J., and Diehl, M. (2022). Determination and Analysis of the Constitutive Parameters of Temperature-dependent Dislocation-Density-Based Crystal Plasticity Models. Mech. Mater. 164, 104117. doi:10.1016/j.mechmat.2021.104117
Smolyak, S. A. (1963). Quadrature and Interpolation Formulas for Tensor Products of Certain Classes of Functions. Doklady Akademii Nauk Russ. Acad. Sci. 148, 1042–1045.
Stukowski, A., Cereceda, D., Swinburne, T. D., and Marian, J. (2015). Thermally-activated Non-schmid Glide of Screw Dislocations in W Using Atomistically-Informed Kinetic Monte Carlo Simulations. Int. J. Plasticity 65, 108–130. doi:10.1016/j.ijplas.2014.08.015
Sudret, B. (2008). Global Sensitivity Analysis Using Polynomial Chaos Expansions. Reliab. Eng. Syst. Saf. 93, 964–979. doi:10.1016/j.ress.2007.04.002
Tallman, A. E., Stopka, K. S., Swiler, L. P., Wang, Y., Kalidindi, S. R., and McDowell, D. L. (2019). Gaussian-process-driven Adaptive Sampling for Reduced-Order Modeling of Texture Effects in Polycrystalline Alpha-Ti. JOM 71, 2646–2656. doi:10.1007/s11837-019-03553-1
Tallman, A. E., Swiler, L. P., Wang, Y., and McDowell, D. L. (2020). Uncertainty Propagation in Reduced Order Models Based on Crystal Plasticity. Comput. Methods Appl. Mech. Eng. 365, 113009. doi:10.1016/j.cma.2020.113009
Tang, G., Iaccarino, G., and Eldred, M. (2010). “Global Sensitivity Analysis for Stochastic Collocation,” in 51st AIAA/ASME/ASCE/AHS/ASC Structures, Structural Dynamics, and Materials Conference 18th AIAA/ASME/AHS Adaptive Structures Conference 12th, 2922. doi:10.2514/6.2010-2922
Tran, A. (2019). aphBO-2GP-3B: A Budged Asynchronously-Parallel Multi-Acquisition for Known/unknown Constrained Bayesian Optimization on HPC. GIW Intern. Rep.
Tran, A., Eldred, M. S., McCann, S., and Wang, Y. (2021). srMO-BO-3GP: A Sequential Regularized Multi-Objective Bayesian Optimization for Constrained Design Applications Using an Uncertain Pareto Classifier. J. Mech. Des., 1–15. doi:10.1115/1.4052445
Tran, A., Eldred, M., Wildey, T., McCann, S., Sun, J., and Visintainer, R. J. (2022). aphBO-2GP-3B: a Budgeted Asynchronous Parallel Multi-Acquisition Functions for Constrained Bayesian Optimization on High-Performing Computing Architecture. Struct. Multidiscip. Optim. 65, 1–45. doi:10.1007/s00158-021-03102-y
Tran, A., Sun, J., Furlan, J. M., Pagalthivarthi, K. V., Visintainer, R. J., and Wang, Y. (2019a). pBO-2GP-3B: A Batch Parallel Known/unknown Constrained Bayesian Optimization with Feasibility Classification and its Applications in Computational Fluid Dynamics. Comput. Methods Appl. Mech. Eng. 347, 827–852. doi:10.1016/j.cma.2018.12.033
Tran, A. V., Liu, D., Tran, H. A., and Wang, Y. (2019b). Quantifying Uncertainty in the Process-Structure Relationship for Al-Cu Solidification. Model. Simul. Mater. Sci. Eng. 27, 064005. doi:10.1088/1361-651x/ab2690
Tran, A., Wildey, T., and McCann, S. (2020). sMF-BO-2CoGP: A Sequential Multi-Fidelity Constrained Bayesian Optimization for Design Applications. J. Comput. Inf. Sci. Eng. 20, 1–15. doi:10.1115/1.4046697
Tran, A., and Wildey, T. (2020). Solving Stochastic Inverse Problems for Property-Structure Linkages Using Data-Consistent Inversion and Machine Learning. JOM 73, 72–89. doi:10.1007/s11837-020-04432-w
Tromans, D. (2011). Elastic Anisotropy of HCP Metal Crystals and Polycrystals. Int. J. Res. Rev. Appl. Sci. 6, 462–483.
Turner, D., Crozier, P., and Reu, P. (2015). Digital Image Correlation Engine. Albuquerque, NM, and Livermore, CA: Sandia National Laboratories (SNL. Tech. rep.
Wang, F., Sandlöbes, S., Diehl, M., Sharma, L., Roters, F., and Raabe, D. (2014). In Situ observation of Collective Grain-Scale Mechanics in Mg and Mg–Rare Earth Alloys. Acta mater. 80, 77–93. doi:10.1016/j.actamat.2014.07.048
Wasilkowski, G. W., and Woźniakowski, H. (1995). Explicit Cost Bounds of Algorithms for Multivariate Tensor Product Problems. J. Complex. 11, 1–56. doi:10.1006/jcom.1995.1001
Weber, G., Pinz, M., and Ghosh, S. (2020). Machine Learning-Aided Parametrically Homogenized Crystal Plasticity Model (PHCPM) for Single Crystal Ni-Based Superalloys. JOM 72, 4404–4419. doi:10.1007/s11837-020-04344-9
Weirs, V. G., Kamm, J. R., Swiler, L. P., Tarantola, S., Ratto, M., Adams, B. M., et al. (2012). Sensitivity Analysis Techniques Applied to a System of Hyperbolic Conservation Laws. Reliab. Eng. Syst. Saf. 107, 157–170. doi:10.1016/j.ress.2011.12.008
Wenk, H.-R., and Van Houtte, P. (2004). Texture and Anisotropy. Rep. Prog. Phys. 67, 1367. doi:10.1088/0034-4885/67/8/r02
Xiu, D. (2009). Fast Numerical Methods for Stochastic Computations: a Review. Commun. Comput. Phys. 5, 242–272.
Xiu, D., and Karniadakis, G. E. (2002). The Wiener–Askey Polynomial Chaos for Stochastic Differential Equations. SIAM J. Sci. Comput. 24, 619–644. doi:10.1137/s1064827501387826
Keywords: uncertainty quantification, crystal plasticity finite element, constitutive models, stochastic collocation, sparse grid, polynomial chaos expansion
Citation: Tran A, Wildey T and Lim H (2022) Microstructure-Sensitive Uncertainty Quantification for Crystal Plasticity Finite Element Constitutive Models Using Stochastic Collocation Methods. Front. Mater. 9:915254. doi: 10.3389/fmats.2022.915254
Received: 07 April 2022; Accepted: 06 June 2022;
Published: 27 September 2022.
Edited by:
M. K. Samal, Bhabha Atomic Research Centre (BARC), IndiaReviewed by:
Sagar Chandra, Homi Bhabha National Institute, IndiaNaveen Kumar Nagaraja, Bhabha Atomic Research Centre (BARC), India
Copyright © 2022 Tran , Wildey and Lim . This is an open-access article distributed under the terms of the Creative Commons Attribution License (CC BY). The use, distribution or reproduction in other forums is permitted, provided the original author(s) and the copyright owner(s) are credited and that the original publication in this journal is cited, in accordance with accepted academic practice. No use, distribution or reproduction is permitted which does not comply with these terms.
*Correspondence: Anh Tran, anhtran@sandia.gov