Seismic Behavior of GFRP Tube Reactive Powder Concrete Composite Columns With Encased Steel
 Jing Ji1,2
  Lingjie He1 Liangqin Jiang1,2 Hongguo Ren3* Shuai Ni3 Zizhen Wang3* Yunhao Li1 Chenyu Yu1 Yubo Lin1
- 1Heilongjiang Key Laboratory of Disaster Prevention, Mitigation and Protection Engineering, Northeast Petroleum University, Daqing, China
- 2Key Laboratory of Earthquake Engineering and Engineering Vibration, Institute of Engineering Mechanics, China Earthquake Administration, Harbin, China
- 3Handan Key Laboratory of Building Physical Environment and Regional Building Protection Technology, School of Architecture and Art, Hebei University of Engineering, Handan, China
To obtain the seismic behavior of glass fiber–reinforced polymer (GFRP) tube reactive powder concrete composite columns with encased steel (GRS), a total of 17 full-scale GRS columns were designed in this study. The parametric studies were conducted to explore the influence of factors such as the diameter of GFRP tube (D), thickness of GFRP tube (t), number of fiber winding layers (n), fiber winding angle (θ), axial compression ratio (λ), compressive strength of reactive powder concrete (fc), the area of encased steel (As), and strength of encased steel (fsy) on the seismic behavior of the composite columns. The finite element models of this kind of columns were established by ABAQUS finite element software, and the seismic behavior analysis for GRS composite columns was carried out. The results show that all the specimens exhibit good ductility and strong deformation ability. The stiffness degradation of specimens significantly slows down with the increase of D, fsy, and λ. The energy dissipation capacity of specimens can be improved by increasing D and λ, while the increase of As and fsy leads to the decrease of the energy dissipation capacity. By observing the failure mode of such composite columns, local bulging occurs in the foot area of the columns. Based on the statistical analysis of the calculated results, the restoring force models for GRS composite columns are proposed, which agree well with the simulated results. The restoring force models can provide reference for the elastic-plastic seismic response analysis of this kind of composite columns.
Introduction
The development of civil engineering depends largely on the development and application of novel structures composed of new materials and new components with excellent performance. Glass fiber–reinforced polymer (GFRP) and reactive powder concrete (RPC), as new materials, have excellent mechanical properties. Compared with ordinary concrete, RPC has stronger load-bearing capacity and higher compressive strength (Yazıcı et al., 2009; Cao et al., 2020). GFRP tube has the advantages of good corrosion resistance, strong toughness, plasticity, and high circumferential tensile strength (Feng et al., 2014; Ahmad et al., 2021), so it has been widely used in practical reinforcement and reconstruction projects. Based on the above advantages, a new type of columns composed of GFRP, RPC, and encased steel is proposed in this study, namely, GFRP tube reactive powder concrete composite columns with encased steel (GRS). The brittle defects of RPC can be overcome effectively by extremely strong hooping effect of the GFRP tube. The ductility and stability of GRS columns can be improved by encased I-shaped steel and the GRS column does not exhibit shear failure. Thus, it is suitable to apply GRS columns to the frames under corrosive conditions and earthquake-prone buildings.
At present, many researches on steel-reinforced concrete (SRC) columns, GFRP-confined concrete columns, and RPC columns have been conducted by domestic and foreign scholars. The low cyclic loading tests on 26 SRC columns were carried out by Chen et al., and the influence regularity of axial compression ratio, stirrup ratio, section shape of steel, and embedded depth of steel on the seismic performance of SRC columns could be obtained. It was found that SRC columns displayed bending failure mode under seismic load (Chen et al., 2014). Li et al. performed tests on 20 steel-reinforced high-strength concrete (SRHSC) columns under low cyclic reversed loading, and the calculation formula for displacement ductility coefficient of SRHSC columns was proposed. The results showed that compared with reinforced concrete columns, SRHSC columns had significantly stronger energy dissipation capacity and excellent seismic performance (Li et al., 2007). The behavior of tubed SRC columns was studied by Zhou et al. through the tests on two circular tubed SRC (CTSRC) columns, two square tubed SRC (STSRC) columns, and two common SRC columns under combined axial constant compression and lateral cyclic load. It was found that the ductility and energy dissipation capacity of CTSRC columns and STSRC columns were significantly higher than those of SRC columns. The seismic behavior of CTSRC columns and STSRC columns could be gradually improved with the increase of the axial compression ratio (Zhou et al., 2010a; Zhou et al., 2010b). To enhance the structural bearing capacity and constructability of conventional concrete-encased steel (CES) columns, a prefabricated angle steel-reinforced concrete (PSRC) column was developed by Hwang et al., and the tests on PSRC columns under axial compression and lateral cyclic loading were conducted. It was found that PSRC columns were more susceptible to early concrete spalling and angle steel buckling under cyclic lateral loading (Hwang et al., 2016). As FRP has been verified to be widely used in confined concrete structures, the mechanical properties of FRP-confined concrete columns have become a hot issue. Eight reinforced concrete columns strengthened with FRP were designed by Shan et al., and the residual performance of FRP-retrofitted columns damaged after simulated seismic loading was studied. The deformation of this type of columns depended on the previous damage intensity and the elastic modulus of FRP (Shan et al., 2006). Based on the stress and strain model and the hysteretic moment-rotation model of FRP-confined concrete, three FRP-jacketed reinforced concrete (RC) columns were established by Teng et al. through OpenSees finite element software. The calculation results were shown to be in close agreement with the test results, which could verify the rationality of the proposed model (Teng et al., 2015). Six recycled concrete-filled GFRP tube (RCFF) columns was designed by Xiao et al., and the influence of recycled coarse aggregate replacement percentage and the strength of core concrete on the seismic behavior of RCFF columns were investigated. Finally, a normalization damage assessment method was developed for the RCFF columns (Xiao and Huang, 2012). The cyclic behavior of hybrid columns made of ultra-high performance concrete and fiber-reinforced polymers (UHPCFFT) was studied by Zohrevand et al., and the results showed UHPCFFT had significantly higher strength, lower residual drift, and energy dissipation (Zohrevand and Mirmiran, 2012). At present, there exist few studies on the seismic behavior of RPC columns. The quasi-static tests of 18 RPC columns were carried out by Ju et al., and the influence of axial compression ratio, longitudinal reinforcement ratio, stirrup ratio, and steel fiber volume content on the seismic behavior of RPC columns were studied. The results showed that the bearing capacity of RPC columns increased with the increase of the axial compression ratio, longitudinal reinforcement ratio, and stirrup ratio, but the ductility of RPC columns decreased with the increase of the axial compression ratio (Ju et al., 2013). Four concrete-filled RPC tube (CFRT) columns and one ordinary hoops-confined concrete column were tested under cyclic and constant axial load by Shan et al., and it was found CFRT columns exhibited bending failure with well distributed fine cracks, without RPC cover spalling or crushing (Shan et al., 2020).
Although the studies on the seismic behavior of RPC columns, steel-reinforced concrete (SRC) columns, and GFRP-confined concrete columns have been carried out widely, the research on seismic behavior of GRS columns has not been reported yet. Therefore, in order to apply GRS columns to building structures in seismic fortification areas, it is necessary to study the seismic behavior of GRS columns under low cyclic loading. In accordance with the results of previous studies, the seismic behavior of the composite columns is related to some main factors, such as the diameter and thickness of GFRP tube, number and angle of fiber winding layers, axial compression ratio, compressive strength of reactive powder concrete, and the area and strength of encased steel. A total of 17 GRS columns are designed to investigate the seismic behavior based on ABAQUS finite element software in this study, and the hysteresis curve, skeleton curve, and failure mode of the GRS column can be obtained. The seismic behavior indexes such as stiffness degradation and energy dissipation capacity of GRS columns are analyzed, and then the restoring force models for GRS columns are proposed, which can provide reference for the elastic-plastic seismic response analysis of this kind of composite columns.
Specimen Design
In order to investigate the seismic behavior of GRS composite columns, a total of 17 GRS columns are designed in this study. The main controlled parameters include the diameter of GFRP tube (D), thickness of GFRP tube (t), number of fiber winding layers (n), fiber winding angle (θ), axial compression ratio (λ), compressive strength of reactive powder concrete (fc), the area of encased steel (As), and strength of encased steel (fsy). The sketch of specimens is shown in Figure 1, and the specific parameters are shown in Table 1. According to the failure mechanism of concrete-filled steel tube columns (Jiang et al., 2021), RPC is continuously and effectively constrained by the GFRP tube, which is expressed by the constraint effect coefficient. The constraint effect coefficient can be calculated by Eq. 1.
where
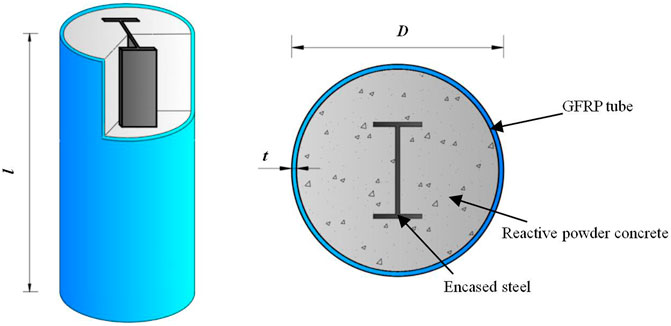
FIGURE 1. Sketch of specimens: (A) the whole GRS columns; (B) cross-section of GRS columns.
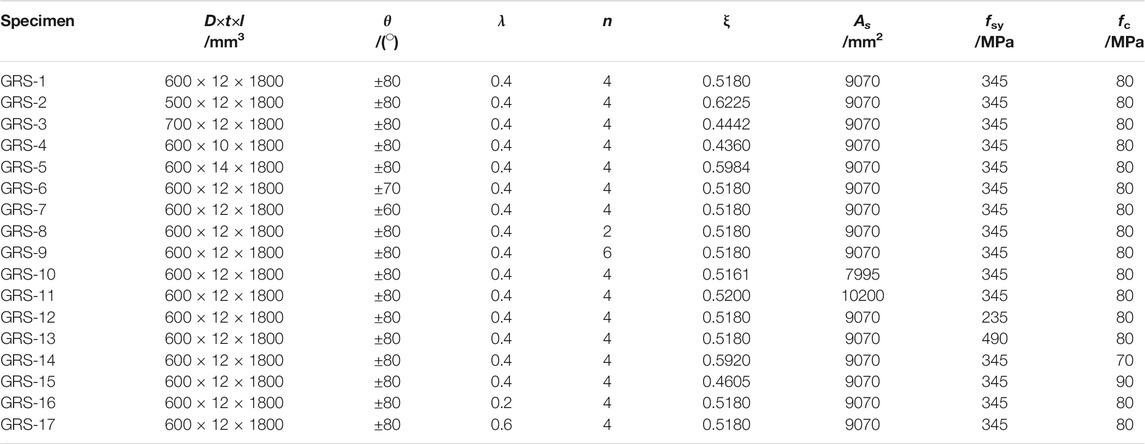
TABLE 1. Specific parameters of GRS specimens.
Finite Element Model of GRS Columns
Materials Constitutive Models
Steel
Based on the mechanical properties of steel under low cyclic loading, a bilinear strengthening elastoplastic model (Han, 2007) is adopted as the constitutive model of steel in this study. As shown in Supplementary Figure S1, the stress and strain curve of steel can be divided into two stages, including elastic stage (OA stage) and strengthening stage (AB stage). The constitutive relation of steel can be expressed by Eq. 2.
where
GFRP Tube
GFRP tube is a type of fiber-reinforced composite materials with anisotropic mechanical properties, as shown in Table 2.
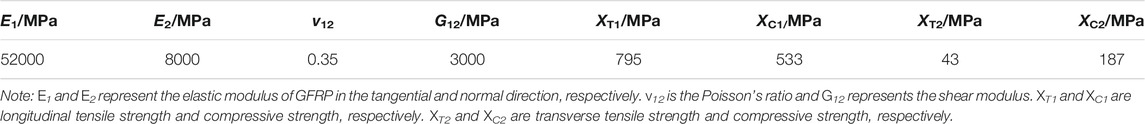
TABLE 2. Mechanical properties of the GFRP material.
RPC
Multiple constitutive models for concrete based on a large number of experiments were proposed by scholars in China and abroad, including Mander et al. (1988), Teng et al. (2007), Pagoulatou et al. (2014), Han (2007), and Code for Design of Concrete Structures (GB 50010-2010, 2010), as shown in Supplementary Figure S2. In this study, constitutive model of confined concrete proposed by Han is selected as the RPC constitutive model, and the plastic damage model for concrete is selected during the modeling process by ABAQUS software.
The stress and strain relationship of RPC under uniaxial compression can be seen in Eq. 3.
where
The stress and strain relationship of RPC under uniaxial tension can be seen in Eq. 9.
where
Establishment of Finite Element Model (FEM)
Element Type
The finite element models of GRS composite columns are established by ABAQUS finite element software in this study. RPC and I-shaped steel are simulated by C3D8R solid element, while GFRP tubes are established by S4R four-node shell element (Almahakeri et al., 2016). The number and angle of fiber winding layers can be defined by composite layers.
Meshing
In order to simplify the calculation and improve the accuracy of simulation, 40 mm is taken as the mesh size of FEM. During the assembly of components, the GRS composite column is cut along the upper and lower edges of I-shaped steel, which can make the meshing division more uniform. The mesh shape is mainly hexahedron and the cross section of mesh division is shown in Figure 2.
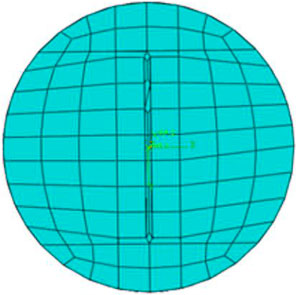
FIGURE 2. Diagram of transverse meshing for GRS composite columns.
Interaction
During the process of finite element modeling, it is assumed that there is no bond-slip between GFRP tube and RPC, which are connected by binding (Ji et al., 2017). In order to realize the fix between the end-plates and GRS column, the top and bottom of GRS composite columns are bonded to the end-plates. Hard contact is adopted in the normal direction of interface between I-shaped steel and RPC. Considering the relative slip, friction contact is used in the tangential direction of interface between I-shaped steel and RPC, and the friction coefficient is set to 0.5 (Liu, 2005). The reference points RP1 and RP2 are set with the distance of 10 mm away from the center between two ends of GRS composite columns; meanwhile, RP1 and RP2 are set as coupling contact.
Boundary Condition and Loading System
The bottom of GRS column is completely fixed, that is, restricting the displacement in X, Y, and Z directions (U1 = U2 = U3 = 0) and the rotation in three directions (UR1 = UR2 = UR3 = 0 rad/s). Two analysis steps are set when the GRS composite columns are loaded. First, concentrated force is applied as the axial load. Then after the axial load is applied, we kept the axial load constant and applied the horizontal cyclic load. The GRS composite columns are loaded by displacement, and the load of each level is cycled twice until the displacement reaches three times as the displacement corresponding to the peak load. The loading modes are shown in Figures 3, 4. The finite element model of GRS composite columns is shown in Figure 5.
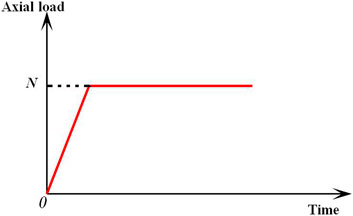
FIGURE 3. Loading system of axial load.
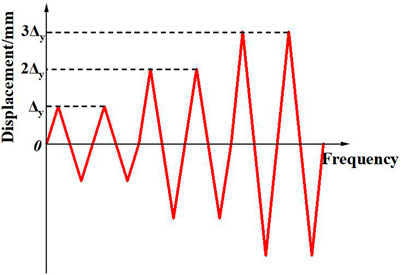
FIGURE 4. Loading system of horizontal cyclic load.
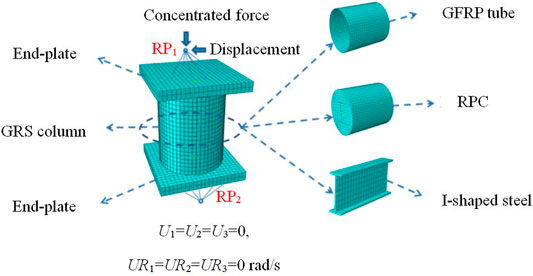
FIGURE 5. Finite element models of GRS composite columns.
Verification of Finite Element Model
Based on the above modeling method, the finite element simulation analysis for the specimen ZL3-1 (Wang, 2019) and specimen C60SL-C (Shan et al., 2021) are conducted to compare with the experimental results. The comparisons of skeleton curves between simulation and experiment for specimen ZL3-1 and specimen C60SL-C are shown in Figures 6A,B, respectively. The comparisons of hysteretic curves between simulation and experiment for specimen ZL3-1 and specimen C60SL-C are shown in Figures 7A,B, respectively. It can be found from Figures 6, 7 that the whole trends of skeleton curves and hysteretic curves obtained by simulations are in good agreement with those obtained by experiments. Therefore, it is reasonable and feasible to carry out the study on seismic behavior of GRS columns based on the above modeling method.
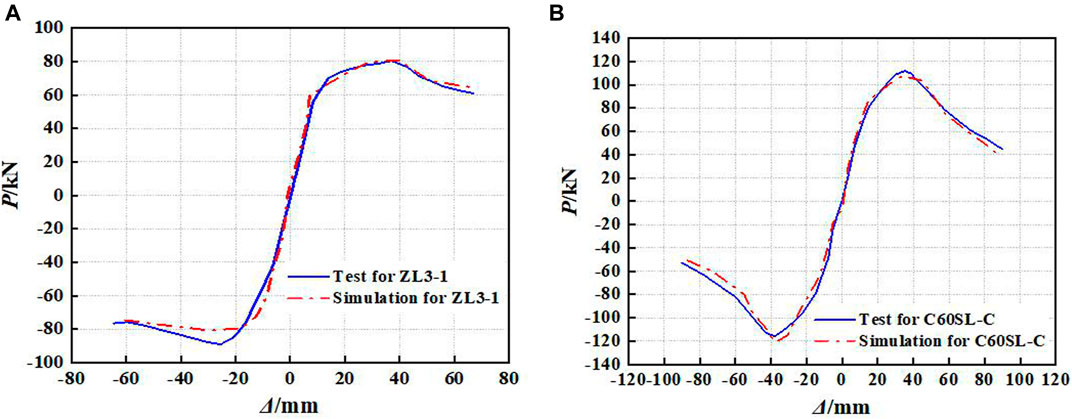
FIGURE 6. Comparisons of skeleton curves between test and simulation: (A) specimen ZL3-1; (B) specimen C60SL-C.
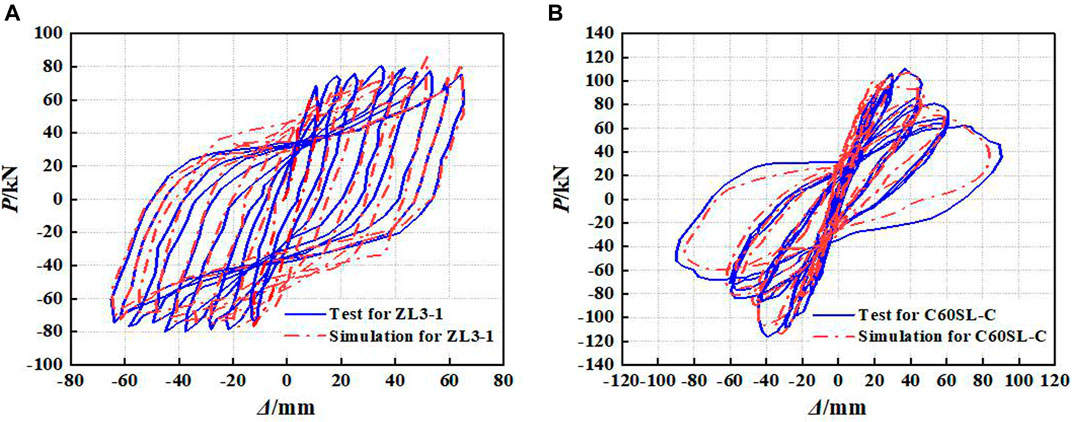
FIGURE 7. Comparisons of hysteretic curves between test and simulation: (A) specimen ZL3-1; (B) specimen C60SL-C.
Simulation Results of GRS Columns
Failure Modes
The failure modes of GRS composite columns under low cyclic horizontal loading are almost the same. In this study, the failure mode of specimen GRS-1 is analyzed as an example, as shown in Figure 8. The failure mode of specimen GRS-1 presents mainly the bulging failure at the upper part of the column base, and the maximum strain appears at the column base. Finally, the GFRP tube reaches the ultimate strain, and the column is overall damaged.
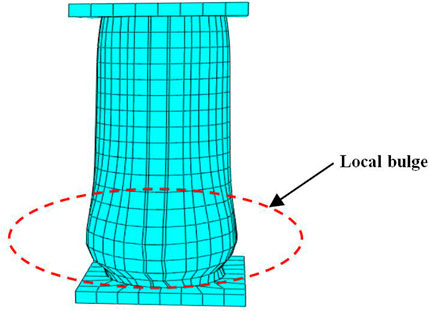
FIGURE 8. The failure mode of specimen GRS-1.
The stress distribution of specimen GRS-1 can be seen from Figure 9. As shown in Figure 9A, the maximum stress of GFRP occurs at a distance above the column base. As shown in Figures 9B,C, the maximum stress of RPC and steel occurs at the column base.
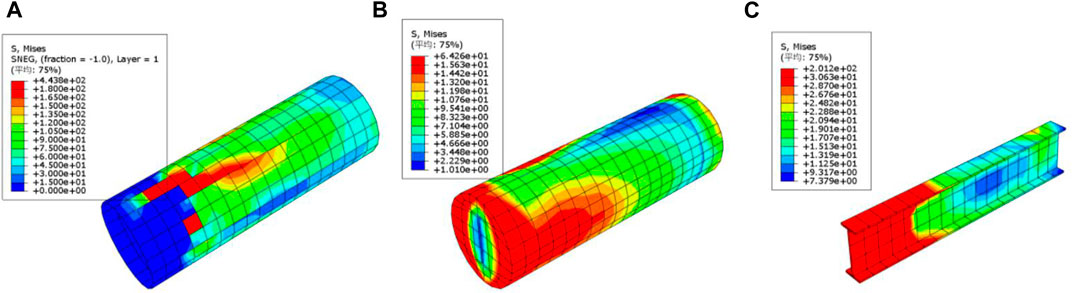
FIGURE 9. The stress distribution of specimen GRS-1: (A) GFRP; (B) RPC; and (C) steel.
Hysteretic Response
The lateral displacement–load hysteresis curve is a basis of seismic analysis, which can be used to predict the seismic performance. The hysteresis curves of designed specimens obtained by finite element software ABAQUS are shown in Figure 10. It can be seen from Figure 10 that the hysteretic curves of 17 GRS composite columns show a relatively full shuttle shape, indicating that GRS composite columns have excellent seismic behavior. At the initial stage of loading, the GRS composite columns remain in the elastic state, and the hysteresis curve is nearly a straight line. The main deformation of the specimens can be basically restored after unloading. With the increase of loading, the hysteresis loop path of the specimens gradually deviates from the straight line. The slope of the curve is smaller, indicating the stiffness of specimens begin to degrade under cyclic load. When specimens enter in the elastic-plastic stage, the specimens have residual deformation after the unloading process, and the bearing capacity of GRS columns begin to decline after reaching the ultimate load.
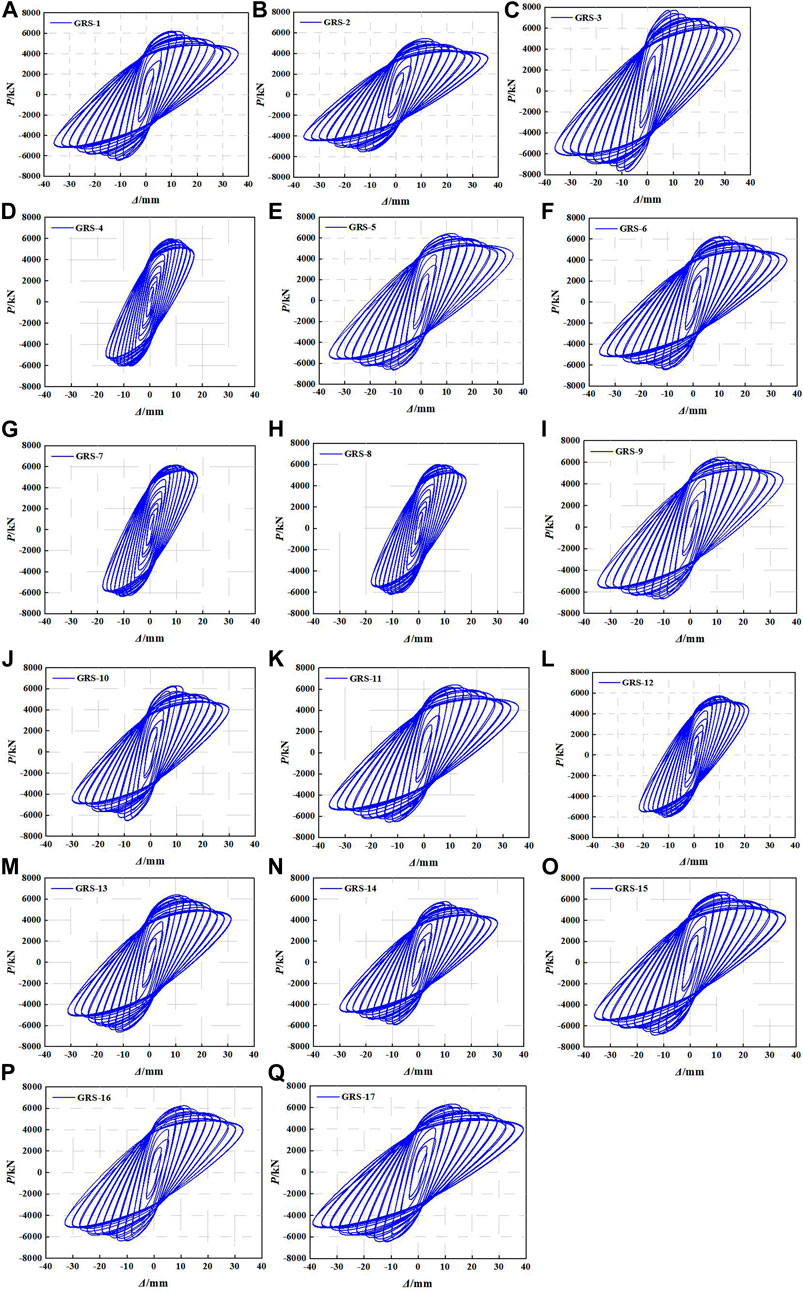
FIGURE 10. The hysteretic curves obtained by simulation: (A) GRS-1; (B) GRS-2; (C) GRS-3; (D) GRS-4; (E) GRS-5; (F) GRS-6; (G) GRS-7; (H) GRS-8; (I) GRS-9; (J) GRS-10; (K) GRS-11; (L) GRS-12; (M) GRS-13; (N) GRS-14; (O) GRS-15; (P) GRS-16; and (Q) GRS-17.
By observing the hysteresis curves shown in Figure 10, it can be found that the axial compression ratio has a great influence on the hysteresis curves of GRS composite columns. The bearing capacity and ultimate displacement of GRS composite columns increase with the increase of axial compression ratio, and the ability of plastic deformation is strengthened. The hysteresis curve of GRS composite column is fuller with a lager axial compression ratio, that is, the energy dissipation capacity of the specimen is stronger.
Skeleton Curves
The destruction of a specimen can be divided into three stages, including the initial cracking stage, crack development and yield stage, and failure stage (Zhang et al., 2019). Skeleton curves refer to the envelope obtained by connecting the peak points on the hysteresis curve loops of each loading cycle, which is an important basis for determining the characteristic points in the restoring force model. The comparisons of the skeleton curves for GRS composite columns with different controlled parameters are shown in Figure 11.
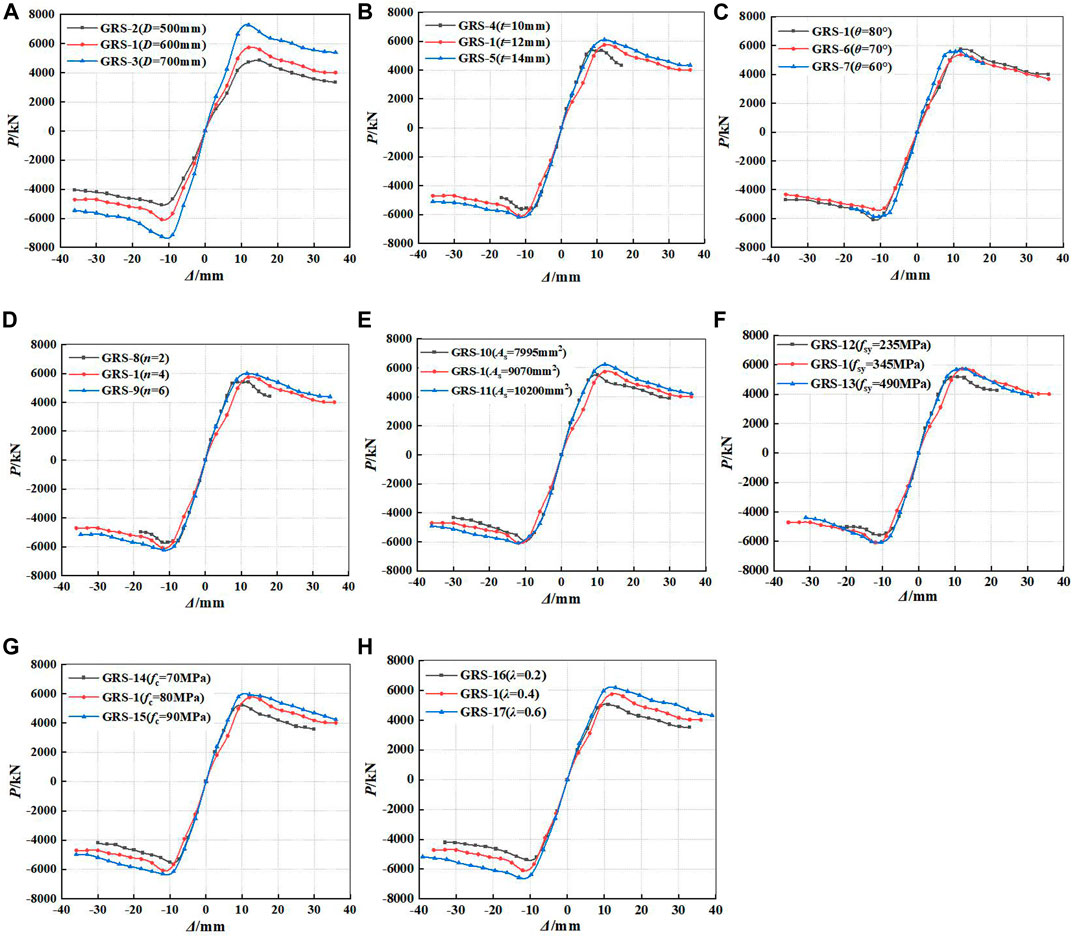
FIGURE 11. Comparisons of skeleton curves: (A) different diameters of GFRP tube; (B) different thicknesses of GFRP tube; (C) different fiber winding angles; (D) different numbers of fiber winding layers; (E) different areas of encased steel; (F) different strengths of encased steel; (G) different compressive strengths of RPC; and (H) different axial compression ratios.
It can be seen from Figure 11 that the skeleton curve trends of 17 GRS composite columns under low cyclic horizontal loading are basically similar. At the elastic stage, the ascending branch of the curve is nearly a straight line, and the skeleton curves of each specimen are basically coincident. The deformation of GRS composite columns can be completely restored after canceling the displacement loading. At the elastic-plastic stage, the slopes of the curves decrease continuously, and the irreversible plastic damage of RPC occurs and accumulates continuously, which indicates that the irreversible plastic deformations of the composite columns begin to occur. After entering the plastic stage, the steel and RPC reach the ultimate strength, and the GFRP tube begins to play a constraint role. Therefore, the skeleton curves of the GRS composite columns appear at the descending branch, but the decline magnitude is relatively small, which results in large displacements. All specimens show excellent loading capacity and ductility.
It can be seen from Figure 11 that the peak load of the skeleton curve increases with the increase of the diameter of GFRP tube (D), thickness of GFRP tube (t), number of fiber winding layers (n), the area and yield strength of encased steel (As, fsy), axial compression ratio (λ), and compressive strength of RPC (fc). Among them, the diameter of GFRP tube (D), compressive strength of RPC (fc) and axial compression ratio (λ) have more significant effects on the peak load of skeleton curves of GRS composite columns.
Degradation of Stiffness for GRS Columns
In this study, the stiffness of GRS columns (Ki) is represented by secant stiffness, which is defined in Eq. 12 (JGJ 101-96, 1997).
where
With the increase of horizontal displacement, the secant stiffness of specimens decreases, which is called stiffness degradation. When the stiffness degradation is more obvious, the plastic damage accumulated by GRS columns is more serious, which indicates that the seismic behavior of GRS columns is poor. The relationship curves of Ki and horizontal displacement of GRS columns under different parameters are shown in Figure 12. It can be seen from Figure 12 that the stiffness degradation trends of 17 GRS columns are similar, and the secant stiffness decreases with the increase of horizontal displacement. What is more, the trend gradually slows down, namely, the slope of the curves decreases gradually. The results show that the diameter of GFRP tube (D), the yield strength of encased steel (fsy), and axial compression ratio (λ) have a significant effect on the secant stiffness of specimens. With the increase of D, fsy, and λ, the stiffness degradation phenomenon slows down.
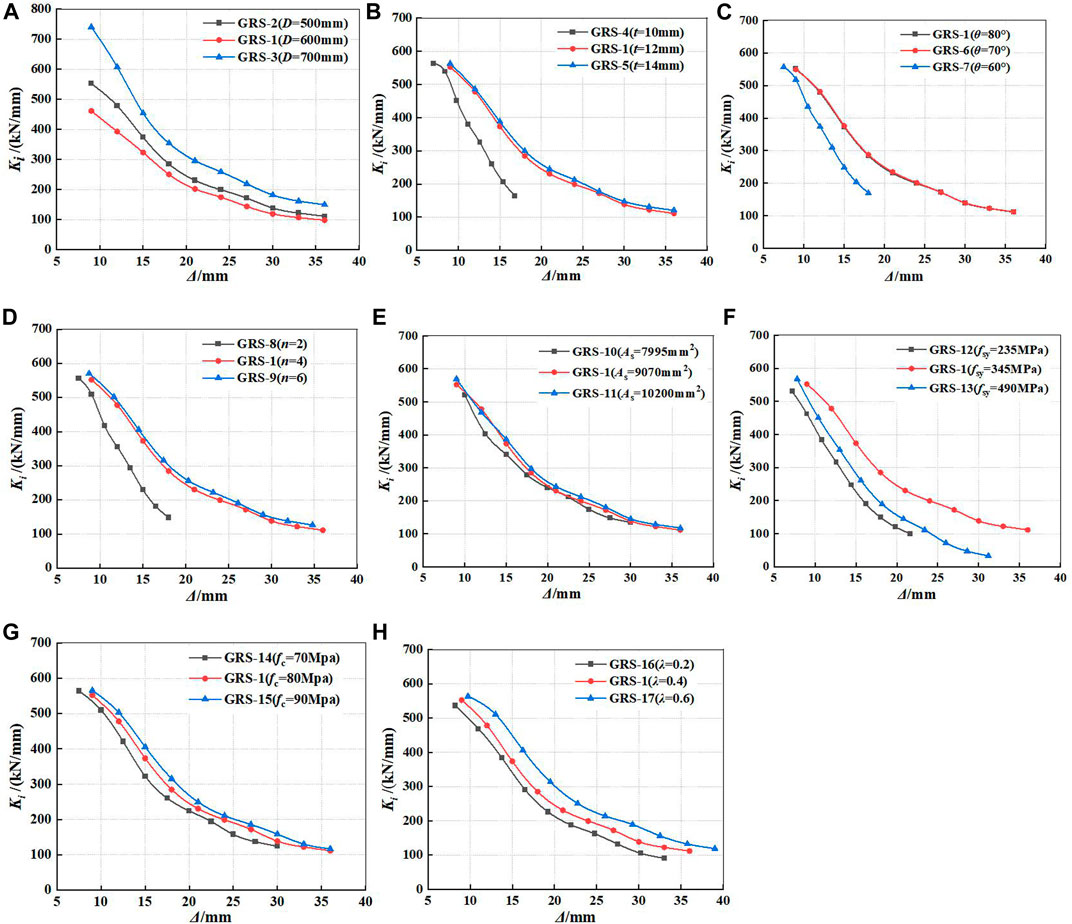
FIGURE 12. Comparisons of secant stiffness degradations for GRS columns: (A) different diameters of GFRP tube; (B) different thicknesses of GFRP tube; (C) different fiber winding angles; (D) different numbers of fiber winding layers; (E) different areas of encased steel; (F) different strengths of encased steel; (G) different compressive strengths of RPC; and (H) different axial compression ratios.
Energy Dissipation Capacity
The equivalent viscous damping coefficient(E), an index to evaluate the seismic behavior of GRS columns, can indicate energy dissipation capacity, and the calculation formula is shown in Eq. 13 (JGJ101-96, 1997). The specific physical meaning can be shown in Supplementary Figure S3. The curves of relationship between equivalent viscous damping coefficient and horizontal displacement of GRS columns under different parameters are shown in Figure 13.
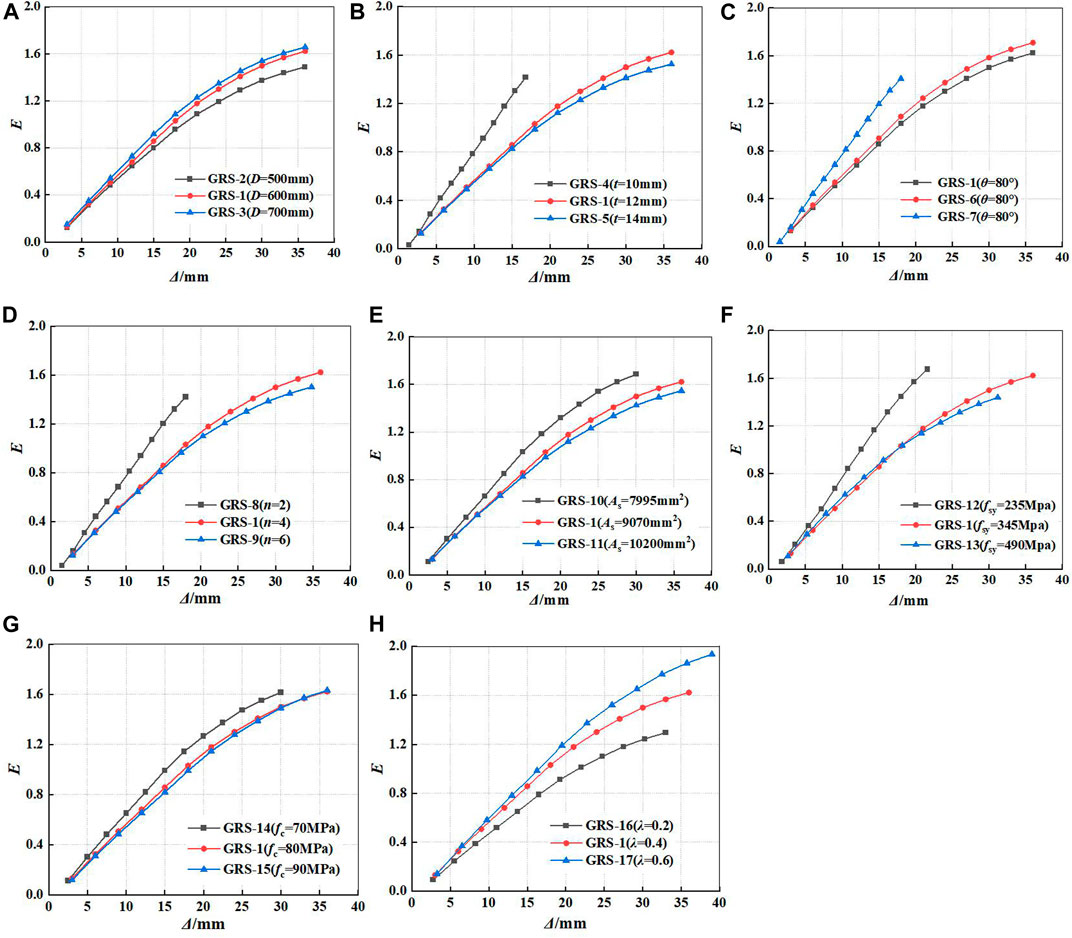
FIGURE 13. Comparisons of energy dissipation capacity for GRS columns: (A) different diameters of GFRP tube; (B) different thicknesses of GFRP tube; (C) different fiber winding angles; (D) different numbers of fiber winding layers; (E) different areas of encased steel; (F) different strengths of encased steel; (G) different compressive strengths of RPC; and (H) different axial compression ratios.
It can be seen from Figure 13 that the trend of relationship curves between the equivalent viscous damping coefficient and the horizontal displacement of specimens are basically the same, and the equivalent viscous damping coefficient is positively correlated with the horizontal displacement. At elastic stage, the equivalent viscous damping coefficient of GRS column is small. When the specimens enter in the plastic stage, the growth trend of equivalent viscous damping coefficient slows down, but it still increases steadily. The viscos damping coefficient of GFRP tube steel-encased concrete columns can reach about 0.60 (Wang, 2019), and the viscos damping coefficient of RPC columns can reach about 0.15 (Shan et al., 2021). The viscous damping coefficient of GRS columns can reach above 1.2, which is superior to the GFRP tube steel-encased concrete columns and RPC columns. GRS composite column has excellent energy dissipation capacity.
It can be seen from Figure 13 that the equivalent viscous damping coefficient of specimens increases with the increase of the diameter of GFRP tube and axial compression ratio, and the axial compression ratio has a significantly important effect on improving the energy dissipation capacity of specimens. With the increase of the area of encased steel (As) and strength of encased steel (fsy), the equivalent viscous damping coefficient of GRS columns gradually decreases.
Establishment of Restoring Force Model for GRS Columns
The ability of structure to resist deformation under external load is called restoring force, and the relationship between restoring force and deformation is called restoring force characteristics. Due that the restoring force characteristic curves under earthquake action is complex in practice, it can be generally simplified as a restoring force model for structural seismic research. The restoring force model (RFM) is generally composed of skeleton curve and hysteresis rule (Wang et al., 2015). Many different restoring force models have been proposed by scholars through a large number of studies, which are mainly divided into two categories, including the polygonal hysteretic model (PHM) and smooth hysteretic model (SHM) (Zheng and Ji, 2008a; Zheng and Ji, 2008b). In this study, the restoring force model of GRS composite columns is established based on PHM.
Skeleton Curve
The dimensionless trilinear model is adopted as the restoring force model of skeleton curves in this study. The dimensionless load and displacement of GRS specimens are summarized in Table 3. The trilinear theoretical model of skeleton curves for GRS composite columns is shown in Supplementary Figure S4. Where point A, point B, and point C represent the yield point, peak point, and ultimate point of the trilinear skeleton curve model under positive loading (PL), respectively, and point D, point E, and point F represent the yield point, peak point, and ultimate point of the trilinear skeleton curve model under negative loading (NL), respectively. The calculation formulas of each segment for the trilinear skeleton curve model are shown from Eq. 14 to Eq. 19, which can be linearly fitted by Origin software.
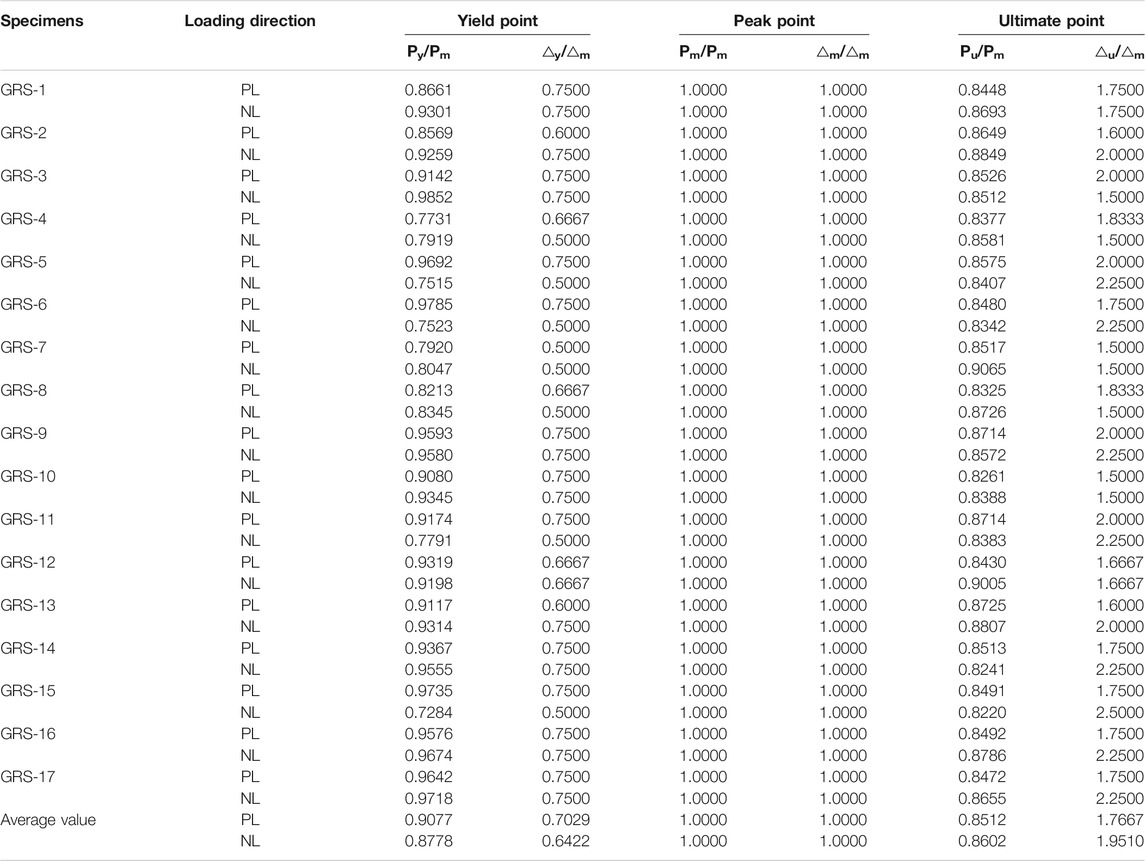
TABLE 3. Dimensionless load and displacement of skeleton curves for specimens.
Unloading Stiffness
In this study, the stiffness of 17 GRS composite columns can be analyzed by regression, and the expression of stiffness degradation can be obtained, as shown in Eq. 20.
The regression analysis process is shown in Supplementary Figure S5. Where,
Hysteretic Rule
The hysteretic rule of GRS columns is established according to the trilinear skeleton curve and stiffness degradation regularity. The restoring force model is shown in Supplementary Figure S6. The description can be illustrated as follows:
1) Point A and point D represent yield points under positive and negative loading, respectively. Point B and point E are peak points under positive and negative loading, respectively. Point C and point F are ultimate points under positive and negative loading, respectively. Segment DOA is the elastic stage. Segment AB and DE are positive and negative yielding segments, respectively. Segment BC and EF are positive and negative failure segments, respectively.
2) At the elastic stage, the positive loading curve is carried out along the segment OA of skeleton model, and the negative loading curve is carried out along the segment OD of skeleton model. When unloaded in OA and OD segments, the unloading stiffness remain unchanged, which is the initial stiffness, and the curve returns to the original point along the original route.
3) There exist softening points in the hysteresis curve, which takes 65% of the load value before unloading. In Supplementary Figure S6, Point M, H, P, T, U, and R represent softening points.
4) After yielding, the loading path directs from yield point A to peak point B along the skeleton curve. When it is unloaded from point G on the skeleton curve, it is carried out along the path of G–H.
5) After it is unloaded to point H, the loading path directs from the point H to point L (such as H–L) along the loading direction. When it is reversely loaded from point L, it is carried out along the path of L–M and then back to the point G.
6) When it is loaded again to the next displacement value, the path directly moves from the previous maximum displacement value of hysteresis loop to the corresponding point of next displacement value on the skeleton curve, namely, the path of G–B.
7) When it is loaded beyond the peak point B, the path advances along the skeleton curve B–C. The unloading stiffness can be calculated according to Eq. 20. Positive loading and negative loading keep continued until the GRS column fails.
Comparisons of the Results Between FEM and RFM
The comparisons of the skeleton curves and hysteretic curves between the finite element model (FEM) and restoring force model (RFM) are shown in Figures14, 15, respectively. It can be seen from Figure 14 that the calculated curves of RFM are in good agreement with the simulated curves of FEM, which proves that the hysteretic characteristics of GRS columns can be better reflected by the trilinear restoring force model proposed in this study. So, the skeleton curves and hysteretic curves of GRS columns can be determined by the restoring force model proposed in this study. The curves predicted by RFM can also characterize the variation trends between load and displacement of GRS columns.
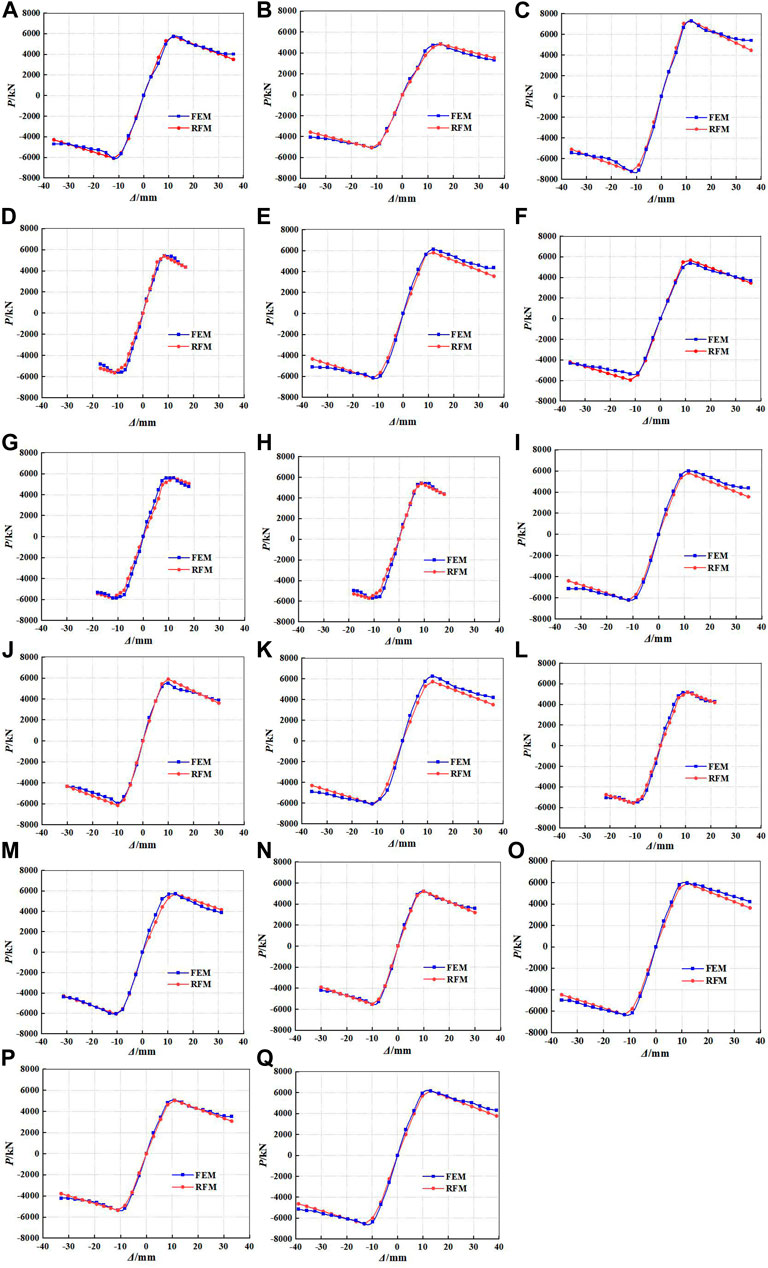
FIGURE 14. Comparisons of skeleton curves between RFM and FEM: (A) GRS-1; (B) GRS-2; (C) GRS-3; (D) GRS-4; (E) GRS-5; (F) GRS-6; (G) GRS-7; (H) GRS-8; (I) GRS-9; (J) GRS-10; (K) GRS-11; (L) GRS-12; (M) GRS-13; (N) GRS-14; (O) GRS-15; (P) GRS-16; and (Q) GRS-17.
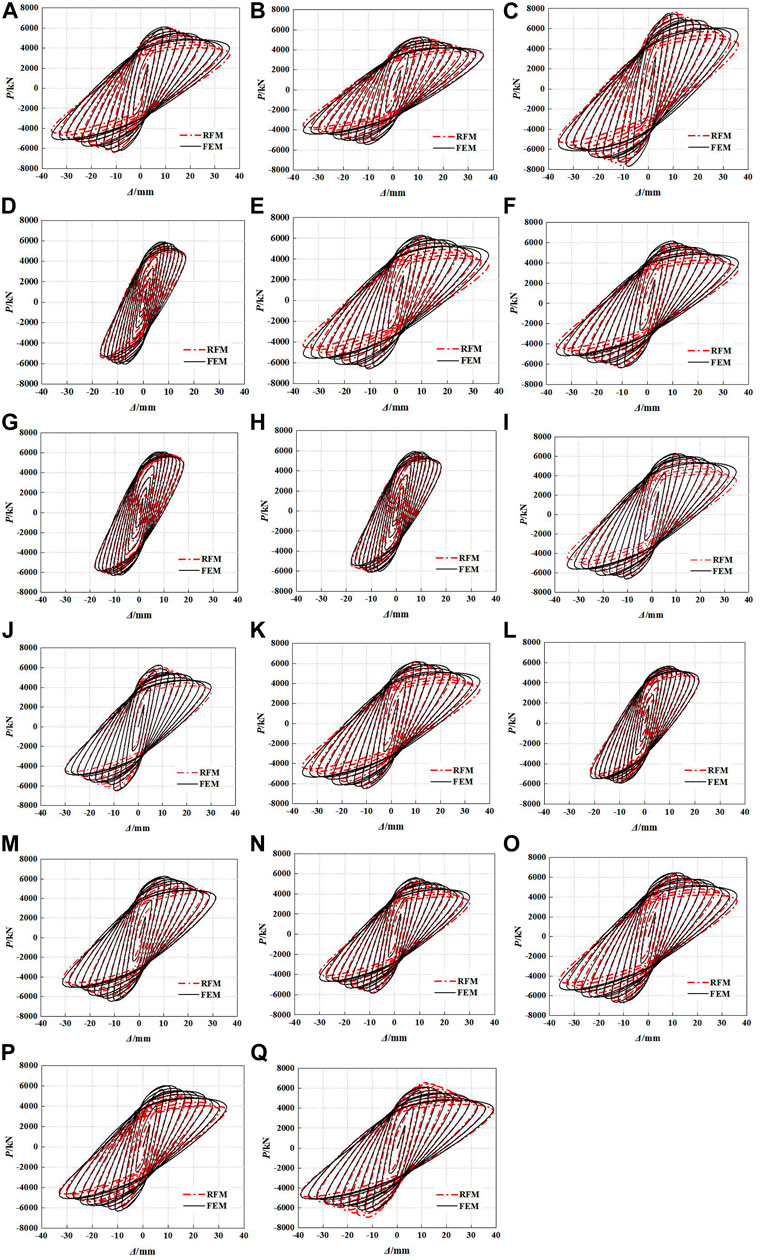
FIGURE 15. Comparisons of hysteretic curves between RFM and FEM: (A) GRS-1; (B) GRS-2; (C) GRS-3; (D) GRS-4; (E) GRS-5; (F) GRS-6; (G) GRS-7; (H) GRS-8; (I) GRS-9; (J) GRS-10; (K) GRS-11; (L) GRS-12; (M) GRS-13; (N) GRS-14; (O) GRS-15; (P) GRS-16; and (Q) GRS-17.
Conclusion
In order to study the seismic behavior of GFRP tube reactive powder concrete composite columns with encased steel (GRS), the numerical simulation analysis of GRS composite columns under low cyclic loading was carried out by ABAQUS finite element software. The main parameters include the diameter of GFRP tube (D), thickness of GFRP tube (t), number of fiber winding layers (n), fiber winding angle (θ), axial compression ratio (λ), compressive strength of reactive powder concrete (fc), the area of encased steel (As), and strength of encased steel (fsy). Based on the results of finite element models (FEM), the restoring force models (RFM) suitable for GRS composite columns are established. The conclusions can be drawn as follows.
1) Based on the method of displacement-graded loading, the hysteretic curves of GRS columns show a relatively full shuttle shape, which can indicate that GRS composite columns have excellent seismic behavior.
2) By observing the failure mode of GRS columns, the local bulging presents mainly at the upper part of the column base. The maximum stress of GFRP occurs at a distance above the column base, while the maximum stress of RPC and steel occurs at the column base.
3) The skeleton curves of GRS columns under low cyclic loading are mainly divided into three stages, including elastic stage, elastic-plastic stage and plastic stage. When entering the plastic stage, the steel and RPC reach the ultimate strength and GFRP tube begins to play a constraint role. Therefore, the skeleton curves appear the descending branch but the decline magnitude is relatively small, which can result in large displacements. All specimens show excellent loading capacity and ductility. The peak load of the skeleton curve increases with the increase of D, t, n, As, fsy, λ, and fc. D, fc, and λ have more significant effects on the peak load of GRS composite columns.
4) The diameter of GFRP tube (D), the yield strength of encased steel (fsy), and axial compression ratio (λ) have significant influences on the stiffness degradation of specimens. With the increase of D, fsy, and λ, the stiffness degradation slows down. The equivalent viscous damping coefficient(E) of GRS columns increases with the increase of D and λ, but E gradually decreases with the increase of As and fsy. It is found that λ has a significantly important effect on improving the energy dissipation capacity of specimens. E of GRS columns can reach above 1.2, which is superior to the GFRP tube steel-encased concrete columns and RPC columns.
5) By comparing the skeleton curves and hysteretic curves between FEM and RFM, it shows a good agreement, which can verify that the restoring force model is reasonable and feasible.
Data Availability Statement
The original contributions presented in the study are included in the article/Supplementary Material; further inquiries can be directed to the corresponding authors.
Author Contributions
JJ: writing and simulation; LH: writing and simulation; LJ: translation; HR: translation; SN: translation; ZW: translation; YL: simulation; CY: translation; and YL: translation. All authors contributed to the article and approved the submitted version.
Funding
The authors are grateful for the financial support received from the Natural Science Foundation of Heilongjiang Province (grant no. LH2020E018); Opening Fund for Key Laboratory of The Ministry of Education for Structural Disaster and Control of Harbin Institute of Technology (grant no. HITCE201908); Scientific Research Fund of Institute of Engineering Mechanics, China Earthquake Administration (grant no. 2020D07); the Social Science Foundation of Hebei Province (grant no. HB20GL055); and the Northeast Petroleum University Guided Innovation Fund (grant no.2020YDL-02).
Conflict of Interest
The authors declare that the research was conducted in the absence of any commercial or financial relationships that could be construed as a potential conflict of interest.
Publisher’s Note
All claims expressed in this article are solely those of the authors and do not necessarily represent those of their affiliated organizations, or those of the publisher, the editors, and the reviewers. Any product that may be evaluated in this article, or claim that may be made by its manufacturer, is not guaranteed or endorsed by the publisher.
Supplementary Material
The Supplementary Material for this article can be found online at: https://www.frontiersin.org/articles/10.3389/fmats.2021.793392/full#supplementary-material
References
Ahmad, J., Yu, T., and Hadi, M. N. S. (2021). Behavior of GFRP Bar Reinforced Geopolymer concrete Filled GFRP Tube Columns under Different Loading Conditions. Structures 33, 1633–1644. doi:10.1016/j.istruc.2021.05.023
Almahakeri, M., Moore, I. D., and Fam, A. (2016). Numerical Study of Longitudinal Bending in Buried GFRP Pipes Subjected to Lateral Earth Movements. J. Pipeline Syst. Eng. 08, 04016012. doi:10.1061/(asce)ps.1949-1204.0000237
Cao, S., Hou, X., and Rong, Q. (2020). Dynamic Compressive Properties of Reactive Powder concrete at High Temperature: a Review. Cement and Concrete Composites 110, 103568. doi:10.1016/j.cemconcomp.2020.103568
Chen, C., Wang, C., and Sun, H. (2014). Experimental Study on Seismic Behavior of Full Encased Steel-Concrete Composite Columns. J. Struct. Eng. 140, 04014024. doi:10.1061/(asce)st.1943-541x.0000951
Feng, P., Wang, J., Wang, Y., Loughery, D., and Niu, D. (2014). Effects of Corrosive Environments on Properties of Pultruded GFRP Plates. Composites B: Eng. 67, 427–433. doi:10.1016/j.compositesb.2014.08.021
GB 50010-2010 (2010). Code for Design of Concrete Structures. Beijing: China Construction Industry Press.
Han, L. H. (2007). Concrete Filled Steel Tube Structures: Theory and Practice. Beijing: Science Press.
Hwang, H. J., Eom, T. S., Park, H. G., and Lee, S. H. (2016). Axial Load and Cyclic Lateral Load Tests for Composite Columns with Steel Angles. J. Struct. Eng. 142, 1–11. doi:10.1061/(ASCE)ST.1943-541X.0001452
JGJ 101-96 (1997). Specification of Testing Methods for Earthquake Resistant Building. Beijing: China.
Ji, J., Wang, Y., Chen, X. K., Jiang, L. Q., Zhang, W. F., et al. (2017). Analysis of Axial Compression Behavior of Strength-Gradient Composite Columns with Built-In High-Strength concrete Filled Steel Tube. J. Northeast. Pet. Univ. 05, 107–116+11. doi:10.3969/j.issn.2095-4107.2017.05.012
Jiang, L. Q., Song, H. Y., Ji, J., Zhang, Y. F., Teng, Z. C., et al. (2021). Axial Compression Behavior of GFRP Tube Reactive Powder concrete Composite Short Columns with Encased Steel. J. Northeast. Pet. Univ. 03, 111–122+11. doi:10.3969/j.issn.2095-4107.2021.03.011
Ju, Y. Z., Wang, D. H., and Bai, J. F. (2013). Seismic Performance of Reactive Powder concrete Columns. J. Harbin Inst. Technol. 08, 111–116. doi:10.11918/j.issn.0367-6234.2013.08.018
Li, J. H., Wang, X. T., Xue, J. Y., and Zhao, H. T. (2007). Experimental Study on the Performance of Steel Reinforced High-Strength concrete Columns under Low Cyclic Reversed Loading. China Civil Eng. J. 07, 11–18. doi:10.3321/j.issn:1000-131x.2007.07.003
Liu, W. (2005). Research on Mechanism of Concrete-filled Steel Tubes Subjected to Local Compression. Fuzhou: Fuzhou University.
Mander, J. B., Priestley, M. J. N., and Park, R. (1988). Theoretical Stress‐Strain Model for Confined Concrete. J. Struct. Eng. 114, 1804–1826. doi:10.1061/(asce)0733-9445(1988)114:8(1804)
Pagoulatou, M., Sheehan, T., Dai, X. H., and Lam, D. (2014). Finite Element Analysis on the Capacity of Circular concrete-filled Double-Skin Steel Tubular (CFDST) Stub Columns. Eng. Structures 72, 102–112. doi:10.1016/j.engstruct.2014.04.039
Shan, B., Liu, G., Li, T. Y., Liu, F. C., Liu, Z., and Xiao, Y. (2021). Experimental Research on Seismic Behavior of concrete-filled Reactive Powder concrete Tubular Columns. Eng. Structures 233, 111921. doi:10.1016/j.engstruct.2021.111921
Shan, B., Shan, Y., Liu, F. C., and Tong, G. Q. (2020). Experimental Research on Seismic Behavior of concrete-filled Reactive Powder concrete Tube. J. Civ. Environ. Eng. 04, 94–104. doi:10.11835/j.issn.2096-6717.2020.028
Shan, B., Xiao, Y., and Guo, Y. (2006). Residual Performance of FRP-Retrofitted RC Columns after Being Subjected to Cyclic Loading Damage. J. Compos. Constr. 10, 304–312. doi:10.1061/(asce)1090-0268(2006)10:4(304)
Teng, J. G., Lam, L., Lin, G., Lu, J. Y., and Xiao, Q. G. (2015). Numerical Simulation of FRP-Jacketed RC Columns Subjected to Cyclic and Seismic Loading. J. Compos. Constr. 20, 1–13. doi:10.1061/(ASCE)CC.1943-5614.0000584
Teng, J. G., Yu, T., Wong, Y. L., and Dong, S. L. (2007). Hybrid FRP-concrete-steel Tubular Columns: Concept and Behavior. Construction Building Mater. 21, 846–854. doi:10.1016/j.conbuildmat.2006.06.017
Wang, D. H., Ju, Y. Z., and Zheng, W. Z. (2015). Experimental Study on Restoring Force Model of Reinforced Reactive Powder concrete Columns. J. Cent. South. Univ.(Sci. Technol. 09, 3454–3460. doi:10.11817/j.issn.1672-7207.2015.09.039
Wang, S. Q. (2019). Study on Seismic Performance of Steel-Encased Concrete Filled GFRP Tubes Bending Members. Shenyang: Shenyang Jianzhu University.
Xiao, J. Z., and Huang, Y. J. (2012). On the Seismic Behavior and Damage Assessment of Recycled Aggregate concrete Filled GFRP Tube Column. China Civil Eng. J. 11, 112–120. doi:10.15951/j.tmgcxb.2012.11.018
Yazıcı, H., Yardımcı, M. Y., Aydın, S., and Karabulut, A. Ş. (2009). Mechanical Properties of Reactive Powder concrete Containing mineral Admixtures under Different Curing Regimes. Construction Building Mater. 23, 1223–1231. doi:10.1016/j.conbuildmat.2008.08.003
Zhang, Y., Ma, G., Du, S., Liu, Y., Li, Z., and Chen, Y. F. (2019). Hysteretic Behavior and Restoring Force Model of Reinforced Glazed Hollow Bead Insulation Concrete (GIC) Columns. KSCE J. Civ. Eng. 23, 3049–3065. doi:10.1007/s12205-019-2089-4
Zheng, W., and Ji, J. (2008a). Dynamic Performance of Angle-Steel concrete Columns under Low Cyclic Loading-I: Experimental Study. Earthq. Eng. Eng. Vib. 7, 67–75. doi:10.1007/s11803-008-0768-0
Zheng, W., and Ji, J. (2008b). Dynamic Performance of Angle-Steel concrete Columns under Low Cyclic Loading-II: Parametric Study. Earthq. Eng. Eng. Vib. 7, 137–146. doi:10.1007/s11803-008-0793-z
Zhou, X. H., Liu, J. P., and Zhang, S. M. (2010b). Seismic Behavior and Design Method of Steel Tube Confined Reinforced Concrete Frame Short Columns. J. Disaster Prev. Mitigation Eng. S1, 1–5. doi:10.13409/j.cnki.jdpme.2010.s1.077
Zhou, X. H., Liu, J. P., and Zhang, S. M. (2010a). Seismic Behavior and Strength of Tubed SRC Beam-Columns Filled with High Strength concrete. China Civil Eng. J. 09, 1–11. doi:10.15951/j.tmgcxb.2010.09.010
Keywords: reactive powder concrete, glass fiber–reinforced polymer tube, composite columns, seismic behavior, restoring force model
Citation: Ji J, He L, Jiang L, Ren H, Ni S, Wang Z, Li Y, Yu C and Lin Y (2021) Seismic Behavior of GFRP Tube Reactive Powder Concrete Composite Columns With Encased Steel. Front. Mater. 8:793392. doi: 10.3389/fmats.2021.793392
Received: 12 October 2021; Accepted: 08 November 2021;
Published: 06 December 2021.
Edited by:
Huaping Wang, Lanzhou University, ChinaReviewed by:
Xiaodong Wang, Harbin University of Science and Technology, ChinaHaiyan Li, Shijiazhuang Tiedao University, China
Copyright © 2021 Ji, He, Jiang, Ren, Ni, Wang, Li, Yu and Lin. This is an open-access article distributed under the terms of the Creative Commons Attribution License (CC BY). The use, distribution or reproduction in other forums is permitted, provided the original author(s) and the copyright owner(s) are credited and that the original publication in this journal is cited, in accordance with accepted academic practice. No use, distribution or reproduction is permitted which does not comply with these terms.
*Correspondence: Hongguo Ren, renhongguo771126@163.com; Zizhen Wang, zizhenwang1@163.com