Assessment of mariculture-derived microplastic pollution in Dapeng Cove, China
 Yong Xu
 Shilin Li
 Jianlei Chen
 Zhengguo Cui1,2*
- 1Yellow Sea Fisheries Research Institute, Chinese Academy of Fishery Sciences, Qingdao, China
- 2National Key Laboratory of Mariculture Biobreeding and Sustainable Goods, Yellow Sea Fisheries Research Institute, Chinese Academy of Fishery Sciences, Qingdao, China
- 3National Engineering Research Center For Marine Aquaculture, Zhejiang Ocean University, Zhoushan, China
Marine microplastic pollution just as ocean acidification and greenhouse effect has attracted much environmental concern and become a hot research subject for marine researchers globally. The abundances, distribution, and characteristics of microplastics in surface seawater and sediments from Dapeng Cove were investigated in this study. The results indicated that the abundance of microplastics was 1333 ± 773 items/m3 in surface seawater and 1381 ± 1021 items/kg in sediments, showing a medium microplastic pollution level compared with other sea areas. Fibers were the prevailing shapes of microplastics in both surface seawater and sediments, representing 65.4% and 52.1% of the total microplastic numbers, respectively. Moreover, small microplastics (<1mm) in surface seawater and sediments accounted for 69.6% and 62.2%, respectively. According to the identification by Fourier Transform Infrared microscope (micro-FTIR), the main composition of microplastics in surface seawater and sediments was polyethylene (PE) or polypropylene (PP). It is necessary to enhance the regulation of current plastic products used in aquaculture, reduce the production and release of microplastics during the mariculture process, and develop alternatives to plastic fishing gear. The results of this study suggested that long-term mariculture development had caused the accumulation of a large amount of microplastics in water and sediments in Dapeng Cove. We constructed the first basic data of microplastics pollution about Dapeng Cove. This study will serve as a reference for further studies of the distribution and migration of microplastics in mariculture zones.
1 Introduction
Plastics have changed the human lifestyle and they have been increasingly used as the consequence of their low cost and wide adaptability. The global production of plastic is growing exponentially, resulting in plastic continuing to enter the environment (Chen et al., 2022). In 2021, the global production of plastic has reached 390.7 million tons (Plastics Europe, 2022). It was predicted that by 2025, the quantity of plastic waste will rise to about 250 million metric tons (Focardi et al., 2022). About10% of plastic produced entered the oceans and constituted 80-85% of marine litter (Auta et al., 2017). Eriksen et al. reported an estimate of more than 5.25 trillion plastic pieces weighing over 250,000 tons afloat at sea worldwide (Eriksen et al., 2014). More than 90% of these plastic pieces may suspend in the water column, remain in coastal areas, or eventually settle and accumulate in marine sediments (Harris et al., 2021).
The chemical properties of most plastics are inert and resistant to degradation, but these plastics would gradually break down into smaller particles through chemical oxidation, biological corrosion, and mechanical action such waves and wind. These larger plastics break down into tiny pieces considered as microplastics (with a size between 5 mm and 1μm in any of their dimensions) and/or nanoplastics (with a size lower than 1μm in any of their dimensions) (Lai et al., 2021). According to their sources, microplastics can be classified into primary and secondary classes (Kasmuri et al., 2022). For example, personal care products including resin pellets and exfoliators are primary microplastics(μPs) (Pourebrahimi and Pirooz, 2023). Synthetic clothing and car tires can also generate primary microplastics during use (Coyle et al., 2020). Macroplastics exposed to harsh environmental conditions (e.g., sunshine, high temperature, wind, sea waves, etc.) can evolve into secondary microplastics because of the breakdown and disintegration (Reddy and Nair, 2022). Disposable plastic bags are a significant source of secondary microplastics for their degradation resistance when exposed to seawater and sunlight (Abreu and Pedrotti, 2019). Packaging wastes, fishing ropes and netting and disposable consumer items are other important sources. Microplastics pose a worldwide problem since they are ubiquitous as stable contaminants in terrestrial and marine environments. The marine environment including seafloor, deep water and shorelines is the most frequent location where microplastics end up (Sarma et al., 2022). The microplastics are present from polar regions to the equator, from offshore to deep ocean (Coyle et al., 2020; Pourebrahimi and Pirooz, 2023), and are distributed in seawater (Yan et al., 2019; Huang et al., 2024; Mia et al., 2024), sediments (Gupta et al., 2024; Huang et al., 2024; Ou et al., 2024; Zhu et al., 2018), and marine organisms (Teng et al., 2019; Sun et al., 2024). The major sources of ocean microplastics are the break or decomposition of marine plastic waste, import of river-based and land-based waste, plastic waste from marine tourism and shipping, devices of fishing and aquaculture, atmospheric deposition and other sources (Dong et al., 2021). The weather conditions, such as wind and rain, can affect the microplastics abundances in ocean environments. During rain, the microplastics in the land can be transported into ocean via surface runoffs (Ma et al., 2020). Wind is another important means of transporting microplastics (Chen et al., 2018). Researchers have reported that typhoons increased the average concentrations of microplastics in seawater and sediments by approximately 40%, and the shapes, colors and types of microplastics were also changed (Wang et al., 2019).
Microplastics are readily ingested by marine organisms because of their small size. Ingestion of microplastics by marine organisms could block their digestive tract or feeding organs, which leads to a high satiety level and reduces feeding efficiency, and further slows growth and decreases reproductive capacity, and even causes fatality of these marine organisms. The toxicity of ingested microplastics could be increased by adsorbing hydrophobic organic additives and heavy metal contaminants. In addition, the transfer and accumulation of microplastics could occur through the food chain, which further affects the marine ecosystem dynamics (Chen et al., 2021). The food chain can be severely disturbed when microplastics are ingested by smaller marine species (e.g., zooplanktons), then pass on to secondary consumers (e.g., large fishes) and ultimately tertiary consumers (e.g., humans) (Al Mamun et al., 2023). Therefore, the consumption of aquatic products is the main source of human exposure to microplastics (Zhou et al., 2024). Undoubtedly, the intensification of microplastic pollution in aquaculture environments have been a significant problem, as it causes food safety, the ecology risks and affects the sustainable development of fisheries.
Aquaculture products are an important source of high quality protein for humans (Wu et al., 2022). In the aquaculture process, plastics are used extensively, such as fishing nets, fishing lines, cages and ropes (Zhang et al., 2021). When they are used and discarded, these devices can release microplastics into surrounding environments. In addition, aquaculture generally involves various of human activities, which bring large amounts of microplastic pollution. It shows that the concentration of microplastics in aquaculture environments is generally higher than in surrounding environments (Chen et al., 2018). Mariculture played an important role in contributing to sedimentary microplastics of Sanggou Bay, approximately 57.72% of microplastics in surface sediments derived from mariculture plastic facilities (Sui et al., 2020). Chen et al. investigated the abundance and distribution of microplastics in Xiangshan Bay and the results indicated that mariculture-derived microplastics made up 55.7% in seawater and 36.8% in sediments of the total microplastic numbers, respectively (Chen et al., 2018). These geographical and hydrological characteristics make Dapeng Cove a favorable area for mariculture activities, which is a Class II mariculture area in the offshore of Guangdong Province. There are about 3,300 culture cages for fish farming in Dapeng Cove with an approximate area of 40 hm2, mainly for bream, bass, pomfret, and grouper farming, with production of approximately 350 tons/year; the area of raft cultures for oyster farming in Dapeng Cove is about 100 hm2, majorly for Pacific oyster farming with production of about 1100 tons/year (Tian et al., 2012). However, studies on the microplastic pollution in Dapeng Cove are still limited. The objectives of this study are to investigate the abundance, spatial distribution, and properties of microplastics in surface seawater and sediments around Dapeng Cove; and to explore the sources and factors affecting the microplastic pollution related to mariculture. Our results can provide important information to support mariculture management strategies and promote the sustainable and healthy development of mariculture.
2 Materials and methods
2.1 Study area description
As shown in Figure 1, the total area and average depth of Dapeng Cove is approximately 14 km2 and 7 m, respectively. Dapeng Cove is a semi-enclosed epicontinental sea on the southwest side of Daya Bay. The sampling events in Dapeng Cove were conducted in August 2017 (Figure 2). Surface seawater samples and sediment samples were collected from 16 sampled sites in Dapeng Cove. Meanwhile, according to the function of the sample collection sites, the sources of collected samples could be divided into cage farming area (S2), oyster farming area (S3, S3a), and fish farming area (Yu01, Yu02, Yu03), etc.

Figure 1 Sampling sites in Dapeng Cove.
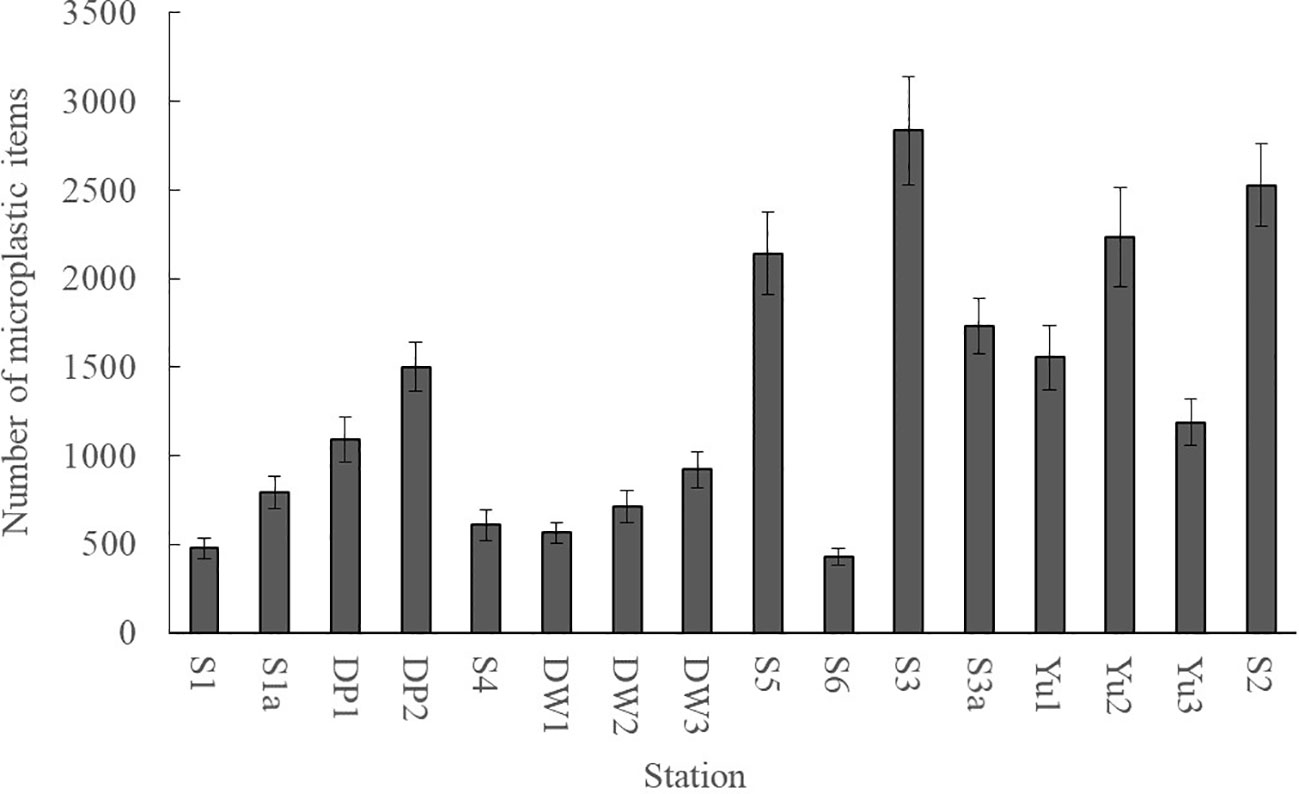
Figure 2 The microplastic abundances in seawater from Dapeng Cove.
2.2 Sampling and processing of water samples and sediment
20 L of the surface seawater sample was collected from Dapeng Cove. Water samples were collected in three replicates at a depth of approximately 0.5 m-1m below the surface by 2.5 liter water sampler. The water samples were first filtered by a stainless steel sieve of 5mm in diameter and then passed through 32µm (500 mesh) in diameter, the samples on the 32µm sieve were washed with isopropanol (50%) into a 100mL brown glass bottle (Zhu et al., 2018; Feng et al., 2023). The water sampler and sieve were pre-rinsed with distilled water and cleaning solution and rinsed three to four times with sample water before filling.
A total of 48 sediment samples were collected from 16 sampling sites, using A Van Veen grab (HYDRO-BIOS, Germany).After sampling, the top 0–2 cm of approximately 500 g weight of surface sediment was taken using a stainless-steel spatula. Samples were of uniform size and were stored in fresh, sealable plastic bags (Gupta et al., 2024; Mia et al., 2024).
2.3 Isolation of microplastics from surface seawater
Then, 20 mL of the above filtrate was transferred into a 100 mL high beaker, which was subjected to be added a mixture of 30% H2O2 and 65% HNO3 in a 1:3 v/v ratio to digest until the digestion solution became clear (Al Nahian et al., 2023). Finally, saturated sodium chloride solution was added into the above clear solution, which was allowed to stand overnight. And then, the collected suspension was filtered using a vacuum filtration, washed by ultrapure water, and the cellulose acetate membranes (pore size: 0.45 µm) were collected. It was later stored for microscopic analysis using a microscope (Olympus BX-51, Japan).The microplastic samples from the filters were placed in sterile, dry Petri plates with lids and stored at room temperature (25°C) in a desiccator (Nawar et al., 2023).
2.4 Isolation of microplastics from sediments
Firstly, the sediment samples were placed in a drying oven at 70°C until the samples had dried out. An aliquot of 25 g dry sediments were weighed out and put into 250 mL NaCl solution (1.6 g/cm3) with continuously stirring for 2 h, aiming at extracting the relatively light plastic particles from sediment (Zhu et al., 2018; Rakib et al., 2021). After aging for 6 h, the supernatant was poured into a 30 µm sieve. The residue in the sieve was transferred into a pre-cleaned glass beaker, which was subjected to wet peroxide oxidation using 30% H2O2 in the presence of a 0.05 M Fe(II) solution to digest organic matter (Zobkov and Esiukova, 2017). The beaker was then heated on a hot plate or water bath ( 75°C) to ensure complete digestion of organic matter. Finally, the microplastic particles were extracted from the above mixture using a saturated NaCl solution (1.2 g/cm3) for density separation (Nawar et al., 2023). The obtained microplastics were observed using a microscope (Olympus BX-51, Japan).
2.5 Fourier Transform Infrared microscope and electron microscopic morphological analyses
For precise and detailed visual inspection, an Olympus BX-51 microscope was used for in-depth color and morphological analysis of the extracted microplastic samples. This step was crucial for the initial characterization of the samples. The composition of suspected plastics was identified by Fourier Transform Infrared microscope (micro-FTIR; Thermo Fisher Nicolet iN10, USA). The FTIR spectrum of each plastic item was recorded between 4000 and 650 cm−1 at a resolution of 8 cm−1 using a collection time of 3 s and with 16 co-scans. Each spectrum was compared with the OMNIC standard spectral library. When the matching degree is higher than 70%, suspected particles can be identified as microplastics. The actual number of microplastics was recalculated based on the micro-FTIR analysis (Sui et al., 2020).
2.6 Pollution control and quality assurance
In this study, meticulous and comprehensive quality control procedures were employed for the collection and laboratory analysis of samples. Standard protocols were strictly adhered to throughout the experimental process. Stringent measures were implemented to prevent contamination during sample collection, transportation, and processing, ensuring the purity and accuracy of the samples. Specifically, cotton laboratory apron jackets and nitrile gloves were carefully chosen during sample collection to minimize the potential for external microplastic contamination, thereby preserving the originality and integrity of the samples. All equipment utilized was thoroughly rinsed with Milli-Q water three times. The density separation solution (NaCl) was first filtered through a nitrocellulose filter (0.45μm) before use. Under investigation, if any of the fibers were detected in the sample filter papers, they were carefully excluded from the final count of MPs data at each location. Each sample was securely wrapped in aluminum foil when no analyzed. The microscope was covered with a cloth when not in use and wiped with a paper towel containing isopropyl alcohol to minimize airborne contamination risks. Additionally, periodic verification and calibration of the microscope ensured optimal equipment performance consistency. This ultimately guaranteed accurate and reliable results for sediment sample collection and analysis (Rathore et al., 2023).
2.7 Statistical analysis
The statistical analyses were conducted using Excel (Microsoft Corporation, 2015) and SPSS software (IBM Corp., 2020). The abundance of MPs in sediments was precisely quantified and normalized, and finally presented as items/kg to ensure the comparability and consistency of the data. Meanwhile, in order to fully characterize the distribution of MPs, we calculated descriptive statistics including maximum, mean and standard deviation, which enable us to deeply understand the distribution pattern of MPs in sediments and their degree of variability.
3 Results and discussion
3.1 Microplastic abundances in Dapeng Cove
3.1.1 Microplastic abundances in seawater
The experimental data were data which have subtracted the control group data. The abundance of microplastic in surface seawater was 431~2858 items/m3 and the mean abundance was 1333 ± 773 items/m3 in Dapeng Cove. The microplastics exhibited the highest abundance in the oyster farming area (S3) and the lowest abundance at the mouth of Dapeng Cove Bay (S1) (Figure 2). The spatial variance of microplastic abundance in the seawater was high from Dapeng Cove: the mean abundance of microplastics in the oyster farming area (S3, S3a) was 2284 ± 680 items/m3; the mean abundance of microplastics in the fish farming area (Yu01, Yu02, Yu03) was 1659 ± 431items/m3; the mean abundance of microplastics in the cage farming area (S2) was 2526 ± 239 items/m3; the mean abundance of microplastics in surface seawater of other sampled sites was 925 ± 435 items/m3. The results in literature indicated that mariculture-derived microplastics is the main source, accounting for 55.7% of the total microplastics in seawater of Xiangshan Bay (Chen et al., 2018).
The microplastic abundances of three mariculture areas in Dapeng Cove were higher than those of other sampled sites, which possessed a similar distribution of microplastics with the mariculture area in Xiangshan Bay (Chen et al., 2018). The high microplastic abundance of mariculture areas in Dapeng Cove could be associated with two aspects: (i) Dapeng Cove is characterized by different mariculture ways such as raft cultures and cage cultures. These mariculture facilities could form thousands of fine-grain microplastics under the action of waves, wind, and light, etc., which could become an important source of local microplastic pollution; (ii) studies have revealed that surface currents and wind waves are the major driving forces in the transport of marine microplastics (Iwasaki et al., 2017). There is no large river inflow along Dapeng Cove, which is relatively closed. Therefore, the microplastics from other sources are relatively limited.
Since there is no specific standard for microplastic collection, the values of the obtained microplastic abundance could be quite different and the microplastic abundance obtained using trawl is lower than that obtained using a water collector (Table 1). The microplastic abundance using a 12-V DC Teflon pump was 16.67–611.11 items/m3 in Beibu Gulf, while the microplastic abundance through trawl was 0.1-5.6 items/m3 and 0.1-4.6 items/m3 (Zhang et al., 2020). Even if the same sampling method was used, the values of microplastic abundance could vary greatly because of the different pore sizes of the filter. The microplastic abundance was 0.1-5.6 items/m3 and 0.1-4.6 items/m3 using 75 μm plankton nets and 300 μm plankton nets for sample collection in Beibu Gulf, respectively (Zhang et al., 2020).
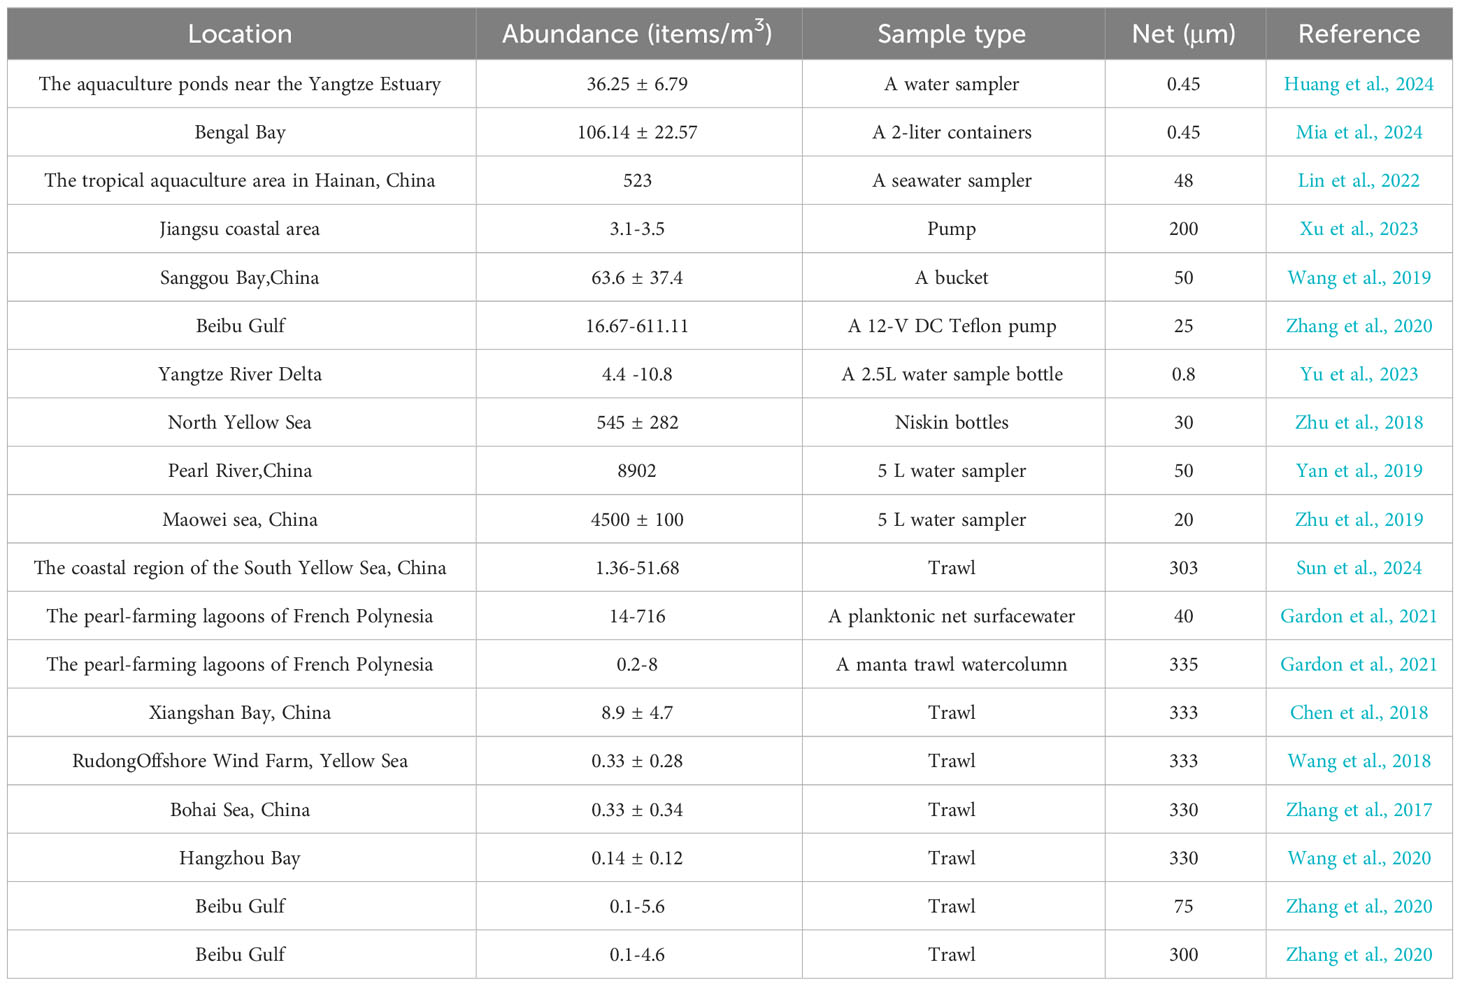
Table 1 A summary of microplastic abundances in surface seawater of various ocean environments worldwide.
Compared with the microplastic abundances of surface seawaters in other mariculture areas, the microplastic abundance in Dapeng Cove was lower than that of 8902 items/m3 in Pearl River and 4500 ± 100 items/m3 in Maowei sea, China (Wang et al., 2019; Yan et al., 2019; Zhu et al., 2019), but it was higher than that of 3.1-3.5 items/m3 in Jiangsu coastal area, 0.1 ± 4.6 items/m3 in Beibu Gulf, and 4.4 -10.8 items/m3 in Yangtze River Delta, China (Zhang et al., 2020; Xu et al., 2023; Yu et al., 2023). Compared with the seawaters where microplastics were studied by trawl, the microplastic abundance in this study was much higher than that of 0.14 ± 0.12 items/m3 in Hangzhou Bay (Wang et al., 2020), 11.98 items/m3 in the coastal region of the South Yellow Sea, China (Sun et al., 2024), and 8.9 ± 4.7 items/m3 in Xiangshan Bay (Chen et al., 2018).
3.1.2 Microplastic abundances in sediments
In addition to being transported to the open sea, microplastics could enter and accumulate in the sediment of a bay. Previous studies have demonstrated that marine sediment was a major sink for marine microplastics and has been widely used as an environmental medium for investigating microplastic pollution (Yang and Ma, 2023). The mean microplastic abundance in sediments was 1381 ± 945items/kg in Dapeng Cove. DP02 exhibited the lowest abundance of 340 ± 48 items/kg, whereas Yu01 in the fish farming area showed the highest abundance of 3000 ± 287 items/kg (Figure 3). Microplastic abundance in sediments showed an obvious spatial variation: the mean microplastic abundance in sediments was 1120 ± 148 items/kg in the oyster farming area (S3); the mean microplastic abundance in the sediments was 2795 ± 196 items/kg in the fish farming area (Yu01, Yu02, and Yu03); the mean microplastic abundance in the sediments was 2875 ± 269 items/kg in the cage farming area (S4); the mean microplastic abundance in the sediments was 697 ± 236 items/kg in other areas. The spatial distribution of microplastic abundance in sediments was similar to the trend observed in surface seawater samples, in which the microplastic abundance was higher in the mariculture areas. The results of this study suggested that long-term mariculture development has caused the accumulation of a large amount of microplastics in sediments of Dapeng Cove. This was mainly due to the widespread use of fishing nets, foam buoys, cage etc. These broken aquaculture installations produced fiber and foam microplastics (Nunes et al., 2023). The microplastics could deposit in the sediment through sedimentation caused by high density, waves, tides, and microbial colonization. In comparison with the microplastic abundances reported in literature (Table 2), the mean abundance in sediments of Dapeng Cove would be a medium microplastic pollution level.

Figure 3 The microplastic abundances in sediments from Dapeng Cove.
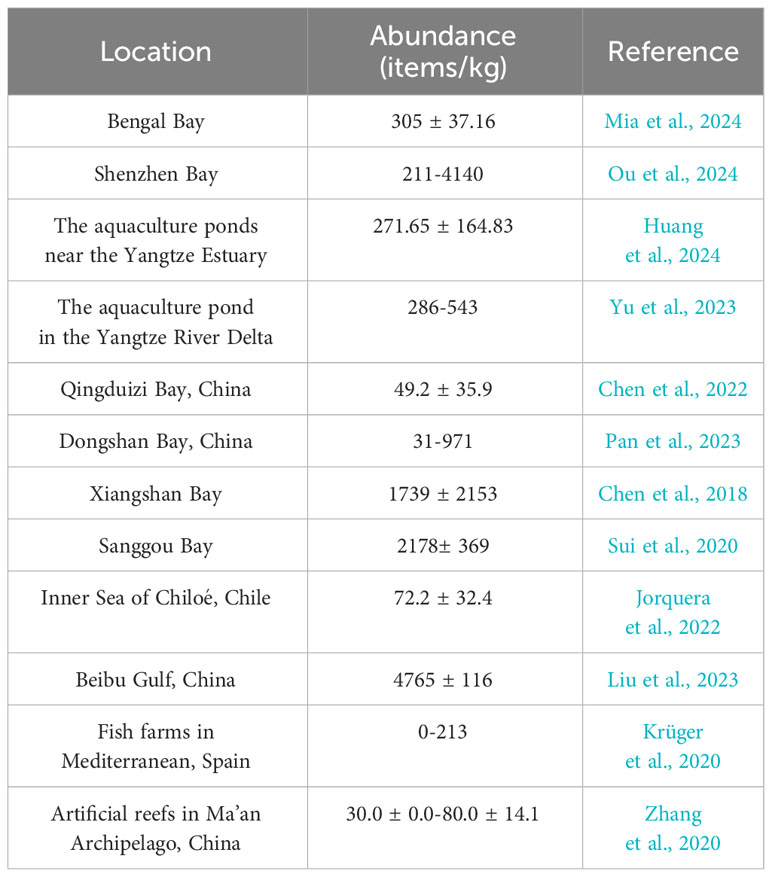
Table 2 The microplastic abundances in sediments of different ocean environments.
3.2 Microplastic shapes in Dapeng Cove
The shapes of microplastics collected in Dapeng Cove could be mainly classed into fibers, films, and particles (Figure 4). However, different shapes of microplastics have different proportions(Figure 5). The fibers in surface seawater samples in this study were the dominant shape of microplastics, which accounted for 65.4%, whereas particles and films accounted for 21.4% and 13.2% of microplastics, respectively.
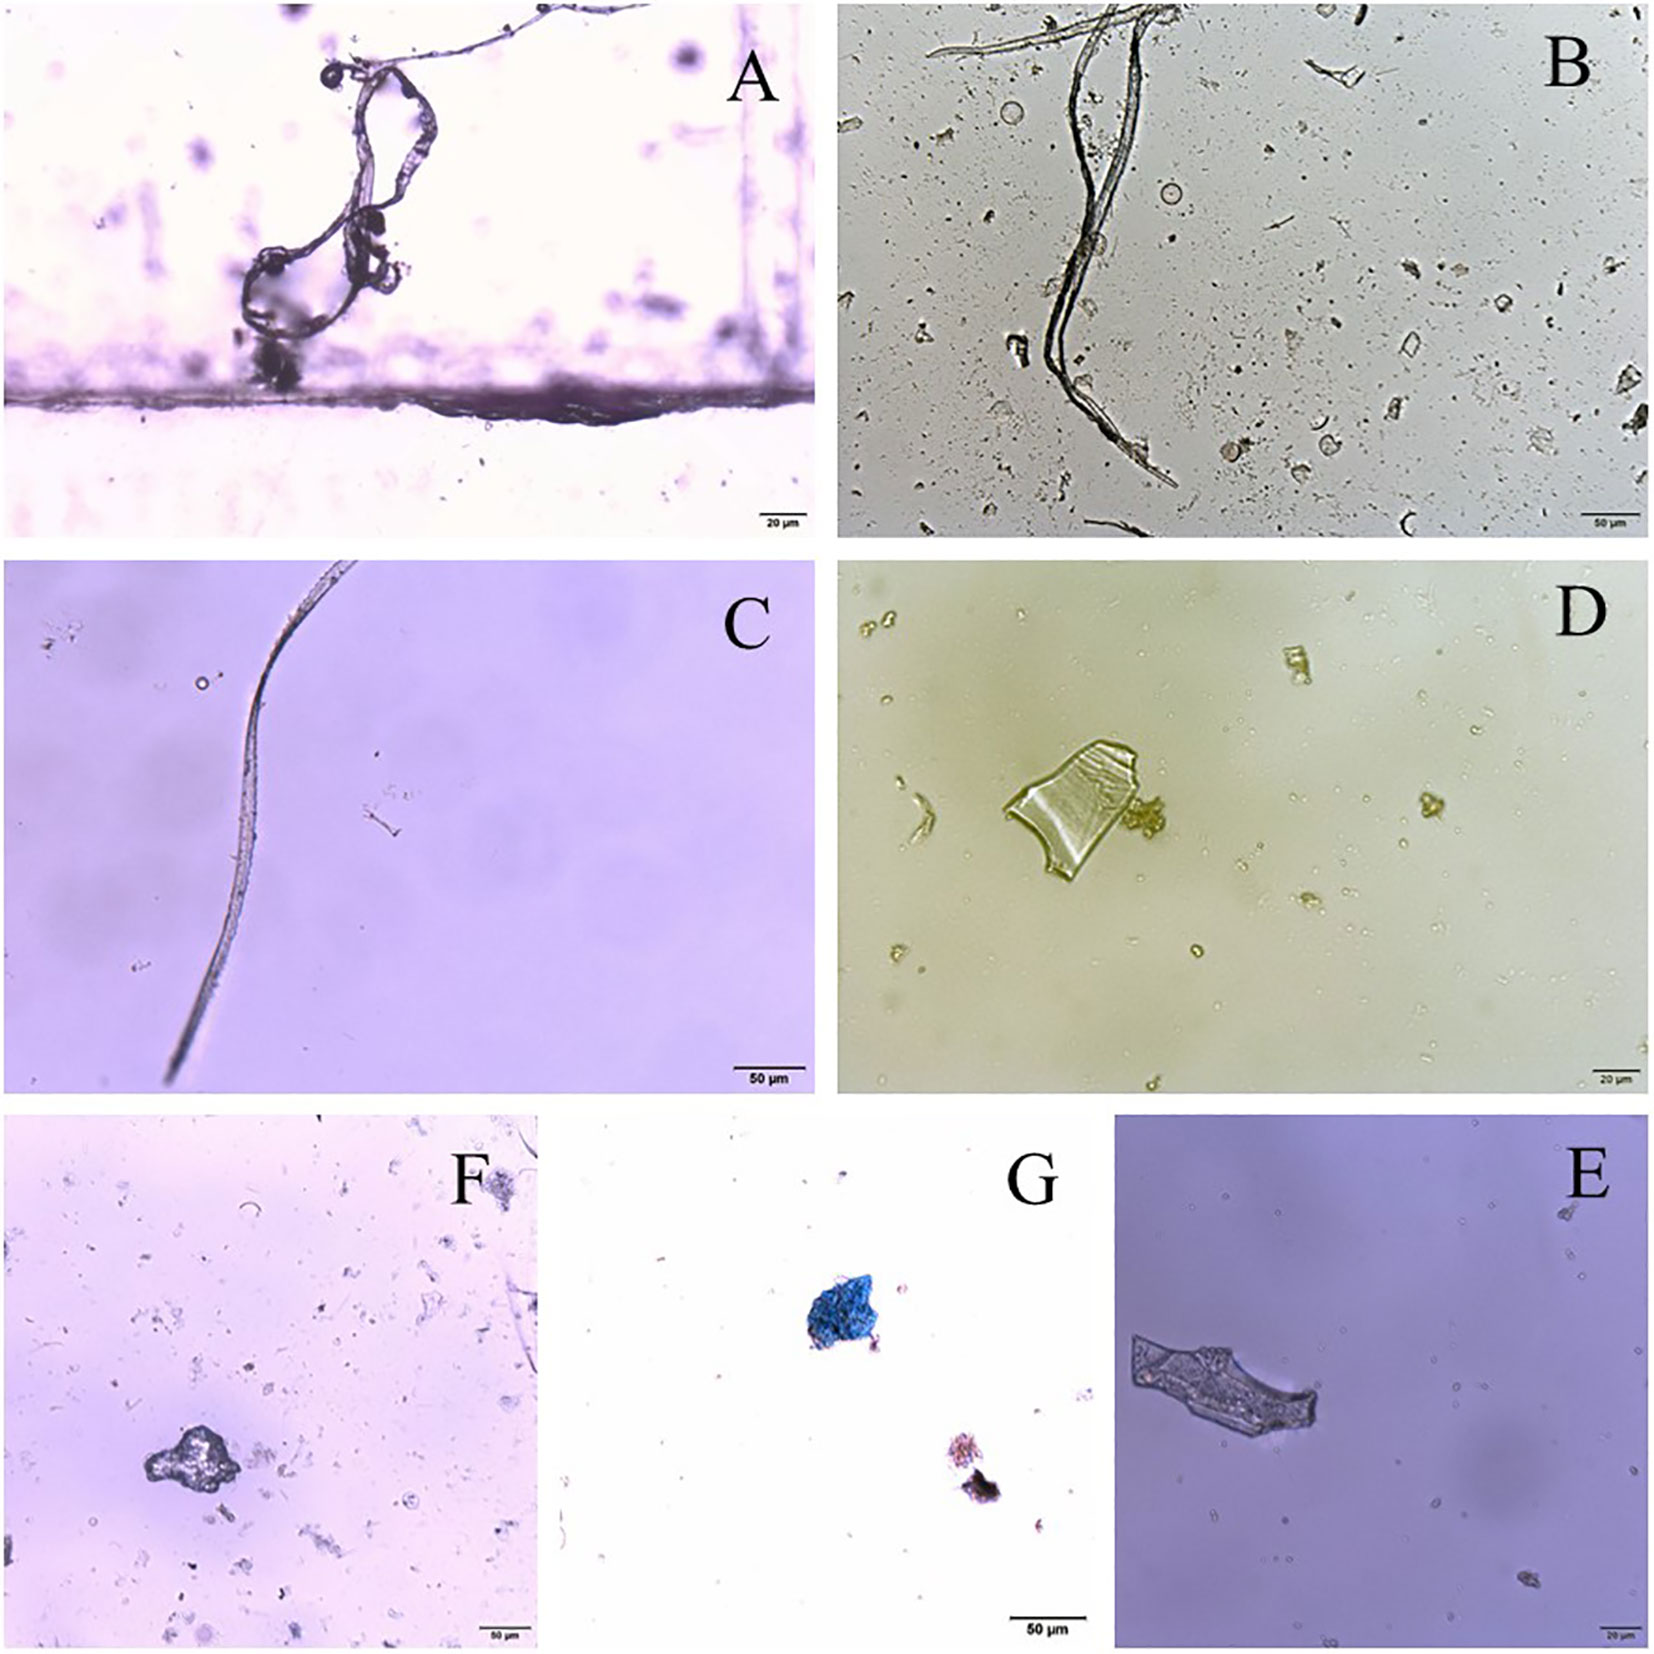
Figure 4 Photographs of representative microplastics collected from Dapeng Cove: (A–C) fibers; (D, E) films; (F, G): particles.
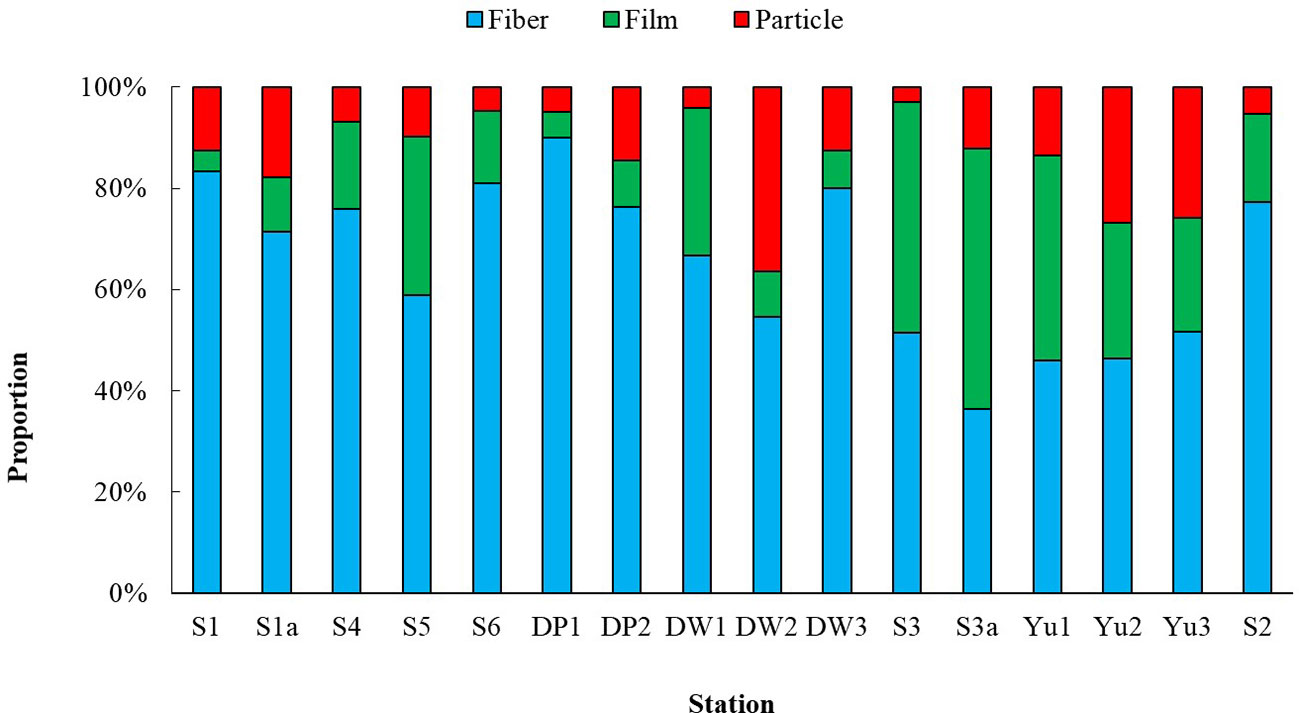
Figure 5 The proportion of different microplastic shapes in surface seawater from Dapeng Cove.
Fibers in DP01 had the highest proportion of 90.0%, particles in S3a had the highest proportion of 51.5%, and films in DW02 had the highest proportion of 36.4%. Fibrous microplastic was dominant for crab, prawn, fish in aquaculture ponds near the Yangtze Estuary, accounting for 40.9% in water (Huang et al., 2024). Chen et al. reported that the proportion of synthetic cellulose fibers accounted for 41.5% ± 17.3% (n = 18) of microplastics in Xiangshan Bay (Chen et al., 2018). Fibers made up more than 65% of the microplastics in Maowei Sea (Zhu et al., 2019) and accounted for up to 66.77% of microplastics in Yangtze River Delta (Yu et al., 2023). However, the proportions of microplastics in surface seawater in Pearl River Estuary (Yan et al., 2019) and the Bohai Sea (Zhang et al., 2017) were < 10% and 3%, respectively. The main materials used to build fishing nets and ropes are large polyethylene (PE) (low-density PE), polyamide (PA) (nylon), and polypropylene (PP) monofilament (Bertelsen and Ottosen, 2022), which have a larger diameter (> 20 mm) than that of the textile fibers from wastewater system (Yu et al., 2014). Fishing net and ropes made from these materials would shed a large amount of fibers (Wright et al., 2021), which would lead to an increase in the microplastic concentration of mariculture areas.
Fibers were the predominant shape of microplastics in sediments, which accounted for 52.1%, whereas the proportion of particles and films accounted for 35.2% and 12.8%, respectively (Figure 6). Similarly, fibrous microplastic was also dominant in aquaculture ponds near the Yangtze Estuary, accounting for 58.6% insediment (Huang et al., 2024).The proportion of fibers in sediments of Xiangshan Bay (Wu et al., 2020), Inner Sea of Chiloé, Chile (Jorquera et al., 2022) and Qingdao Beach (Gao et al., 2021) was 94.66%, 88% and >90%, respectively. Fibers in S1 had the highest proportion of 91.2%, particles in DW1 had the highest proportion of 51.1%, and films in DW2 had the highest proportion of 21.6%. The distribution of different shapes of microplastics in sediments has a similar trend with that in surface seawater, in which fibers were the most, with both proportions of more than 50%, followed by particles, and then films. The proportion of fibers in sediments was higher than that in surface seawater, which was consistent with the results of Pearl River where the proportion of fibers decreased from 80.9% in surface seawater to 54.7% in sediments, while the proportion of particles was higher in sediments than that in surface seawater. This is related to the fact that the density of particles is higher than that of fibers, which is more easily settled as sediment. The lower surface area to volume ratio of the particle fragments could make them sink and settle on the river bed (Wang et al., 2017). On the contrary, the surface area to volume ratio of the fibers is much higher than that of particle fragments with similar sizes, which makes microplastics with linear shapes suspended in the water column.
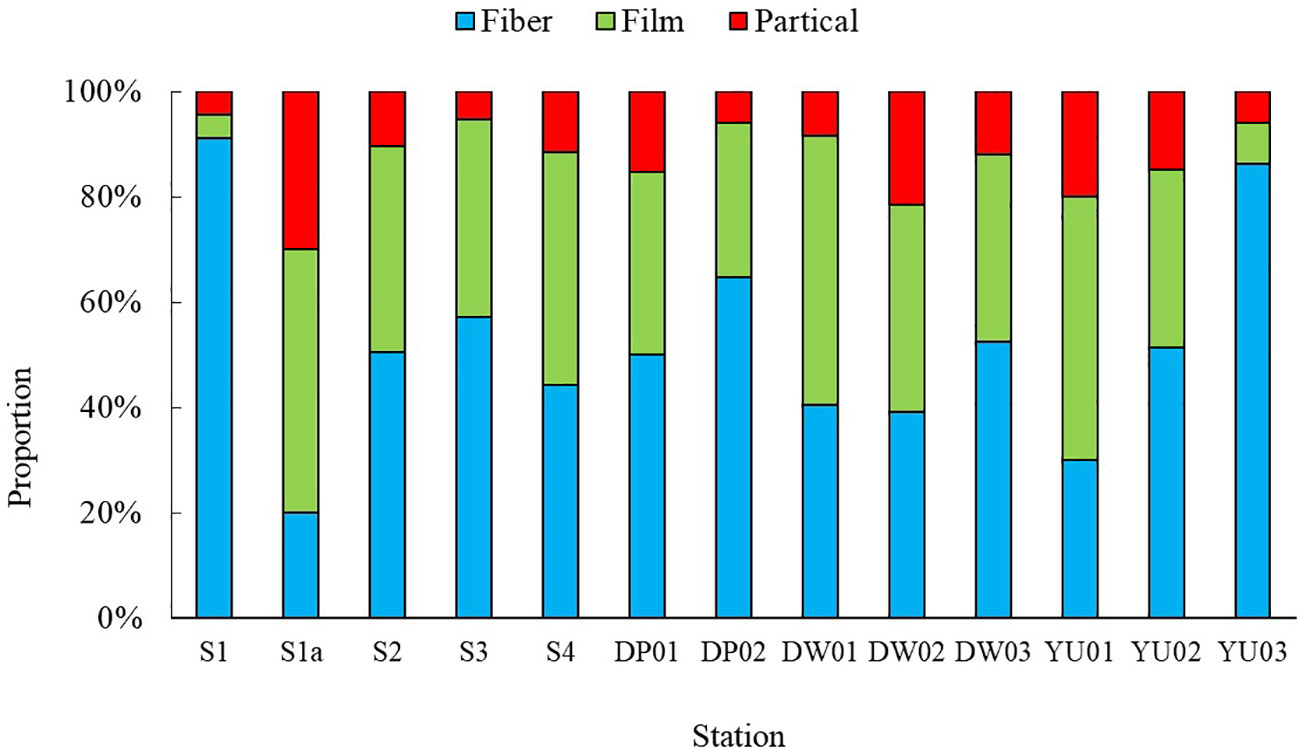
Figure 6 The proportion of different microplastic shapes in sediments from Dapeng Cove.
The contribution from mariculture facilities to marine microplastics in the proportion of plastics could reach as high as 78.1% (Zhu et al., 2019). Fibers were mainly caused by the breaking of net cages, fishing nets, and fishing lines. Dapeng Cove had frequent anthropogenic activities such as farming and fishing, in which net cages, fishing nets, and fishing lines, would be broken into fine fibrous residues due to long-term environmental effects, resulting in microplastic pollution in coastal areas. Broken plastic bags were also one of the sources of films (Wright et al., 2021). A large amount of non-degradable plastic bags that were discarded into the environment would be present in the environment for a long time. The waste plastic particles produced by coastal industrial and agricultural activities, which would enter Dapeng Cove through the river transport, making this sea area be contaminated by film-like microplastics.
3.3 Microplastic sizes in Dapeng Cove
The different particle sizes of microplastics in surface seawater with the proportions of the total microplastic numbers were < 1 mm (69.6%), 1~2 mm (18.6%), 2~3 mm (7.9%), 3~4 mm (2.5%), and 4~5 mm (1.4%), respectively (Figure 7). The particle size of less than 1 mm accounted for half of microplastics, which was similar to the previous reports (Zhu et al., 2018). The different particle sizes of microplastics in sediments with the proportions of the microplastic total numbers were < 1 mm (65.2%), 1~2 mm (19.8%), 2~3 mm (6.9%), 3~4 mm (4.1%), and 4~5 mm (3.9%),respectively (Figure 8). The proportion of microplastics with particle sizes less than 1 mm was higher than 58% of Yangtze Estuary (Li et al., 2022) and 80% of Qingdao Beach (Gao et al., 2021). With the increase of the particle size, the amount of microplastics in surface seawater and sediments showed a decreasing trend. Generally, large plastics would gradually be broken down into smaller pieces in the marine environments through mechanical action, photooxidation, and biodegradation (Reddy and Nair, 2022). Therefore, the quantities of small plastic debris would increase geometrically as their size decreased (Isobe, 2016). It has been documented that the toxicity of microplastic particles is size dependent, with smaller particles being more toxic than larger particles to marine organisms (Thacharodi et al., 2024).
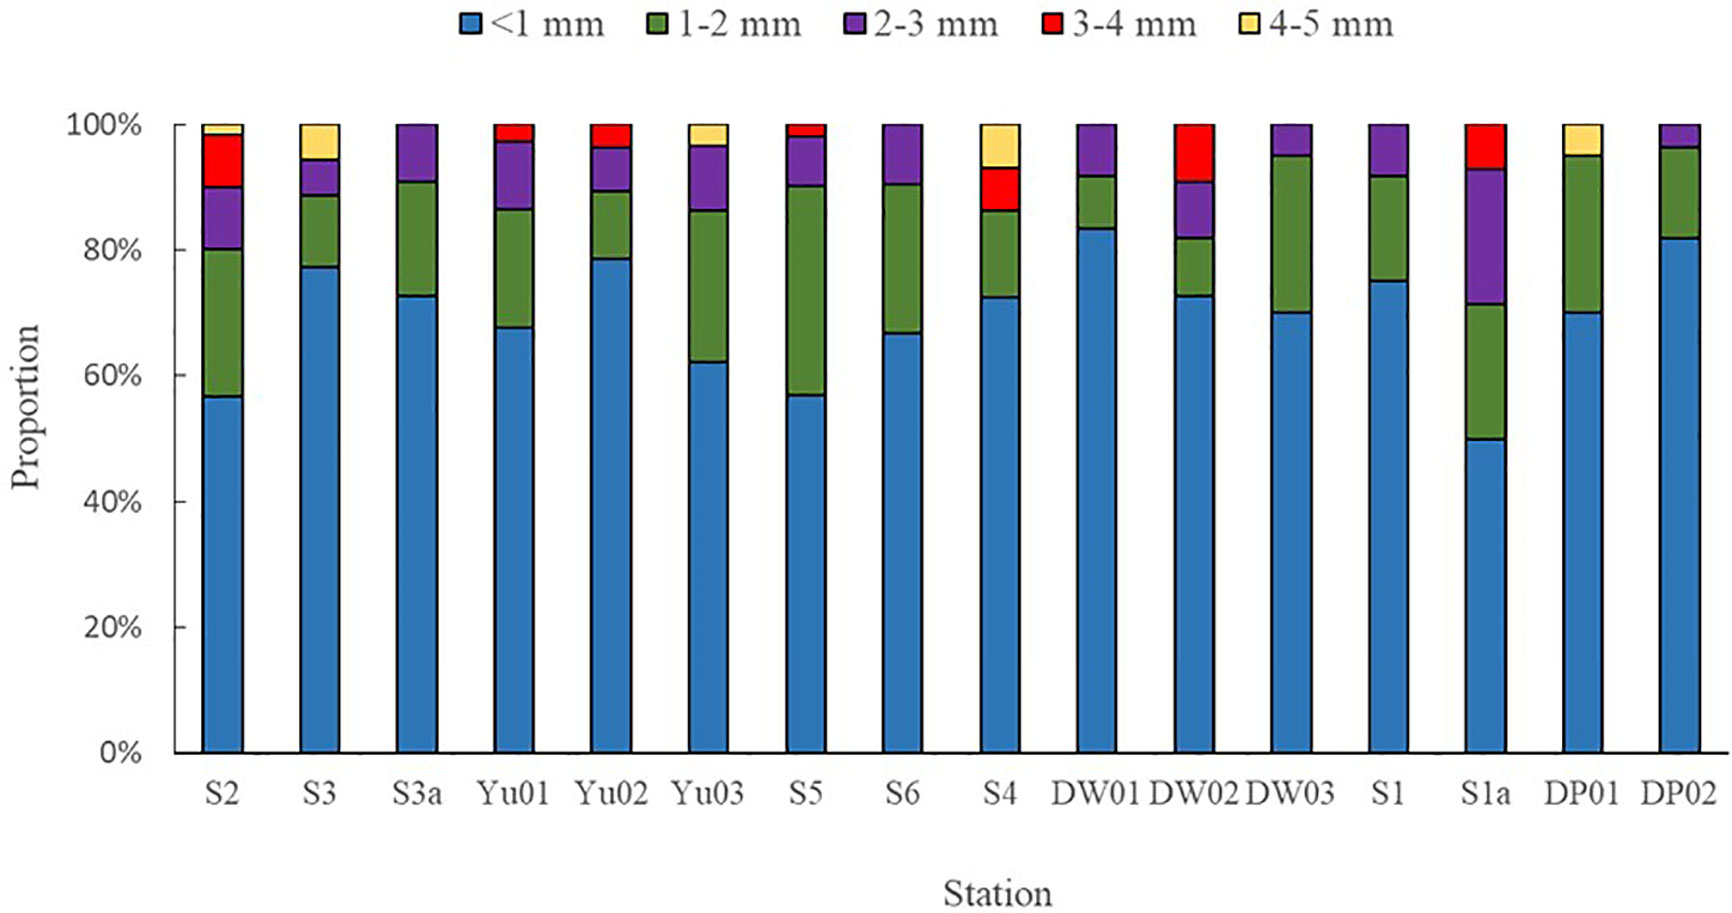
Figure 7 Size distribution of microplastics in surface seawater from Dapeng Cove.
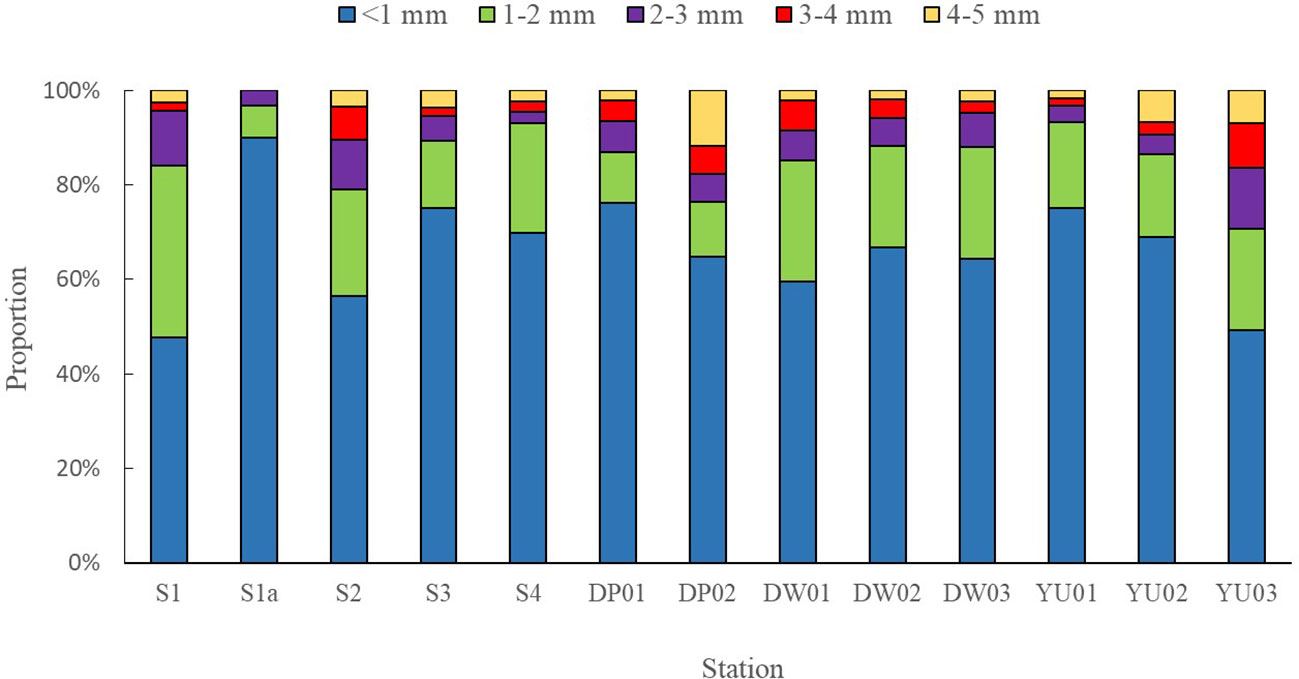
Figure 8 Size distribution of microplastics in sediments from Dapeng Cove.
Von Moos et al. reported that the microplastics ranging 0~80 µm were ingested and taken up into cells in the lysosomal system of the blue mussel (Mytilus edulis L) in several hours (Von Moos et al., 2012). Van Cauwenberghe et al. reported that the digestive glands of mussels (Mytilus edulis) accumulated more polyvinyl chloride (PVC) with the particle size of 0.8~0.96 µm than those with the small particle size of 0.6 µm, with exposure of seawater with PVC of 0.1~1.0 µm (Van Cauwenberghe and Janssen, 2014). Hence, it is more important in future research to assess the risks posed by ever-increasing numbers of small microplastics in the marine system.
3.4 Microplastic compositions in Dapeng Cove
To analyze the composition of the microplastics in Dapeng Cove, 100 microplastic particles were randomly selected from surface seawater and sediments, respectively, and they were identified using Fourier Transform Infrared microscope (micro-FTIR) and compared with the spectral library of this instrument software. Composition analysis of surface seawaters showed that the main categories of polymer plastics were polyethylene (PE), polypropylene (PP), polystyrene (PS), and polyethylene terephthalate (PET), which accounted for 40.6%, 31.5%, 10.7%, and 6.9%, respectively, of the total microplastics (Figure 9). In addition, nylon accounted for 3.5% of randomly selected microplastic particles and about 6.8% could not be identified as common synthetic polymers. Composition analysis of sediments demonstrated that the main categories of polymer plastics were polypropylene (PP), polyethylene (PE), polystyrene (PS), and nylon, which accounted for 39.1%, 27.8%, 12.5%, and 13.2%, respectively, of the total microplastics (Figure 9). Additionally, the proportion of the other categories of synthetic polymers accounted for 7.4%.
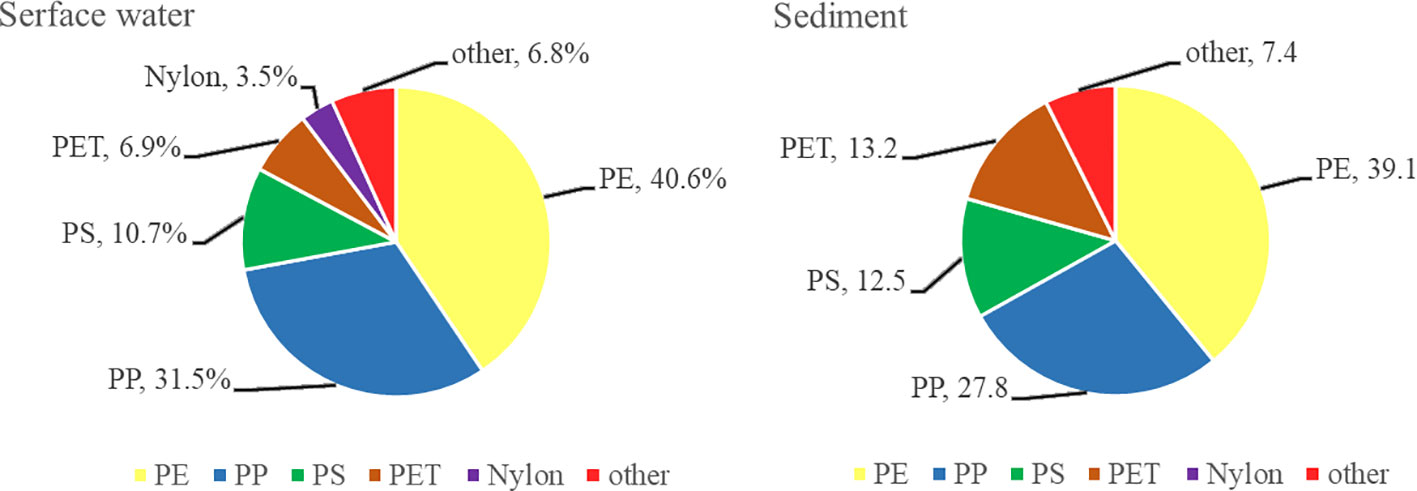
Figure 9 The composition of microplastics in surface seawater and sediments from Dapeng Cove.
The total ratio of PP and PE in surface seawater was 72.1%, whereas this ratio in sediment was 66.9%. PE is commonly used in agricultural films, food packaging films, and plastic bottles, and the most common is plastic bags; whereas PP is used to manufacture plastic containers and food packaging bags. With a density lower than water, PE and PP could also be transported by current and deposited on all over the ocean (Wang et al., 2022). PE has high impact resistance and abrasion resistance (Li et al., 2024). The floats, nets, and silk threads made by PE have been widely used in mariculture and marine production, and thus their fibers and debris are most likely to enter the mariculture area. PE has a higher impact strength and higher tensile strength but lower working temperature than PP. A disadvantage of PP is poor UV resistance and poor oxidative resistance (Andrady, 2017). Therefore, PP ages faster in the ocean environment and easily breaks down into smaller particles. It could be possible that, although the majority of studies have found more PE plastics than PP plastics, there may be unidentified PP plastic waste with smaller diameters in marine environment. In this regard, Dapeng Cove may have more PP, and for microplastics smaller than 1 mm, the amount of PP is more than PE (Zhang et al., 2017). Nylon is another kind of synthetic plastic, which is used to make fishing gears, clothing, and other materials because of its high strength. PS and PET are widely used in the production of disposable foam lunch boxes, mineral water bottles, and other materials. These plastic products are abundant in daily life, readily enter the ocean, decompose to form microplastics, and they further threaten the survival and environmental safety of marine organisms.
4 Conclusion
Microplastics were detected in all water and sediment samples from Dapeng Cove. What’s more, in the surface water and sediments, the abundances of microplastics were a medium microplastic pollution level compared with other sea areas. Among them, the amount of small-sized fibers microplastics(<1mm) was the dominant species among them. Polyethylene (PE) or polypropylene (PP) was the main composition of microplastics in seawater and sediments. The microplastics stemmed from long-term and high-density mariculture not only could be accumulated in water and sediment, but also could be concentrated by marine organism which raise potential risks of cultured seafood and human health. Therefore, it is necessary to further study the microplastics in cultured seafood and effective measures should be undertaken to reduce the amount of plastics used in mariculture.
Data availability statement
The original contributions presented in the study are included in the article/supplementary material. Further inquiries can be directed to the corresponding author.
Author contributions
YX: Writing – original draft, Writing – review & editing, Formal analysis. SL: Formal analysis, Writing – original draft. JC: Methodology, Writing – review & editing. ZC: Supervision, Writing – review & editing.
Funding
The author(s) declare financial support was received for the research, authorship, and/or publication of this article. This work was supported by the Central Public-interest Scientific Institution Basal Research Fund, YSFRI, CAFS (No.20603022017005) and the Central Public-interest Scientific Institution Basal Research Fund, CAFS (NO.2023TD53).
Conflict of interest
The authors declare that the research was conducted in the absence of any commercial or financial relationships that could be construed as a potential conflict of interest.
Publisher’s note
All claims expressed in this article are solely those of the authors and do not necessarily represent those of their affiliated organizations, or those of the publisher, the editors and the reviewers. Any product that may be evaluated in this article, or claim that may be made by its manufacturer, is not guaranteed or endorsed by the publisher.
References
Abreu A., Pedrotti M. L. (2019). Microplastics in the oceans: the solutions lie on land. Field Actions Sci. Rep. (Special Issue 19), 62–67.
Al Nahian S., Rakib M. R. J., Kumar R., Haider S. M. B., Sharma P., Idris A. M. (2023). Distribution, characteristics, and risk assessments analysis of microplastics in shore sediments and surface water of Moheshkhali channel of Bay of Bengal, Bangladesh. Sci. Total Environ. 855, 158892. doi: 10.1016/j.scitotenv.2022.158892
Al Mamun A., Prasetya T. A. E., Dewi I. R., Ahmad M. (2023). Microplastics in human food chains: Food becoming a threat to health safety. Sci. Total Environ. 858, 159834. doi: 10.1016/j.scitotenv.2022.159834
Andrady A. L. (2017). The plastic in microplastics: A review. Mar. Pollut. Bull. 119 (1), 12–22. doi: 10.1016/j.marpolbul.2017.01.082
Auta H. S., Emenike C. U., Fauziah S. H. (2017). Distribution and importance of microplastics in the marine environment: a review of the sources, fate, effects, and potential solutions. Environ. Int. 102, 165–176. doi: 10.1016/j.envint.2017.02.013
Bertelsen I. M. G., Ottosen L. M. (2022). Recycling of waste polyethylene fishing nets as fibre reinforcement in gypsum-based materials. Fibers Polymers 23, 164–174. doi: 10.1007/s12221-021-9760-3
Chen G., Li Y., Wang J. (2021). Occurrence and ecological impact of microplastics in aquaculture ecosystems. Chemosphere 274, 129989. doi: 10.1016/j.chemosphere.2021.129989
Chen H., Zou X., Ding Y., Wang Y., Fu G., Yuan F. (2022). Are microplastics the ‘technofossils’ of the anthropocene? Anthr. Coasts 5 (1), 8. doi: 10.1007/s44218-022-00007-1
Chen M., Jin M., Tao P., Wang Z., Xie W., Yu X., et al. (2018). Assessment of microplastics derived from mariculture in Xiangshan Bay, China. Environ. Pollut. 242, 1146–1156. doi: 10.1016/j.envpol.2018.07.133
Coyle R., Hardiman G., O’Driscoll K. (2020). Microplastics in the marine environment: A review of their sources, distribution processes, uptake and exchange in ecosystems. Case Stud. Chem. Environ. Eng. 2, 100010. doi: 10.1016/j.cscee.2020.100010
Dong H., Chen Y., Wang J., Zhang Y., Zhang P., Li X., et al. (2021). Interactions of microplastics and antibiotic resistance genes and their effects on the aquaculture environments. J. Hazard. Mater. 403, 123961. doi: 10.1016/j.jhazmat.2020.123961
Eriksen M., Lebreton L. C. M., Carson H. S., Thiel M., Moore C. J., Borerro J. C., et al. (2014). Plastic pollution in the world’s oceans: more than 5 trillion plastic pieces weighing over 250,000 tons afloat at sea. PloS One 9, e111913. doi: 10.1371/journal.pone.0111913
Feng S., Lu H., Xue Y., Yan P., Sun T. (2023). Fate, transport, and source of microplastics in the headwaters of the Yangtze River on the Tibetan Plateau. J. Hazard. Mater. 455, 131526. doi: 10.1016/j.jhazmat.2023.131526
Focardi A., Moore L. R., Raina J. B., Seymour J. R., Paulsen I. T., Tetu S. G. (2022). Plastic leachates impair picophytoplankton and dramatically reshape the marine microbiome. Microbiome 10, 179. doi: 10.1186/s40168-022-01369-x
Gao F., Li J., Hu J., Sui B., Wang C., Sun C., et al. (2021). The seasonal distribution characteristics of microplastics on bathing beaches along the coast of Qingdao, China. Sci. Total Environ. 783, 146969. doi: 10.1016/j.scitotenv.2021.146969
Gardon T., El Rakwe M., Paul-Pont I., Le Luyer J., Thomas L., Prado E., et al. (2021). Microplastics contamination in pearl-farming lagoons of French Polynesia. J. Hazard. Mater. 419, 126396. doi: 10.1016/j.jhazmat.2021.126396
Gupta P., Saha M., Suneel V., Rathore C., Chndrasekhararao A. V., Gupta G. V. M., et al. (2024). Microplastics in the sediments along the eastern Arabian Sea shelf: Distribution, governing factors and risk assessment. Sci. Total Environ. 910, 168629. doi: 10.1016/j.scitotenv.2023.168629
Harris P. T., Tamelander J., Lyons Y., Neo M. L., Maes T. (2021). Taking a mass-balance approach to assess marine plastics in the South China Sea. Mar. pollut. Bull. 171, 112708. doi: 10.1016/j.marpolbul.2021.112708
Huang J. N., Xu L., Wen B., Gao J. Z., Chen Z. Z. (2024). Characteristics and risks of microplastic contamination in aquaculture ponds near the Yangtze Estuary, China. Environ. pollut. 343, 123288. doi: 10.1016/j.envpol.2024.123288
IBM Corp. (2020). IBM SPSS statistics for windows, version 27.0 [Computer software] (Armonk, NY: Author).
Isobe A. (2016). Percentage of microbeads in pelagic microplastics within Japanese coastal waters. Mar. pollut. Bull. 110, 432–437. doi: 10.1016/j.marpolbul.2016.06.030
Iwasaki S., Isobe A., Kako S. I., Uchida K., Tokai T. (2017). Fate of microplastics and mesoplastics carried by surface currents and wind waves: A numerical model approach in the Sea of Japan. Mar. pollut. Bull. 121, 85–96. doi: 10.1016/j.marpolbul.2017.05.057
Jorquera A., Castillo C., Murillo V., Araya J., Pinochet J., Narváez D., et al. (2022). Physical and anthropogenic drivers shaping the spatial distribution of microplastics in the marine sediments of Chilean fjords. Sci. Total Environ. 814, 152506. doi: 10.1016/j.scitotenv.2021.152506
Kasmuri N., Tarmizi N. A. A., Mojiri A. (2022). Occurrence, impact, toxicity, and degradation methods of microplastics in environment—a review. Environ. Sci. pollut. Res. 29, 30820–30836. doi: 10.1007/s11356-021-18268-7
Krüger L., Casado-Coy N., Valle C., Ramos M., Sánchez-Jerez P., Gago J., et al. (2020). Plastic debris accumulation in the seabed derived from coastal fish farming. Environ. pollut. 257, 113336. doi: 10.1016/j.envpol.2019.113336
Lai Y., Dong L., Li Q., Li P., Liu J. (2021). Sampling of micro-and nano-plastics in environmental matrixes. TrAC Trends Anal. Chem. 145, 116461. doi: 10.1016/j.trac.2021.116461
Li J., Zhang L., Dang X., Su L., Jabeen K., Wang H., et al. (2022). Effects of cooking methods on microplastics in dried shellfish. Sci. Total Environ. 837, 155787. doi: 10.1016/j.scitotenv.2022.155787
Li X., Mahadas N. A., Zhang M., DePodesta J., Stefik M., Tang C. (2024). Sustainable high-density polyethylene via chemical recycling: From modification to polymerization methods. Polymer 295, 126698. doi: 10.1016/j.polymer.2024.126698
Lin F., Zhang Q., Xie J., Lin Y., Chen Y., Mao K., et al. (2022). Microplastics in biota and surface seawater from tropical aquaculture area in Hainan, China. Gondwana Res. 108, 41–48. doi: 10.1016/j.gr.2021.11.008
Liu Q., Xiong X., Wang K., Wang H., Ling Y., Li Q., et al. (2023). Homogenization of microplastics in alpine rivers: Analysis of microplastic abundance and characteristics in rivers of qilian mountain, china. J. Environ. Manage. 340, 118011. doi: 10.1016/j.jenvman.2023.118011
Ma J., Niu X., Zhang D., Lu L., Ye X., Deng W., et al. (2020). High levels of microplastic pollution in aquaculture water of fish ponds in the Pearl River Estuary of Guangzhou, China. Sci. total Environ. 744, 140679. doi: 10.1016/j.scitotenv.2020.140679
Mia M. S., Islam A. R. M. T., Ali M. M., Siddique M. A. B., Pal S. C., Idris A. M., et al. (2024). Microplastics in sediment and surface water from an island ecosystem in Bay of Bengal. Regional Stud. Mar. Sci. 69, 103332. doi: 10.1016/j.rsma.2023.103332
Nawar N., Rahman M. M., Chowdhury F. N., Marzia S., Ali M. M., Akbor M. A., et al. (2023). Characterization of microplastic pollution in the Pasur river of the Sundarbans ecosystem (Bangladesh) with emphasis on water, sediments, and fish. Sci. Total Environ. 868, 161704. doi: 10.1016/j.scitotenv.2023.161704
Nunes B. Z., Moreira L. B., Xu E. G., Castro Í. B. (2023). A global snapshot of microplastic contamination in sediments and biota of marine protected areas. Sci. Total Environ. 865, 161293. doi: 10.1016/j.scitotenv.2022.161293
Ou D., Ni Y., Li W., He W., Wang L., Huang H., et al. (2024). Psychrobacter species enrichment as potential microplastic degrader and the putative biodegradation mechanism in Shenzhen Bay sediment, China. J. Hazard. Mater. 464, 132971. doi: 10.1016/j.jhazmat.2023.132971
Pan H., Zhao X., Zhou X., Yan H., Han X., Wu M., et al. (2023). Research progress on the role of biofilm in heavy metals adsorption-desorption characteristics of microplastics: A review. Environ. Pollut. 122448. doi: 10.1016/j.envpol.2023.122448
Plastics Europe (2022). Plastics - the facts 2022: an analysis of european plastics production, demand, conversion and end-of-life management. Brussels, Belgium: Plastics Europe.
Pourebrahimi S., Pirooz M. (2023). Microplastic pollution in the marine environment: A review. J. Hazard. Mater. Adv. 10, 100327. doi: 10.1016/j.hazadv.2023.100327
Rakib M. R. J., De-la-Torre G. E., Pizarro-Ortega C. I., Dioses-Salinas D. C., Al-Nahian S. (2021). Personal protective equipment (PPE) pollution driven by the COVID-19 pandemic in Cox’s Bazar, the longest natural beach in the world. Mar. pollut. Bull. 169, 112497. doi: 10.1016/j.marpolbul.2021.112497
Rathore C., Saha M., Gupta P., Kumar M., Naik A., de Boer J. (2023). Standardization of micro-FTIR methods and applicability for the detection and identification of microplastics in environmental matrices. Sci. Total Environ. 888, 164157. doi: 10.1016/j.scitotenv.2023.164157
Reddy A. S., Nair A. T. (2022). The fate of microplastics in wastewater treatment plants: An overview of source and remediation technologies. Environ. Technol. Innovation 28, 102815. doi: 10.1016/j.eti.2022.102815
Sarma H., Hazarika R. P., Kumar V., Roy A., Pandit S., Prasad R. (2022). Microplastics in marine and aquatic habitats: sources, impact, and sustainable remediation approaches. Environ. Sustainability 5, 39–49. doi: 10.1007/s42398-022-00219-8
Sui Q., Zhang L., Xia B., Chen B., Sun X., Zhu L., et al. (2020). Spatiotemporal distribution, source identification and inventory of microplastics in surface sediments from Sanggou Bay, China. Sci. Total Environ. 723, 138064. doi: 10.1016/j.scitotenv.2020.138064
Sun X., Yang R., Ji J., Zhu Z., White J. C., Shen Y. (2024). An evaluation of microplastic contamination in the marine waters and species in the coastal region of the south yellow sea, China. J. Hazard. Mater., 134018. doi: 10.1016/j.jhazmat.2024.134018
Teng J., Wang Q., Ran W., Wu D., Liu Y., Sun S., et al. (2019). Microplastic in cultured oysters from different coastal areas of China. Sci. total Environ. 653, 1282–1292. doi: 10.1016/j.scitotenv.2018.11.057
Thacharodi A., Meenatchi R., Hassan S., Hussain N., Bhat M. A., Arockiaraj J., et al. (2024). Microplastics in the environment: a critical overview on its fate, toxicity, implications, management, and bioremediation strategies. J. Environ. Manage. 349, 119433. doi: 10.1016/j.jenvman.2023.119433
Tian Z., Huang H., Qi Z., Liao X., Liu H., Dai M., et al. (2012). Using chemometric methods to study the mariculture eco-environment in Dapeng Cove,China. J. Fishery Sci. China 19, 881–888. doi: 10.3724/SP.J.1118.2012.00881
Van Cauwenberghe L., Janssen C. R. (2014). Microplastics in bivalves cultured for human consumption. Environ. pollut. 193, 65–70. doi: 10.1016/j.envpol.2014.06.010
Von Moos N., Burkhardt-Holm P., Koühler A. (2012). Uptake and effects of microplastics on cells and tissue of the blue mussel Mytilus edulis L. after an experimental exposure. Environ. Sci. Technol. 46, 11327–11335. doi: 10.1021/es302332w
Wang T., Hu M., Song L., Yu J., Liu R., Wang S., et al. (2020). Coastal zone use influences the spatial distribution of microplastics in Hangzhou Bay, China. Environ. pollut. 266, 115137. doi: 10.1016/j.envpol.2020.115137
Wang Q., Lin L., Chen X., Wu W., Wu H.. (2022). Transportation of bloom forming species in ballast water by commercial vessels at Yangshan deep water port. Ocean Coast. Manage. 219, 106045. doi: 10.1016/j.ocecoaman.2022.106045
Wang J., Lu L., Wang M., Jiang T., Liu X., Ru S. (2019). Typhoons increase the abundance of microplastics in the marine environment and cultured organisms: a case study in Sanggou Bay, China. Sci. total Environ. 667, 1–8. doi: 10.1016/j.scitotenv.2019.02.367
Wang J., Peng J., Tan Z., Gao Y., Zhan Z., Chen Q., et al. (2017). Microplastics in the surface sediments from the beijiang river littoral zone: Composition, abundance, surface textures and interaction with heavy metals. Chemosphere 171, 248–258. doi: 10.1016/j.chemosphere.2016.12.074
Wang T., Zou X., Li B., Yao Y., Li J., Hui H., et al. (2018). Microplastics in a wind farm area: A case study at the Rudong Offshore Wind Farm, Yellow Sea, China. Mar. pollut. Bull. 128, 466–474. doi: 10.1016/j.marpolbul.2018.01.050
Wright L. S., Napper I. E., Thompson R. C. (2021). Potential microplastic release from beached fishing gear in Great Britain’s region of highest fishing litter density. Mar. pollut. Bull. 173, 113115. doi: 10.1016/j.marpolbul.2021.113115
Wu C., Xiong X., Hamidian A. H., Zhang Y., Xu X. (2022). A review on source, occurrence, and impacts of microplastics in freshwater aquaculture systems in China. Water Biol. Secur. 1, 100040. doi: 10.1016/j.watbs.2022.100040
Wu F., Wang Y., Leung J. Y., Huang W., Zeng J., Tang Y., et al. (2020). Accumulation of microplastics in typical commercial aquatic species: a case study at a productive aquaculture site in china. Sci. Total Environ. 708, 135432. doi: 10.1016/j.scitotenv.2019.135432
Xu N., Jiang L., Zhang Y., Shen Y., Wang Y., Wang S., et al. (2023). Microplastic pollution in the offshore sea, rivers and wastewater treatment plants in Jiangsu coastal area in China. Mar. Environ. Res. 188, 105992. doi: 10.1016/j.marenvres.2023.105992
Yan M., Nie H., Xu K., He Y., Hu Y., Huang Y., et al. (2019). Microplastic abundance, distribution and composition in the Pearl River along Guangzhou city and Pearl River estuary, China. Chemosphere 217, 879–886. doi: 10.1016/j.chemosphere.2018.11.093
Yang L., Ma C. (2023). Toward a better understanding of microalgal photosynthesis in medium polluted with microplastics: a study of the radiative properties of microplastic particles. Front. Bioeng. Biotechnol. 11. doi: 10.3389/fbioe.2023.1193033
Yu F., Pei Y., Zhang X., Wu X., Zhang G., Ma J. (2023). Occurrence and distribution characteristics of aged microplastics in the surface water, sediment, and crabs of the aquaculture pond in the yangtze river delta of china. Sci. Total Environ. 871, 162039. doi: 10.1016/j.scitotenv.2023.162039
Yu Z., Jiang T., Xia J., Ma Y. E., Zhang T. (2014). Ecosystem service value assessment for an oyster farm in dapeng cove. J. Fish. China 38 (6), 853–860.
Zhang W., Zhang S., Wang J., Wang Y., Mu J., Wang P., et al. (2017). Microplastic pollution in the surface waters of the bohai sea, china. Environ. Pollut. 231, 541–548. doi: 10.1016/j.envpol.2017.08.058
Zhang W., Zhang S., Zhao Q., Qu L., Ma D., Wang J. (2020). Spatio-temporal distribution of plastic and microplastic debris in the surface water of the bohai sea, china. Mar. pollut. Bull. 158, 111343. doi: 10.1016/j.marpolbul.2020.111343
Zhang Y., Gao T., Kang S., Allen S., Luo X., Allen D. (2021). Microplastics in glaciers of the tibetan plateau: Evidence for the long-range transport of microplastics. Sci. Total Environ. 758, 143634. doi: 10.1016/j.scitotenv.2020.143634
Zhou A., Ji Q., Kong X., Zhu F., Meng H., Li S., et al. (2024). Response of soil property and microbial community to biodegradable microplastics, conventional microplastics and straw residue. Appl. Soil Ecol. 196, 105302. doi: 10.1016/j.apsoil.2024.105302
Zhu J., Zhang Q., Li Y., Tan S., Kang Z., Yu X., et al. (2019). Microplastic pollution in the maowei sea, a typical mariculture bay of china. Sci. Total Environ. 658, 62–68. doi: 10.1016/j.scitotenv.2018.12.192
Zhu L., Bai H., Chen B., Sun X., Qu K., Xia B. (2018). Microplastic pollution in north yellow sea, china: Observations on occurrence, distribution and identification. Sci. Total Environ. 636, 20–29. doi: 10.1016/j.scitotenv.2018.04.182
Keywords: Microplastic, abundance, mariculture, Fourier Transform Infrared microscope (micro-FTIR), Dapeng Cove
Citation: Xu Y, Li S, Chen J and Cui Z (2024) Assessment of mariculture-derived microplastic pollution in Dapeng Cove, China. Front. Mar. Sci. 11:1382249. doi: 10.3389/fmars.2024.1382249
Received: 05 February 2024; Accepted: 15 April 2024;
Published: 30 April 2024.
Edited by:
Mehrzad Keshavarzifard, Agricultural Research, Education and Extension Organization (AREEO), IranReviewed by:
Moslem Sharifinia, Iranian Fisheries Science Research Institute, IranSamaneh Karbalaei, Alzahra University, Iran
Kamalodin Kor, Iranian National Institute for Oceanography and Atmospheric Science, Iran
Copyright © 2024 Xu, Li, Chen and Cui. This is an open-access article distributed under the terms of the Creative Commons Attribution License (CC BY). The use, distribution or reproduction in other forums is permitted, provided the original author(s) and the copyright owner(s) are credited and that the original publication in this journal is cited, in accordance with accepted academic practice. No use, distribution or reproduction is permitted which does not comply with these terms.
*Correspondence: Zhengguo Cui, cuizg@ysfri.ac.cn