Carbonate system variability in the Mediterranean Sea: a modelling study
 Kostas Tsiaras
 Constantin Frangoulis
 Natalia Stamataki
- 1Institute of Oceanography, Hellenic Centre for Marine Research (HCMR), Anavyssos, Greece
- 2Institute of Oceanography, Hellenic Centre for Marine Research (HCMR), Heraklion, Greece
- 3Department of Physics, Section of Environmental Physics and Meteorology, National and Kapodistrian University of Athens, Athens, Greece
A basin-scale Mediterranean carbonate system model has been setup, building on the POSEIDON operational biogeochemical model. The spatial variability of carbonate system variables from a 13-year simulation (2010-2022) was validated against CARIMED in situ data (DIC, TA, pCO2), showing reasonable agreement in reproducing the observed patterns and preserving the dynamics in different areas, except a slight overestimation (~15 µmol/kg) of TA in the Eastern Levantine. The time-variability of model outputs (DIC, TA, pCO2, pH) was validated, against available time-series from Western (DYFAMED, Villefranche-PointB) and Eastern Mediterranean (HCB) sites, showing good agreement with the data, particularly for pCO2, pH and DIC. The model failed to reproduce the observed late summer peak of TA at DYFAMED/PointB sites, which may be partly attributed to the advection of lower alkalinity Atlantic water in the area. The seasonal variability of DIC and pCO2@20°C was found to be mainly controlled by winter mixing and the subsequent increase of primary production and net CO2 biological uptake, which appeared overestimated at HCB. Along with the reference simulation, three sensitivity simulations were performed, de-activating the effect of biology, evaporation and CO2 air-sea fluxes on DIC and TA, in order to gain insight on the processes regulating the simulated carbonate system variability. The effect of biological processes on DIC was found more significant (peak during spring) in the more productive North Western Mediterranean, while evaporation had a stronger impact (peak during late summer) in the Levantine basin. CO2 air-sea flux was higher in the Western Mediterranean, particularly the Gulf of Lions and Alboran Sea, as well as in river influenced areas, such as the N. Adriatic and along the pathway of the Black Sea Water in the Aegean. A weak release of CO2 was found in the Eastern Levantine and Libyan Sea. Its basin average (+2.1 mmol/m2/day) and positive trend (+0.1 mmol/m2/day/year) indicates a gradually increasing net CO2 ocean uptake. The simulated positive trends of DIC (0.77 μmol/kg/year) and TA (0.53 μmol/kg/year) in the North Western Mediterranean were consistent with observational and modelling studies, in constrast with the Levantine basin, where no significant trends were found for TA.
1 Introduction
It is now recognized that ocean is a significant sink of CO2 (e.g., Sabine et al., 2004; Gruber et al., 2019), providing a buffer for anthropogenic carbon emissions and regulating global climate (Archer et al., 2009). A consequence of the CO2 oceanic uptake is the resulting decrease of pH and carbonate ions concentration, commonly known as ocean acidification (Caldeira and Wickett, 2003), which may have implications (e.g., survival, growth, abundance) over a broad range of calcifying marine organisms in the open ocean (e.g., coccoliths, foraminifera) and coastal areas (e.g., corals, mollusks) (e.g., Kroeker et al., 2013; Leung et al., 2022).
The Mediterranean is a semi-enclosed oligotrophic basin, characterized by a well-defined eastward decreasing productivity (e.g., Moutin and Raimbault, 2002; Bosc et al., 2004; Kalaroni et al., 2020b). It is characterized by relatively higher alkalinity, as compared to the global ocean, due to high evaporation and lateral inputs from rivers and the Black Sea (Schneider et al., 2007). Its more alkaline waters, as well as the deep-water formation and fast overturning circulation, favor the absorption of CO2 and its efficient transfer to deeper layers (Schneider et al., 2010; Alvarez et al., 2014; Palmiéri et al., 2015; Krasakopoulou et al., 2017; Hassoun et al., 2022). Given the important complexity of the Mediterranean ecosystem, long-term in situ measurements and dedicated modelling studies are required, in order to be able to assess and predict CO2 storage and acidification trends in the basin.
Understanding carbonate system dynamics is fundamental for optimizing observational strategies and shaping climate change policies with more precise predictions. Given the limited spatio-temporal coverage of in situ data, coupled hydrodynamic/biogeochemical models provide useful tools to gain a better understanding on the carbonate system seasonal and inter-annual variability, quantify the role of different processes (e.g., Carroll et al., 2022) and perform future projections under changing climate conditions (e.g., Reale et al., 2022; Solidoro et al., 2022). Over the last decade, a few modelling studies have investigated different aspects of the carbonate system dynamics in the Mediterranean. Cossarini et al. (2015a) provided a basin-scale analysis on the spatio-temporal variability of alkalinity in the Mediterranean, while Cossarini et al. (2015b) investigated the mechanisms of CO2 sequestration in the N. Adriatic Sea. Cossarini et al. (2021) provided aspects of the carbonate system variability and inter-annual trends, based on the Mediterranean re-analysis over the last two decades (1999-2019), as part of the Copernicus Marine Environment Monitoring Service (CMEMS) model product. Solidoro et al. (2022) investigated the changes on the Mediterranean plankton productivity, carbon pathways and carbonate system, under a high CO2 emission (SRES-A2) future climate scenario. Reale et al. (2022) used a relatively higher (1/16°) spatial resolution model to provide a detailed assessment of future climate projected changes in the Mediterranean ecosystem (nutrients, oxygen, plankton production/biomass, dissolved inorganic carbon, pH), under two CO2 emission scenarios (RCP4.5, RCP8.5). Butenschön et al. (2021) investigated the projected acidification in the Mediterranean, under a baseline future scenario (RCP4.5), along with additional alkalization scenarios. Finally, Palmiéri et al. (2015), used a perturbation approach, not explicitly describing biogeochemical processes, to simulate the anthropogenic carbon storage and resulted acidification in the Mediterranean, influenced by air-sea fluxes and exchanges with the Atlantic Ocean.
A major constraint for the successful setup and implementation of carbonate system models is the limited spatio-temporal coverage of in situ data, which are necessary for the model initial and boundary conditions, as well as to validate the simulated output. Even though the amount of available in situ data on carbonate parameters in the Mediterranean has significantly increased over the last decade, previous modelling efforts have not explicitly investigated the dynamics of the carbonate system variability, while model validation was mostly limited to basin-scale spatial variability. In the present study, a basin-scale Mediterranean carbonate system model has been setup, building on the POSEIDON operational biogeochemical model (Kalaroni et al., 2020a; Kalaroni et al., 2020b). The model output from a 13-year (2010-2022) simulation was evaluated against CARIMED (CARbon IN the MEDiterranean Sea, Alvarez et al., 2019) basin-scale dataset and time-series from three sites in the Western (DYFAMED, Villefranche-PointB) and Eastern (HCB) Mediterranean. Three additional sensitivity simulations, de-activating the effect of biology, freshwater and air-sea CO2 fluxes, were performed in order to gain a better understanding on the carbonate system dynamics and the processes regulating its variability. The simulated CO2 air-sea flux spatial variability and calculated inter-annual trends are also discussed.
2 Methods
2.1 Model description
2.1.1 Hydrodynamic/biogeochemical model
A three-dimensional coupled hydrodynamic/biogeochemical model is implemented at Mediterranean basin scale (1/10° resolution ~10km), based on the currently operational model within POSEIDON forecasting system (www.poseidon.hcmr.gr; Korres et al., 2007; Kalaroni et al., 2020a, b). The hydrodynamic model is based on the Princeton Ocean Model (POM, Blumberg and Mellor, 1983), which is a three-dimensional, sigma-coordinate and free surface primitive equation model. The model prognostic variables are temperature, salinity, velocity, sea surface height and turbulent kinetic energy. The vertical eddy viscosity and diffusivity coefficients are computed using the Mellor-Yamada 2.5 turbulence closure scheme (Mellor and Yamada, 1982) that solves the equations for turbulent kinetic energy and turbulence macroscale, considering the wind stirring and the stability induced by stratification. Horizontal diffusion is calculated along sigma-levels following a Smagorinsky formulation (Smagorinsky, 1963).
The biogeochemical model is based on the European Regional Seas Ecosystem Model (ERSEM; Baretta et al., 1995) that follows a “functional” group approach, including four phytoplankton groups (diatoms, nanoplankton, picoplankton, dinoflagellates), three zooplankton groups (heterotrophic nanoflagellates, microzooplankton, mesozooplankton) and bacteria. The pelagic model variables include also particulate and dissolved organic matter, along with dissolved inorganic nutrients (nitrate, ammonium, phosphate, silicate). The benthic-pelagic coupling is described by a simple first-order benthic return module, describing the settling of organic detritus and diffusional nutrient fluxes out of the sediment. For more details on the model setup and implementation, the interested reader may refer to Kalaroni et al. (2020a); Kalaroni et al. (2020b), where the model has been extensively validated against available satellite and in situ data.
2.1.2 Carbonate system model
The hydrodynamic/biogeochemical model POM-ERSEM has been coupled to a carbonate system sub-model (Blackford and Gilbert, 2007), which uses the HALTAFALL (Ingri et al., 1967) carbonate speciation code to calculate the CO2 partial pressure (pCO2), pH and carbonate system components (H2CO3, HCO3, CO3) in the water column, using dissolved inorganic carbon (DIC) and total alkalinity (TA) as input. The carbonic acid dissociation constants are based on Hanson and Mehrbach data, as refitted by Dickson and Millero (1987) and dissociation constant for HSO4 from Dickson (1990). pH is calculated in the sea water scale (SWS). The carbonate system model has been setup in the Mediterranean considering both DIC and TA as model state variables (submitted to advection, diffusion etc.). The seawater pCO2 is influenced by biogeochemical (i.e., photosynthesis, respiration) and physical (solubility/temperature) processes, as well as by the air-sea CO2 exchange, based on the pCO2 difference with the atmosphere. The CO2 flux across the air-sea interface is calculated as a function of temperature, wind speed and the difference between the seawater (pCO2water) and atmospheric (pCO2air) partial pressure of CO2:
where H is the solubility of CO2 in seawater, based on Weiss (1974) and k is the gas transfer coefficient, which is calculated following Nightingale et al. (2000) as:
where U10 is the wind speed 10m above water (m/s) and Sc is the temperature depending Schmidt number.
The variability of TA and DIC is evaluated in the model based on the effect from advection/diffusion (phys) and biological (bio) processes:
At the sea surface, these are also affected by freshwater (E-P) fluxes, which result in their concentration (evaporation) or dilution (precipitation), as in the case of salinity. DIC is also modified based on the CO2 flux (CO2flux, Equation 1) at the air-sea interface, which can be positive or negative, depending on the pCO2air and pCO2water values. With regard to biological processes, TA is increased (decreased), with the same amount of moles, by the uptake (release) of nitrates and phosphates or the release (uptake) of ammonia (Wolf-Gladrow et al., 2007). Similarly, DIC is decreased by the CO2 uptake from phytoplankton photosynthesis and increased by CO2 production from plankton community respiration. The effect of calcium carbonate formation/dissolution on TA and DIC is currently not considered, as calcifying organisms are not explicitly described in the model and information on their abundance and distribution in the Mediterranean is still poorly quantified (e.g., Siokou-Frangou et al., 2010).
2.2 Model setup
A 13-year simulation was performed over the 2010-2022 period. The initial conditions for the hydrodynamic (e.g., temperature, salinity, currents) and biogeochemical (e.g., dissolved inorganic nutrients, plankton groups biomass) models were obtained from Kalaroni et al. (2020a, b) simulation. The initial fields for DIC and TA (Figure 1) were obtained from GLODAP.v2.2016b global gridded fields (1° x 1° resolution, available in Copernicus database, Lauvset et al., 2016), which are based on in situ data from 1972-2013 period. Prior to the 13-year simulation, a 2.5-year spin-up (2010-2011 repeated) was performed starting from June, assuming that the initial DIC and TA fields represent spring period, which is close to the yearly mean, considering the DIC/TA seasonal variability. This 2.5-year spin-up was found sufficient for the purposes of the present study, focusing on the near surface carbonate system variability. At the model open boundary, west of the Gibraltar straits, DIC and TA during water inflow were obtained from GLODAP annual climatology fields (Figure 1). Deeper layer DIC and TA are restored to their initial fields, applying a weak relaxation (timescale:1 year) in order to prevent a systematic model drift over the long-term simulation. Average river inputs of TA and DIC for major Mediterranean rivers were obtained from GEMS/GLORI database (Schneider et al., 2007, http://www.gemswater.org) and available data from the literature (Skoulikidis, 1993, for North Aegean rivers). Average TA and DIC concentration of the inflowing Black Sea Water (BSW) was adopted from Copin-Montegut (1993). The concentration of atmospheric CO2 was assumed to linearly increase from ~375.2 µatm during 2002 to ~417 µatm during 2022 (~2.1 µatm/year), based on in situ data from ICOS-FINOKALIA station (Crete Isl., Greece, Gialesakis et al., 2023). This is quite similar to the trend (2.08 µatm/year) based on in situ data from Plateau Rosa, Italy (Kapsenberg et al., 2017).
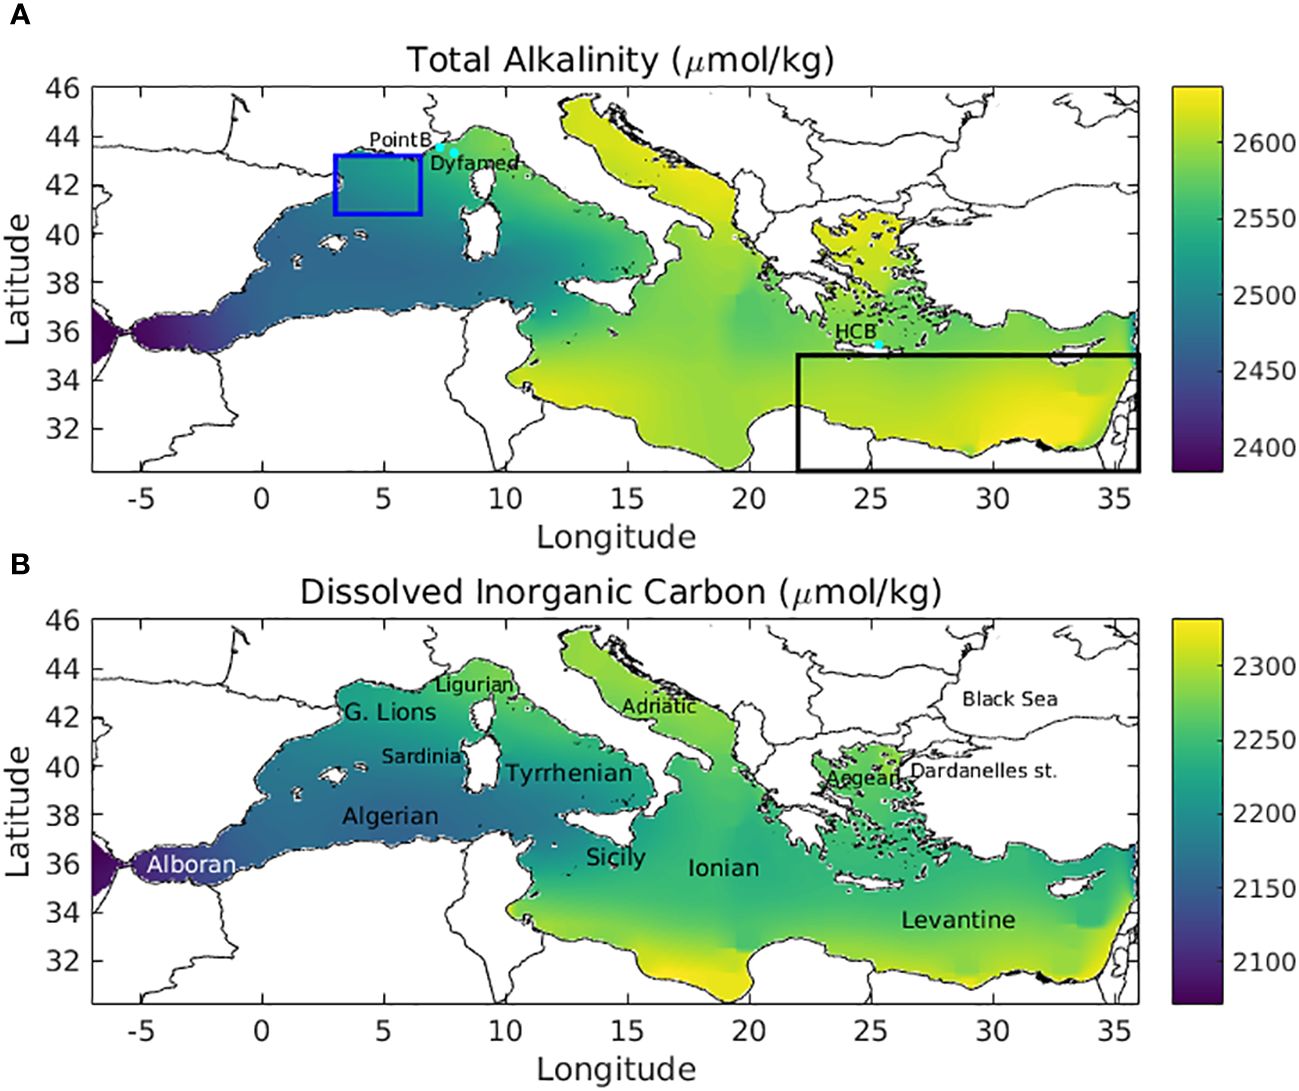
Figure 1 Initial fields for (A) total alkalinity (µmol/kg) and (B) dissolved inorganic carbon (µmol/kg), interpolated in the model grid from Glodap.v2.2016b global gridded fields (1° x 1° resolution, available in Copernicus database). DYFAMED, Point-B and HCB stations are indicated with cyan dots, as well as Gulf of Lions and Levantine basin areas, over which model outputs are averaged in Figures 6–8.
The atmospheric forcing was obtained from the POSEIDON operational weather forecast (Papadopoulos and Katsafados, 2009), using the bulk formulae set from Korres and Lascaratos (2003) for the calculation of momentum, heat and freshwater fluxes at the air-sea interface.
Along with the 13-year reference simulation, three additional sensitivity simulations were performed over the 2010-2014 period, de-activating the effect of biology, freshwater and air-sea CO2 fluxes on DIC and TA (Equations 3, 4), in order to gain a better understanding on the processes regulating the model simulated carbonate system variability. To evaluate the overall effect of different processes (see section 3.3), the difference between the mean (2010-2014) DIC, TA, pCO2 and air-sea CO2 flux, obtained from the reference and sensitivity simulations was calculated in two representative areas (Gulf of Lions: increased mixing and primary production, Levantine basin: stratification, low primary production), along with the basin-scale average. A monthly mean (2010-2014) climatology from the reference and sensitivity simulations was also calculated to investigate the seasonal variability in the contribution of different processes in the two areas (Gulf of Lions, Levantine basin) (see section 3.3).
We should note that seasons in the present study are shifted by one month, as compared to meteorological seasons, to account for the thermal inertia of the ocean. Thus, winter, throughout the text, refers to January-March period, spring to April-June etc.
2.3 Validation datasets
The model simulated DIC and TA spatial variability was evaluated against CARIMED dataset, which includes carbonate in situ data (TA, DIC) from several cruises in the Mediterranean from 1976 until 2018 (Alvarez et al., 2019). From CARIMED data (DIC, TA, Temperature, Salinity), pCO2 data were calculated using CO2SYS software (Lewis and Wallace, 1998), with carbonic acid dissociation constants from Mehrbach et al. (1973), as refitted by Dickson and Millero (1987) and dissociation constant for HSO4 from Dickson (1990), as recommended by Alvarez et al. (2014).
The model simulated carbonate system temporal variability was also validated against available in situ near surface data from DYFAMED (7.9° E, 43.3° N, Ligurian Sea), Villefranche-PointB (7.3°E, 43.5°N, Ligurian Sea, 85m bottom depth) and Heraklion Coastal Buoy (HCB, 35.43°N, 25.07°E, Crete Isl., 180 m bottom depth) sites. DYFAMED in situ near surface data (DIC, TA, pH) over 2010-2019 period were obtained from DYFAMED database (Marty, 2002; Coppola et al., 2021). Villefranche-PointB in situ surface (1m) data (DIC, TA, pCO2) over 2010-2019 period were obtained from PANGAEA database (doi:10.1594/PANGAEA.727120, Kapsenberg et al., 2017). HCB data included high-frequency pH (3-hour, December 2020 - July 2022) and pCO2 (6-hour, December 2020 - November 2022) data, obtained from two sensors, deployed at near-surface (~1.5m) water, as well as monthly surface (~2m) in situ DIC and TA data, from Niskin bottle water samples. Additional pCO2 data were also derived from pH and TA (bottle) data, using CO2SYS (version 3.0, Pierrot et al., 2021) software (see Frangoulis et al., 2024, this issue, for more details on HCB data).
Model simulated sea surface height and temperature were compared against satellite altimetry (~12 km resolution) and sea surface temperature (~4 km resolution) data, obtained from the European Copernicus data base (http://marine.copernicus.eu/), while simulated Chl-a was compared against GLOBCOLOUR (www.globcolour.info) monthly merged chlorophyll-a data(~4 km resolution). Model simulated sea surface salinity was compared against the CMEMS Mediterranean re-analysis salinity product (http://marine.copernicus.eu/).
pCO2 at DYFAMED and pH at Villefranche-PointB were calculated from TA, DIC and temperature/salinity in situ data, using CO2SYS software (Lewis and Wallace, 1998), with the carbonic acid dissociation constants mentioned above for CARIMED data. pH calculated at Villefranche-PointB, as well as pH in situ data at HCB and DYFAMED, are all expressed in total scale. HALTAFALL speciation code uses a different pH scale (SWS) and dissociation constants (see section 2.1.2). The introduced mean model bias (model-data) from using different dissociation constants and pH scales, as calculated with CO2SYS software, was found approximately -0.016 for pH at PointB, +16.9 µatm for pCO2 at DYFAMED and +16.5 µatm for pCO2 from CARIMED data. pCO2 at constant temperature (pCO2@20°C) was calculated, using the Takahashi et al. (2002) empirical formula on pCO2 solubility temperature dependence, which largely drives the pCO2 seasonal variation. The variability of this temperature normalized pCO2 (or non-thermal pCO2) may, thus, be more directly related with other physical (e.g., mixing, advection, air-sea CO2flux) and biological processes (see discussion in section 3.3). Moreover, it can be used to distinguish the effect of increasing air pCO2 from that of increasing water temperature on pCO2 long-term trends (see discussion in section 3.2).
3 Results
3.1 Model validation
In Figure 2 (see also Supplementary Figure S.1), the simulated mean (2010-2022) surface DIC, TA and pCO2 fields are compared (same locations and seasons) with CARIMED data (pCO2 calculated from TA and DIC). The observed spatial variability is reasonably captured (pearson correlation: r~0.6 for DIC, r~0.8 for TA, r~0.5 for pCO2, see Supplementary Figure S.2). This is to a point expected, since the model initial DIC and TA fields from the GLODAP climatology are based on a dataset (1972-2013) that largely overlaps with CARIMED (1976-2018). However, the GLODAP gridded fields still present some deviations from the CARIMED actual data, due to smoothing/extrapolation in areas with scarce data availability and also due to the additional data in CARIMED over the 2013-2018 period. In any case, such a comparison ensures that the model does not have a significant bias/drift, preserving the dynamics in different areas of the Mediterranean (see also Supplementary Figures S.3, S.4). A model deviation (also seen in the GLODAP initial fields) is the overestimation of DIC and TA along the pathway of Atlantic water in the Algerian basin and Sicily channel. Another model deviation, which is also seen in the initial fields and is partly removed in the model simulation, is the underestimation of DIC and TA in the North Western Mediterranean (Gulf of Lions and Ligurian Sea). One may also notice the simulated increased TA in the Northern Adriatic, in agreement with the data, which is due to higher alkalinity riverine inputs. Finally, the simulated TA appears slightly overestimated (~15 µmol/kg on average) in the Eastern Levantine (see also Supplementary Figure S.4) and Ionian basins. This might be partly attributed to a model overestimation of evaporation fluxes, as the adopted basin-average mean (2010-2022) evaporation-precipitation flux (~0.88 m/yr) is slightly higher, as compared to existing estimates (0.7 m/yr, Béranger et al., 2005) and also to a small bias of the initial fields, as compared to the data (see Figures 2A, C; Supplementary Figures S.1B, E). The simulated pCO2 appears slightly underestimated in the Gulf of Lions, similar with DIC, mentioned above and in the Levantine basin (see also Supplementary Figure S.4), which is due to the overestimation of TA, mentioned above. In the Alboran Sea, an overestimation of pCO2 may be also seen, which might be due to the relatively lower TA, as compared to DIC (see also Supplementary Figure S.4), although the few DIC/pCO2 data points in this area may be not sufficient for such a comparison. In any case, as the Alboran Sea is directly influenced by the Atlantic water inflow, model deviations in this area suggest that the adopted boundary conditions for TA and DIC may be slightly biased. This bias may be related to the small amount of in situ data, used to derive the GLODAP annual climatology, not properly resolving the seasonal variability of the Atlantic water TA and DIC.
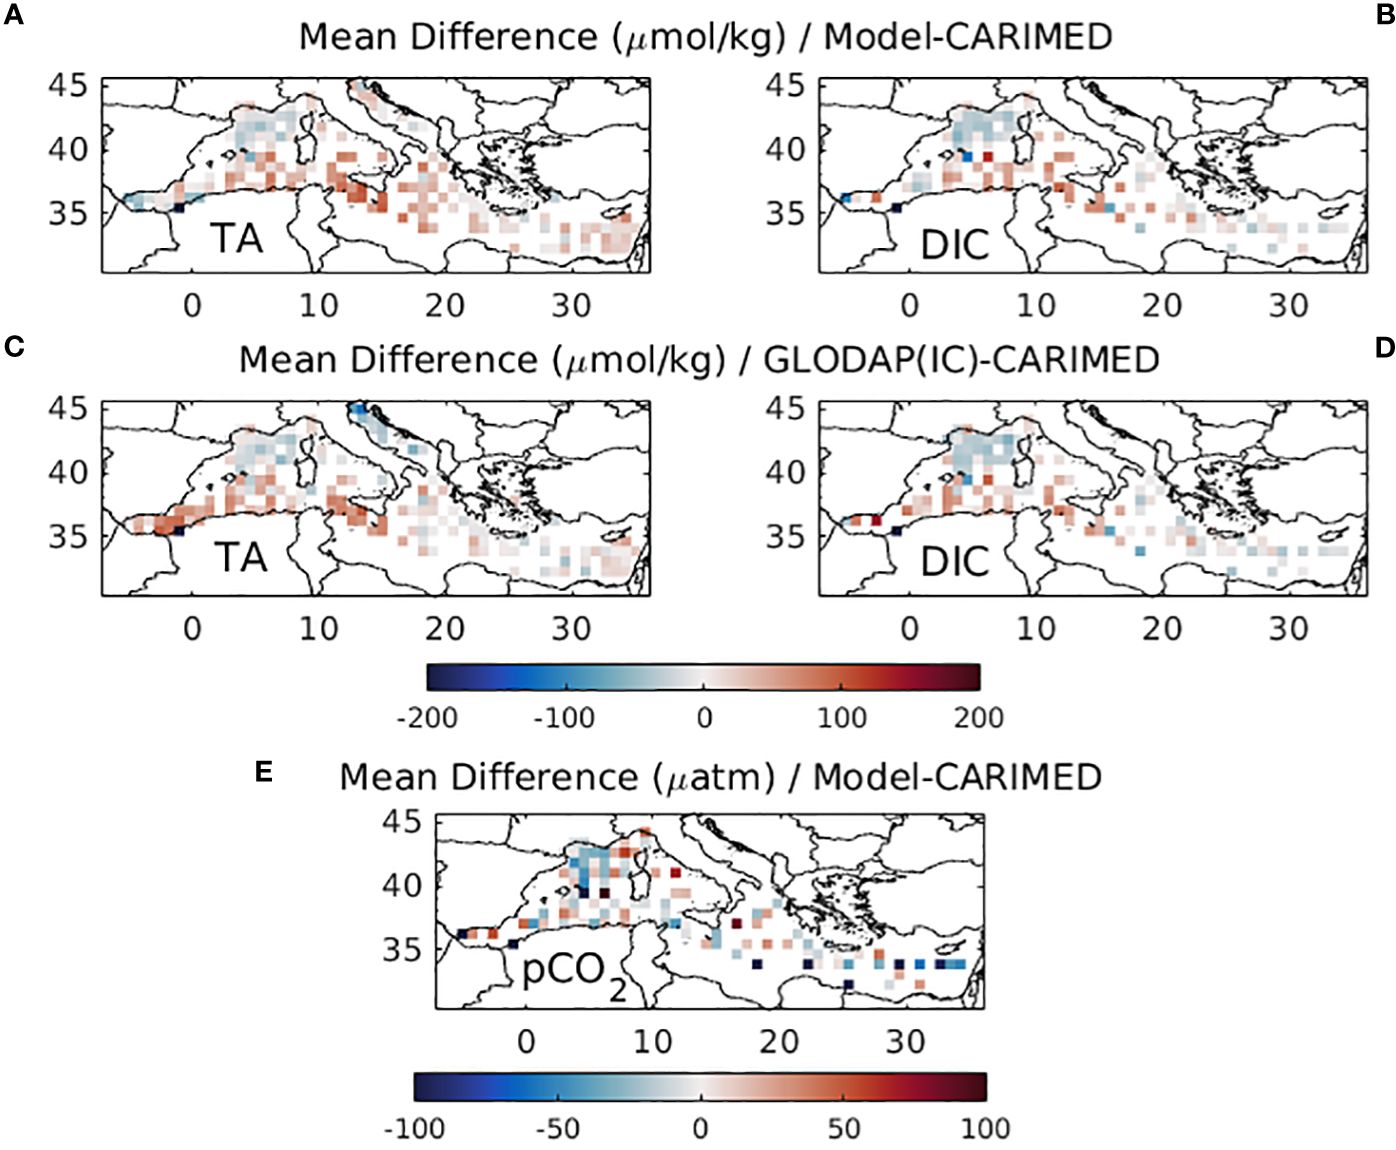
Figure 2 Difference between mean (2010-2022) simulated surface (A) total alkalinity (µmol/kg, TA), (B) dissolved inorganic carbon (µmol/kg, DIC) and (E) pCO2 (µatm), against CARIMED data. Difference between GLODAP initial model TA and DIC and CARIMED data are also shown in (C, D). Model values are extracted on the same locations and seasons with the data.
In Figure 3, the simulated carbonate system variables (DIC, TA, pCO2, pH) are shown against available insitu data at HCB, DYFAMED and Villefranche-PointB stations. The simulated DIC seasonal variability is found in reasonable agreement with insitu data (see also Supplementary Figures S.5, S.6), particularly at DYFAMED and Villefranche-PointB stations. A time-lag (1-2 months) of the simulated DIC winter peak, as compared with the data, may be noticed during some years (e.g. 2012, 2013, 2016, 2019) at Villefranche-PointB station (see discussion in section 4). At HCB station, the simulated DIC is found within the range of observations, which does not exhibit a clear seasonal pattern. The simulated pCO2 and pH show an overall reasonable agreement with insitu data (see also Supplementary Figures S.5, S.6). At all sites, a generally stronger seasonal variability of pCO2 and pH may be seen, as compared with DIC, which is largely driven by the temperature dependence of pCO2 solubility. The simulated pH appears slightly underestimated during autumn and overestimated during late winter-spring, which is mostly noticable at HCB (mean model-data, autumn: -0.016, winter-spring: +0.029) and during some years at Villefranche Point-B station (mean model-data, autumn: -0.012, winter-spring: +0.019). This model deviation of pH at Villefranche PointB is associated with the time lag mentioned above for DIC (see discussion section 4). The opposite pattern may be seen for pCO2 at Villefranche Point-B (i.e., overestimation during autumn and underestimation during late winter-spring). At HCB station, the simulated pCO2 appears slightly underestimated, particularly during spring period. The simulated TA presents a similar variability with DIC (pearson correlation DYFAMED and Villefranche PointB: r=0.95, HCB: r=0.79), showing a peak during winter due to increased vertical mixing, while a secondary peak, related with evaporation, is simulated during late summer/autumn. This TA secondary peak is more clearly visible at HCB, where simulated TA appears reasonably close to the observations.
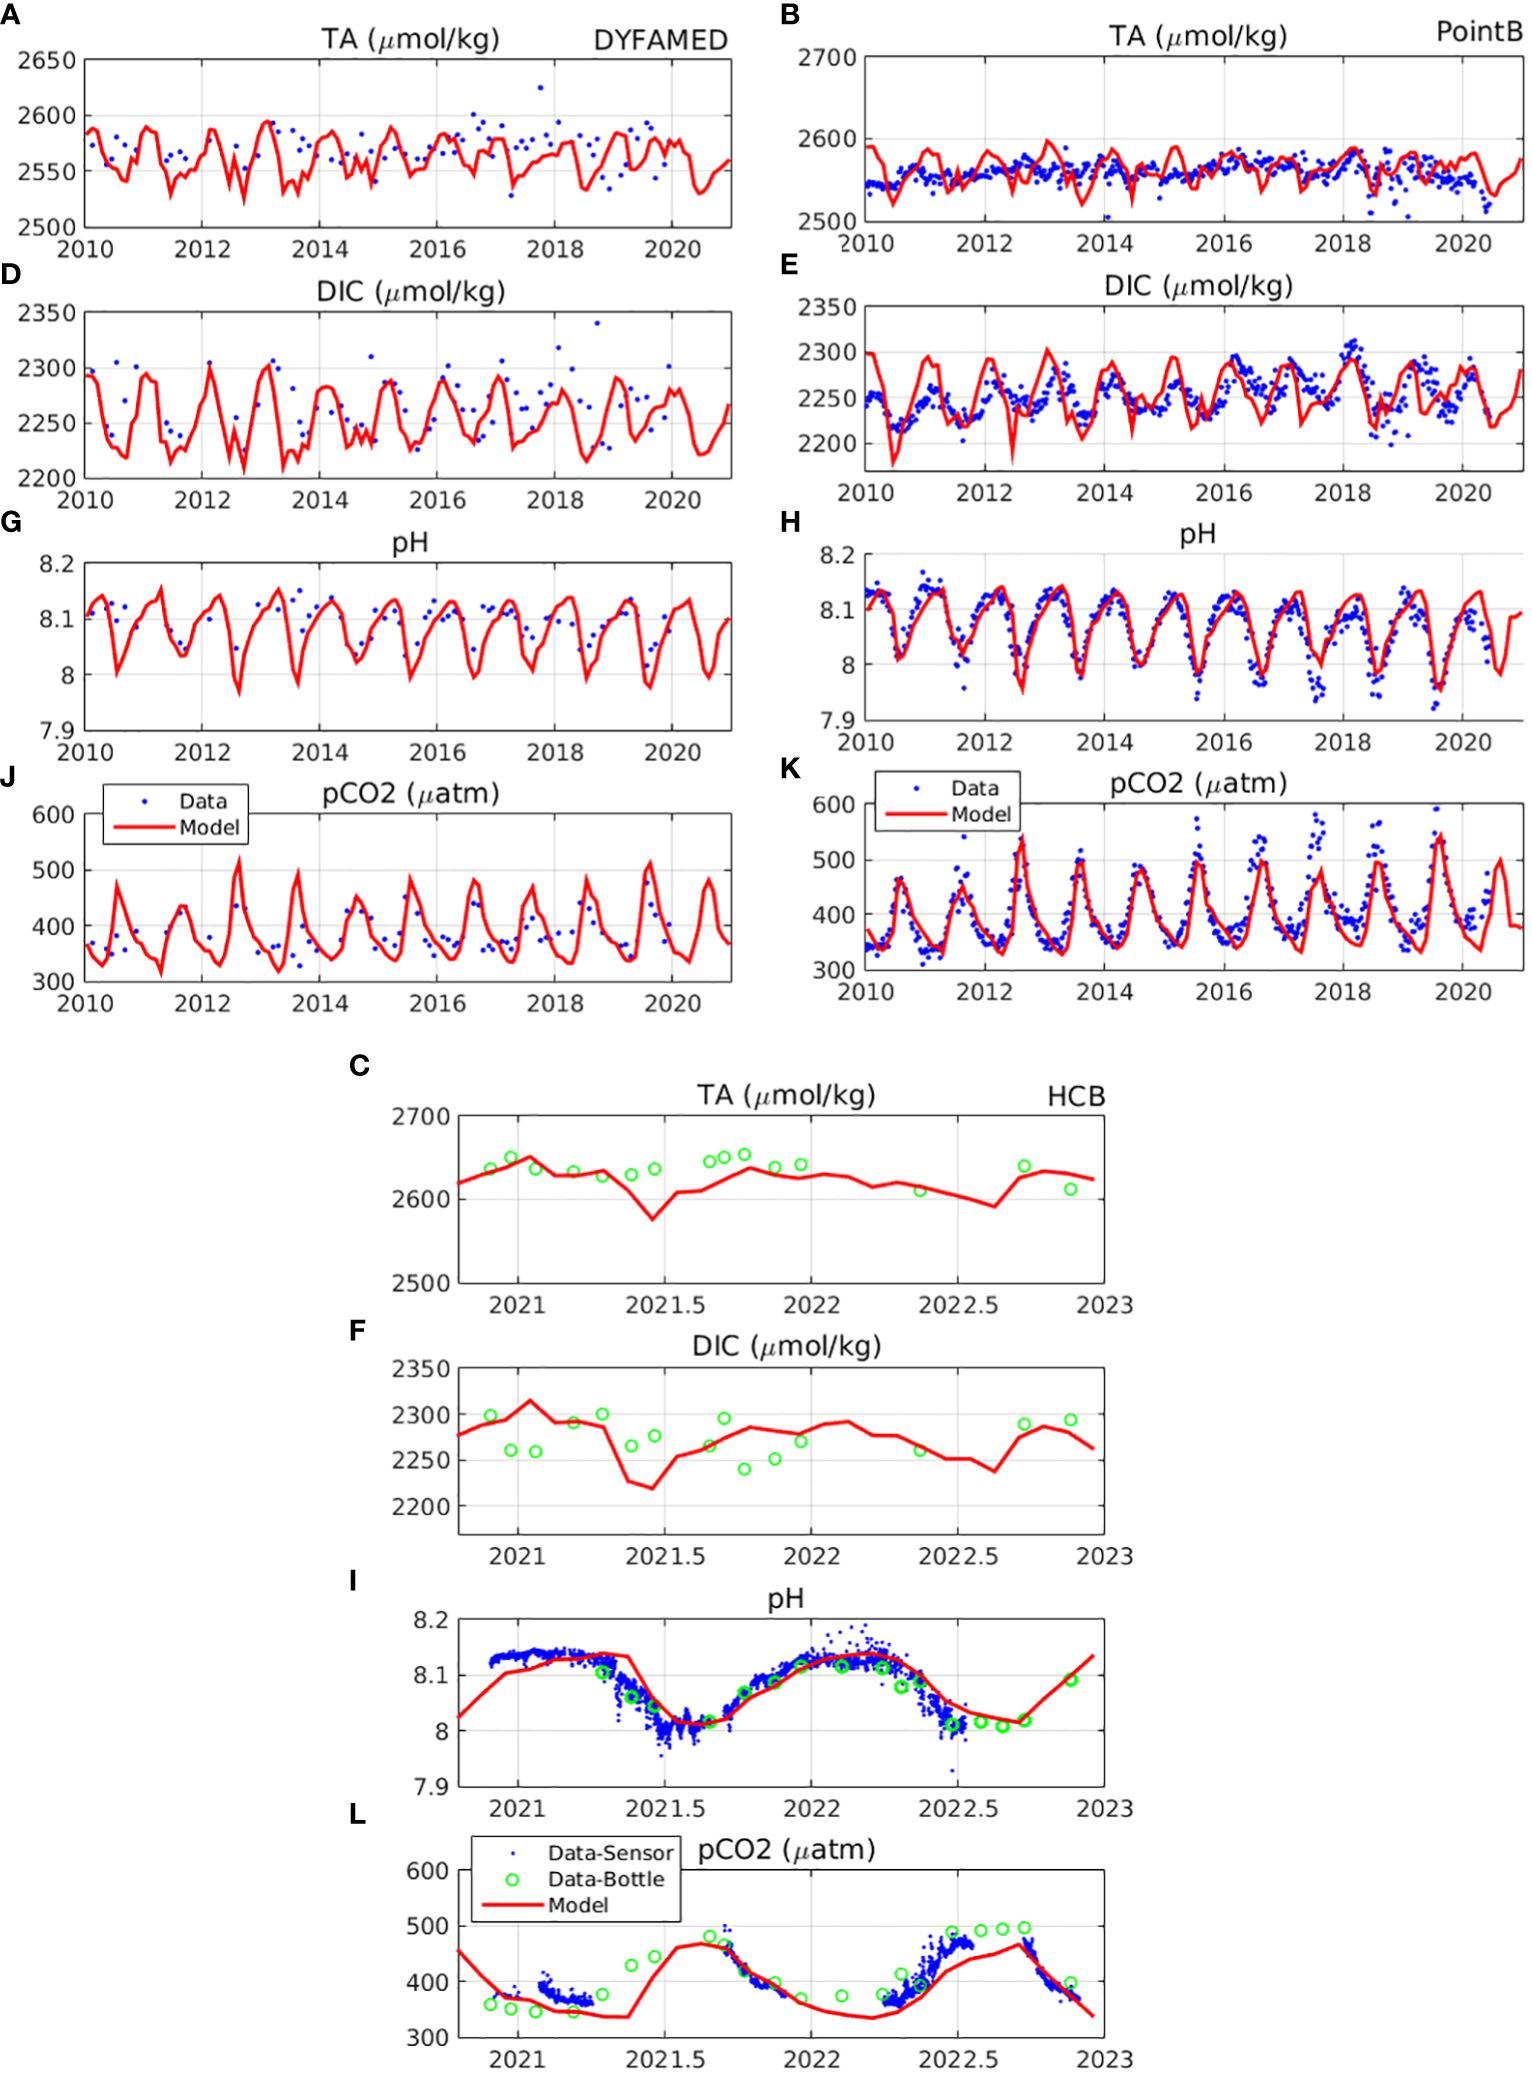
Figure 3 Model simulated (red line) surface (A-C) total alkalinity (µmol/kg, TA), (D-F) dissolved inorganic carbon (µmol/kg, DIC), (G-I) pH and (J-L) water pCO2 (µatm), at DYFAMED (7.9° E, 43.3° N), Villefranche PointB (7.3° E, 43.5° N) and HCB (25.07° E, 35.43° N) respectively, compared with available insitu data (blue dots). For HCB station blue dots refer to data from the pH and pCO2 sensors, while green open circles refer to bottle data (see section 2.3).
As insitu data for TA do not show a clear seasonal pattern in all sites, a monthly climatology was derived from all available data (Figure 4), in order to gain a better understanding on the seasonality of different variables. At Villefranche-PointB station, the climatology of TA in situ data is characterized by a double peak during winter and later summer-autumn, which appears similar to the seasonality of salinity, being mostly controlled by mixing and evaporation. A less clear variability may be seen for TA at DYFAMED. The simulated salinity shows a similar pattern with the observed seasonality, peaking at winter and late summer. However, the simulated TA shows a stronger decrease during spring and fails to reproduce the observed late summer-autumn peak (see discussion in section 4). At both Villefranche-Point-B and DYFAMED, a much higher variability is simulated, as compared with the data. The resulting poor model skill in reproducing the observed TA seasonal variability is indicated by the low correlation coefficients at both sites (DYFAMED: r~0.04, PointB: r~0.13, see Supplementary Figure S.6). At HCB station, the derived climatology from just two years is characterized by significant uncertainty, particularly for TA and DIC, showing data gaps for a couple a months. Therefore, the observed seasonality may not be properly resolved, providing only some limited indication. The in situ TA data variability suggest some correlation with salinity, which is particularly noticed during March-June period and a relatively higher TA during August-October period. Such a correlation between TA and salinity has been also suggested from other studies in the Aegean Sea (e.g., Hassoun et al., 2015; González-Dávila et al., 2016). The model TA at HCB shows a double peak (February-March and September-October).
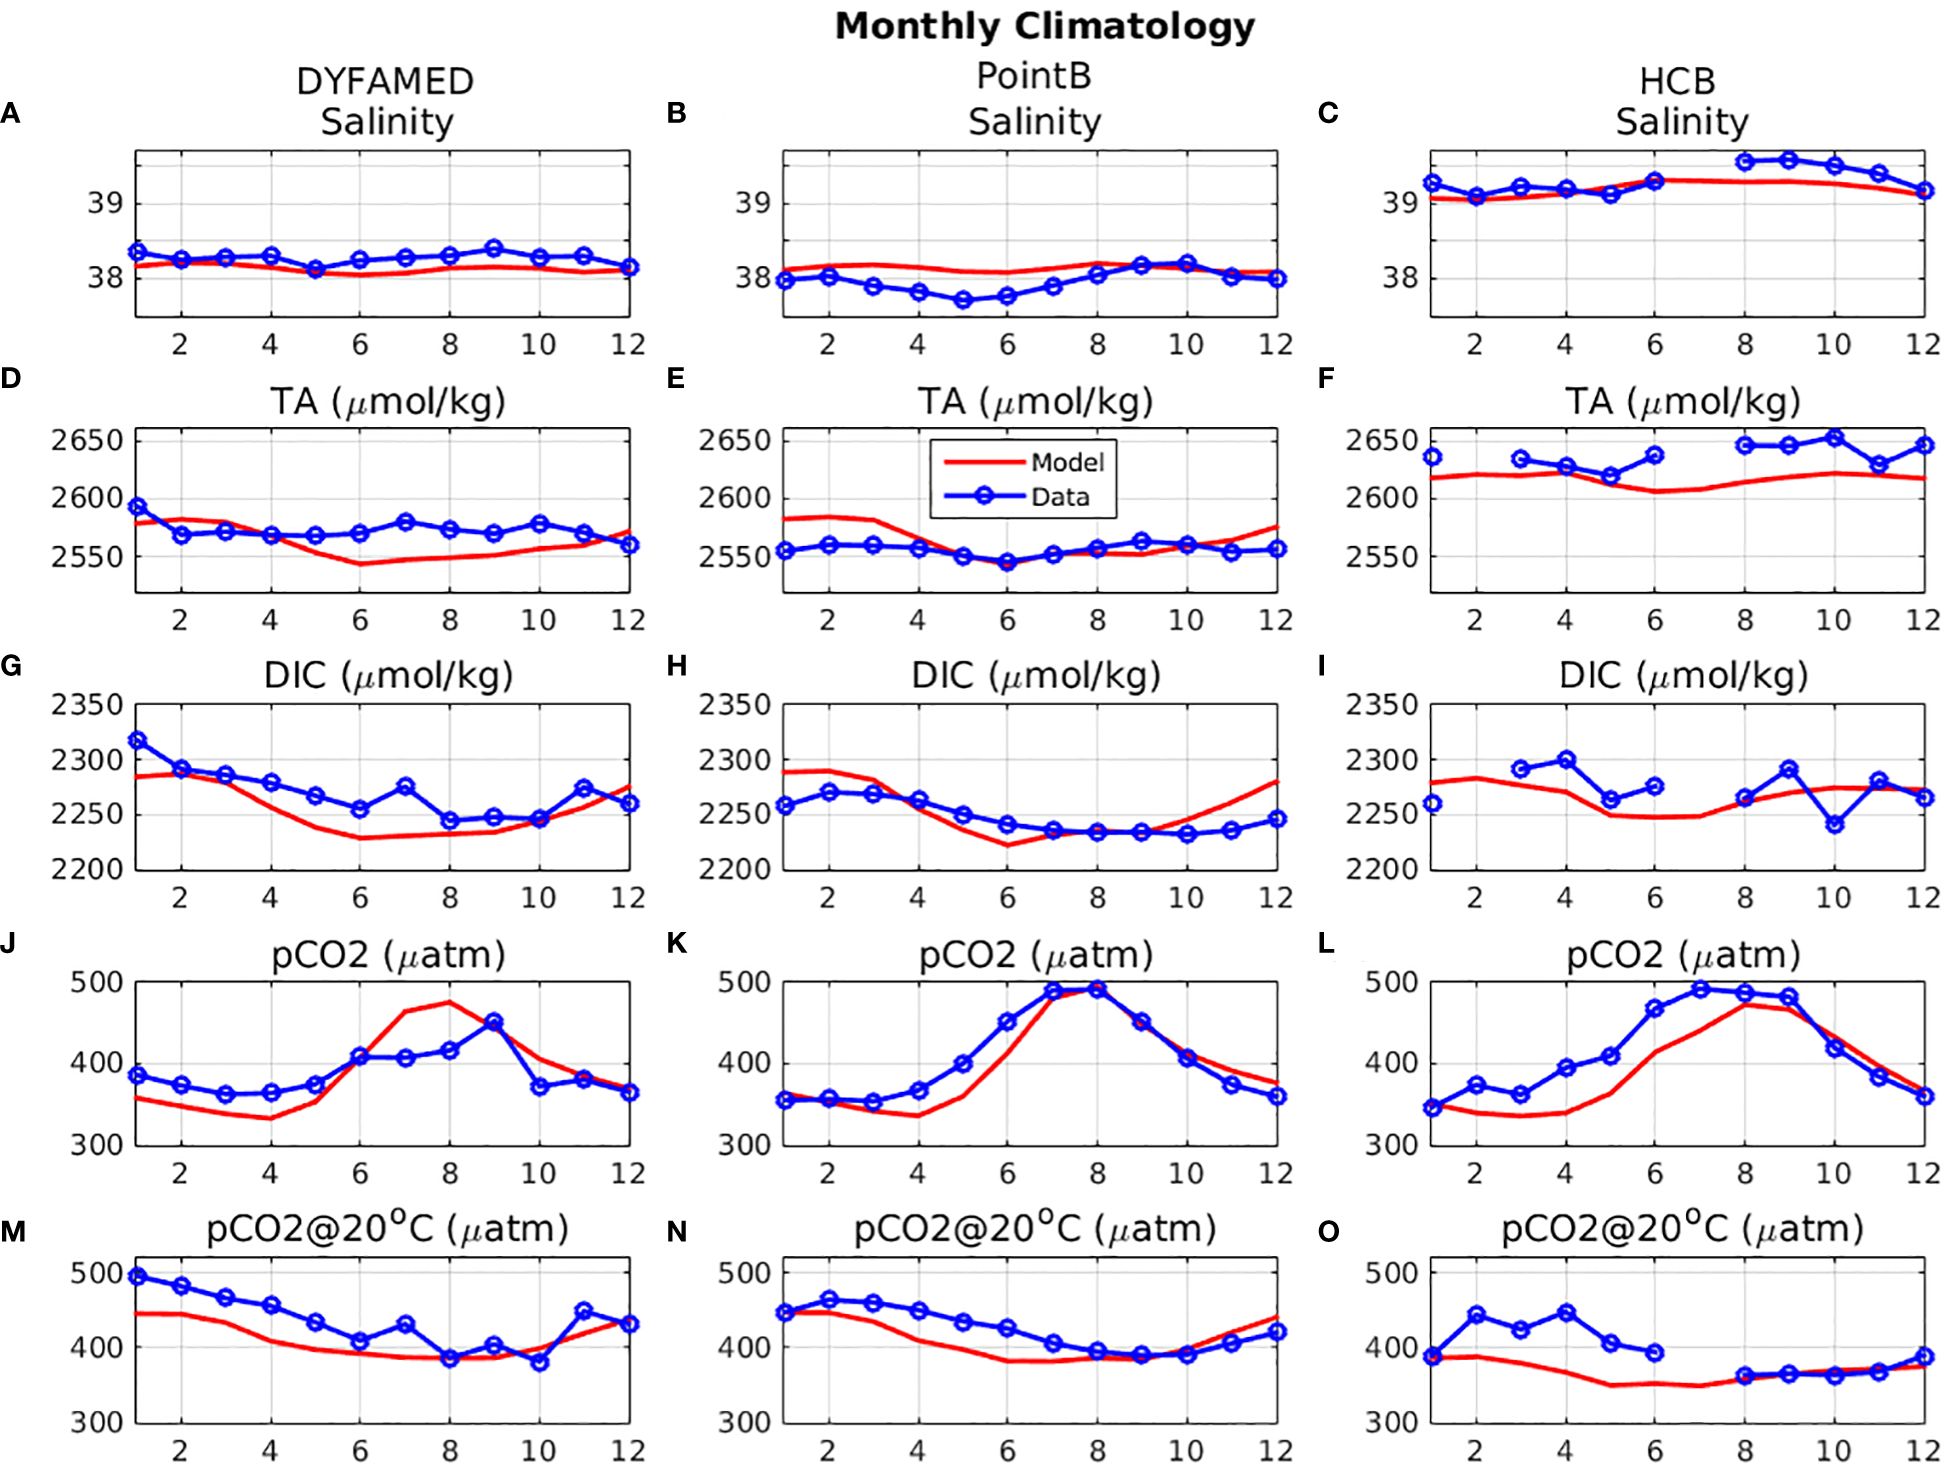
Figure 4 Monthly mean (2010-2020) climatology of model simulated (red line) (A-C) surface salinity, (D-F) total alkalinity (µmol/kg, TA), (G, H, I) dissolved inorganic carbon (µmol/kg, DIC), (J-L) water pCO2 (µatm) and (M-O) water pCO2@20°C (µatm), at (A, D, G, J, M) DYFAMED (7.9° E, 43.3° N),(B, E, H, K, N) Villefranche Point-B (7.3° E, 43.5° N) and (C, F, I, L, O) HCB (25.07° E, 35.43° N), compared with available in situ data (blue line) monthly climatology.
The simulated DIC reasonably captures the observed seasonality at DYFAMED and Villefranche Point-B, showing a peak during winter. The DIC variability appears slightly overestimated at Villefranche PointB. At HCB station, observations do not exhibit a clear seasonal pattern, but the simulated DIC is found within the observed range. One may notice that, in contrast with the other sites, DIC at HCB station follows a similar seasonality with TA, also showing a secondary peak during late summer/autumn. This peak is related with evaporation, being relatively more significant in the Eastern Mediterranean (see later discussion in section 3.3). The simulated DIC winter peak in all cases is related to increased mixing, which results in the entrainment of deeper water with relatively higher DIC concentration. After this peak, DIC starts to decrease, following its consumption by primary production that shows a peak in the same period (see Supplementary Figure S.7). The DIC decrease during spring period appears overestimated in the model, which is reflected also in the simulated pCO2 and particularly pCO2@20°C (see later discussion in section 4). During summer period, there is a small effect from remineralization processes, as net CO2 production (gross production-community respiration, see Supplementary Figure S.7) becomes sligtly negative (i.e. CO2 net production), at least at surface. This CO2 input from biological processes is however partly compensated by CO2 outgassing at the air-sea interface during summer (see discussion in the next section). The relatively lower seasonal variability of DIC at HCB (~35 µmol/kg), as compared to DYFAMED (~58 µmol/kg) and Villefranche PointB (~68 µmol/kg) is mostly related to the relatively lower primary production at HCB (see Supplementary Figure S.7).
3.2 CO2 air-Sea flux and annual trends
In Figure 5, the mean (2010-2022) air-sea CO2 flux (CO2flux), obtained from the 13-year simulation is shown. This is calculated from Equations 1, 2, based on the difference between water pCO2 from CO2 air concentration (pCO2air). As no spatial variability is adopted in the latter, the CO2flux largely depends on pCO2 seasonal variability (Figure 6) and whether this is above or below pCO2air. Net CO2 sink (positive values) can be seen in most of the Mediterranean, except some areas in the Eastern Levantine and the Libyan Sea that show a weak (>-1 mmol/m2/day) release of CO2. The simulated CO2 air-sea flux appears relatively higher in the Western Mediterranean, particularly the Gulf of Lions and Alboran Sea, as well as in river influenced areas, such as the N. Adriatic and N. Aegean and along the pathway of the Black Sea water intrusion in the Aegean. Similarly, relatively lower pCO2 (Figure 5) is simulated in the same areas.
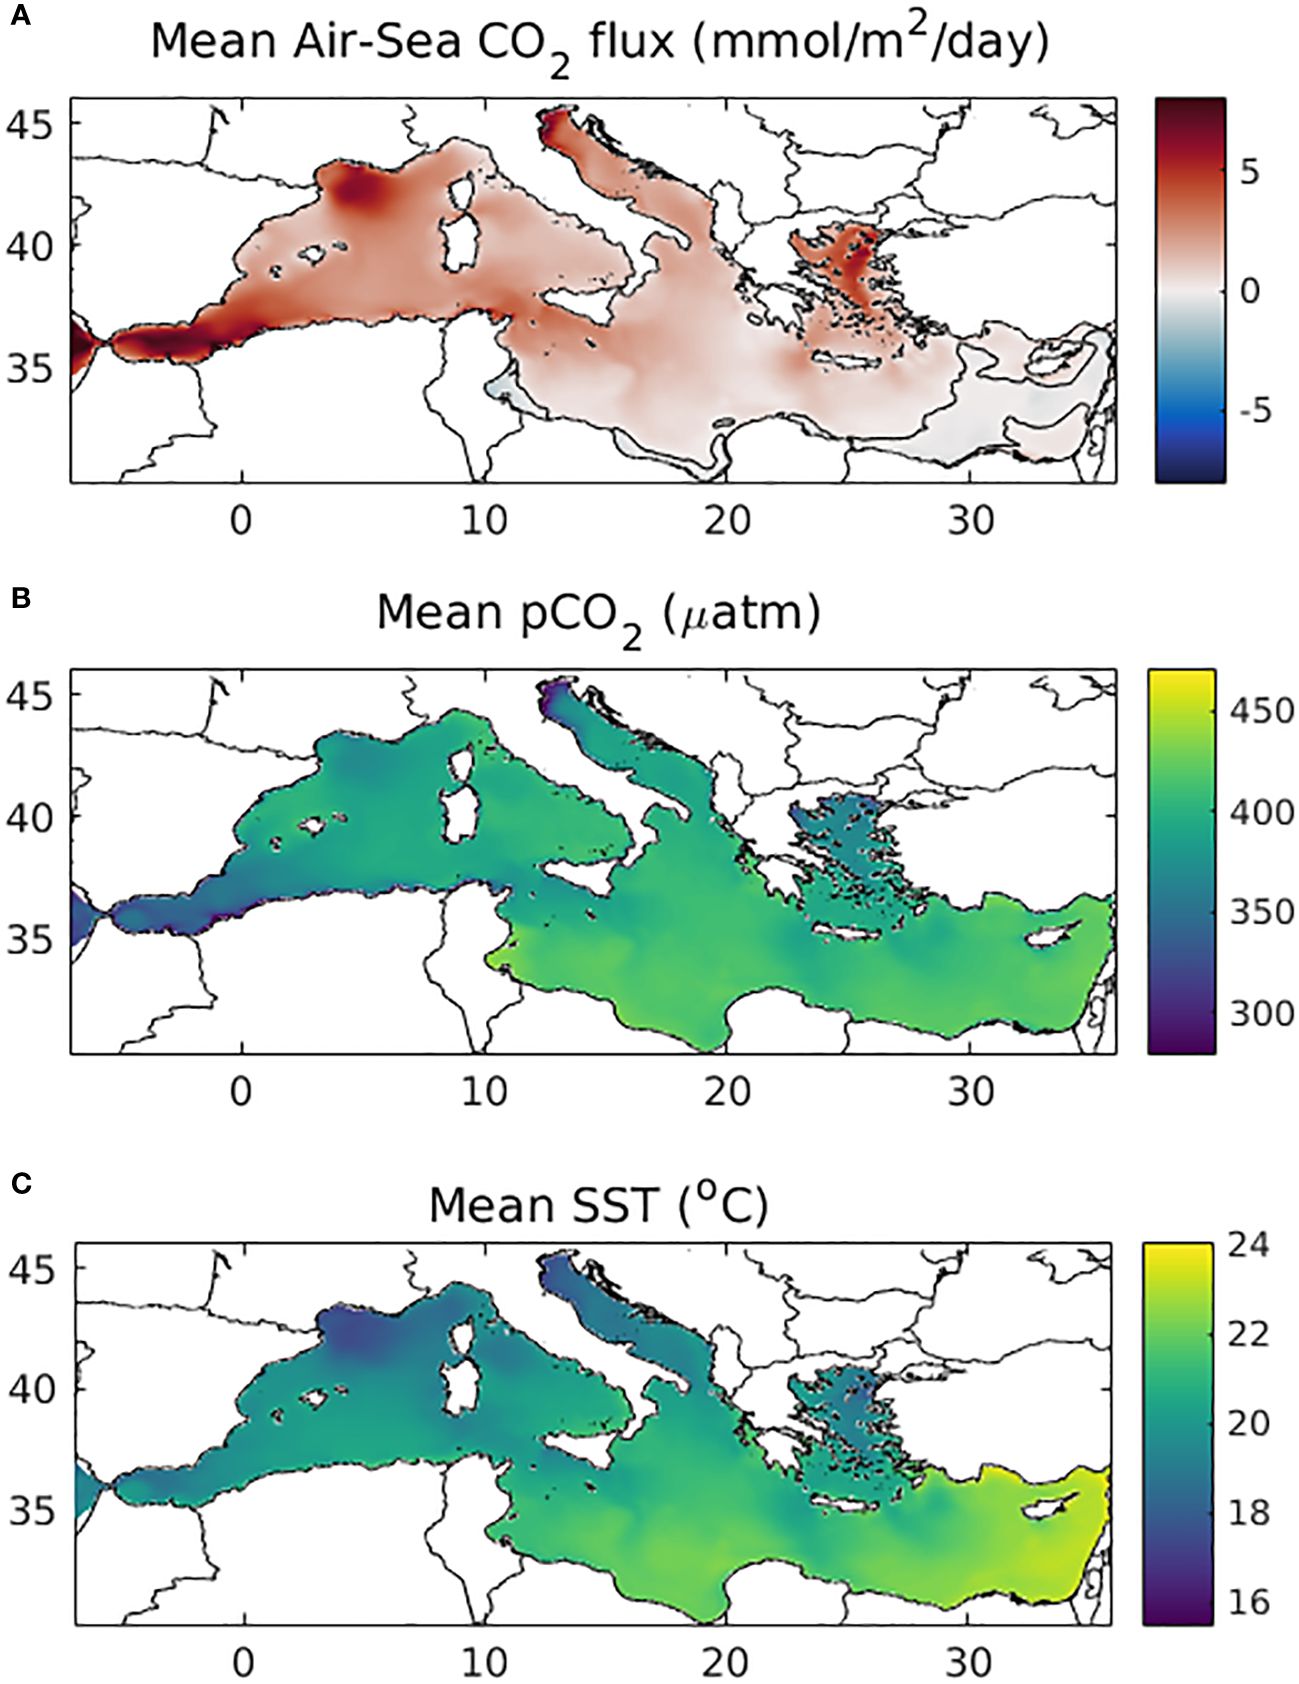
Figure 5 Simulated mean (2010-2022) (A) air-sea CO2 flux (mmol/m2/day), (B) surface water pCO2 (µatm) and (C) sea surface temperature (°C). Positive air-sea flux values indicate net CO2 ocean uptake. The contour line indicating zero air-sea CO2 flux is also shown in (A).
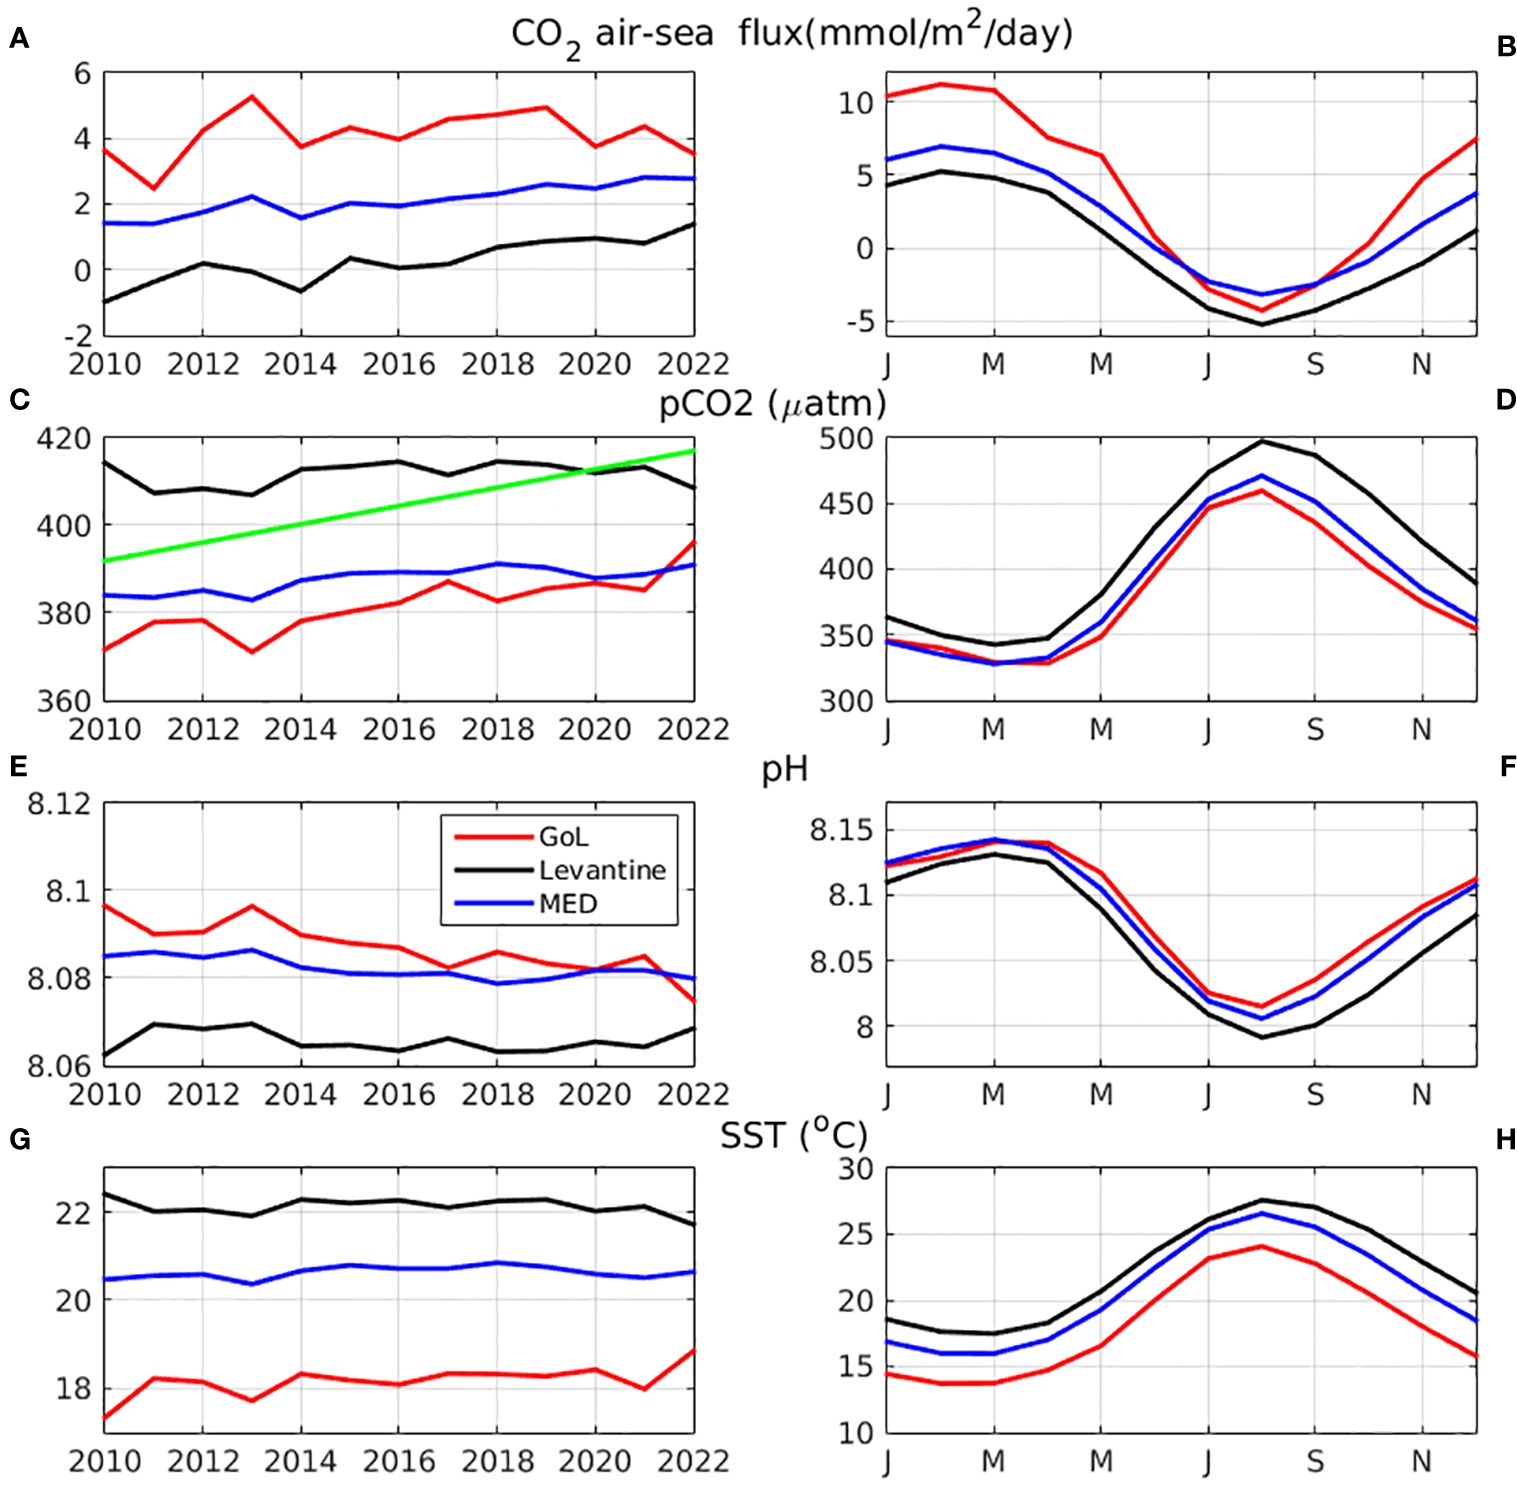
Figure 6 Simulated annual mean (A) air-sea CO2 flux (mmol/m2/day) (positive values indicate net CO2 uptake), (C) water pCO2 (µatm), (E) pH and (G) SST (°C), and their monthly climatology in (B, D, F, H) respectively, averaged over the Gulf of Lions (3-6°E, 40.8-43°N, red line), Levantine basin (22-36°E, 30-35°N, black line) and entire Mediterranean (blue line) (see Figure 1). The adopted air pCO2 increase is also indicated in (C) (green line).
The spatial variability of pCO2 and CO2 air-sea flux (Figure 5, see also Supplementary Figure S.8) is mainly controlled by temperature and primary production. The latter shows an eastward decreasing gradient (see also Supplementary Figure S.9), opposite with temperature (i.e., increases eastward). A significant part of the pCO2 and CO2 air-sea flux spatial variability is related to the dependence of pCO2 solubility on the water temperature (i.e., decrease of solubility with increasing temperature). Thus, pCO2 follows an eastward increasing gradient, being higher in the Eastern Mediterranan. Moreover, in open sea areas, lower temperature is indicative of deeper winter mixing (e.g., Gulf of Lions, Southern Adriatic, North Aegean), resulting in an overall higher primary production and CO2 net biological uptake. River influenced areas, such as the Northern Adriatic and North Aegean, are also characterized by generally lower temperatures, along with high productivity, sustained by riverine nutrient inputs. The same applies for areas receiving lateral inputs from the Atlantic (Alboran Sea) and the Black Sea (N. Aegean). In these areas, however, pCO2 is also strongly influenced by the DIC and TA of the inflowing water. Thus, the relatively low pCO2 in the Alboran Sea is mainly related to the DIC/TA concentrations of the Atlantic inflowing water. Overall, at basin-scale, the concurrent variability of temperature and productivity results in a significant correlation between CO2 air-sea flux and temperature (r=-0.72). A slightly lower correlation (r=0.57) is found between pCO2 and SST.
In Figure 6, the mean (2010-2022) monthly climatology and inter-annual variability of air-sea CO2 flux, pCO2 and SST are shown in two representative areas: Gulf of Lions (increased mixing/low temperature, high primary production) and Levantine basin (stratification/high temperature, low primary production), along with the basin-scale average. As mentioned above, the water pCO2 is largely controlled by its temperature depending solubility, showing a similar seasonal cycle to SST, while the CO2flux depends on the difference between water and atmospheric pCO2 (mean 2010-2022 pCO2air ~404.5 μatm, see Figure 6C), following Equation 1. In the Gulf of Lions, the simulated CO2flux is positive throughout most of the year, with a peak during February-March (~11 mmol/m2/day) and a minimum during August (~-4 mmol/m2/day), being slightly negative (net source of CO2) during summer period (July-September). A similar pattern may be seen in the Levantine basin (maximum ~5 mmol/m2/day, minimum~-5 mmol/m2/day), but the negative air-sea flux extends over a longer period (June-November). The mean (2010-2022) basin-scale averaged air-sea annual mean CO2 flux is +2.1 mmol/m2/day, indicating a net sink of CO2. A much higher mean flux (+4.1 mmol/m2/day) is simulated in the Gulf of Lions and a close to zero flux (+0.35 mmol/m2/day) in the Levantine basin.
In Table 1, the inter-annual (linear) trends are shown for different variables. These were calculated based on their monthly mean time series in the three different areas (Mediterranean, Gulf of Lions, Levantine basin), after removing their monthly climatology (not shown) as in Kapsenberg et al. (2017). The resulting trends are quite similar to those calculated based on the yearly mean variability, shown in Figure 6, although the latter trends are in many cases not statistically significant, given the small amount of data in the yearly time-series. In some cases, particularly in the Levantine basin, the calculated trends are not statistically significant (p-value>0.05 in Table 1), which might be due to the relatively short time period (13 years) considered. In the Gulf of Lions, all variables show a statistically significant trend, except the air-sea CO2 flux, which is probably related to the important trend of pCO2 (+1.52 µatm/year), almost parallel with the pCO2air trend (+2.1 µatm/year). A slightly lower trend is found for pCO2@20°C (+0.55 µatm/year), with the remaining part explained by the increasing trend of SST (+0.06 °C/year). TA shows a slightly lower trend (+0.53 µmol/kg/year), as compared to DIC (+0.77 µmol/kg/year). On Mediterranean basin-scale, trends have the same sign, but are much weaker (~1/3), as compared with the Gulf of Lions, except the air-sea flux (+0.113 mmol/m2/day/year), due to the much lower trend of pCO2 (+0.6 µatm/year) in relation to pCO2air. One may notice that the stronger increasing trend of pCO2 in the Gulf of Lions, which is due to relatively higher CO2 air-sea flux in this area (Figure 6, see also Figure 5), results in a faster acidification trend (i.e., pH decrease, Figure 6E), as compared to the Mediterranean basin-average. In the Levantine basin, most variables does not show a statistically significant trend, except the air-sea flux (+0.155 mmol/m2/day/year), DIC (+0.21 µmol/kg/year) and pCO2@20°C (+0.35 µatm/year), again driven by the increasing pCO2air.
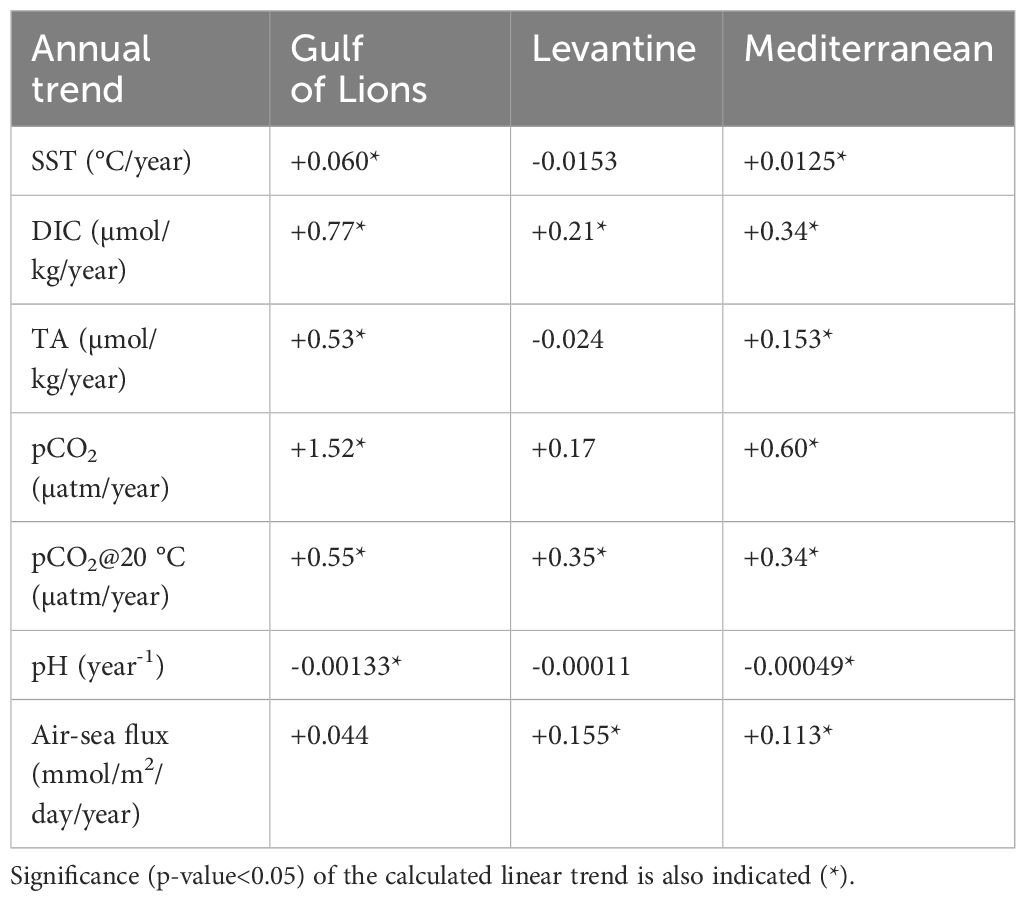
Table 1 Calculated annual (linear) trends over 2010-2022 period for SST (°C/year), DIC (µmol/kg/year), TA (µmol/kg/year), pCO2 (µatm/year), pCO2@20°C (µatm/year), air-sea CO2 flux (mmol/m2/day/year) and pH (/year) in Gulf of Lions, Levantine Basin and Mediterranean (see Figure 6).
3.3 Effect of plankton productivity and freshwater fluxes
In Figure 7, the mean (2010-2014) difference between the reference and sensitivity simulations, without the effect of biology (NoBio), E-P fluxes (NoEvap) and air-sea CO2 flux (NoAir), are shown for TA, DIC, pCO2 and CO2 air-sea flux, averaged in the Gulf of Lions, the Levantine basin and the entire Mediterranean (see Figure 1). The mean effect of biochemical processes on TA, resulting from the uptake/release of dissolved inorganic nutrients (see section 2.1.2) is relatively small (-2 µmol/kg on basin-average), being slightly higher in the more productive Gulf of Lions (-3µmol/kg) (see also Supplementary Figure S.10). On the other hand, de-activating biochemical processes (i.e., uptake of CO2 by photosynthesis and release by respiration) results in a significant increase of DIC (basin-average +18.5 µmol/kg, Gulf of Lions +25.7 µmol/kg, Levantine +9.1 µmol/kg) and pCO2 (basin-average +36 µatm, Gulf of Lions +53 µatm, Levantine +18 µatm) (see also Supplementary Figures S.10, S.11). We should note that in this case the CO2 air-sea flux becomes negative (CO2 net source) in the entire basin, including the Gulf of Lions. De-activating the effect of E-P fluxes results in a quite similar decrease on DIC and TA (Basin-average TA -15.1 µmol/kg and DIC -15.0 µmol/kg), which is much stronger in the Levantine basin (TA -19.8 μmol/kg, DIC -20.7 μmol/kg), as compared to the Western Mediterranean (Gulf of Lions TA -10.5 μmol/kg, DIC -10.6 μmol/kg)). This similar decrease of DIC and TA results in a small but relevant decrease of pCO2, particularly in the Levantine basin (basin-average -4.8 µatm, Gulf of Lions -3.5 µatm, Levantine -8.3 µatm), which is characterized by significant E-P losses. Finally, de-activating the CO2 air-sea flux has a relatively smaller overall effect on DIC (basin-average -2.6 µmol/kg, Gulf of Lions -5.4 µmol/kg, Levantine +2.1 µmol/kg). We should note that de-activating CO2 air-sea flux results in an increase of DIC in the Levantine area, where there is a net CO2 release in the reference simulation over the 2010-2014 period. Overall, the relative changes mentioned above provide an indication of the importance of different processes, in relation to the simulated pCO2 and the air-sea flux, as well as the potential model bias, when for example those processes are overestimated/underestimated in the model.
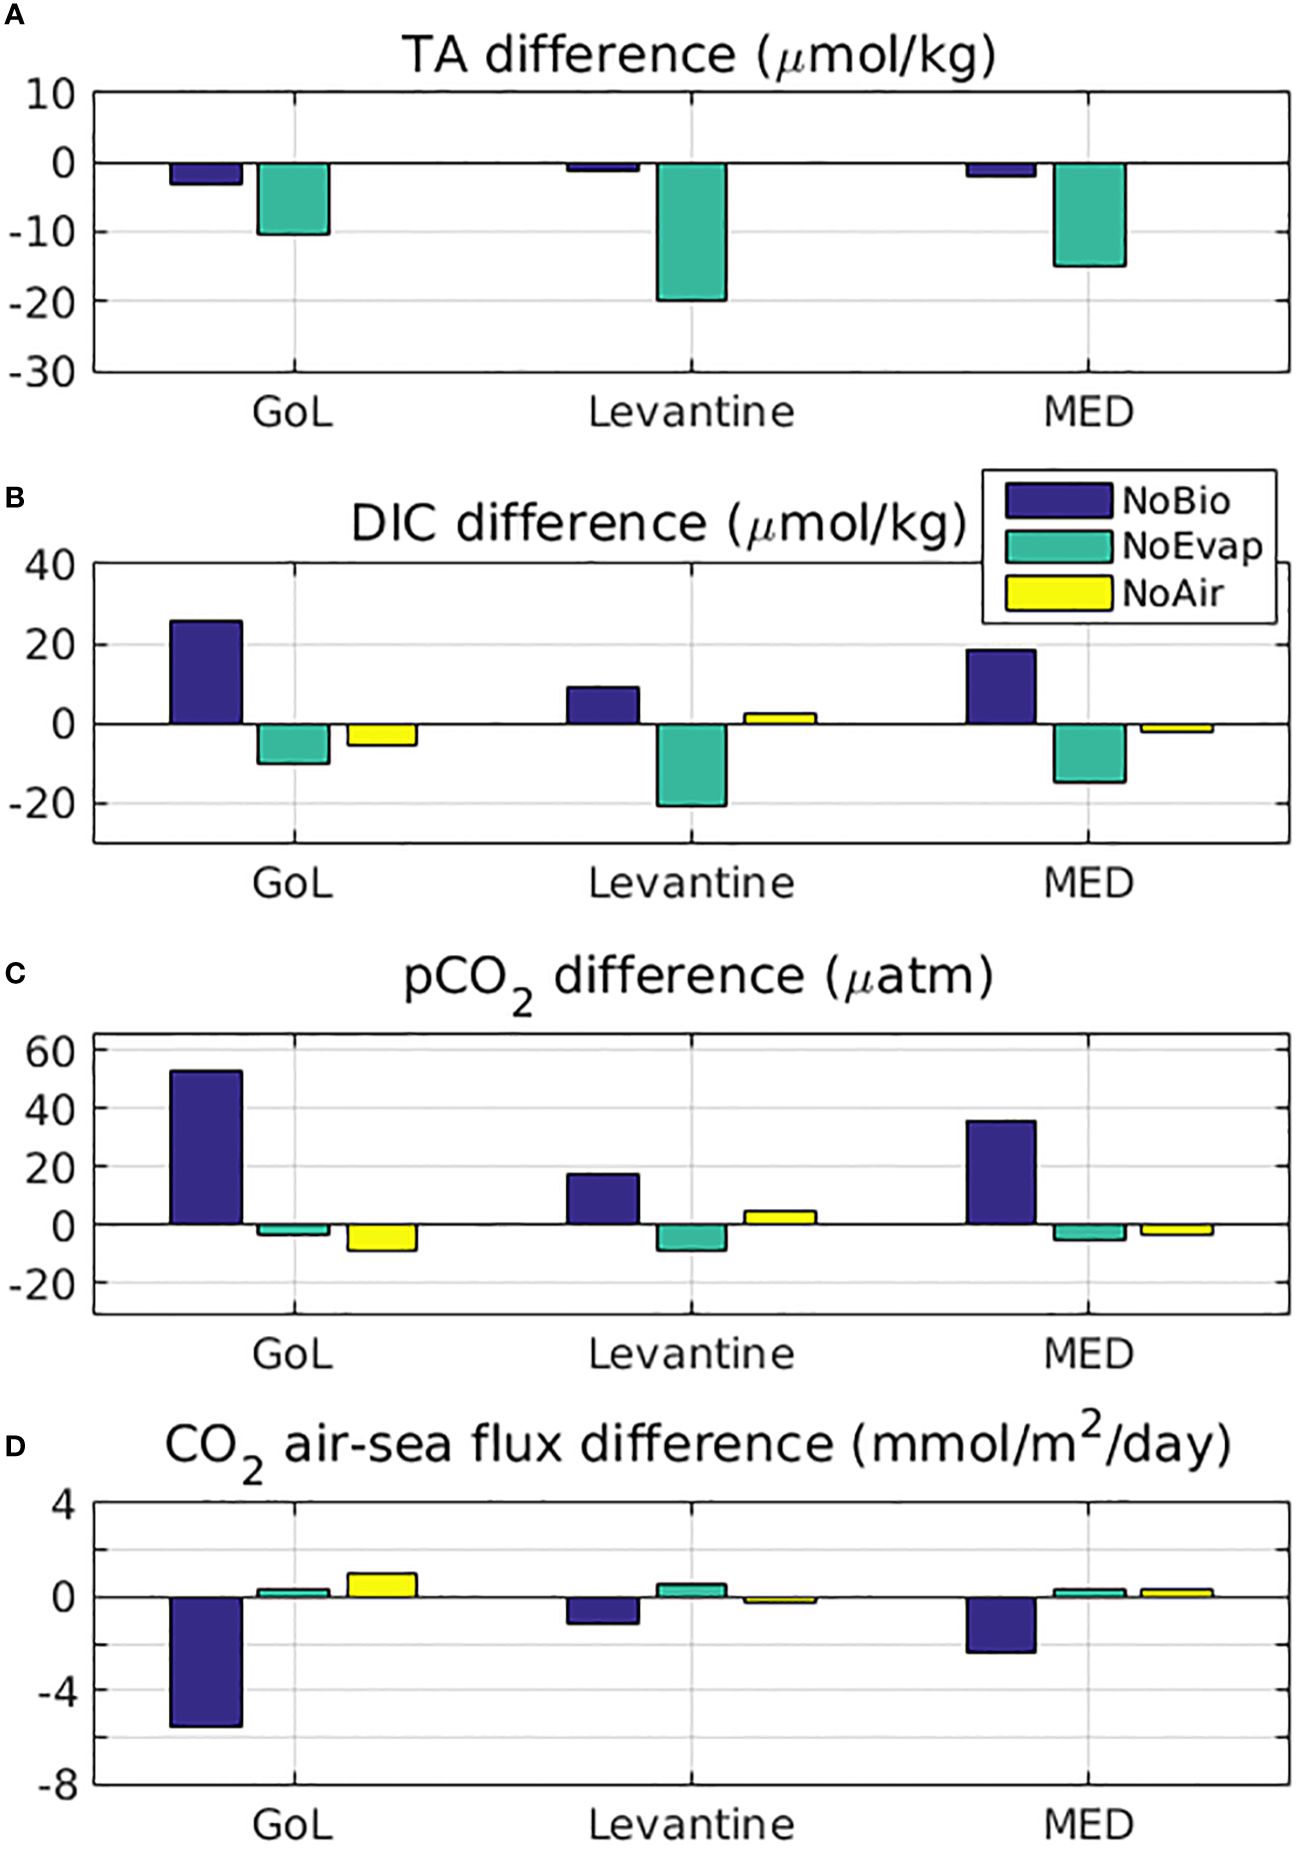
Figure 7 Difference (sensitivity-reference) between mean (2010-2014) surface (A) total alkalinity (µmol/kg, TA), (B) dissolved inorganic carbon (µmol/kg, DIC), (C) water pCO2 (µatm) and (D) CO2 air-sea flux (mmol/m2/day), in the reference simulation and the simulations without the effect of evaporation-precipitation fluxes (NoEvap, green bar), without the effect of biology (NoBio, blue bar) and without the air-sea CO2 flux (NoAir, yellow bar), averaged in the Gulf of Lions (3-6°E, 40.8-43°N), the Levantine basin (22-36°E, 30-35°N) and the entire Mediterranean (see Figure 1). The air-sea CO2 flux in the case of NoAir sensitivity simulation is calculated, but not included in the model.
As shown in Figure 8, the effect of CO2 net uptake from photosynthesis/respiration on DIC and pCO2 seasonal variability peaks during early spring period (see Figures 8E–H), which is slightly delayed as compared with the primary production peak (winter). This is because during winter period, DIC is primarily controlled by vertical mixing and thus all simulations are converging (see Figures 8A, B). In the Gulf of Lions, stronger vertical mixing and increased biological activity (see SupplementaryFigure S.12) results in a much higher seasonal variation of DIC (~42.5 µmol/kg), as compared to the Levantine basin (~26.8 µmol/kg). When biological processes are switched-off (simulation NoBio), the DIC seasonal variation is significantly decreased (Gulf of Lions -37%, Levantine -36%) in both areas (Gulf of Lions ~ 26.8 µmol/kg, Levantine ~17.4 µmol/kg). The effect of E-P fluxes on DIC has the strongest impact during late summer period, synchronously with the peak of net evaporation (see Figures 8E, F). In the Levantine basin, one may notice the stronger effect of evaporation, as compared to biological processes, given the low productivity and high evaporation fluxes in this area. The effect of CO2 air-sea fluxes in the Gulf of Lions shows a peak in late spring, slightly delayed with regard to the pCO2 minimum (late winter), as with the effect of biological processes. On the other hand, in the Levantine, de-activating the CO2 air-sea fluxes has an opposite effect (DIC and pCO2 increase, see Figures 8B, D), which peaks during summer period (see Figures 8F, H), when pCO2 is higher (i.e., higher air-sea CO2 export in the reference simulation). The effects of biology and air-sea fluxes on pCO2@20°C appear quite similar with those on DIC (see Figures 8C, D, G-H). On the other hand, as E-P fluxes affect both DIC and TA, they have a much lower impact on pCO2, as compared to DIC. This is why pCO2 shows a slightly different seasonal variability from DIC in the reference simulation (see Figures 8A–D), being relatively lower during the late summer-autumn period, when E-P fluxes peak.
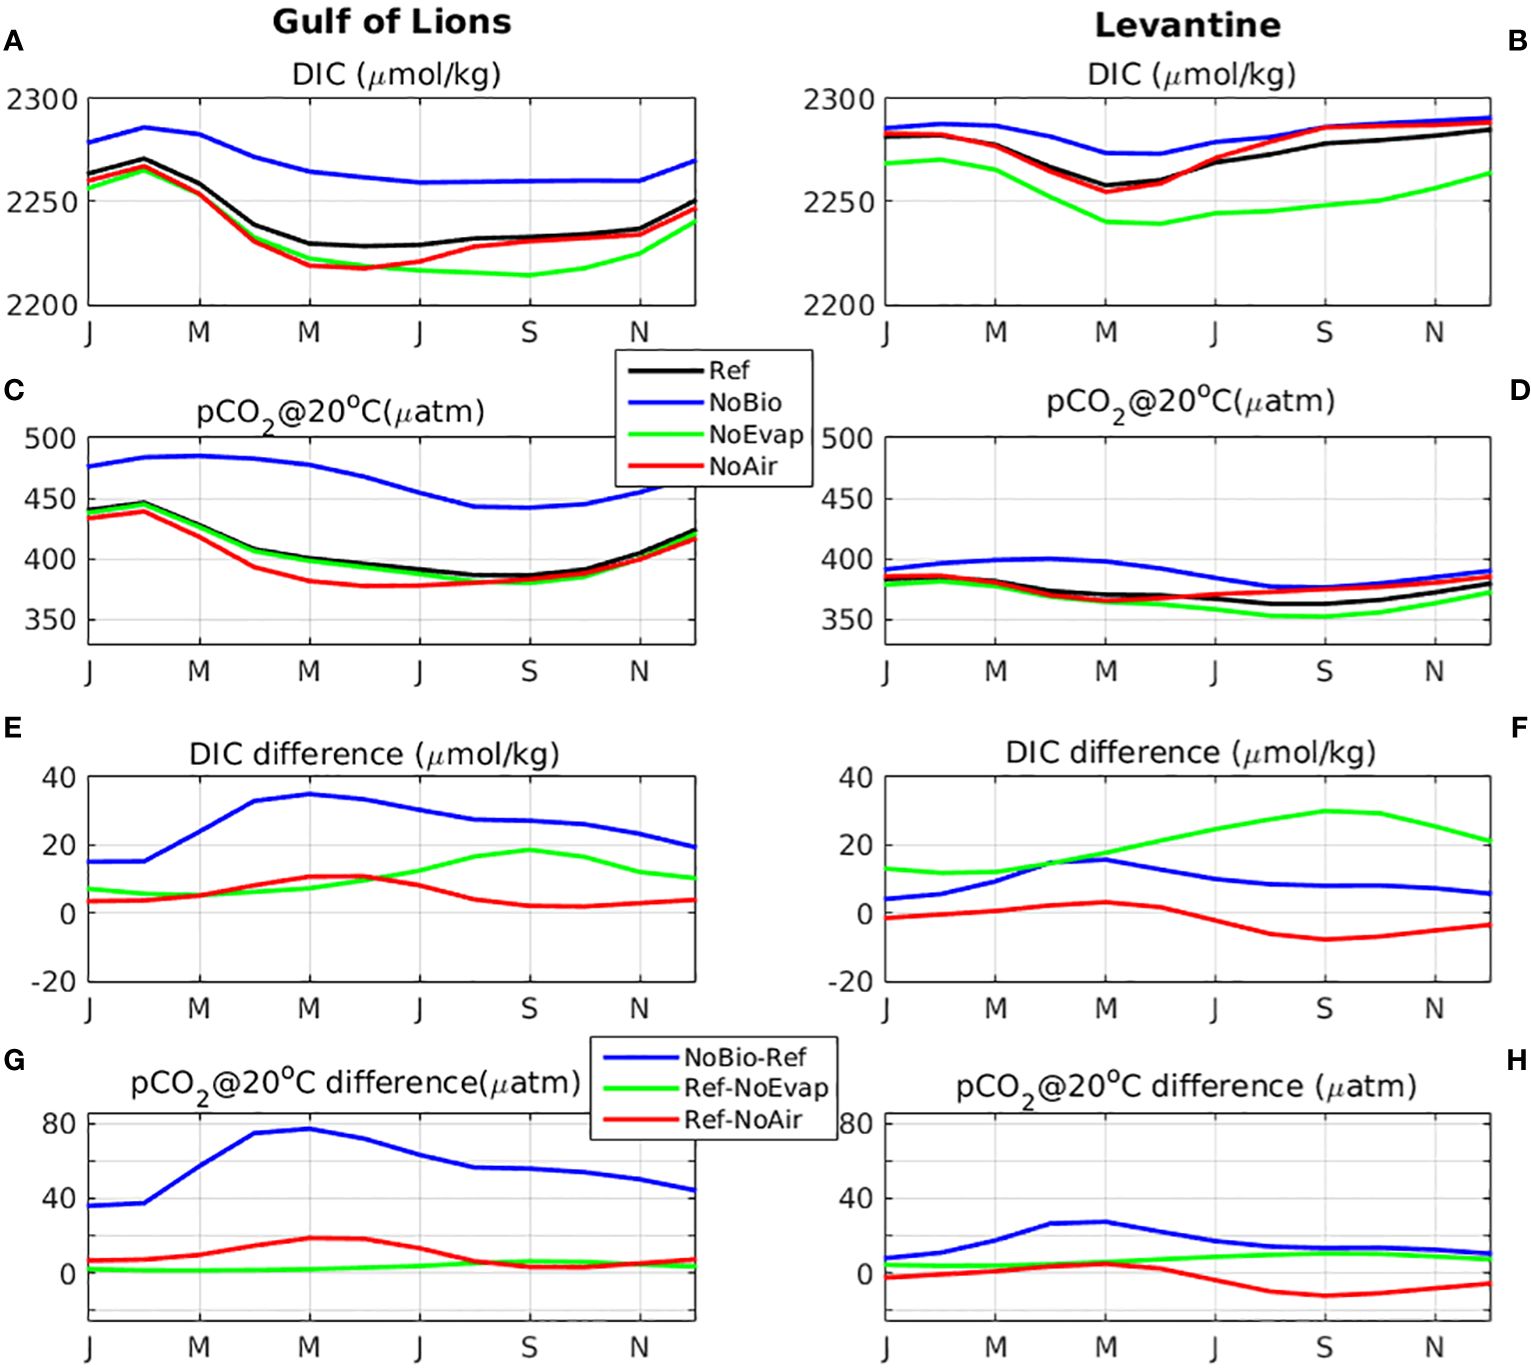
Figure 8 Monthly climatology (2010-2014) of simulated concentration of (A, B) DIC (µmol/kg) and (C, D) pCO2@20 C° (µatm) in the reference simulation (Ref, black line) and the simulations without the effect of evaporation-precipitation fluxes (NoEvap, green line), without the effect of biology (NoBio, blue line) and without the air-sea CO2 flux (NoAir, red line) and difference of (E, F) DIC (µmol/kg) and (G, H) pCO2@20 C° (µatm) (Ref-NoEvap: green line, NoBio-Ref: black line, Ref-NoAir: magenta line), averaged in the Gulf of Lions (3-6°E, 40.8-43°N) (left) and Lenantine basin (22-36°E, 30-35°N) (right).
4 Discussion and concluding remarks
A basin-scale Mediterranean carbonate system model has been setup, building on the POSEIDON operational biogeochemical model (Kalaroni et al., 2020a, b). The spatial variability of simulated carbonate system variables (DIC, TA, pCO2) from a 13-year simulation (2010-2022) was validated against CARIMED in situ data, showing reasonable agreement, with the exception of a DIC and TA overestimation along the Atlantic water pathway (Algerian basin and Sicily channel) and also a slight overestimation of TA in the Eastern Levantine basin. This might be related to an overestimation of evaporation fluxes in the model and/or a small bias of the initial TA fields, as suggested by Cossarini et al. (2021), who found a similar bias in their model results. The time-variability of the model simulated outputs (DIC, TA, pCO2, pH) were also validated, against available time-series from Western (DYFAMED, Villefranche-PointB) and Eastern Mediterranean (HCB) sites. Data from HCB station provided the first time-series with measurements of pCO2 in the Eastern Mediterranean (Adriatic Sea excluded), which was accompanied by pH, DIC and TA measurements (see Frangoulis et al., 2024, this issue). The simulated variability was found in good agreement with the data, particularly for pCO2, pH and DIC. However, the model failed to reproduce the observed late summer/autumn peak of TA at PointB site, which is related with evaporation. This model deviation is related to the advection of lower alkalinity waters of Atlantic origin towards the Ligurian Sea during spring/summer period (see SupplementaryFigure S.13). A comparison of the near surface circulation, as depicted by the simulated sea surface height, against satellite altimetry data (see Supplementary Figure S.14) suggests a model deviation in the anti-cyclonic pattern west of Sardinia, in the Algerian basin This deviation results in a overestimated northward propagation of the Atlantic water. Such a northward pathway of Atlantic water through anti-cyclonic eddies and instabilities formed in the Algerian basin has been documented in the Western Mediterranean (see e.g., Béthoux, 1980; Millot and Taupier-Letage, 2005; Schroeder et al., 2008). However, the dominant pathway of Atlantic water carried by the Algerian current is eastward (e.g. Schroeder et al., 2008), bifurcating toward the Tyrrhenian basin and Eastern Mediterranean (through the straits of Sicily) and this northward pathway is probably exaggerated in the model simulation. This has also been confirmed with a comparison with surface salinity, obtained from CMEMS re-analysis (see Supplementary Figures S.15-S.16), which shows a relatively lower model simulated salinity toward the Ligurian Sea and relatively higher salinity in the Tyrrhenian basin. The overestimated advection of Atlantic water towards Ligurian Sea results in an underestimation of TA at DYFAMED and Villefranche-PointB, mostly noticed during spring/summer stratified period, as during winter this effect is largely compensated by vertical mixing. The same effect also explains the DIC and pCO2 underestimation at DYFAMED and Villefranche-PointB during spring, given that the spring bloom net primary production is probably underestimated in the model, as indicated by a comparison of simulated with satellite Chl-a (see SupplementaryFigures S.17, S.18). The same comparison at HCB indicates an overestimation of primary production, due to overestimated winter vertical mixing in the Eastern Mediterranean (Kalaroni et al., 2020a, b), which explains the underestimation of pCO2 at HCB during spring.
The relatively higher time-resolution of in situ data at Villefranche-PointB allowed a more detailed assessment of the simulated DIC, pCO2 and pH seasonal variability. In particular, a time-lag (1-2 months) of the simulated winter DIC peak could be seen in some years (e.g., 2013, 2015, 2016, 2019), which was reflected also in the variability of pH and pCO2 (Figure 3, see also Supplementary Figure S.19). This could be related to a different timing of phytoplankton bloom in the area, revealed in some cases from a comparison with satellite Chl-a (Supplementary Figure S.18). However, a similar time lag could be also seen in the sensitivity simulation with the effect of biology switched-off (see section 3.3). Moreover, the simulated SST variability was found very well correlated (r~0.99) with in situ SST, showing a similar winter minimum during February-March period (see Supplementary Figure S.19). Therefore, the simulated DIC winter time-lag in some years can be attributed to the inter-annual variability of near surface circulation in the area and the advection of relatively higher DIC water from the Tyrrhenian basin (not shown).
Along with the reference simulation, three sensitivity simulations were performed, de-activating the effect of biology, evaporation and CO2 air-sea fluxes on DIC and TA, in order to gain insight into the processes regulating the model simulated carbonate system variability. The impact of biochemical processes on TA was relatively small, being slightly stronger in the more productive North Western Mediterranean, in agreement with Cossarini et al. (2015a) findings. On the other hand, biochemical processes had an important impact on DIC, particularly in the more productive North Western Mediterranean (annual mean difference ~26 µmol/kg), while evaporation had a stronger impact in the Levantine basin (annual mean difference ~21 µmol/kg). As evaporation fluxes affect equally DIC and TA, pCO2 was still mostly affected by biological processes throughout the basin (mean difference Gulf of Lions +53 µatm, Levantine +18 µatm). Thus, when biological processes are switched-off the CO2 air-sea flux becomes negative (CO2 net source) in the entire basin, which is consistent with findings of Canu et al. (2015). An interesting finding in the present study is that when net evaporation that affects equally DIC and TA is switched-off, a small but relevant decrease of pCO2 is simulated, particularly in the Levantine basin, which is characterized by significant E-P losses. Part of this effect is related to the slightly higher dependence of pCO2 on DIC, as compared to TA (see Equation 3, 4 in Takahashi et al., 1993). Assuming a 1% decrease in both DIC (-22.8 µmol/kg) and TA (-27.2 µmol/kg), which is representative of the effect of E-P fluxes in the Levantine basin (see Supplementary Figure S.20), a decrease of 0.63% (-2.76 µatm) can be calculated for pCO2, using CO2SYS and HALTAFALL codes (constant temperature=22°C and salinity =39). However, the simulated mean decrease of pCO2 in the Levantine basin, over the 5-year (2010-2014) period, is relatively higher (~2%, -8.3 µatm, see Figure 7), as compared to this theoritical calculation. This is because the increase due to evaporation counterbalances the DIC removal from biological activity and, thus, DIC shows a slightly stronger decrease (-0.9%), as compared to TA (-0.76%), when E-P is de-activated (see Supplementary Figure S.20). This small difference between DIC and TA response results in the relatively stronger decrease of pCO2. This process might be important in areas with strong evaporation, such as the Eastern Mediterranean.
The simulated annual mean CO2 air-sea flux was found higher in the Western Mediterranean, particularly in the Gulf of Lions and the Alboran Sea, as well as in river influenced areas, such as the N. Adriatic and along the pathway of the Black Sea Water in the Aegean. A weak release of CO2 was found in the Eastern Levantine and Libyan Sea. The simulated air-sea flux spatial variability is consistent with existing estimates from other observational and modelling studies (DYFAMED: +3.8 mmol/m2/day, Copin-Montégut and Bégovic, 2002; N. Aegean +6.2/11.8 mmol/m2/day, Krasakopoulou et al., 2009; N. Adriatic: +2.9 mmol/m2/day, Cossarini et al., 2015a; South-Eastern Levantine: -2.3 mmol/m2/day, Sisma-Ventura et al., 2017; S. Aegean +0.5 mmol/m2/day, Frangoulis et al., 2024, this issue). It is also similar with results of Cossarini et al. (2021), except in the Alboran Sea, where air-sea CO2 flux is relatively higher in the present simulation, due to relatively lower pCO2, based on the adopted Atlantic water DIC and TA. The strong impact of the Atlantic water properties on the air-sea CO2 flux in this area has been also noted by Canu et al. (2015). The simulated mean (2010-2022) CO2 air-sea flux (+2.1 mmol/m2/day), averaged over the entire Mediterranean indicates a net CO2 uptake. This is relatively higher (mean 2010-2019: +1.5 mmol/m2/day), as compared to the, also positive (net uptake), basin-average air-sea CO2 flux (+0.35 mmol/m2/day), simulated by CMEMS re-analysis over 2010-2019 period (Cossarini et al., 2021), which may be partly attributed to the relatively higher Alboran Sea air-sea CO2 flux, simulated in the present study.
The simulated basin average air-sea CO2 flux presents a positive trend (+0.11 mmol/m2/day/year), indicating a gradual increase of net CO2 uptake. This may be attributed to the lower increasing trend of water pCO2 (+0.60 mmol/m2/day/year), as compared to the air CO2 (+2.1 mmol/m2/day/year). Part of the water pCO2 increasing trend is also related to the increasing water temperature (SST trend=+0.0125 °C/year, pCO2@20°C trend=+0.34 µatm/year). A slightly higher increasing trend (+0.15 mmol/m2/day/year) was simulated by CMEMS re-analysis model output over 2010-2019 period (Cossarini et al., 2021). The in situ pCO2 data at Villefrance-PointB show a much higher trend (+3.53 μatm/year, Kapsenberg et al., 2017), as compared with the model (+1.51 μatm/year). However, the CO2 dynamics in such coastal areas are probably not fully represented, being complicated by additional processes (fresh water inputs, benthic processes etc.) (Cossarini et al., 2021). The simulated positive trends of DIC and TA in the North Western Mediterranean (DIC: +0.77 µmol/kg/year, TA: +0.53 µmol/kg/year) are consistent with the simulated trends in Cossarini et al. (2021) (Western Mediterranean DIC: +0.7 µmol/kg/year, TA: +0.6 µmol/kg/year). In the Levantine basin, a relatively smaller trend (+0.21 µmol/kg/year) was simulated for DIC. However, no significant trend was simulated for TA, in contrast to Cossarini et al. (2021), who reported stronger trends for both DIC and TA (Eastern basin DIC: +2 µmol/kg/year, TA: +1.5 µmol/kg/year), as compared to the Western basin (DIC: +0.7 µmol/kg/year, TA: +0.6 µmol/kg/year). These stronger increasing trends in the Eastern Mediterranean were found aligned with simulated increasing salinity (Escudier et al., 2021) and other observational evidence (e.g. Wimart-Rousseau et al., 2021). Such an increasing trend for Eastern Mediterranean salinity and TA was not simulated in the present study, which is consistent with E-P fluxes, also not showing any increasing trends to explain this increase. Despite that, there has been evidence for long-term trends of increasing salinity and freshwater fluxes in the Mediterranean (1950-2010, see e.g Skliris et al., 2018), but the simulated inter-annual variability was probably not long-enough to properly identify such long-term trends, as this was not the primary focus of this study.
Besides the relatively short simulation period, there are also other important model limitations and uncertainties of the simulated carbonate system. The most significant uncertainties are related with the initial DIC and TA fields from GLODAP climatology, which might be biased in areas with scarce data availability (e.g. Eastern Mediterranean), as well as the open boundary conditions (Atlantic and Black Sea water inflow) and riverine inputs of DIC and TA that are still based on fragmented information. Simulated CO2 air-sea fluxes are also characterized by an important uncertainty, as water pCO2 data are still scarse, while derived carbonate data often present significant discrepencies, as compared with the observed (Artioli et al., 2012). Indicative of this uncertainty is the difference between the estimate of CO2 air-sea fluxes in the present study and other basin-scale model results (e.g. Cossarini et al., 2021). To reduce this model uncertainty, multi-model ensembles are currently becoming common practice, particularly for future climate projections (see e.g., Gooya et al., 2023). Another important limitation of the present study is that the effect of calcium carbonate formation/dissolution on TA and DIC is not considered in the model, as calcifying organisms are not explicitly described, due to the limited information on their abundance and distribution in the Mediterranean (e.g., Siokou-Frangou et al., 2010). The formation of 1 mole calcium carbonate results in the decrease of TA by 2 moles and DIC by 1 mole (Wolf-Gladrow et al., 2007). Given this differential effect on TA and DIC, calcium carbonate formation in the euphotic zone results in an increase of pCO2 (i.e., a decrease of air-sea CO2 flux). Missing this effect in the model, results in a potential underestimation of pCO2 and an overestimation of DIC and particularly TA, as carbonate formation/sedimentation is considered a major sink for alkalinity in the Mediterranean (Schneider et al., 2007). Recent satellite data may provide information on the distribution of different phytoplankton functional types, including calcifying organisms (e.g., Di Cicco et al., 2017; El Hourany et al., 2019), which can be used to explicitly describe this process in future modelling efforts.
The present study is a first step in setting up a new carbonate system model in the Mediterranean, with significant skill in reproducing the observed spatio-temporal variability. Next steps that are expected to further improve the model skill include the parameterization of calcium carbonate formation/dissolution, the update of riverine and Black Sea water DIC/TA inputs and particularly the use of more realistic boundary conditions for the Atlantic water inflow (i.e. seasonally/inter-annually varying DIC/TA), which is an important driver for acidification trends in the Mediterranean (e.g., Palmiéri et al., 2015; Wimart-Rousseau et al., 2023).
Data availability statement
The raw data supporting the conclusions of this article will be made available by the authors, without undue reservation.
Author contributions
KT: Conceptualization, Investigation, Methodology, Software, Visualization, Writing – original draft, Writing – review & editing, Formal Analysis. CF: Formal Analysis, Investigation, Methodology, Project administration, Writing – review & editing. NS: Formal Analysis, Investigation, Methodology, Software, Writing – review & editing.
Funding
The author(s) declare that financial support was received for the research, authorship, and/or publication of this article. This work was partially supported by the JERICO-S3 project. The JERICO-S3 project is funded by the European Commission’s H2020 Framework Programme under grant agreement No. 871153.
Acknowledgments
We thank Dr. Louisa Giannoudi for providing bottle in situ data at HCB station. We also thank Professor Evangelia Krasakopoulou and Dr. George Petihakis for the valuable comments on the manuscript.
Conflict of interest
The authors declare that the research was conducted in the absence of any commercial or financial relationships that could be construed as a potential conflict of interest.
Publisher’s note
All claims expressed in this article are solely those of the authors and do not necessarily represent those of their affiliated organizations, or those of the publisher, the editors and the reviewers. Any product that may be evaluated in this article, or claim that may be made by its manufacturer, is not guaranteed or endorsed by the publisher.
Supplementary material
The Supplementary Material for this article can be found online at: https://www.frontiersin.org/articles/10.3389/fmars.2024.1347990/full#supplementary-material
References
Alvarez M., Sanleon-Bartolome H., Tanhua T., Mintrop L., Luchetta A., Cantoni C., et al. (2014). The CO2 system in the Mediterranean Sea: A basin wideperspective. Ocean Sci. 10, 69–92. doi: 10.5194/os-10-69-2014
Alvarez M., Velo A., Tanhua T., Key R., van Heuven S. (2019). Carbon, tracer and ancillary data In the MEDsea, CARIMED: an internally consistent data product for the Mediterranean Sea, No43 Vol. 2019 (Monaco: CIESM congress).
Archer D., Eby M., Brovkin V., Ridgwell A., Cao L., Mikolajewicz U., et al. (2009). Atmospheric lifetime of fossil fuel carbon dioxide. Annu. Rev. Earth Planetary Sci. 37, 117–134. doi: 10.1146/annurev.earth.031208.100206
Artioli Y., Blackford J. C., Butenschön M., Holt J. T., Wakelin S. L., Thomas H., et al. (2012). The carbonate system in the North Sea: Sensitivity and model validation. J. Marine Syst. 102–104, 1–13. doi: 10.1016/j.jmarsys.2012.04.006
Baretta J. W., Ebenhöh W., Ruardij P. (1995). The European regional seas ecosystem model, a complex marine ecosystem model. Netherlands J. Sea Res. 33, 233–246. doi: 10.1016/0077-7579(95)90047-0
Béranger K., Mortier L., Crèpon M. (2005). Seasonal variability of water transport through the Straits of Gibraltar, Sicily and Corsica, derived from a high-resolution model of the Mediterranean circulation. Prog. Oceanogr. 66, 341–364. doi: 10.1016/j.pocean.2004.07.013
Béthoux J.-P. (1980). Mean water fluxes across sections in the Mediterranean Sea, evaluated on the basis of water and salt budget and of observed salinities. Oceanol. Acta 3, 79–88.
Blackford J. C., Gilbert F. J. (2007). pH variability and CO2 induced acidification in the North Sea. J. Mar. Sys. 64, 229–242. doi: 10.1016/j.jmarsys.2006.03.016
Blumberg A. F., Mellor G. L. (1983). Diagnostic and prognostic numerical circulation studies of the South Atlantic Bight. J. Geophys. Res. 88, 4579–4592. doi: 10.1029/JC088iC08p04579
Bosc E., Bricaud A., Antoine D. (2004). Seasonal and inter-annual variability in algal biomass and primary production in the Mediterranean Sea, as derived from 4 years of SeaWiFS observations. Glob. Biogeochem. Cycles 18, GB1005. doi: 10.1029/2003GB002034
Butenschön M., Lovato T., Masina S., Caserini S., Grosso M. (2021). Alkalinization scenarios in the mediterranean sea for efficient removal of atmospheric CO2 and the mitigation of ocean acidification. Front. Clim. 3. doi: 10.3389/fclim.2021.614537
Caldeira K., Wickett M. E. (2003). Anthropogenic carbon and ocean pH. Nature 425, 365. doi: 10.1038/425365a
Canu D. M., Ghermandi A., Nunes P. A., Lazzari P., Cossarini G., Solidoro C. (2015). Estimating the value of carbon sequestration ecosystem services in the Mediterranean Sea: An ecological economics approach. Global Environ. Change 32, 87–95. doi: 10.1016/j.gloenvcha.2015.02.008
Carroll D., Menemenlis D., Dutkiewicz S., Lauderdale J. M., Adkins J. F., Bowman K. W., et al. (2022). Attribution of space-time variability in global-ocean dissolved inorganic carbon. Global Biogeochemical Cycles 36, e2021GB007162. doi: 10.1029/2021GB007162
Copin-Montégut C. (1993). Alkaninity and carbon budgets in the Mediterranean. Global Biogeochemical Cycles 7, 915–925. doi: 10.1016/0039-9140(67)80203-0
Copin-Montégut C., Bégovic M. (2002). Distributions of carbonate properties and oxygen along the water column (0–2000 m) in the central part of the NW Mediterranean Sea (Dyfamed site): influence of the winter vertical mixing on air–sea CO2 and O2 exchanges. Deep-Sea Research II 49, 2049–2066. doi: 10.1016/S0967-0645(02)00027-9
Cossarini G., Feudale L., Teruzzi A., Bolzon G., Coidessa G., Solidoro C., et al. (2021). High-resolution reanalysis of the mediterranean sea biogeochemistry, (1999–2019). Fro. Mar. Sci. 8, 741486. doi: 10.3389/fmars.2021.741486
Cossarini G., Lazzari P., Solidoro C. (2015a). Spatiotemporal variability of alkalinity in the Mediterranean Sea. Biogeosciences 12, 1647–1658. doi: 10.5194/bg-12-1647-2015
Cossarini G., Querin S., Solidoro C. (2015b). The continental shelf carbon pump in the northern Adriatic Sea (Mediterranean Sea): Influence of winter time variability. Ecol. Model. 314, 118–134. doi: 10.1016/j.ecolmodel.2015.07.024
Di Cicco A., Sammartino M., Marullo S., Santoleri R. (2017). Regional empirical algorithms for an improved identification of phytoplankton functional types and size classes in the mediterranean sea using satellite data. Front. Mar. Sci. 4. doi: 10.3389/fmars.2017.00126
Dickson A. G. (1990). Thermodynamics of the dissociation of boric acid in synthetic sea-water from 273.15 to 318.15 K. Deep Sea Res. Part A 37, 755–766. doi: 10.1016/0198-0149(90)90004-F
Dickson A. G., Millero F. J. (1987). A comparison of the equilibrium constants for the dissociation of carbonic acid in seawater media. Deep Sea Res. 34, 1733–1743. doi: 10.1016/0198-0149(87)90021-5
El Hourany R., Abboud-Abi Saab M., Faour G., Mejia C., Crépon M., Thiria S. (2019). Phytoplankton diversity in the Mediterranean Sea from satellite data using self-organizing maps. J. Geophysical Research: Oceans 124, 5827–5843. doi: 10.1029/2019JC015131
Escudier R., Clementi E., Cipollone A., Pistoia J., Drudi M., Grandi A., et al. (2021). A high-resolution reanalysis for the Mediterranean Sea. Front. Earth Sci. 9. doi: 10.3389/feart.2021.702285
Frangoulis C., Stamataki N., Pettas M., Michelinakis S., King A. L., Giannoudi L., et al. (2024). A carbonate system time series in the Eastern Mediterranean Sea. Two years of high-frequency in-situ observations and remote sensing. Front. Mar. Sci. 11, 1348161. doi: 10.3389/fmars.2024.1348161
Gialesakis N., Kalivitis N., Kouvarakis G., Ramonet M., Lopez M., Kwok C. Y., et al. (2023). A twenty year record of greenhouse gases in the Eastern Mediterranean atmosphere. Sci. Total Environ. 864, 161003. doi: 10.1016/j.scitotenv.2022.161003
González-Dávila M., Santana-Casiano J. M., Petihakis G., Ntoumas M., Suárez de Tangil M., Krasakopoulou E. (2016). Seasonal pH variability in the Saronikos Gulf: A year-study using a new photometric pH sensor. J. Mar. Syst. 162, 37–46. doi: 10.1016/j.jmarsys.2016.03.007
Gooya P., Swart N. C., Hamme R. C. (2023). Time-varying changes and uncertainties in the CMIP6 ocean carbon sink from global to local scale. Earth Syst. Dynam. 14, 383–398. doi: 10.5194/esd-14-383-2023
Gruber N., Clement D., Carter B. R., Feely R. A., van Heuven S., Hoppema M., et al. (2019). The oceanic sink for anthropogenic CO2 from 1994 to 2007. Science 363, 1193–1199. doi: 10.1126/science.aau5153
Hassoun A. E. R., Bantelman A., Canu D., Comeau S., Galdies C., Gattuso J.-P., et al. (2022). Ocean acidification research in the Mediterranean Sea: Status, trends and next steps. Front. Mar. Sci. 9. doi: 10.3389/fmars.2022.892670
Hassoun A. E. R., Gemayel E., Krasakopoulou E., Goyet C., Abboud-Abi Saab M., Ziveri P., et al. (2015). Modeling of the total alkalinity and the total inorganic carbon in the Mediterranean Sea. J. Water Resour. Ocean Sci. 4 (1), 24–32. doi: 10.11648/j.wros.20150401.14
Ingri N., Kakolowicz W., Sillen L. G., Warnqvist B. (1967). Highspeed computere as a supplement to graphical methods: V. HALTAFALL, a general program for calculating the composition of equilibrium mixtures. Talanta 14, 1261. doi: 10.1016/0039-9140(67)80203-0
Kalaroni S., Tsiaras K., Petihakis, Economou-Amilli A., Triantafyllou G. (2020a). Modelling the Mediterranean Pelagic Ecosystem using the POSEIDON ecological model. Part I: Nutrients and Chlorophyll-a dynamics. Deep-Sea Res. PT II. 171, 104647. doi: 10.1016/j.dsr2.2019.104647
Kalaroni S., Tsiaras K., Petihakis G., Economou-Amilli A., Triantafyllou G. (2020b). Modelling the Mediterranean Pelagic Ecosystem using the POSEIDON ecological model. Part II: Biological dynamics. Deep-Sea Res. PT II 171, 104711. doi: 10.1016/j.dsr2.2019.104711
Kapsenberg L., Alliouane S., Gazeau F., Mousseau L., Gattuso J.-P. (2017). Coastal ocean acidification and increasing total alkalinity in the northwestern Mediterranean Sea. Ocean Sci. 13, 411–426. doi: 10.5194/os-13-411-2017
Korres G., Hoteit I., Triantafyllou G. (2007). Data assimilation into a Princeton Ocean Model of the Mediterranean Sea using advanced Kalman filters. J. Mar. Syst. 65, 84–104. doi: 10.1016/j.jmarsys.2006.09.005
Korres G., Lascaratos A. (2003). A one-way nested eddy resolving model of the Aegean and Levantine basins: implementation and climatological runs. Ann. Geophys. 21, 205–220. doi: 10.5194/angeo-21-205-2003
Krasakopoulou E., Rapsomanikis S., Papadopoulos A., Papathanassiou E. (2009). Partial pressure and air-sea CO2 flux in the Aegean Sea during February2006. Continental Shelf Res. 29, 1477–1488. doi: 10.1016/j.csr.2009.03.015
Krasakopoulou E., Souvermezoglou E., Goyet C. (2017). Carbonate system parameters and anthropogenic CO2 in the north Aegean Sea during October 2013. Continental Shelf Res. 149, 69–81. doi: 10.1016/j.csr.2017.04.002
Kroeker K. J., Kordas R. L., Crim R., Hendriks I. E., Ramajo L., Singh G. S., et al. (2013). Impacts of ocean acidification on marine organisms: quantifying sensitivities and interaction with warming. Glob. Change Biol. 19, 1884–1896. doi: 10.1111/gcb.12179
Lauvset S. K., Key R. M., Olsen A., van Heuven S., Velo A., Lin X., et al. (2016). A new global interior ocean mapped climatology: the 1° × 1° GLODAP version 2. Earth Syst. Sci. Data 8, 325–340. doi: 10.5194/essd-8-325-2016
Leung J. Y. S., Zhang S., Connell S. D. (2022). Is ocean acidification really a threat to marine calcifiers? A systematic review and meta-analysis of 980+ Studies spanning two decades. Small 18, 2107407. doi: 10.1002/smll.202107407
Lewis E., Wallace D. (1998). Program developed for CO2 system calculations (United States: ORNL/CDIAC). doi: 10.2172/639712
Marty J. C. (2002). The DYFAMED time-series programm (French-JGOFS)- Preface”. Deep-Sea Res. II 49, 1963–1964. doi: 10.1016/S0967-0645(02)00021-8
Mehrbach C., Culberson C. H., Hawley J. E., Pytkowicz R. M. (1973). Measurement of the apparent dissociation constants of carbonic acid in seawater at atmospheric pressure. Limnol. Oceanogr. 18, 897–907. doi: 10.4319/lo.1973.18.6.0897
Mellor G. L., Yamada T. (1982). Development of a turbulence closure model for geophysical fluid problems. Rev. Geophys. 20, 851–875. doi: 10.1029/RG020i004p00851
Millot C., Taupier-Letage I. (2005). “Circulation in the mediterranean sea,” in The Mediterranean Sea in Handbook of Environmental Chemistry, vol. 5k. (Berlin, Heidelberg: Springer), 29–66, ISBN: ISBN: 978-3-540-25018-0.
Moutin T., Raimbault P. (2002). Primary production, carbon export and nutrients availability in western and eastern Mediterranean Sea in early summer 1996 (MINOScruise). J. Mar. Syst. 33-34, 273–288. doi: 10.1016/S0924-7963(02)00062-3
Nightingale P. D., Malin G., Law C. S., Watson A. J., Liss P. S., Liddicoat M. I., et al. (2000). In situ evaluation of air-sea gas exchange parameterizations using novel conservative and volatile tracers, Global Biogeochem. Cycles 14, 373–387. doi: 10.1029/1999GB900091
Palmiéri J., Orr J. C., Dutay J. C., Béranger K., Schneider A., Beuvier J., et al. (2015). Simulated anthropogenic CO2 storage and acidification of the Mediterranean Sea. Biogeosciences 12, 781–802. doi: 10.5194/bg-12-781-2015
Papadopoulos A., Katsafados P. (2009). Verification of operational weather forecasts from the POSEIDON system across the Eastern Mediterranean. Nat. Hazards Earth Syst. Sci. 9, 1299–1306. doi: 10.5194/nhess-9-1299-2009
Pierrot D., Epitalon J.-M., Orr J. C., Lewis E. R., Wallace D. (2021) MS Excel program developed for CO2 system calculations – version3.0. Available online at: https://github.com/dpierrot/co2sys_xl.
Reale M., Cossarini G., Lazzari P., Lovato T., Bolzon G., Masina S., et al. (2022). Acidification, deoxygenation, nutrient and biomasses decline in a warming Mediterranean Sea. Biogeosciences Discuss. 19, 4035–4065. doi: 10.5194/bg-19-4035-2022
Sabine C. L., Feely R. A., Gruber N., Key R. M., Lee K., Bullister J. L., et al. (2004). The oceanic sink for anthropogenic CO2. Science 305, 367–371. doi: 10.1126/science.1097403
Schneider A., Tanhua T., Körtzinger A., Wallace D. W. (2010). High anthropogenic carbon content in the eastern Mediterranean. J. Geophysical Research: Oceans 115, C12050. doi: 10.1029/2010JC006171
Schneider A., Wallace D. W. R., Körtzinger A. (2007). Alkalinity of theMediterranean Sea: alkalinity of the Mediterranean Sea. Geophys. Res. Lett. 34, L15608. doi: 10.1029/2006GL028842
Schroeder K., Taillandier V., Vetrano A., Gasparini G. P. (2008). The circulation of the Western Mediterranean Sea in spring 2005 as inferred from observations and from model outputs. Deep–Sea Res. I. 55 (8), 947–965. doi: 10.1016/j.dsr.2008.04.003
Siokou-Frangou I., Christaki U., Mazzocchi M. G., Montresor M., Ribera d’Alcalá M., Vaqué D., et al. (2010). Plankton in the open Mediterranean Sea: a review. Biogeosciences 7, 1543–1586. doi: 10.5194/bg-7-1543-2010
Sisma-Ventura G., Or B. M., Yam R., Herut B., Silverman J. (2017). pCO2 variability in the surface waters of the ultra-oligotrophic Levantine Sea: exploring the air-sea CO2 fluxes in a fast warming region. Mar. Chem. 196, 13–23. doi: 10.1016/j.marchem.2017.06.006
Skliris N., Zika J. D., Herold L., Josey S. A., Marsh R. (2018). Mediterranean Sea water budget long-term trend inferred from salinity observations. Climate Dynamics 51, 2857–2876. doi: 10.1007/s00382-017-4053-7
Skoulikidis N. T. (1993). Significance evaluation of factors controlling river water composition. Env. Geo. 22, 178–185. doi: 10.1007/BF00789329
Smagorinsky J. (1963). General circulation experiments with the primitive equations. Mon. Weather Rev. 91, 99–164. doi: 10.1175/1520-0493(1963)0912.3.CO;2
Solidoro C., Cossarini G., Lazzari P., Galli G., Bolzon G., Somot S., et al. (2022). Modeling carbon budgets and acidification in the Mediterranean Seaecosystem under contemporary and future climate. Front. Mar. Sci. 8. doi: 10.3389/fmars.2021.781522
Takahashi T., Olafsson J., Goddard J., Chipman D. W., Sutherland S. C. (1993). Seasonal variation of CO2 and nutrients in the high-latitude surface oceans: a comparative study. Glob. Biogeochem. Cycles 7, 843–878. doi: 10.1029/93GB02263
Takahashi T., Sutherland S., Sweeney C., Poisson A., Metzl N., Tilbrook B., et al. (2002). Global sea-air CO2 flux based on climatological surface ocean pCO2, and seasonal biological and temperature effects. Deep Sea Res. Part II: Topical Stud. Oceanography. 49, 1601–1622. doi: 10.1016/S0967-0645(02)00003-6
Weiss R. F. (1974). Carbon dioxide in water and seawater: the solubility of a non-ideal gas. Mar. Chem. 2, 203–215. doi: 10.1016/0304-4203(74)90015-2
Wimart-Rousseau C., Wagener T., Álvarez M., Moutin T., Fourrier M., Coppola L., et al. (2021). Seasonal and interannual variability of the CO2 systemin the Eastern Mediterranean Sea: A case study in the north Western Levantine basin. Front. Mar. Sci. 8. doi: 10.3389/fmars.2021.649246
Wimart-Rousseau C., Wagener T., Bosse A., Raimbault P., Coppola L., Fourrier M., et al. (2023). Assessing seasonal and interannual changes in carbonate chemistry across two timeseries sites in the North Western MediterraneanSea. Front. Mar. Sci. 10. doi: 10.3389/fmars.2023.1281003
Keywords: ocean modelling, carbonate system, acidification, Mediterranean Sea, biogeochemical
Citation: Tsiaras K, Frangoulis C and Stamataki N (2024) Carbonate system variability in the Mediterranean Sea: a modelling study. Front. Mar. Sci. 11:1347990. doi: 10.3389/fmars.2024.1347990
Received: 01 December 2023; Accepted: 13 March 2024;
Published: 26 March 2024.
Edited by:
Abed El Rahman Hassoun, Helmholtz Association of German Research Centres (HZ), GermanyReviewed by:
Giovanni Galli, National Institute of Oceanography and Applied Geophysics, ItalyYuri Artioli, Plymouth Marine Laboratory, United Kingdom
Copyright © 2024 Tsiaras, Frangoulis and Stamataki. This is an open-access article distributed under the terms of the Creative Commons Attribution License (CC BY). The use, distribution or reproduction in other forums is permitted, provided the original author(s) and the copyright owner(s) are credited and that the original publication in this journal is cited, in accordance with accepted academic practice. No use, distribution or reproduction is permitted which does not comply with these terms.
*Correspondence: Kostas Tsiaras, ktsiaras@hcmr.gr