Mixed stock analysis identifies natal origins of green turtles at foraging grounds in southeastern Australia
 Joanna Day1,2*
  Jane Hall3
  Karrie Rose3
  Kimberly Vinette Herrin4
  Duane March5
  Olly Pitt6
  Nancy N. FitzSimmons7 Libby Hall4
  Kieran Marshall8
  Sigrid Iredell2 Phoebe Meagher1
- 1Taronga Institute of Science and Learning, Taronga Conservation Society Australia, Mosman, NSW, Australia
- 2School of Natural Sciences, Macquarie University, North Ryde, NSW, Australia
- 3Australian Registry of Wildlife Health, Taronga Conservation Society Australia, Mosman, NSW, Australia
- 4Taronga Wildlife Hospital, Taronga Conservation Society Australia, Mosman, NSW, Australia
- 5NSW National Parks and Wildlife Service, Department of Planning and Environment, Coffs Harbour, NSW, Australia
- 6Australian Seabird and Turtle Rescue, Ballina, NSW, Australia
- 7Australian Rivers Institute, Griffith University, Nathan, QLD, Australia
- 8Dolphin Marine Conservation Park, Coffs Harbour, NSW, Australia
Introduction: Identifying critical habitats for marine turtles and connectivity between genetic stocks and the foraging grounds they use is a conservation priority worldwide. Green turtles (Chelonia mydas) are impacted by a wide range of anthropogenic threats that can vary by geographic region and the ontogenetic stage of the individual. In Australia, the strengthening of the East Australian Current due to climate change is increasing ocean temperatures, particularly in southern New South Wales (NSW), which is having large-scale impacts on the distribution and abundance of marine resources. Green turtles are frequently observed in temperate southern NSW waters, but our knowledge of their habitat use, migration patterns and the impact of threatening processes is limited.
Methods: To assess the origins of green turtles from foraging grounds in southeastern Australia, samples were obtained from green turtles of all size classes (post-hatchlings to adults) that had stranded along an ~870 km expanse of the NSW coast and Lord Howe Island between 1997 and 2021. Mitochondrial DNA control region sequences for 283 individuals were compared to 25 potential source genetic stocks in the Indo-Pacific using mixed-stock analysis.
Results: A total of 26 haplotypes were identified in NSW, of which 14 had been previously observed at a rookery, eight had been identified previously, but not at a rookery (i.e. orphan haplotypes), and four were previously undescribed. Mixed-stock analysis revealed that NSW waters support multiple genetic stocks but are dominated by those of the southern Great Barrier Reef and New Caledonia genetic stocks. A small proportion of green turtles originated from more distant stocks in the Indo-Pacific region.
Discussion: Understanding the connectivity between green turtle rookeries and foraging grounds provides an opportunity to assess the impact of anthropogenic threats to turtle stocks, and in turn, prioritize management actions for the conservation of green turtles across regional, national and international jurisdictions.
1 Introduction
Seasonal migrations between geographically distant breeding and non-breeding grounds are common for threatened marine animals including turtles (Hays, 2008), whales (Mate et al., 2015), seabirds (Pinet et al., 2011), and sharks (Werry et al., 2014). These migratory behaviors can be complex, varying spatiotemporally and by sex and age (Druskat et al., 2019; Blevins et al., 2022). Despite the challenges of tracking migratory species, animal movement data are critical to our understanding of the species’ spatial ecology, population structure, vulnerability to anthropogenic threats and ability to adapt to environmental change (Block et al., 2005; McCauley et al., 2015; Paiva et al., 2015). Changes in ocean circulation and increased temperatures due to climate change are impacting marine species, causing alterations to species distributions, migration routes and gene flow (Robinson et al., 2009; Bates et al., 2014; Donelson et al., 2019). The impact may be more profound along subtropical Western Boundary Currents (WBCs), where the rate of sea surface warming is two to three times faster than the global mean (Wu et al., 2012). The East Australian Current (EAC) is a WBC that brings warmer waters from the tropics in Queensland to the temperate regions of New South Wales (NSW) (Wu et al., 2012) and it has experienced a poleward shift extending 92 km south over the past three decades (Li et al., 2022). Shifts in marine species distributions and assemblages as well as changes to ecological interactions between macroalgae, herbivores and higher-order predators have been increasingly documented due to the warming EAC (Thompson et al., 2009; Wernberg et al., 2011; Carroll et al., 2016; Vergés et al., 2016). Understanding these changes is critical to adaptive wildlife management frameworks to increase species resilience to climate change and reduce cumulative threats to the marine ecosystem (Allen and Singh, 2016; Ogburn et al., 2017).
Marine turtles are long-lived, circumglobally distributed reptiles that undertake large-scale migrations between breeding grounds and feeding areas (Hamann et al., 2010). Many marine turtle populations have experienced severe population declines as a result of anthropogenic threats, including climate change, unsustainable harvesting, pollution, marine debris, habitat degradation and disease (Wallace et al., 2011). The six species of turtles occurring in Australian waters are protected under both state and national legislations and international agreements (Commonwealth of Australia, 2017). Green turtles (Chelonia mydas) are listed as Vulnerable in Australia under the Environment Protection and Biodiversity Conservation Act 1999 (EPBC Act, 1999) and Endangered globally by the International Union for Conservation of Nature (IUCN Red List, Seminoff, 2004), for which nine genetically distinct genetic stocks (i.e. populations, Management Units [MUs]) have been identified in Australia and at least 25 in the greater Indo-Pacific region (Jensen et al., 2016b). Despite long-term research programs (Limpus, 2008), the demographics and geographic boundaries of many genetic stocks in the Indo-Pacific region are not well understood. To assess the impact of threatening processes on these genetic stocks, a greater understanding of migration patterns between breeding and foraging grounds is critical to develop effective conservation management strategies that mitigate threats at the appropriate geographic and population scale (Hamann et al., 2010; Komoroske et al., 2017). This is especially the case in NSW, which has been identified as an important foraging site for green turtles (Commonwealth of Australia, 2017) but where multiple threats to turtles are known to occur (de Gouvea Pedroso et al., 2020; Peddemors and Dalton, 2022). Further, green turtles are now more frequently sighted in southern NSW waters compared to 30 years ago (Figure 1; Atlas of Living Australia), likely due to the southern extension of the EAC and increasing sea surface temperatures in this region.
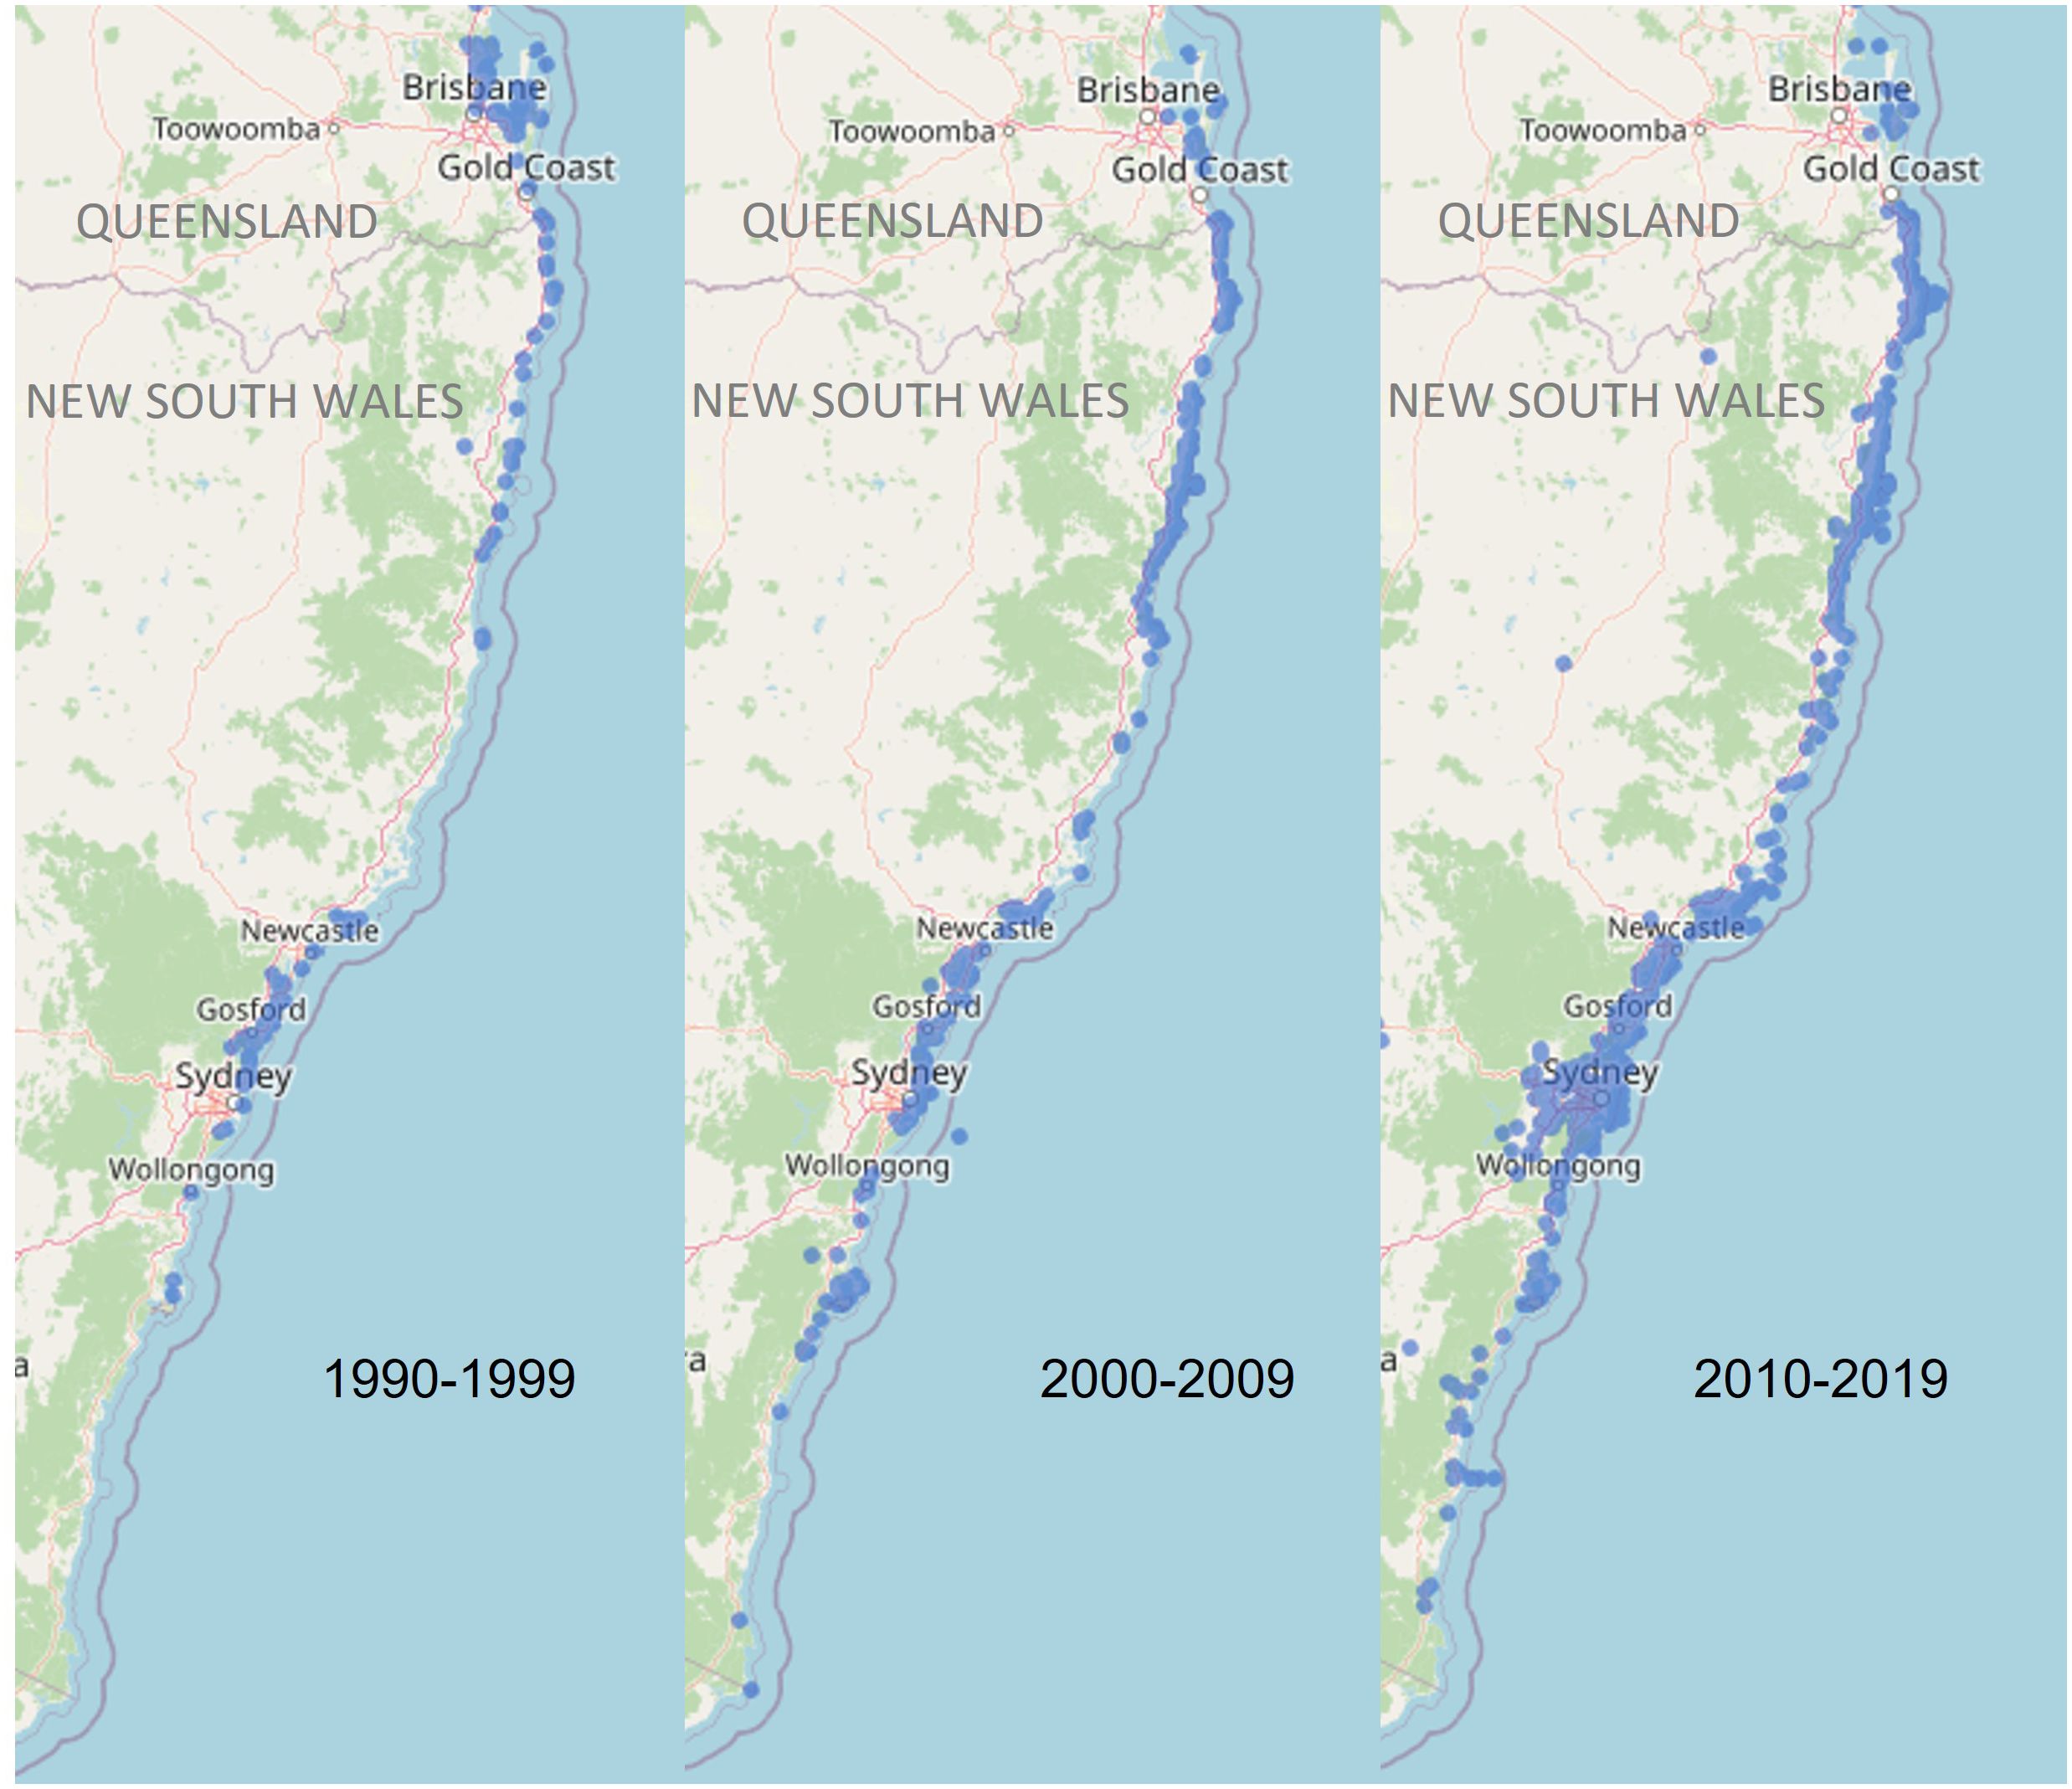
Figure 1 Green turtle sightings recorded in New South Wales for each decade between 1990 and 2019 (Data accessed from the Atlas of Living Australia).
Research using tagging, satellite telemetry and genetic techniques have greatly improved our knowledge of population structure, spatiotemporal migration patterns and foraging ecology of green turtles globally. Green turtles undergo ontogenetic habitat and diet shifts during their life histories (Arthur et al., 2008). After hatching, green turtles migrate to pelagic environments and are influenced by oceanic currents for ca. 3 - 5 years (Musick and Limpus, 1996; Reich et al., 2007). Juvenile green turtles recruit to marine and estuarine habitats, feeding primarily on seagrass and macroalgae (Limpus, 2008; Esteban et al., 2020). As juveniles through to adults, green turtles spend a large proportion of their lives on foraging grounds and can show high site fidelity to specific foraging areas (Broderick et al., 2007; Dutton et al., 2019; Siegwalt et al., 2020). Adult green turtles temporarily return to breeding grounds, which based on global datasets, can be over 2,800 km (average ~ 800 km) away from foraging grounds (Hays and Scott, 2013). These adult migrations are significantly less than the mean distances for post-hatchlings migrating away from the natal nesting sites during their pelagic juvenile development stage (~ 4,500 km, Hays and Scott, 2013). Migration distances and foraging locations can vary considerably among individuals of the same genetic stock (Read et al., 2014; Tanabe et al., 2023) and green turtle foraging grounds are often found to support multiple stocks (Komoroske et al., 2017).
Estimating the contribution of source populations to foraging aggregations using Mixed Stock Analysis (MSA) has been widely used to understand population boundaries and complex migration patterns of marine megafauna, including turtles (Bowen et al., 2007; Vargas et al., 2008; Garofalo et al., 2013) and whales (Schmitt et al., 2014; Brüniche-Olsen et al., 2018). MSA has also been instrumental in improving fisheries management outcomes by identifying biologically relevant population units (Dahle et al., 2018; Fields et al., 2020; Euclide et al., 2021). Because green turtle genetic stocks have generally been delineated using the maternally inherited mitochondrial DNA (mtDNA) control region, mtDNA haplotype frequencies can be used to assess the mixed stock composition at foraging grounds across their global distribution (Proietti et al., 2013; Dutton et al., 2019; Jensen et al., 2019; Piovano et al., 2019; Jensen et al., 2020). MSA can also contribute to our understanding of the impact of climate change on green turtles (Jensen et al., 2018). A combination of factors, including ocean current patterns, geographic distance, and relative genetic stock size have been found to significantly influence the composition of green turtle foraging grounds (Lahanas et al., 1998; Jensen et al., 2020; Kynoch et al., 2022; Stahelin et al., 2022). Findings of foraging turtles that originate from distant rookeries (Naro-Maciel et al., 2014; Read et al., 2015; Jones et al., 2018) and size class segregation at different foraging grounds (Hamabata et al., 2018) indicate that additional drivers, such as active swimming, geomagnetic imprinting and environmental conditions, may influence foraging habitat selection by juveniles (Lohmann et al., 2008; Naro-Maciel et al., 2014; Read et al., 2014; Putman and Mansfield, 2015).
This study aimed to assess the genetic diversity and genetic stock origins of green turtles stranded along the NSW coast in southeastern Australia. The adults, sub-adults and juveniles sampled were presumed to represent the foraging turtles of coastal NSW based on diet analysis conducted on a subset of samples (Glen, 2021) and the rarity of nesting events in NSW (NSW Department of Planning and Environment). Identifying the connectivity between genetic stocks and NSW foraging grounds will increase our understanding of factors influencing migratory patterns in this species and how threatening processes in NSW are impacting green turtle genetic stocks in the greater Indo-Pacific region.
2 Material and methods
2.1 Sample collection
Samples were obtained from green turtles of all size classes (post-hatclings to adults) that had stranded over a 24-year period between 1997 and 2021. Stranding events spanned an ~ 870 km latitudinal range of the NSW coast, from Tweed Heads in the north (-28.1704, 153.5508) to Ulladulla in the south (-35.3587, 150.4784), as well as Lord Howe Island, which lies 600 km directly east of Port Macquarie, NSW, in the Tasman Sea (Figure 2). Blood and tissue samples were opportunistically collected from live and deceased animals by professionals at several organizations in NSW, including Taronga Conservation Society Australia, Australian Seabird and Turtle Rescue, Dolphin Marine Conservation Park, Irukandji Shark & Ray Encounters, NSW TurtleWatch Citizen Science Nesting Program, NSW Department of Primary Industries and NSW National Parks and Wildlife Service. Samples from skin, muscle, liver, kidney or scute were collected from each individual using a sterile scalpel or biopsy punch and preserved at -20°C or -80°C, usually in ethanol (70-100%). Blood spots were stored dry on Whatman’s grade 5 filter papers at -20°C or on Whatman FTA cards (GE Healthcare, Illinois, USA) at room temperature. Whole blood samples in EDTA or ethanol (95-100%) were stored at -20°C.
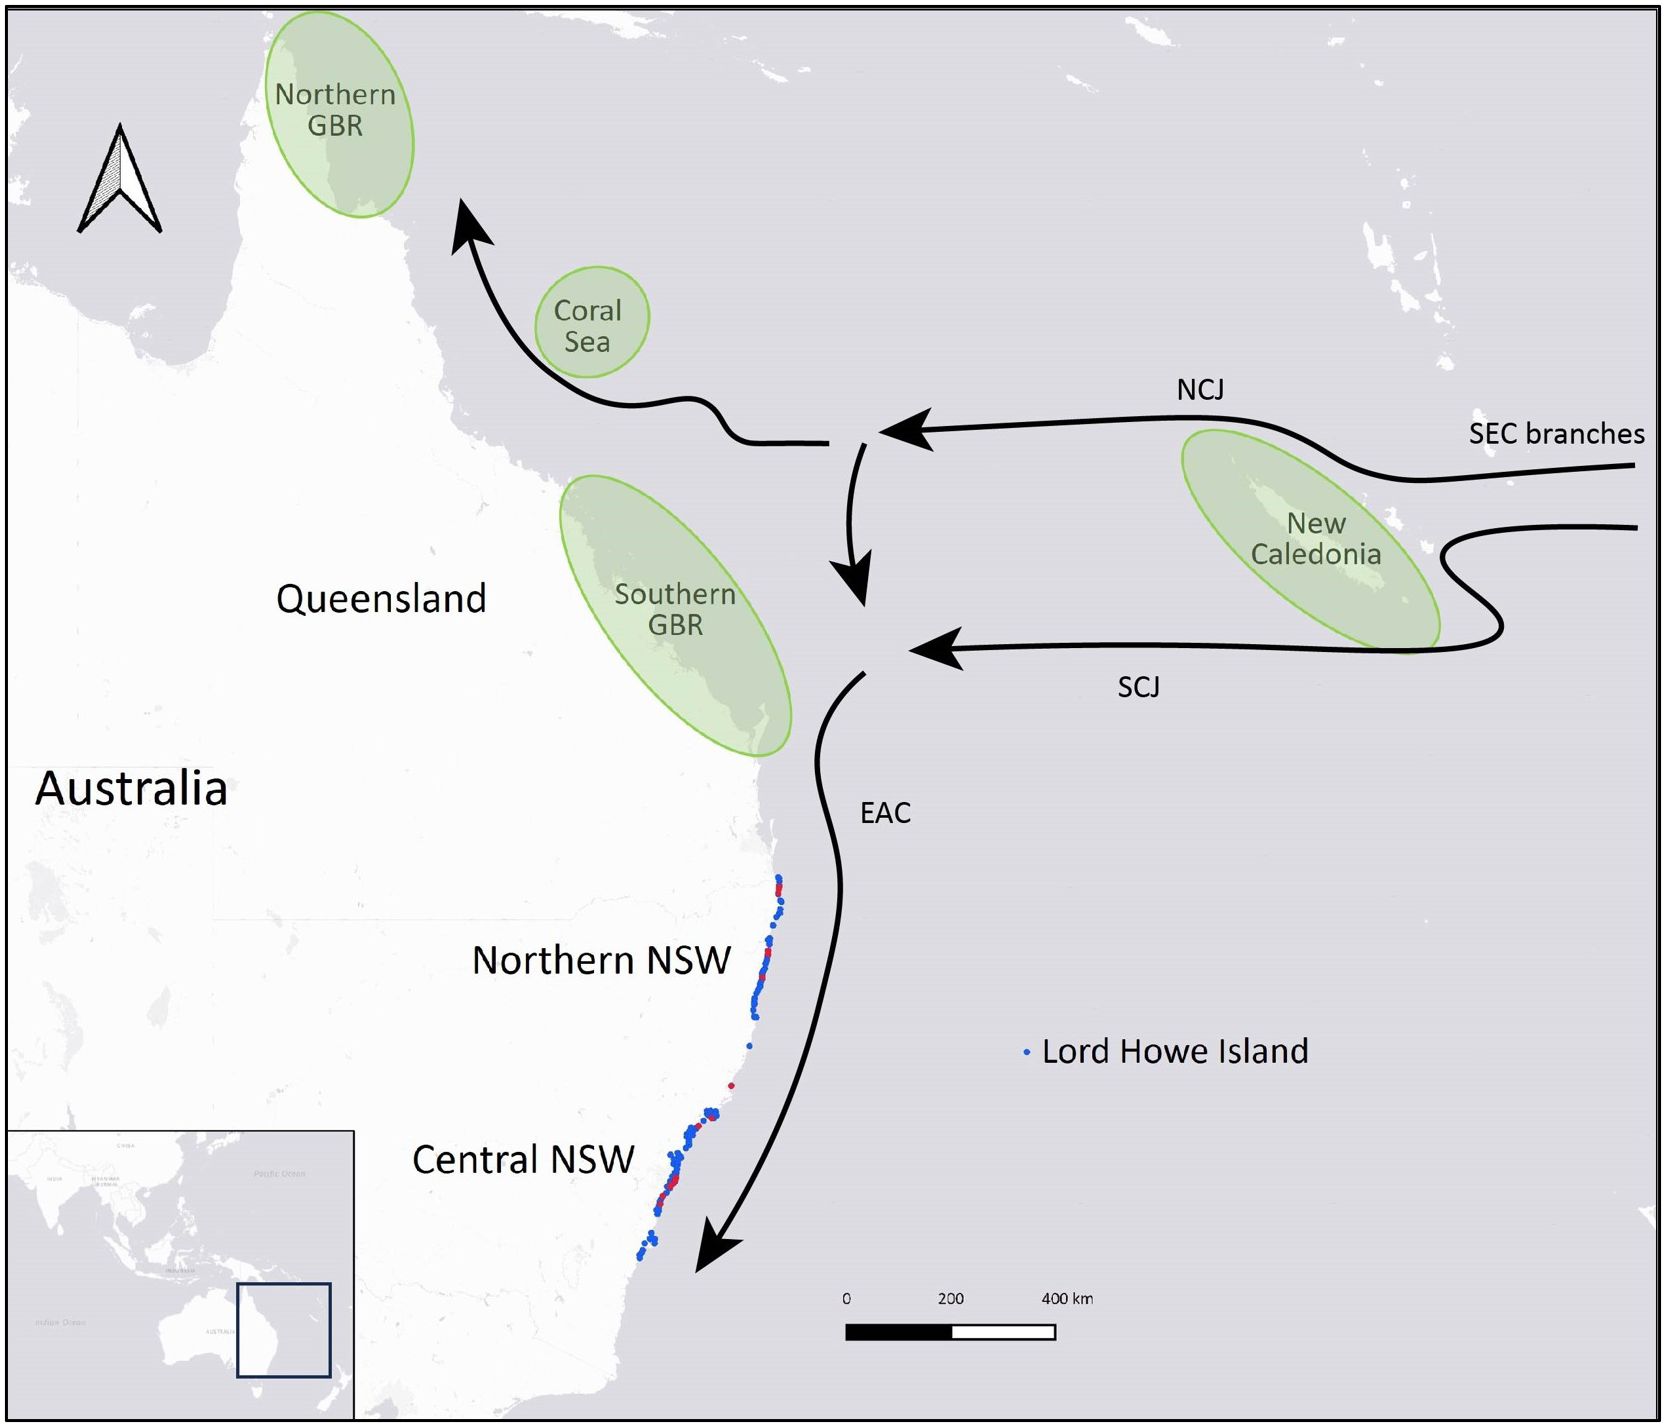
Figure 2 Geographic distribution of samples collected from stranded green turtles (Chelonia mydas) along the New South Wales (NSW) coast that were analyzed after successfully sequencing a mitochondrial DNA control region fragment. Blue circles represent adult-sized, subadult and juvenile turtles, and red circles represent post-hatchlings. Schematic illustrations on the map show the locations of the four closest green turtle genetic stocks to NSW (northern and southern Great Barrier Reef, Coral Sea and New Caledonia) in green (adapted from Commonwealth of Australia, 2017) and major surface currents influencing turtle migrations: East Australian Current (EAC) and the branching of the South Equatorial Current (SEC) into South Caledonian Jet (SEJ) and North Caledonian Jet (NCJ) (adapted from Oke et al., 2019).
Size classes were determined based on the individual’s curved carapace length (CCL) or straight carapace length (SCL) at the time of capture: adult-sized (> 86 cm CCL), subadults (65 – 86 cm CCL), juveniles (38 – 64 cm CCL), and post-hatchlings (> 5.5 - 37 cm CCL) (Chaloupka and Limpus, 2005; Limpus, 2008; Limpus and FitzSimmons, 2020). Adult-sized turtles may include a combination of adult and immature individuals since the size of the smallest nesting females varies by population (Limpus et al., 2003; Limpus, 2008). For seven turtles, size class was estimated based on the animal’s weight as carapace lengths were not recorded: 86 to 137 kg for adult-sized (n = 2), 55 kg for one sub-adult, and 6 – 12kg for juveniles (n = 4) (Limpus, 2008; Duncan et al., 2021). The minimum post-hatchling size was determined based on the maximum size of hatchlings (5.35 cm SCL) recorded on the southern GBR (Limpus et al., 1984). The regression equation from Teas (1993) was used for SCL – CCL conversions: SCL = 0.294 + (0.937 × CCL). Since the size of turtles recruiting to NSW foraging grounds is unknown, the maximum CCL of the post-hatchling size class was based on the largest post-hatchling recorded on the eastern Australian coast (34.7 cm CCL; Boyle, 2006), the smallest new recruit (37.6 cm CCL) observed at a foraging site in the southern GBR region (Limpus and FitzSimmons, 2020), and spike in numbers of stranded turtles observed in this study with CCL ≥ 38 cm (Supplementary Figure 1). Maturing and adult-sized males were identified if their tail length was greater than 15 cm (Limpus and Reed, 1985). Some animals that were sampled post-mortem were sexed by gross or histological appearance of gonadal tissue. Location of stranding events were mapped in QGIS (ver. 3.22.3; http://www.qgis.org) using global-positioning system (GPS) coordinates, or if not available, the GPS coordinates were estimated based on the general location recorded. To assess latitudinal differences in genetic diversity and stock composition of green turtles in NSW, two aggregations were identified based on the concentration of samples: Northern NSW and Central NSW (Table 1, Figure 3). Geographic distance between the approximate centers of NSW foraging aggregations and genetic stocks was estimated by measuring the shortest sea distance in Google Maps®.
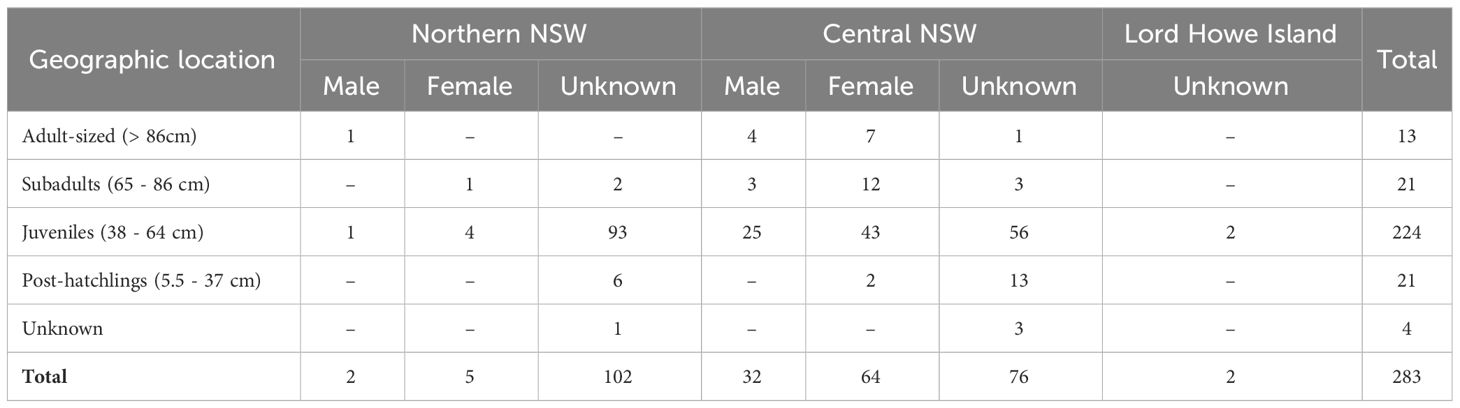
Table 1 Number of green turtles sampled in New South Wales, Australia, by size class (curved carapace length range), sex and geographic location.
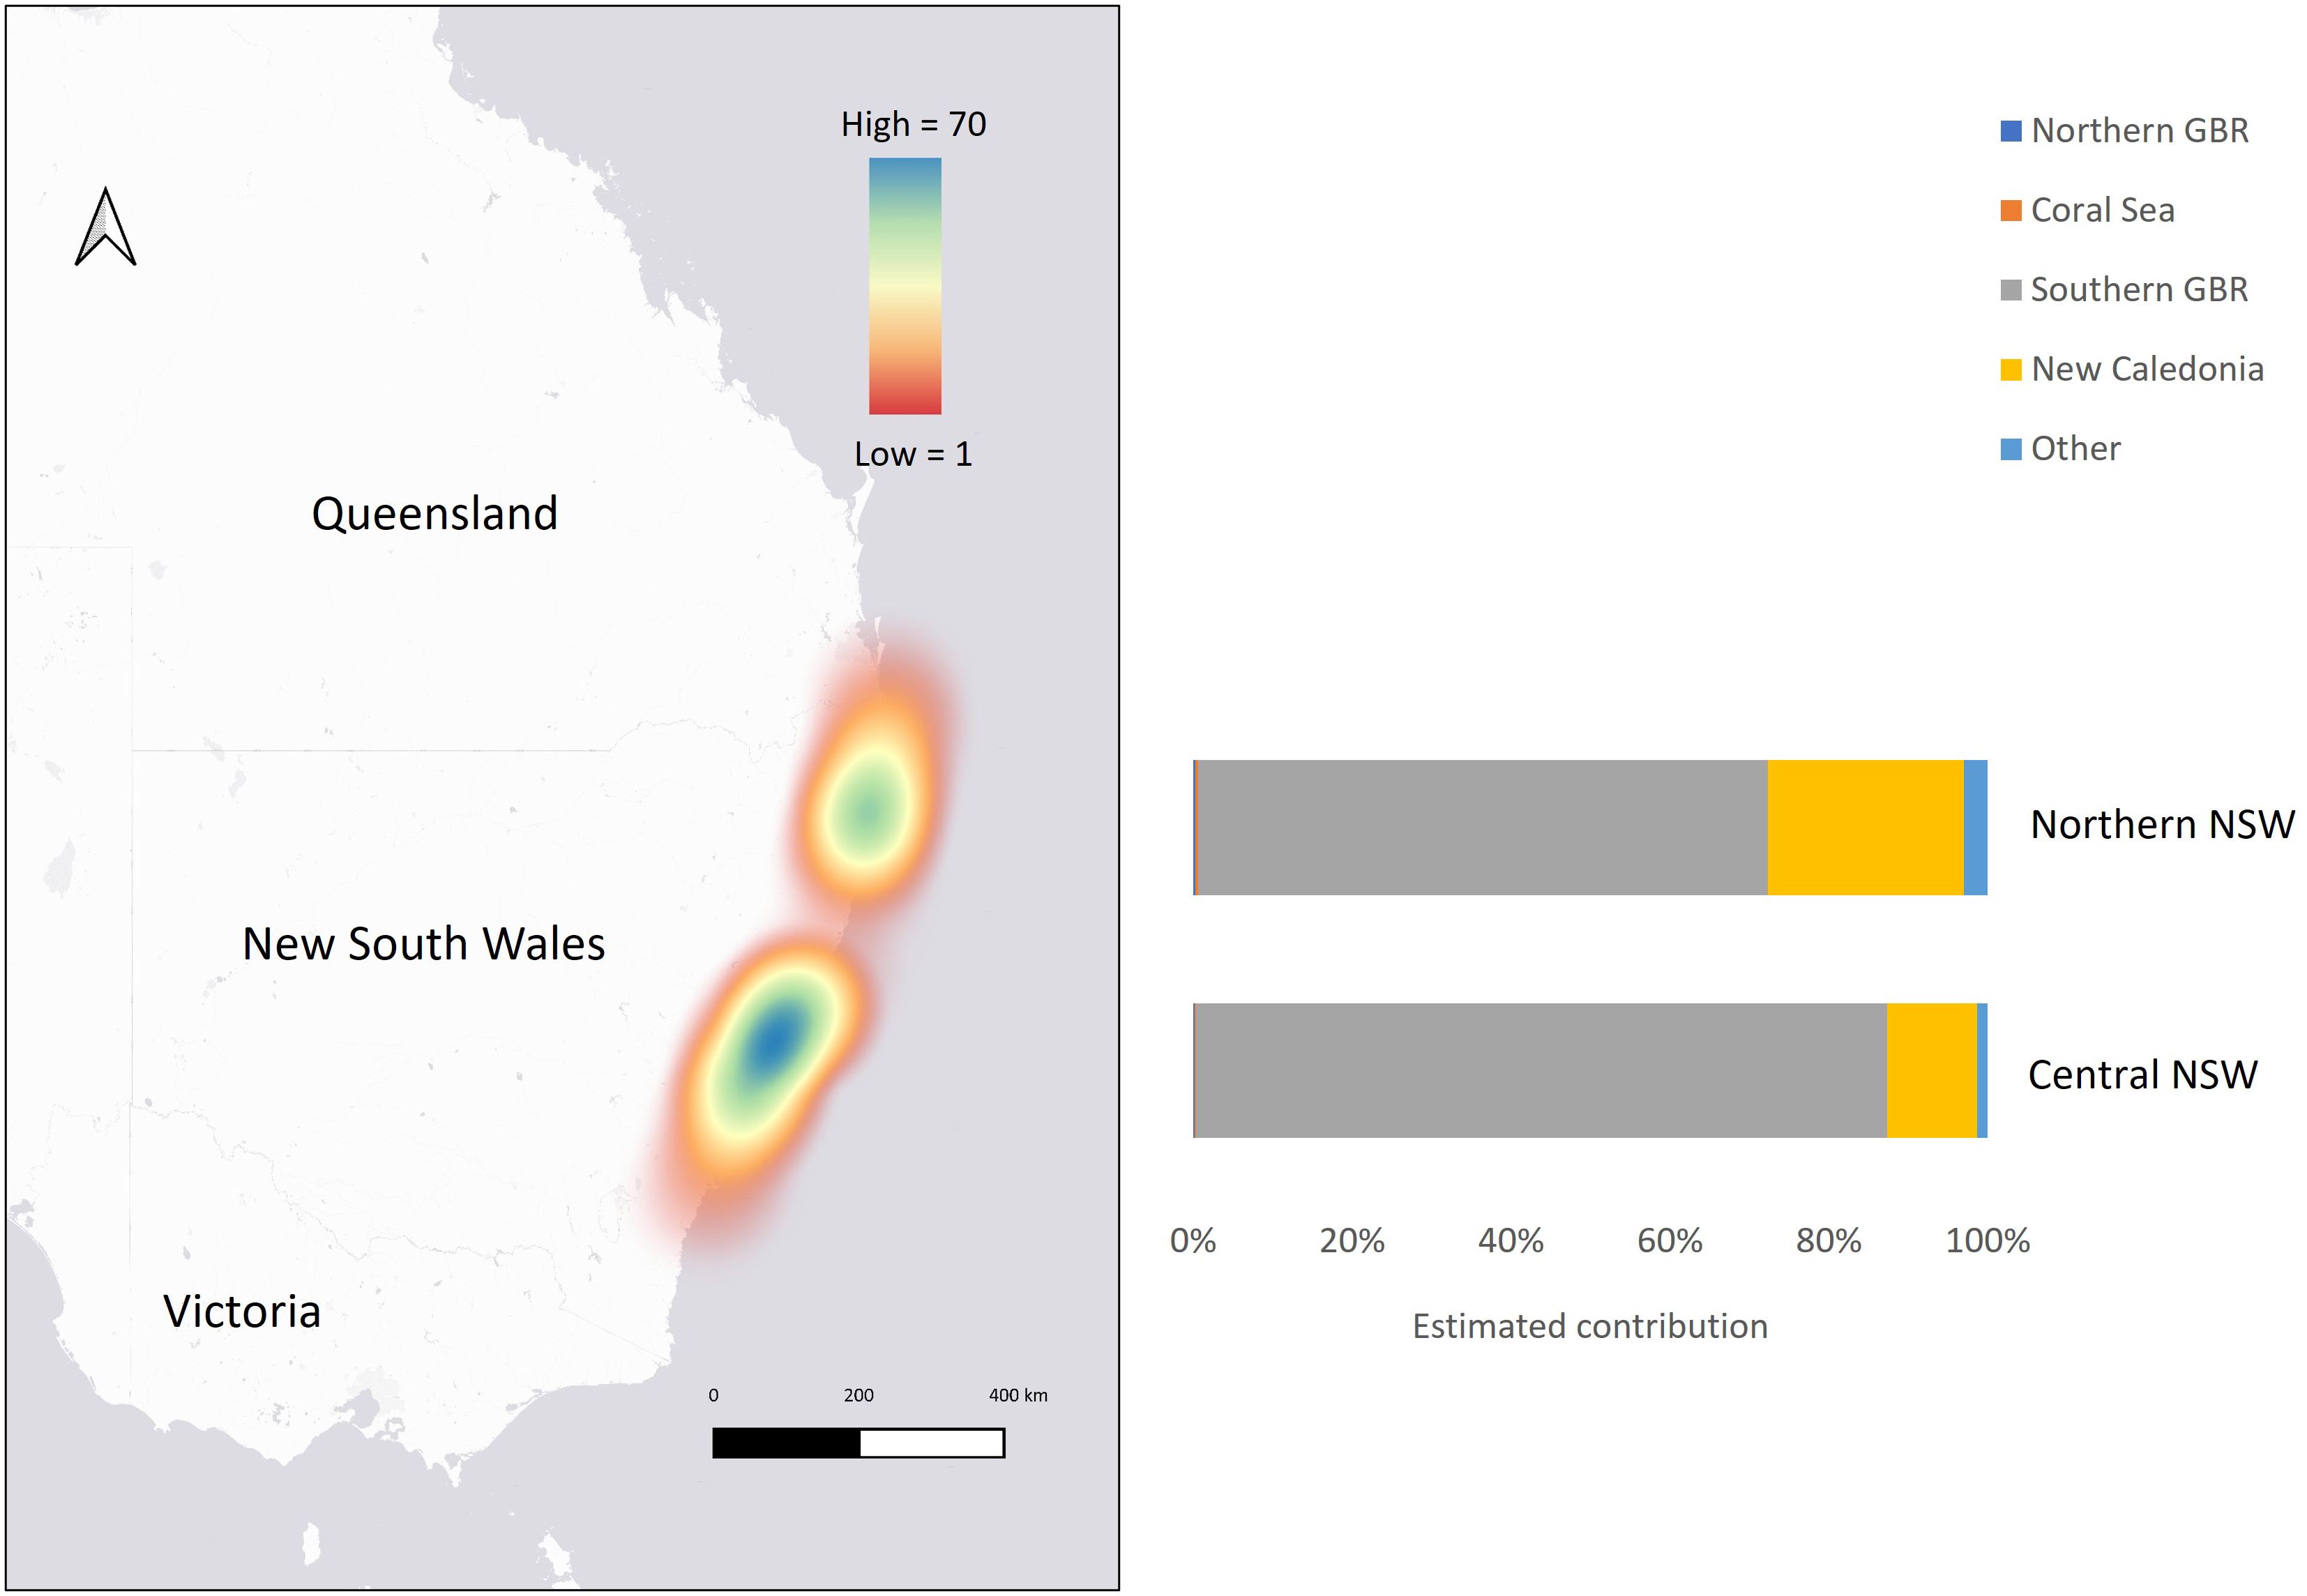
Figure 3 Map showing the concentration of samples collected from adult-sized, subadult and juvenile size classes of green turtles stranded in New South Wales (NSW), with mixed stock analysis results showing the estimated contributions from genetic stocks to northern NSW and central NSW aggregations (based on uniform priors).
2.2 Laboratory analysis
Genomic DNA was extracted from tissue samples (excluding liver) using a salting-out protocol (Sunnucks and Hales, 1996). Dried blood spots were extracted using the Qiagen QIAamp DNA Mini Kit, and whole blood and liver samples were extracted using the Qiagen DNeasy Blood & Tissue Kit (Qiagan PTY LTD, VIC, Australia). DNA extractions followed standard manufacturer protocols with the addition of RNase A (Qiagan). For blood samples in ethanol, the incubation period after the addition of buffer ‘AL’ was increased from 10 min to 1.5 hrs.
An ~ 880 bp fragment of the mtDNA control region (d-loop) was amplified by polymerase chain reaction (PCR) using primers LCM-15382 (Abreu et al., 2006) and H950g-T (5’-cagtgagcagtgatgtgataGTCTCGGATTTAGGGGTTTG-3’) (Abreu et al., 2006, modified by N. FitzSimmons, to include a tail on the 5’ end, shown in lower case, which was used as the sequencing primer). The 20 μl PCR reaction contained ~ 50 ng of template DNA, 10 µL MyTaq Mix 2x (Bioline, NSW, Australia), 0.36 µM of each primer (Sigma-Aldrich, NSW, Australia) and 0.1 μg/μL of bovine serum albumin (Sigma-Aldrich). The PCR amplification profile consisted of an initial denaturing stage (95°C for 3:35 min), a ramp-up phase (95°C for 25 s, annealing temperatures increasing every two cycles from 50 to 52°C in increments of 1°C for 25 s, and 72°C for 30 s), 30 cycles of 95°C for 25 s, 52°C for 25 s and 72°C for 30 s, and a final extension stage (72°C for 2 min). Negative controls were included in all PCR reactions to detect contamination. The quality and quantity of DNA extracts and PCR products were assessed using a Nanodrop spectrophotometer as well as electrophoresis in 1-1.5% agarose gels using SYBR Safe DNA Gel Stain (Invitrogen, Massachusetts, USA). PCR products were sent to the Ramaciotti Centre for Genomics (University of New South Wales Sydney, Australia) for purification with Exo-SAP-IT and sequencing with the Applied Biosystems AB3730 DNA Analyzer (Thermo Fischer Scientific, Massachusetts, USA).
All mtDNA sequences were aligned with Geneious Prime (ver. 2021.1.1, https://www.geneious.com) using a global alignment with free end gaps. All variable positions were reviewed and confirmed manually. For quality control, approximately 12% of samples were sequenced in both the forward and reverse directions and an additional 10% of samples were chosen randomly for re-sequencing as positive controls. Sequences were cropped to ~ 770 bp for comparisons with published green turtle haplotypes. Haplotypes were assigned by comparing aligned sequences against a reference library of mtDNA haplotypes and by searching the GenBank database using the Basic Local Alignment Search Tool (https://blast.ncbi.nlm.nih.gov/Blast.cgi). If a new haplotype was identified, the DNA was re-sequenced in both the forward and reverse directions and verified as a new haplotype by an experienced, independent person. Haplotype naming was conducted in accordance with Pacific green turtle nomenclature, with the assistance of the Southwest Fisheries Science Center, National Oceanic and Atmospheric Administration (NOAA).
2.3 Statistical analysis
To measure levels of genetic diversity, the best-fit substitution model for the green turtle mtDNA sequence data was determined using MEGA ver. 11 (Tamura et al., 2021). Haplotype (h) and nucleotide (π) diversity were calculated for all NSW samples overall and for the northern and central NSW clusters using the Tamura & Nei (1993) model in ARLEQUIN ver. 3.5.2.2 (Excoffier and Lischer, 2010). Differences in haplotype frequencies between sexes and by geographic location were assessed using an exact test in ARLEQUIN. Analyses were conducted using 500,000 steps in a Markov chain and 100,000 dememorization steps. Samples collected from Lord Howe Island (n = 2) and from post-hatchlings (n = 21) were excluded from those statistical tests.
The proportional contributions of green turtle genetic stocks to the turtles sampled in NSW were estimated by MSA using a Bayesian approach in BAYES (Pella and Masuda, 2001). The baseline dataset contained published haplotype frequencies of 25 potential source genetic stocks in the Indo-Pacific region (Supplementary Table 1; Jensen et al., 2016b; Piovano et al., 2019). For the NSW ‘mixed stock’ dataset, only haplotypes that were contained in the baseline dataset were included. For each analysis, four independent chains were run with different starting points. The runs consisted of 50,000 Markov Chain Monte Carlo steps, with a burn-in of 25,000. To test for convergence of chains, the Gelman and Rubin shrink factor diagnostic was calculated, where shrink factors less than 1.2 indicate convergence (Pella and Masuda, 2001). The MSA was conducted for the size classes of stranded turtles that were likely foraging in NSW: adult-sized, subadults and juveniles combined. Four individuals of unknown size class due to missing morphometric measurements were also included since they were noted as subadults at the time of sampling. The analysis was also conducted by sex and geographic location (Central and Northern NSW; Figure 3), excluding post-hatchlings and the two juveniles that stranded on Lord Howe Island. A separate MSA was conducted for post-hatchlings since these samples may offer insights into the natal origins of pelagic post-hatchlings drifting into NSW waters. The MSA was conducted using uniform priors, where potential source genetic stocks had an equal probability of contributing to the mixed-stock, and two models using weighted priors (Supplementary Table 1): incorporating the relative 1) size of each genetic stock (sizes obtained from Piovano et al., 2019), and 2) distance between foraging aggregation and genetic stock (used only for geographic location MSA). The geographic distance prior (DP) was calculated for each stock using the equation: , where D is the distance from the mixed aggregation to the genetic stock and Dmax is the distance of the furthest genetic stock to the mixed aggregation.
3 Results
3.1 Genetic variation
A total of 283 samples were collected from green turtles that had stranded in NSW (Table 1). For individuals that could be sexed, a total of 69 females and 34 males were identified. Turtle size ranged from 6 to 101 cm CCL (Supplementary Figure 1).
Sequence alignment of the ~ 770 bp fragment of the mtDNA control region revealed 78 polymorphic sites, defining 26 unique haplotypes across all green turtles sampled across NSW (Table 2). The most common haplotype was CmP47.1, which was found in 73% of individuals analyzed, followed by CmP80.1 (8%) and CmP85.1 (4%). The remaining haplotypes were identified in low frequencies (< 2.2%). Of the 26 identified haplotypes, thirteen had been previously identified in the 25 genetic stocks in the Indo-Pacific region, representing 95% of sampled individuals (n = 268). One individual was found with haplotype CmP4.6 that originated from rookeries in the eastern Pacific region (Dutton et al., 2014) and was therefore excluded from the MSA. Eight haplotypes detected across 4% of individuals sampled have not previously been detected at rookeries, but have been documented as ‘orphan haplotypes’ at foraging grounds in Queensland (CmP166.1, CmP192.1, CmP182.1: CmP186.1; Jensen et al., 2016b), northern New Zealand (KX685265; Godoy, 2017), Torres Strait (CmP161.1 and CmP186.1; Jensen et al., 2016b), Palmyra Atoll and Ecuador (CmP97.1; Naro-Maciel et al., 2014; Chaves et al., 2017). Four new haplotypes were discovered in NSW, of which three were different to CmP47.1 by 1 bp and one was different to the most closely related haplotypes CmP237.1 and CmP84.1 by 6 bp. Sequences of the four new haplotypes have been archived on NCBI GenBank (Table 2).
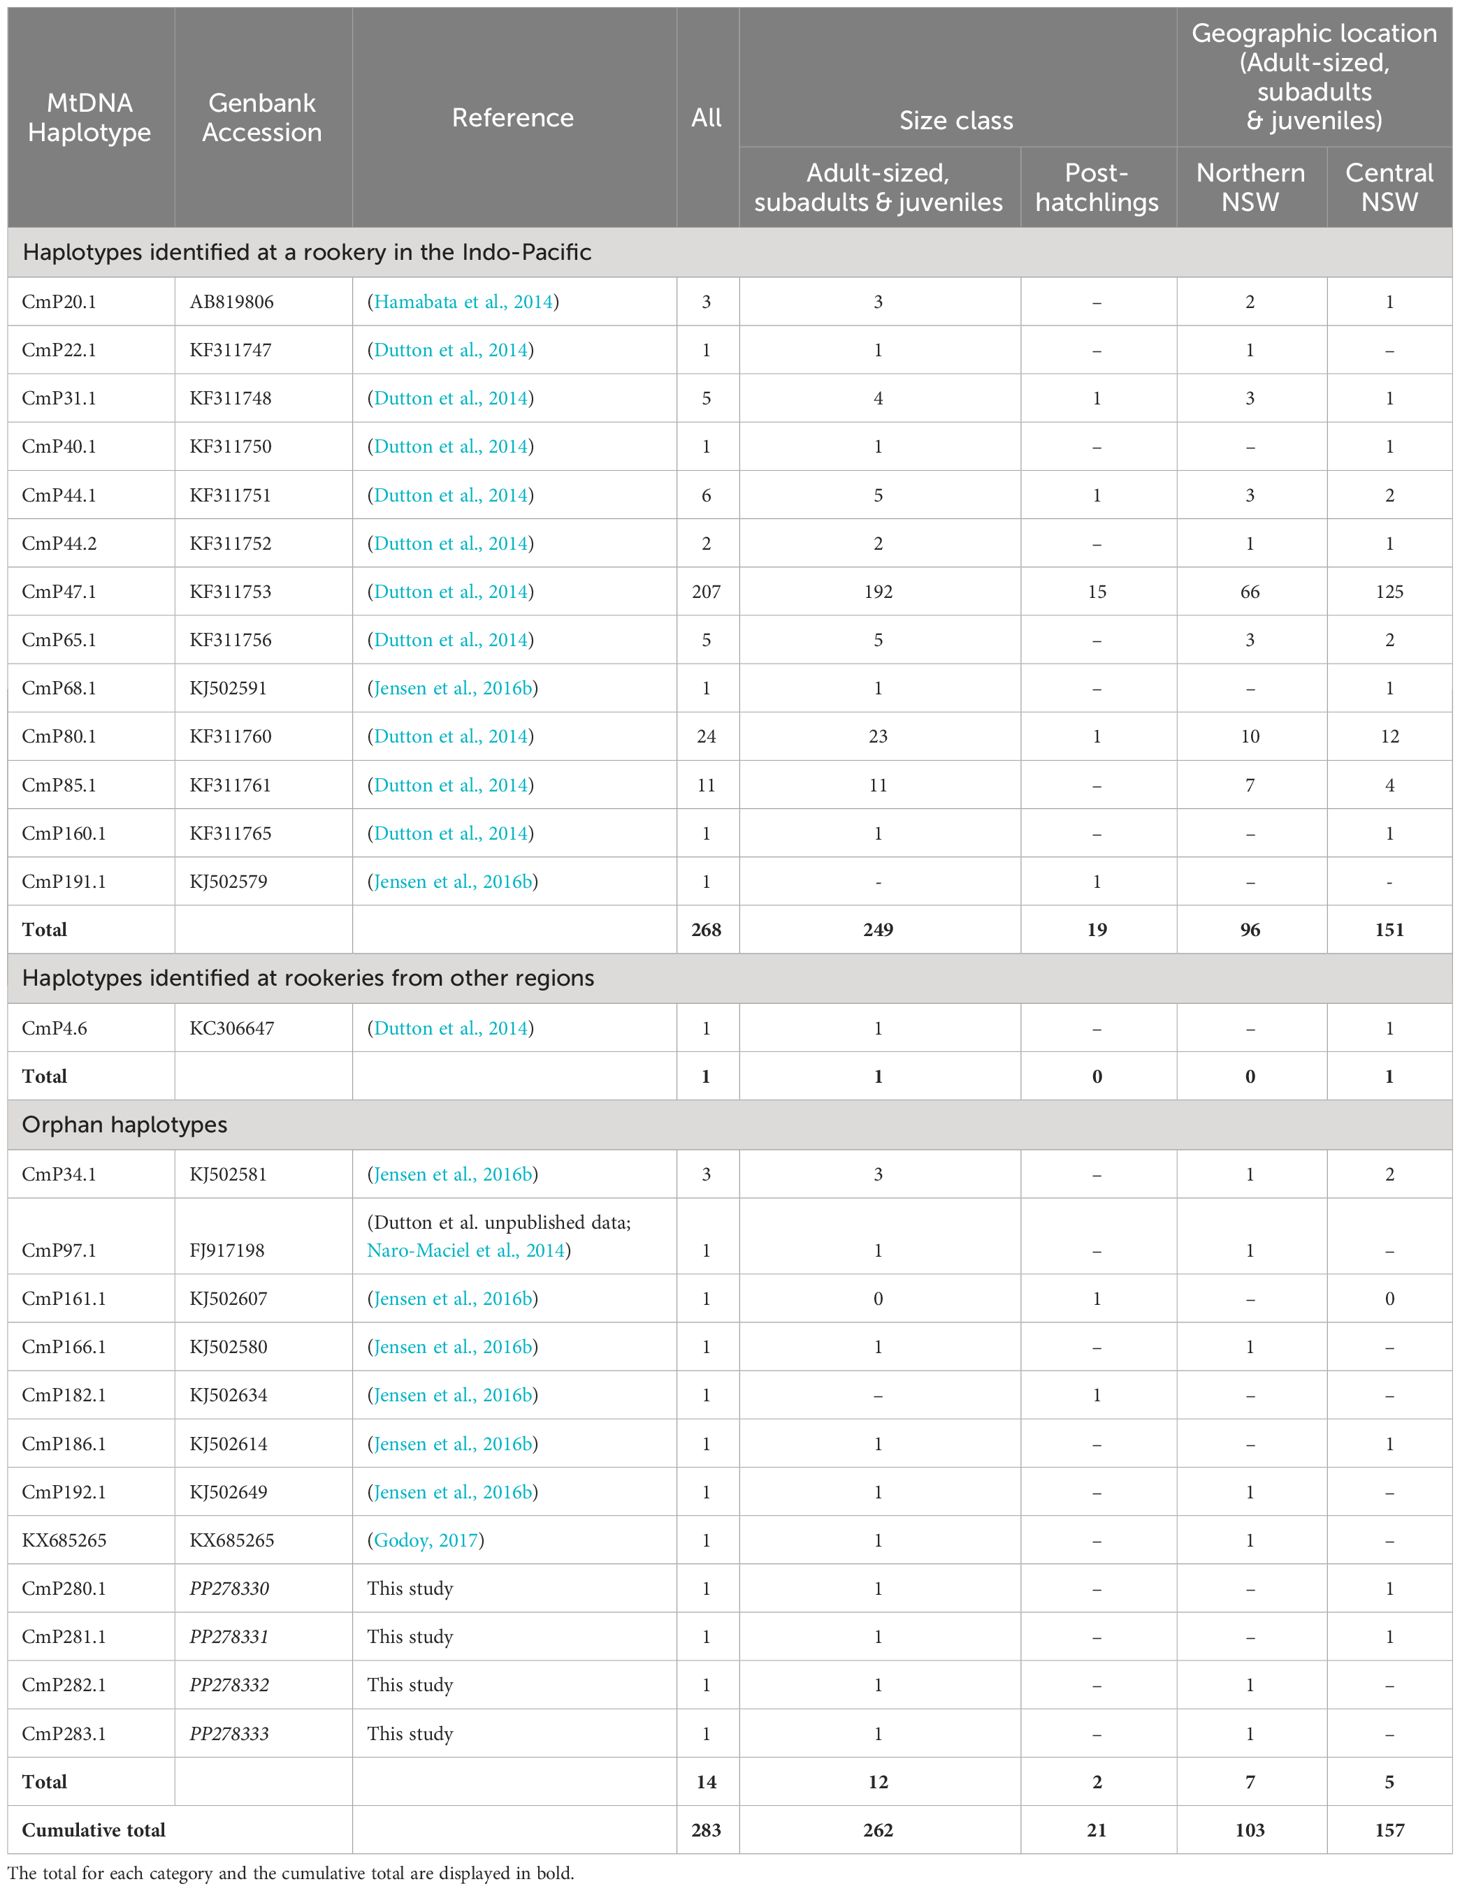
Table 2 Haplotype frequencies of green turtles sampled in New South Wales, Australia by size and geographic location.
Overall, haplotype diversity (h ± SD) for NSW green turtles (n = 283) was 0.4563 ± 0.0366 and nucleotide diversity (π ± SD) was 0.0129 ± 0.0066. Higher levels of diversity were found in northern NSW (h: 0.5772 ± 0.0562; π: 0.0157 ± 0.0079; n = 103) compared to central NSW where a larger number of samples were obtained (h: 0.3610 ± 0.0490; π: 0.0111 ± 0.0057; n = 157). Haplotype frequencies were not significantly different between northern and central NSW aggregations or between sexes (p > 0.05).
3.2 Mixed stock analysis
The Gelman–Rubin shrink factor for each MSA was < 1.15, indicating convergence of all chains. Further, results of the MSA using uniform priors and weighted models using stock size and geographic distance as priors were similar (Table 3; Supplementary Table 2). Overall, regional mixed stock estimates showed that NSW waters support multiple green turtle genetic stocks but are dominated by the geographically closest genetic stock from the southern GBR. Mean values of 82 – 84% of adult-sized, subadults and juvenile turtles in NSW were estimated to originate from the southern GBR, with 15% derived from New Caledonia. The estimated contribution of the northern GBR and the Coral Sea were small (< 3.6%) for all estimates of adult-sized, sub-adult and juvenile turtles. Estimated contributions for the 21 more distant stocks in the Indo-Pacific were less than 2% and all 95% confidence intervals (CIs) spanned zero so they were combined into ‘other’ for comparative purposes. MSA estimates were similar between northern and central NSW based on overlapping 95% CIs. The southern GBR genetic stock was estimated to be the highest contributor to both the northern NSW (69 – 72%) and central NSW (88 – 89%) stranded turtles. The New Caledonia genetic stock was estimated to contribute more (23 – 24%) to the northern NSW foraging ground composition compared to the estimate (9 - 10%) for central NSW (Table 3; Figure 3). The estimated contribution of ‘other’ stocks to northern NSW was also higher (6% using uniform and distance weighted priors; 3% using stock size priors) compared to central NSW (1 – 2%).
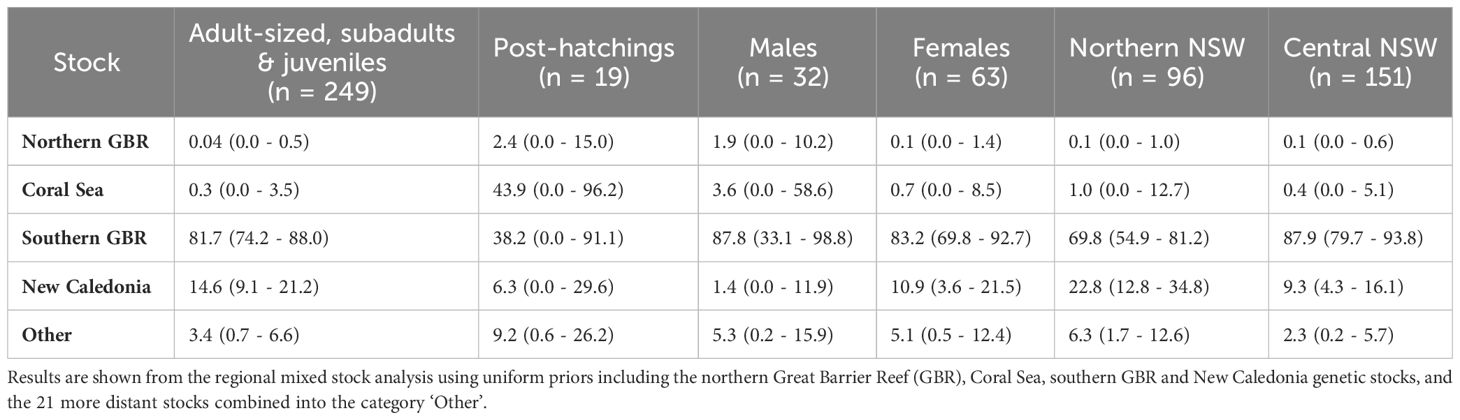
Table 3 Estimated contributions (mean % ± 95% confidence intervals) of 25 green turtle genetic stocks to New South Wales green turtle aggregations by size class, sex, and location.
The contribution of southern GBR stock suggested higher values for males (88 - 92%) and females (83 - 86%) but the 95% CI overlapped. In contrast, the contribution of the New Caledonia stock differed between the sexes, with 11% of females estimated to have originated from this stock but 0 – 1% for males (Table 3, Table S2). For the post-hatchling size class, 29 - 38% of individuals were estimated to originate from the southern GBR stock, 44 - 55% from the Coral Sea stock, and 9% from the more distant combined genetic stocks. However, large 95% CIs that spanned zero indicate uncertainty of these estimates, which may have arisen from the small sample size. Potential differences in stock composition between adult-sized, subadult, and juvenile turtles as well as temporal changes in stock contribution could not be assessed due to uneven sampling sizes across these size classes (Table 1), and the extended temporal timeframe of sample collection.
4 Discussion
Results of the MSA showed that green turtle foraging grounds in NSW support multiple genetic stocks but are dominated by those from the southern GBR, and to a lesser extent, New Caledonia. The similarity of estimates using uniform priors and priors weighted by stock size and geographic distance, and the corresponding CIs suggests that the MSA results are robust. The importance of these findings, based on opportunistically collected samples from stranded animals, is two-fold. Firstly, the quantification of stock composition provides critical insights into the migration patterns and post-migration residence of foraging green turtles at the southern-most extent of the species’ distribution in Australia, in a region where very little research has been conducted. From a broader perspective in the Indo-Pacific, the MSA of stranded turtles indicating their origins from southern GBR and New Caledonia supports limited tag recovery data from southern GBR turtles (Limpus, 2008), and documents the proportional representation of these two stocks/MUs in the temperate waters of NSW, thus better informing the way this species should be managed in NSW.
Finding that over ~ 80% of adult-sized, sub-adult and juvenile turtles in NSW originate from the closest genetic stock in the southern GBR provides strong evidence that geographic distance influences stock composition in NSW. Similar to other turtle foraging aggregations in the Indo-Pacific (Read et al., 2015; Jensen et al., 2016b; Jones et al., 2018; Piovano et al., 2019), the estimated composition of the NSW foraging aggregations was unlikely influenced by genetic stock size based on similar estimates obtained using uniform priors versus weighted priors that incorporated stock size. For instance, there was minimal contribution from northern GBR stock and estimates using the stock size-weighted model were only slightly higher (< 2.5%) compared to uniform priors, even though this genetic stock is over four times larger than the southern GBR stock. Major ocean surface currents also appear to be influencing the location of recruitment to neritic foraging sites in this region (Figure 2). There is compelling evidence that ocean currents influence the early life stage migration and movements of green turtles and other marine turtle species globally (LaCasella et al., 2013; Proietti et al., 2014; Jensen et al., 2020). In the southwest Pacific, green turtle post-hatchlings can remain in the pelagic zone for five years before recruiting to foraging sites (Chaloupka, 2002) and are likely to spend this time in the EAC’s offshore warm water eddies (Boyle, 2006). This behavior may be represented by the post-hatchling turtles in this study with CCL < 38 cm. The prevailing EAC is likely facilitating the movement of post-hatchlings from southern Queensland to NSW, while the South Equatorial Current, which bifurcates into the North Caledonian Jet (NCJ) and South Caledonian Jet (SCJ), facilitates movement from New Caledonia to NSW together with the EAC (Figure 2). These currents may explain the lack of turtles in NSW that originated from the Coral Sea and northern GBR stocks, as well as the higher contribution of the New Caledonia stock in northern NSW compared to central NSW (Figure 3). The influence of these currents has been proposed to explain stock composition of foraging green turtles at southern foraging grounds in Queensland, which are very similar in composition to NSW foraging aggregations (Jensen et al., 2016b; Jones et al., 2018). This is further supported by long-term tagging studies that documented green turtle breeding migrations, in both directions, between New Caledonia breeding grounds and foraging grounds in southern and northern GBR (Read et al., 2014).
Greater variation in the natal origin of post-hatchlings was observed compared to adult-sized, subadult and juvenile turtles that had presumably recruited to NSW foraging areas, with higher estimated contribution of the Coral Sea and ‘other’ stocks for post-hatchlings. The estimated stock composition for post-hatchlings were comparable to a foraging population in the northern GBR (Jones et al., 2018). While the large 95% CIs indicate uncertainty around these estimates, Boyle (2006) similarly estimated a 28% contribution of the Coral Sea stock for stranded post-hatchlings in southern Queensland and northern NSW. Significant differences in stock composition for loggerhead turtles (Caretta caretta) in different ontogenetic phases has also been documented (Bowen et al., 2005). In that study, haplotype frequency data indicated that pelagic post-hatchlings in the North Atlantic had highly mixed origins, while subadults generally recruited to neritic foraging grounds that were geographically closer to their natal rookery (Bowen et al., 2005).
A small proportion of adult-sized, subadult and juvenile turtles stranded in NSW were also estimated to originate from more distant genetic stocks based on the haplotypes they possessed (Tables 2, 3), however, stock assignment was not possible due to the presence of these haplotypes across multiple stocks (Supplementary Table 1). Similarly, eight of the orphan haplotypes identified in this study have also been documented in more distant foraging sites including in the Torres Strait, Palmyra Atoll and Ecuador (Table 2). Interestingly, one juvenile female from central NSW was found with haplotype CmP4.6, a common haplotype documented for the ‘black’ green turtle morphotype breeding in the north-central/eastern Pacific Ocean around the Galapagos Islands, Michoacán and Costa Rica approximately 12,000 km from Australia (Dutton et al., 2014). While the color and morphology of the stranded turtle’s carapace was not recorded, juvenile turtles possessing this haplotype have been found in mixed foraging aggregations sympatrically with the ‘yellow’ morphotype of the south-central/western Pacific genetic lineage (e.g. New Zealand; Godoy et al., 2016; Álvarez-Varas et al., 2021). Central/eastern Pacific juvenile turtles have also infrequently been recorded foraging on the GBR in Australia (Limpus et al., 2005) and the genetic stock origin has been confirmed by genetic analysis (FitzSimmons, unpublished data). The presence of central/eastern Pacific turtles in the western Pacific Ocean foraging grounds is likely to occur due to transoceanic dispersal events by post-hatchlings along the warm waters of the westward-flowing North and South Equatorial Currents (Limpus et al., 2005; Nishizawa et al., 2014; Álvarez-Varas et al., 2021). Oceanic currents driving long-distance migrations of post-hatchlings have similarly been suggested to explain unexpected contributions from distant genetic stocks to green turtle foraging grounds in Malaysia (Jensen et al., 2016a).
The broad confidence levels, uncertainty around the contributions of more distant stocks and the presence of orphan haplotypes in a small percentage of individuals on foraging grounds in NSW and Queensland (Jensen et al., 2016b; Jones et al., 2018) highlights the need for more complete genetic sampling of green turtle genetic stocks in the Indo-Pacific region. Whole mtDNA genome sequencing (Frandsen et al., 2020) would improve the delineation of some green turtle stocks and improve the precision around MSA estimates to enable individual assignments to specific rookeries in the future. While management implications would likely remain unchanged for NSW, greater statistical power for MSA would further our understanding of the complex, long-distance dispersal, and migration patterns for this species.
Latitudinal changes in stock composition have been observed along nine major foraging grounds in the northern and southern GBR region in eastern Queensland, with gradual shifts in haplotype frequencies and stock composition observed from north to south (Jensen et al., 2016b; Jones et al., 2018). A higher estimated contribution from New Caledonia to the northern NSW aggregation compared to central NSW indicated that latitudinal shifts may continue down to the southern-most limit of the species’ distribution. Similarly, a latitudinal decline in haplotype and nucleotide diversity was documented in Queensland, with higher genetic diversity generally found in northern Queensland foraging grounds compared to the southern GBR region (Jensen et al., 2016b; Jones et al., 2018). Higher levels of genetic diversity in northern NSW compared to central NSW also supports anecdotal evidence of the progressive expansion of green turtle foraging grounds to southern NSW over recent decades. A reduction in genetic diversity at increasing distances from the origin of expansion has similarly been observed for many species undergoing range expansions (Peter and Slatkin, 2013). While the pattern of decreasing genetic diversity at decreasing latitudes was not maintained when including NSW sites as there were higher genetic diversity levels observed in northern NSW compared to southern Queensland, the geographic scale of sampling differed between these studies. Higher levels of genetic diversity in NSW could be attributed to the larger geographic sampling scale that potentially included multiple foraging grounds within the northern and central NSW aggregations. An increased understanding of green turtle foraging movements in NSW environments would assist in future assessments of genetic diversity patterns along the east coast of Australia.
Understanding the sex ratio of mixed foraging aggregations in relation to the operational and primary (hatchling) sex ratios at green turtle rookeries can also improve our knowledge of population dynamics, including the impact of climate change. A moderate female-biased sex ratio of samples (1M:2F) was observed in this study, indicating that greater numbers of female green turtles may be stranding in NSW compared to males. While the sex-ratio of stranded animals and free-ranging turtles foraging in NSW is currently unknown, similar or even more strongly female-biased foraging aggregations have been documented across the species' distribution (Limpus et al., 2009; Allen et al., 2015; Godoy et al., 2016; Jensen et al., 2016a; de Almeida et al., 2021). Sex-specific differences in the natal origins of green turtles were also observed in NSW. The estimated contribution of the southern GBR stock was similar between sexes, but all of the estimated contribution from New Caledonia were female, with no males assigned to this stock. Since nesting sand temperatures are known to determine green turtle sex ratios, with more female offspring produced at higher temperatures and more males produced at lower temperatures (Standora and Spotila, 1985), the female-biased sex ratio observed from the New Caledonia stock may have arisen due to a long-term shift in the percentage of females hatching in this region. Although hatchling sex ratios for this stock are unknown, higher sand temperatures have been documented for loggerhead turtle breeding sites in New Caledonia compared to southern GBR sites (Read et al., 2013). Similarly, for a GBR foraging aggregation, an extreme female bias was found for juveniles and subadults (> 99%) originating from the northern GBR genetic stock and a less-pronounced female bias across all size classes for the cooler breeding grounds in the southern GBR (Jensen et al., 2018). In light of trends for increasing feminization of green turtle populations (Jensen et al., 2018) and evidence of temporal changes to stock composition at other foraging grounds due to changes in population dynamics of genetic stocks (Jensen et al., 2016b; Stahelin et al., 2022), future sampling of green turtles in NSW of all sex and size classes over a temporal period will further our understanding of the impact of climate change on green turtles in the Indo-Pacific.
4.1 Implications for management and conclusions
Our ability to monitor and manage green turtles in NSW is currently hindered by a lack of quantified knowledge of migration patterns, movement, and habitat use. Recommended actions under the Recovery Plan for Marine Turtles in Australia 2017-2027 (Commonwealth of Australia, 2017) to facilitate the recovery of marine turtle stocks includes understanding genetic connectivity between foraging and breeding grounds, identifying important foraging grounds, and understanding anthropogenic threats and population demographics at foraging sites. The finding that green turtles in NSW are composed primarily of individuals originating from the southern GBR and New Caledonia genetic stocks, with a small contribution from more distant stocks, suggest that anthropogenic threats in NSW have the potential to negatively affect multiple MUs across the Indo-Pacific. Marine turtles in NSW are impacted by several threats including entanglement and ingestion of marine debris, fisheries by-catch, shark nets, disease, pollution, and boat strikes (Commonwealth of Australia, 2017). However, the spatiotemporal patterns of these threats and the impact they have on residency patterns at foraging sites (e.g. Pillans et al., 2021) are currently unknown. Adaptive management to minimize these threats in NSW coastal environments will improve reproductive fitness and survival rates of individuals throughout the region. In turn, these conservation actions that will reduce declines in abundance and genetic diversity, will maximize the ability of the species to adapt to rapidly changing marine environments. In addition, the identification of two distinct aggregations of turtles based on stranding locations suggests that multiple green turtle foraging aggregations may exist in NSW. With ocean modelling predicting a continued poleward shift of the warming EAC (Li et al., 2022), the identification of biologically important areas (BIAs) for foraging, resting and nesting in NSW and the projection of BIAs under future climate scenarios, will inform regional conservation priorities for green turtles. A multidisciplinary approach using long-term satellite tracking, diet analysis and genetic techniques targeting green turtles of all size and sex classes across the species distribution in NSW would be required to achieve this.
In conclusion, the connectivity detected between NSW foraging grounds and multiple genetic stocks provides new insights into the migration patterns of green turtles in southeastern Australia and improves the framework to assess the impact of anthropogenic threats to green turtle stocks in the Indo-Pacific by redefining the boundaries of these MUs. Future research to understand abundance, demographics (e.g. sex and size class structure) and movements of this species in NSW will also assist with the prioritization of management actions for the conservation of green turtles globally.
Data availability statement
The data presented in the study are deposited in the GenBank repository (https://www.ncbi.nlm.nih.gov/genbank/), accession numbers: PP278330- PP278333.
Ethics statement
The animal study was approved by Taronga Conservation Society Australia Animal Ethics Committee. The study was conducted in accordance with the local legislation and institutional requirements.
Author contributions
JD: Conceptualization, Data curation, Formal analysis, Funding acquisition, Methodology, Project administration, Writing – original draft. JH: Data curation, Writing – review & editing. KR: Data curation, Writing – review & editing. KVH: Data curation, Writing – review & editing. DM: Data curation, Writing – review & editing. OP: Data curation, Writing – review & editing. NF: Writing – review & editing, Formal analysis, Methodology. LH: Data curation, Writing – review & editing. KM: Writing – review & editing, Data curation. SI: Methodology, Writing – review & editing. PM: Conceptualization, Data curation, Project administration, Writing – review & editing.
Funding
The author(s) declare financial support was received for the research, authorship, and/or publication of this article. This work was funded by Bioplatforms Australia and Taronga Conservation Society Australia.
Acknowledgments
We sincerely thank Ryan Pereira from Irukandji Shark & Ray Encounters, Holly West from NSW TurtleWatch, David Harasti from NSW DPI Fisheries, and the teams from Taronga Zoo, Dolphin Marine Conservation Park, Australian Seabird and Turtle Rescue and NSW National Parks and Wildlife Service for their assistance collecting samples. Thank you to Peter Johnson for assistance with data curation and the Australian Museum for the curation of samples. Special thanks to Michael Jensen for providing his time and expertise to assist with the mixed stock analysis. We also thank the two reviewers for their constructive comments on the article.
Conflict of interest
The authors declare that the research was conducted in the absence of any commercial or financial relationships that could be construed as a potential conflict of interest.
The handling editor PHD declared a past co-authorship with the author NF.
Publisher’s note
All claims expressed in this article are solely those of the authors and do not necessarily represent those of their affiliated organizations, or those of the publisher, the editors and the reviewers. Any product that may be evaluated in this article, or claim that may be made by its manufacturer, is not guaranteed or endorsed by the publisher.
Supplementary material
The Supplementary Material for this article can be found online at: https://www.frontiersin.org/articles/10.3389/fmars.2024.1346932/full#supplementary-material
References
Abreu A., Horrocks J., Formia A., Dutton P., LeRoux R., Vélez-Zuazo X., et al. (2006). “New mtDNA D-loop primers which work for a variety of marine turtle species may increase the resolution of mixed stock analysis,” in Book of Abstracts. Proceedings of the 26th Annual Symposium on Sea Turtle Biology and Conservation. Eds. Frick M., Panagopoulou A., Rees A. F., Williams K. (International Sea Turtle Society, Athens, Greece), 179.
Allen C. D., Robbins M. N., Eguchi T., Owens D. W., Meylan A. B., Meylan P. A., et al. (2015). First assessment of the sex ratio for an east Pacific green sea turtle foraging aggregation: validation and application of a testosterone ELISA. PloS One 10, e0138861. doi: 10.1371/journal.pone.0138861
Allen A. M., Singh N. J. (2016). Linking movement ecology with wildlife management and conservation. Front. Ecol. Evol. 3. doi: 10.3389/fevo.2015.00155
Álvarez-Varas R., Heidemeyer M., Riginos C., Benítez H. A., Reséndiz E., Lara-Uc M., et al. (2021). Integrating morphological and genetic data at different spatial scales in a cosmopolitan marine turtle species: challenges for management and conservation. Zool. J. Linn. Soc 191, 434–453. doi: 10.1093/zoolinnean/zlaa066
Arthur K. E., Boyle M. C., Limpus C. J. (2008). Ontogenetic changes in diet and habitat use in green sea turtle (Chelonia mydas) life history. Mar. Ecol. Prog. Ser. 362, 303–311.
Atlas of Living Australia. Available at: http://www.ala.org.au (Accessed 2 March 2022).
Bates A. E., Pecl G. T., Frusher S., Hobday A. J., Wernberg T., Smale D. A., et al. (2014). Defining and observing stages of climate-mediated range shifts in marine systems. Global Environ. Change 26, 27–38. doi: 10.1016/j.gloenvcha.2014.03.009
Blevins C., Busquets-Vass G., Pardo M. A., Gendron D., Jacobsen J. K., Gómez-Díaz F., et al. (2022). Sex-and age-specific migratory strategies of blue whales in the northeast Pacific Ocean. Front. Mar. Sci. 9. doi: 10.3389/fmars.2022.944918
Block B. A., Teo S. L., Walli A., Boustany A., Stokesbury M. J., Farwell C. J., et al. (2005). Electronic tagging and population structure of Atlantic bluefin tuna. Nature 434, 1121–1127. doi: 10.1038/nature03463
Bowen B. W., Bass A. L., Soares L., Toonen R. J. (2005). Conservation implications of complex population structure: lessons from the loggerhead turtle (Caretta caretta). Mol. Ecol. 14, 2389–2402. doi: 10.1111/j.1365-294X.2005.02598.x
Bowen B. W., Grant W. S., Hillis-Starr Z., Shaver D. J., Bjorndal K. A., Bolten A. B., et al. (2007). Mixed-stock analysis reveals the migrations of juvenile hawksbill turtles (Eretmochelys imbricata) in the Caribbean Sea. Mol. Ecol. 16, 49–60. doi: 10.1111/j.1365-294X.2006.03096.x
Boyle M. C. (2006). Post-hatchling sea turtle biology. PhD thesis (Queensland, Australia: James Cook University).
Broderick A. C., Coyne M. S., Fuller W. J., Glen F., Godley B. J. (2007). Fidelity and over-wintering of sea turtles. Proc. Biol. Sci. 274, 1533–1539. doi: 10.1098/rspb.2007.0211
Brüniche-Olsen A., Urban R. J., Vertyankin V. V., Godard-Codding C. A. J., Bickham J. W., DeWoody J. A. (2018). Genetic data reveal mixed-stock aggregations of gray whales in the North Pacific Ocean. Biol. Lett. 14, 20180399. doi: 10.1098/rsbl.2018.0399
Carroll G., Everett J. D., Harcourt R., Slip D., Jonsen I. (2016). High sea surface temperatures driven by a strengthening current reduce foraging success by penguins. Sci. Rep. 6, 22236. doi: 10.1038/srep22236
Chaloupka M. (2002). Stochastic simulation modelling of southern Great Barrier Reef green turtle population dynamics. Ecol. Model. 148, 79–109. doi: 10.1016/S0304-3800(01)00433-1
Chaloupka M., Limpus C. (2005). Estimates of sex- and age-class-specific survival probabilities for a southern Great Barrier Reef green sea turtle population. Mar. Biol. 146, 1251–1261. doi: 10.1007/s00227-004-1512-6
Chaves J., Peña M., Valdés-Uribe J. A., Muñoz-Pérez J., Vallejo F., Heidemeyer M., et al. (2017). Connectivity, population structure, and conservation of Ecuadorian green sea turtles. Endanger. Species. Res. 32, 251–264. doi: 10.3354/esr00809
Commonwealth of Australia (2017). Recovery plan for marine turtles in Australia 2017-2027 (Canberra, ACT, Australia: Commonweath of Australia).
Dahle G., Johansen T., Westgaard J.-I., Aglen A., Glover K. A. (2018). Genetic management of mixed-stock fisheries “real-time”: The case of the largest remaining cod fishery operating in the Atlantic in 2007–2017. Fish. Res. 205, 77–85. doi: 10.1016/j.fishres.2018.04.006
de Almeida J. P. F. A., dos Santos R. G., Mott T. (2021). Sex ratios and natal origins of green turtles from feeding grounds in the Southwest Atlantic Ocean. ICES. J. Mar. Sci. 78, 1840–1848. doi: 10.1093/icesjms/fsab093
de Gouvea Pedroso S. B., Phalen D. N., Terkildsen M., Blyde D., March D. T., Gordon A. N., et al. (2020). Coccidiosis in green turtles (Chelonia mydas) in Australia: Pathogenesis, spatial and temporal distribution, and climate-related determinants of disease outbreaks. J. Wildl. Dis. 56, 359–371. doi: 10.7589/2019-05-115
Donelson J. M., Sunday J. M., Figueira W. F., Gaitán-Espitia J. D., Hobday A. J., Johnson C. R., et al. (2019). Understanding interactions between plasticity, adaptation and range shifts in response to marine environmental change. Philos. Trans. R. Soc Lond. B Biol. Sci. 374, 20180186. doi: 10.1098/rstb.2018.0186
Druskat A., Ghosh R., Castrillon J., Bengtson Nash S. M. (2019). Sex ratios of migrating southern hemisphere humpback whales: A new sentinel parameter of ecosystem health. Mar. Environ. Res. 151, 104749. doi: 10.1016/j.marenvres.2019.104749
Duncan E. M., Broderick A. C., Critchell K., Galloway T. S., Hamann M., Limpus C. J., et al. (2021). Plastic pollution and small juvenile marine turtles: A potential evolutionary trap. Front. Mar. Sci. 8. doi: 10.3389/fmars.2021.699521
Dutton P. H., Jensen M. P., Frey A., LaCasella E., Balazs G. H., Zarate P., et al. (2014). Population structure and phylogeography reveal pathways of colonization by a migratory marine reptile (Chelonia mydas) in the central and eastern Pacific. Ecol. Evol. 4, 4317–4331. doi: 10.1002/ece3.1269
Dutton P. H., LeRoux R. A., LaCasella E. L., Seminoff J. A., Eguchi T., Dutton D. L. (2019). Genetic analysis and satellite tracking reveal origin of the green turtles in San Diego Bay. Mar. Biol. 166, 1–13. doi: 10.1007/s00227-018-3446-4
EPBC Act (1999). Commonwealth Environment Protection and Biodiversity Conservation Act 1999 (Canberra, ACT, Australia: Commonwealth of Australia).
Esteban N., Mortimer J. A., Stokes H. J., Laloë J.-O., Unsworth R. K. F., Hays G. C. (2020). A global review of green turtle diet: sea surface temperature as a potential driver of omnivory levels. Mar. Biol. 167, 183. doi: 10.1007/s00227-020-03786-8
Euclide P. T., MacDougall T., Robinson J. M., Faust M. D., Wilson C. C., Chen K.-Y., et al. (2021). Mixed-stock analysis using Rapture genotyping to evaluate stock-specific exploitation of a walleye population despite weak genetic structure. Evol. Appl. 14, 1403–1420. doi: 10.1111/eva.13209
Excoffier L., Lischer H. E. L. (2010). ARLEQUIN suite ver 3.5: A new series of programs to perform population genetic analyses under Linux and Windows. Mol. Ecol. Resourc. 10, 564–567. doi: 10.1111/j.1755-0998.2010.02847.x
Fields A. T., Fischer G. A., Shea S. K. H., Zhang H., Feldheim K. A., Chapman D. D. (2020). DNA Zip-coding: identifying the source populations supplying the international trade of a critically endangered coastal shark. Anim. Conserv. 23, 670–678. doi: 10.1111/acv.12585
Frandsen H. R., Figueroa D. F., George J. A. (2020). Mitochondrial genomes and genetic structure of the Kemp’s ridley sea turtle (Lepidochelys kempii). Ecol. Evol. 10, 249–262. doi: 10.1002/ece3.5891
Garofalo L., Mastrogiacomo A., Casale P., Carlini R., Eleni C., Freggi D., et al. (2013). Genetic characterization of central Mediterranean stocks of the loggerhead turtle (Caretta caretta) using mitochondrial and nuclear markers, and conservation implications. Aquat. Conserv.: Mar. Freshwat. Ecosyst. 23, 868–884. doi: 10.1002/aqc.2338
Glen J. (2021). Using stable isotope analysis to guide management of stranded green turtles (Chelonia mydas). Honors thesis (Gold Coast, Queensland, Australia: Griffith University).
Godoy D. A. (2017). The ecology and conservation of green turtles (Chelonia mydas) in New Zealand. PhD thesis (Albany, New Zealand: Massey University).
Godoy D., Smith A., Limpus C., Stockin K. (2016). The spatio-temporal distribution and population structure of green turtles (Chelonia mydas) in New Zealand. N. Z. J. Mar. Freshwat. Res. 50, 1–17. doi: 10.1080/00288330.2016.1182034
Hamabata T., Kamezaki N., Hikida T. (2014). Genetic structure of green turtle (Chelonia mydas) peripheral populations nesting in the northwestern Pacific rookeries: evidence for northern refugia and postglacial colonization. Mar. Biol. 161, 495–507. doi: 10.1007/s00227-013-2352-z
Hamabata T., Nishizawa H., Kawazu I., Kameda K., Kamezaki N., Hikida T. (2018). Stock composition of green turtles Chelonia mydas foraging in the Ryukyu Archipelago differs with size class. Mar. Ecol. Prog. Ser. 600, 151–163. doi: 10.3354/meps12657
Hamann M., Godfrey M., Seminoff J., Arthur K., Barata P., Bjorndal K., et al. (2010). Global research priorities for sea turtles: Informing management and conservation in the 21st century. Endanger. Species. Res. 11, 245–269. doi: 10.3354/esr00279
Hays G. C. (2008). Sea turtles: A review of some key recent discoveries and remaining questions. J. Exp. Mar. Biol. Ecol. 356, 1–7. doi: 10.1016/j.jembe.2007.12.016
Hays G. C., Scott R. (2013). Global patterns for upper ceilings on migration distance in sea turtles and comparisons with fish, birds and mammals. Funct. Ecol. 27, 748–756. doi: 10.1111/1365-2435.12073
Jensen M. P., Allen C. D., Eguchi T., Bell I. P., LaCasella E. L., Hilton W. A., et al. (2018). Environmental warming and feminization of one of the largest sea turtle populations in the world. Curr. Biol. 28, 154–159. e154. doi: 10.1016/j.cub.2017.11.057
Jensen M. P., Bell I., Limpus C. J., Hamann M., Ambar S., Whap T., et al. (2016b). Spatial and temporal genetic variation among size classes of green turtles (Chelonia mydas) provides information on oceanic dispersal and population dynamics. Mar. Ecol. Prog. Ser. 543, 241–256. doi: 10.3354/meps11521
Jensen M. P., Dalleau M., Gaspar P., Lalire M., Jean C., Ciccione S., et al. (2020). Seascape genetics and the spatial ecology of juvenile green turtles. Genes 11, 278. doi: 10.3390/genes11030278
Jensen M. P., FitzSimmons N. N., Bourjea J., Hamabata T., Reece J., Dutton P. H. (2019). The evolutionary history and global phylogeography of the green turtle (Chelonia mydas). J. Biogeogr. 46, 860–870. doi: 10.1111/jbi.13483
Jensen M., Pilcher N., FitzSimmons N. (2016a). Genetic markers provide insight on origins of immature green turtles Chelonia mydas with biased sex ratios at foraging grounds in Sabah, Malaysia. Endanger. Species. Res. 31, 191–201. doi: 10.3354/esr00763
Jones K., Jensen M., Burgess G., Leonhardt J., van Herwerden L., Hazel J., et al. (2018). Closing the gap: mixed stock analysis of three foraging populations of green turtles (Chelonia mydas) on the Great Barrier Reef. PeerJ 6, e5651–e5651. doi: 10.7717/peerj.5651
Komoroske L. M., Jensen M. P., Stewart K. R., Shamblin B. M., Dutton P. H. (2017). Advances in the application of genetics in marine turtle biology and conservation. Front. Mar. Sci. 4. doi: 10.3389/fmars.2017.00156
Kynoch C., Fuentes M. M. P. B., Dutton P. H., LaCasella E. L., Silver-Gorges I. (2022). Origins of juvenile green sea turtles (Chelonia mydas) in the Bahamas: A comparison of recent and historical rookery contributions. Ecol. Evol. 12, e9548. doi: 10.1002/ece3.9548
LaCasella E., Epperly S., Jensen M., Stokes L., Dutton P. (2013). Genetic stock composition of loggerhead turtles Caretta caretta bycaught in the pelagic waters of the North Atlantic. Endanger. Species. Res. 22, 73–84. doi: 10.3354/esr00535
Lahanas P. N., Bjorndal K. A., Bolten A. B., Encalada S. E., Miyamoto M. M., Valverde R. A., et al. (1998). Genetic composition of a green turtle (Chelonia mydas) feeding ground population: evidence for multiple origins. Mar. Biol. 130, 345–352. doi: 10.1007/s002270050254
Li J., Roughan M., Kerry C. (2022). Drivers of ocean warming in the western boundary currents of the Southern Hemisphere. Nat. Clim. Change 12, 901–909. doi: 10.1038/s41558-022-01473-8
Limpus C. ,. J. (2008). “A biological review of Australian marine turtles. 2. Green turtle Chelonia mydas (Linnaeus),” in Report of the Queensland Environmental Protection Agency.
Limpus C. J., Bell I., Miller J. D. (2009). Mixed stocks of green turtles foraging on Clark Reef, Northern Great Barrier Reef identified from long-term tagging studies. Mar. Turtle. Newsl. 123, 3–5.
Limpus C. J., FitzSimmons N. N. (2020). “Increasing the Understanding of the Green Turtle Population in Port Curtis 2016-2019,” in Report produced for the Ecosystem Research and Monitoring Program Advisory Panel as part of Gladstone Ports Corporation Ecosystem Research and Monitoring Program (Department of Environment and Science, Queensland Government, Brisbane).
Limpus C. J., Fleay A., Guinea M. (1984). “Sea turtles of the Capricornia Section, Great Barrier Reef,” in The Capricornia Section of the Great Barrier Reef Marine Park: Past, Present and Future. Eds. Ward W. T., Saenger P. (Royal Society of Queensland and Australian Coral Reef Society, Brisbane, Australia), 61–78.
Limpus C. J., Limpus D. J., Arthur K. E., Parmenter C. J. (2005). “Monitoring green turtle population dynamics in Shoalwater Bay: 2000-2004,” in Great Barrier Reef Marine Park Authority.
Limpus C. J., Miller J. D., Parmenter C. J., Limpus D. J. (2003). The green turtle, Chelonia mydas, population of Raine Island and the Northern Great Barrier Reef: 1843-2001. Mem. Queensl. Mus. 49, 349–440.
Limpus C. J., Reed P. C. (1985). Green sea turtles stranded by Cyclone Kathy on the south-western coast of the Gulf of Carpentaria. Aust. Wildl. Res. 12, 523–533. doi: 10.1071/WR9850523
Mate B. R., Ilyashenko V. Y., Bradford A. L., Vertyankin V. V., Tsidulko G. A., Rozhnov V. V., et al. (2015). Critically endangered western gray whales migrate to the eastern North Pacific. Biol. Lett. 11, 20150071. doi: 10.1098/rsbl.2015.0071
McCauley D. J., Pinsky M. L., Palumbi S. R., Estes J. A., Joyce F. H., Warner R. R. (2015). Marine defaunation: Animal loss in the global ocean. Science 347, 1255641. doi: 10.1126/science.1255641
Musick J. A., Limpus C. J. (1996). “Habitat utilization and migration in juvenile sea turtles,” in The biology of sea turtles. Eds. Lutz P. L., Musick J. A. (CRC PR INC, US), 137–164.
Naro-Maciel E., Gaughran S. J., Putman N. F., Amato G., Arengo F., Dutton P. H., et al. (2014). Predicting connectivity of green turtles at Palmyra Atoll, central Pacific: a focus on mtDNA and dispersal modelling. J. R. Soc. Interface 11, 20130888–20130888. doi: 10.1098/rsif.2013.0888
Nishizawa H., Narazaki T., Fukuoka T., Sato K., Hamabata T., Kinoshita M., et al. (2014). Juvenile green turtles on the northern edge of their range: mtDNA evidence of long-distance westward dispersals in the northern Pacific Ocean. Endanger. Species. Res. 24, 171–179. doi: 10.3354/esr00592
NSW Department of Planning and Environment Marine Wildlife Dashboard (NSW Australia: NSW Department of Planning and Environment). Available at: https://www.environment.nsw.gov.au/topics/animals-and-plants/native-animals/sick-or-injured-animals/marine-wildlife-incidents/marine-wildlife-reporting/marine-wildlife-dashboard (Accessed 29 November 2023).
Ogburn M. B., Harrison A.-L., Whoriskey F. G., Cooke S. J., Mills Flemming J. E., Torres L. G. (2017). Addressing challenges in the application of animal movement ecology to aquatic conservation and management. Front. Mar. Sci. 4. doi: 10.3389/fmars.2017.00070
Oke P. R., Roughan M., Cetina-Heredia P., Pilo G. S., Ridgway K. R., Rykova T., et al. (2019). Revisiting the circulation of the East Australian Current: Its path, separation, and eddy field. Prog. Oceanogr. 176, 102139. doi: 10.1016/j.pocean.2019.102139
Paiva V. H., Geraldes P., Rodrigues I., Melo T., Melo J., Ramos J. A. (2015). The foraging ecology of the endangered Cape Verde shearwater, a sentinel species for marine conservation off West Africa. PloS One 10, e0139390. doi: 10.1371/journal.pone.0139390
Peddemors V. M., Dalton S. (2022). NSW Shark Meshing (Bather Protection) Program 2021/22 Trigger Point Review Report (NSW, Australia: Department of Primary Industries).
Pella J., Masuda M. (2001). Bayesian methods for analysis of stock mixtures from genetic characters. Fish. Bull. 99, 151–167.
Peter B. M., Slatkin M. (2013). Detecting range expansions from genetic data. Evolution 67, 3274–3289. doi: 10.1111/evo.12202
Pillans R. D., Fry G. C., Haywood M. D. E., Rochester W., Limpus C. J., Patterson T., et al. (2021). Residency, home range and tidal habitat use of green turtles (Chelonia mydas) in Port Curtis, Australia. Mar. Biol. 168, 88. doi: 10.1007/s00227-021-03898-9
Pinet P., Jaquemet S., Pinaud D., Weimerskirch H., Phillips R. A., Le Corre M. (2011). Migration, wintering distribution and habitat use of an endangered tropical seabird, Barau’s petrel Pterodroma baraui. Mar. Ecol. Prog. Ser. 423, 291–302. doi: 10.3354/meps08971
Piovano S., Batibasaga A., Ciriyawa A., LaCasella E. L., Dutton P. H. (2019). Mixed stock analysis of juvenile green turtles aggregating at two foraging grounds in Fiji reveals major contribution from the American Samoa Management Unit. Sci. Rep. 9, 3150. doi: 10.1038/s41598-019-39475-w
Proietti M., Reisser J., Kinas P., Kerr R., Monteiro D., Marins L., et al. (2013). Green turtle Chelonia mydas mixed stocks in the western South Atlantic, as revealed by mtDNA haplotypes and drifter trajectories. Mar. Ecol. Prog. Ser. 447, 195–209. doi: 10.3354/meps09477
Proietti M. C., Reisser J., Marins L. F., Rodriguez-Zarate C., Marcovaldi M. A., Monteiro D. S., et al. (2014). Genetic structure and natal origins of immature hawksbill turtles (Eretmochelys imbricata) in Brazilian waters. PloS One 9, e88746. doi: 10.1371/journal.pone.0088746
Putman N. F., Mansfield K. L. (2015). Direct evidence of swimming demonstrates active dispersal in the sea turtle “lost years”. Curr. Biol. 25, 1221–1227. doi: 10.1016/j.cub.2015.03.014
Read T., Booth D. T., Limpus C. J. (2013). Effect of nest temperature on hatchling phenotype of loggerhead turtles (Caretta caretta) from two South Pacific rookeries, Mon Repos and La Roche Percée. Aust. J. Zool. 60, 402–411. doi: 10.1071/ZO12079
Read T. C., FitzSimmons N. N., Wantiez L., Jensen M. P., Keller F., Chateau O., et al. (2015). Mixed stock analysis of a resident green turtle, Chelonia mydas, population in New Caledonia links rookeries in the South Pacific. Wildl. Res. 42, 488–499. doi: 10.1071/WR15064
Read T. C., Wantiez L., Werry J. M., Farman R., Petro G., Limpus C. J. (2014). Migrations of green turtles (Chelonia mydas) between nesting and foraging grounds across the Coral Sea. PloS One 9, e100083. doi: 10.1371/journal.pone.0100083
Reich K. J., Bjorndal K. A., Bolten A. B. (2007). The ‘lost years’ of green turtles: using stable isotopes to study cryptic life stages. Biol. Lett. 3, 712–714. doi: 10.1098/rsbl.2007.0394
Robinson R., Crick H., Learmonth J., Maclean I., Thomas C., Bairlein F., et al. (2009). Travelling through a warming world: climate change and migratory species. Endanger. Species. Res. 7, 87–99. doi: 10.3354/esr00095
Schmitt N., Double M., Baker S., Gales N., Childerhouse S., Polanowski A., et al. (2014). Mixed-stock analysis of humpback whales (Megaptera novaeangliae) on Antarctic feeding grounds. J. Cetacean. Res. Manage. 14, 141–157. doi: 10.47536/jcrm.v14i1.531
Seminoff J. A. (2004)Chelonia mydas. In: The IUCN Red List of Threatened Species 2004 (Accessed 28 November 2023).
Siegwalt F., Benhamou S., Girondot M., Jeantet L., Martin J., Bonola M., et al. (2020). High fidelity of sea turtles to their foraging grounds revealed by satellite tracking and capture-mark-recapture: New insights for the establishment of key marine conservation areas. Biol. Conserv. 250, 108742. doi: 10.1016/j.biocon.2020.108742
Stahelin G. D., Hoffman E. A., Quintana-Ascencio P. F., Reusche M., Mansfield K. L. (2022). Incorporating distance metrics and temporal trends to refine mixed stock analysis. Sci. Rep. 12, 20569. doi: 10.1038/s41598-022-24279-2
Standora E. A., Spotila J. R. (1985). Temperature dependent sex determination in sea turtles. Copeia 1985, 711–722. doi: 10.2307/1444765
Sunnucks P., Hales D. F. (1996). Numerous transposed sequences of mitochondrial cytochrome oxidase I-II in aphids of the genus Sitobion (Hemiptera: Aphididae). Mol. Biol. Evol. 13, 510–523. doi: 10.1093/oxfordjournals.molbev.a025612
Tamura K., Nei M. (1993). Estimation of the number of nucleotide substitutions in the control region of mitochondrial DNA in humans and chimpanzees. Mol. Ecol. Evol. 10, 512–526. doi: 10.1093/oxfordjournals.molbev.a040023
Tamura K., Stecher G., Kumar S. (2021). MEGA11: Molecular Evolutionary genetics analysis version 11. Mol. Biol. Evol. 38, 3022–3027. doi: 10.1093/molbev/msab120
Tanabe L. K., Cochran J. E. M., Berumen M. L. (2023). Inter-nesting, migration, and foraging behaviors of green turtles (Chelonia mydas) in the central-southern Red Sea. Sci. Rep. 13, 11222. doi: 10.1038/s41598-023-37942-z
Teas W. G. (1993). “Species composition and size class distribution of marine turtle strandings on the Gulf of Mexico and Southeast United States coasts 1985-1991,” in U.S. Department of Commerce NOAA Technical Memorandum NMFS-SEFSC-315, 1–43.
Thompson P., Baird M., Ingleton T., Doblin M. (2009). Long-term changes in temperate Australian coastal waters: implications for phytoplankton. Mar. Ecol. Prog. Ser. 394, 1–19. doi: 10.3354/meps08297
Vargas S. M., Araújo F. C. F., Monteiro D. S., Estima S. C., Almeida A. P., Soares L. S., et al. (2008). Genetic Diversity and origin of leatherback turtles (Dermochelys coriacea) from the Brazilian coast. J. Hered. 99, 215–220. doi: 10.1093/jhered/esm120
Vergés A., Doropoulos C., Malcolm H. A., Skye M., Garcia-Pizá M., Marzinelli E. M., et al. (2016). Long-term empirical evidence of ocean warming leading to tropicalization of fish communities, increased herbivory, and loss of kelp. Proc. Natl. Acad. Sci. U.S.A. 113, 13791–13796. doi: 10.1073/pnas.1610725113
Wallace B. P., DiMatteo A. D., Bolten A. B., Chaloupka M. Y., Hutchinson B. J., Abreu-Grobois F. A., et al. (2011). Global conservation priorities for marine turtles. PloS One 6, e24510. doi: 10.1371/journal.pone.0024510
Wernberg T., Russell B. D., Moore P. J., Ling S. D., Smale D. A., Campbell A., et al. (2011). Impacts of climate change in a global hotspot for temperate marine biodiversity and ocean warming. J. Exp. Mar. Biol. Ecol. 400, 7–16. doi: 10.1016/j.jembe.2011.02.021
Werry J. M., Planes S., Berumen M. L., Lee K. A., Braun C. D., Clua E. (2014). Reef-fidelity and migration of tiger sharks, Galeocerdo cuvier, across the Coral Sea. PloS One 9, e83249. doi: 10.1371/journal.pone.0083249
Keywords: Chelonia mydas, connectivity, migration, mtDNA, conservation management, East Australian Current, marine strandings, post-hatchlings
Citation: Day J, Hall J, Rose K, Vinette Herrin K, March D, Pitt O, FitzSimmons NN, Hall L, Marshall K, Iredell S and Meagher P (2024) Mixed stock analysis identifies natal origins of green turtles at foraging grounds in southeastern Australia. Front. Mar. Sci. 11:1346932. doi: 10.3389/fmars.2024.1346932
Received: 30 November 2023; Accepted: 20 March 2024;
Published: 16 May 2024.
Edited by:
Peter H. Dutton, National Oceanic and Atmospheric Administration, United StatesReviewed by:
Hideaki Nishizawa, Kyoto University, JapanBrian Michael Shamblin, University of Georgia, United States
Copyright © 2024 Day, Hall, Rose, Vinette Herrin, March, Pitt, FitzSimmons, Hall, Marshall, Iredell and Meagher. This is an open-access article distributed under the terms of the Creative Commons Attribution License (CC BY). The use, distribution or reproduction in other forums is permitted, provided the original author(s) and the copyright owner(s) are credited and that the original publication in this journal is cited, in accordance with accepted academic practice. No use, distribution or reproduction is permitted which does not comply with these terms.
*Correspondence: Joanna Day, jday@zoo.nsw.gov.au