Drivers of CO2-carbonate system variability in the coastal ocean south of Honolulu, Hawai’i
 Lucie A. C. M. Knor
 Melissa Meléndez
 Christopher L. Sabine
 Adrienne J. Sutton
- 1Department of Oceanography, University of Hawai’i at Mānoa, Honolulu, HI, United States
- 2NOAA Pacific Marine Environmental Laboratory, Seattle, WA, United States
This study examines carbonate chemistry variability from 2008 to 2021 in subtropical coastal waters adjacent to Honolulu, Hawai’i. We use surface seawater carbon dioxide partial pressure (pCO2sw) measurements obtained every three hours from two buoys located along the south shore of O’ahu near anthropogenically impacted fringing reefs. The Ala Wai buoy was located 200 m offshore of a canal draining most of Honolulu, while the Kilo Nalu buoy was 1.3 miles (2 km) to the northwest, at a similar distance from shore with fewer terrestrial inputs. We compare pCO2sw variability from diurnal to interannual time scales. A trend analysis reveals a statistically significant increase in pCO2sw of +1.84 ± 0.27 µatm per year over the 11-year period. This rate is slightly lower than the average atmospheric growth rate observed during the same timeframe. In contrast to a nearby open-ocean site, the coastal sites experience amplified shorter-term variability, while seasonal to inter-annual variability is comparable to the open ocean. Ala Wai exhibits greater ranges than Kilo Nalu in all carbonate system variables due to its proximity to the Ala Wai Canal outflow. We examine the drivers that may explain both the similarities and contrasts in carbon dynamics observed between the two locations. Drivers of aragonite saturation state (ΩAr), an important variable for quantifying ocean acidification, are isolated from the in-situ time-series. Interannual salinity variations both due to freshwater pulses and large-scale regional salinity changes have a larger impact on ΩAr than temperature changes, which mostly have an effect seasonally. A large biological contribution to ΩAr is suspected, and further investigated using TA/DIC ratios normalized to median salinity and their slopes. Observed ratios at the south shore sites are evaluated relative to expected ratios derived from an open-ocean reference. Results suggest that dissolution and respiration are the primary biogeochemical processes occurring at these coastal sites. This highlights the significance of carbonate dissolution in anthropogenically impacted coastal waters, which is likely buffering acidification due to anthropogenic CO2 and freshwater inputs at these sites.
1 Introduction
Hawai’i’s coral reefs hold the highest estimated collective economic value of any coral reefs in the United States, covering the most extensive area (Brander and van Beukering, 2013). With some located in close proximity to the urban center of Honolulu, these reefs play a significant role in Hawaiian culture, support the region’s diverse ecology, contribute to the local economy, and offer essential coastal protection to the area’s infrastructure (Cesar and Beukering, 2004). However, like many coastal areas worldwide, these ecosystems are facing increasing challenges due to human activities, including rising levels of atmospheric carbon dioxide (CO2) and its impact on ocean chemistry (Grigg, 1995; Kleypas et al., 2021). Accurately monitoring water chemistry at disturbed locations, such as near Honolulu Harbor, is a complex task due to the need to differentiate between natural fluctuations and human-induced disturbances. Nonetheless, this effort is of utmost importance for a comprehensive understanding of the fate of coral reefs in Hawai’i.
Ocean acidification is recognized as a global concern impacting both open ocean (Sabine et al., 2004) and coastal regions (Salisbury et al., 2008; Gruber et al., 2012). Increases in hydrogen concentration (pH) and CO2 levels in the surface ocean have been observed in the North Pacific (Dore et al., 2009). Observations at Station ALOHA (A Long-term Oligotrophic Habitat Assessment), a long-term observation site in the North Pacific Subtropical Gyre near Hawai’i, indicate a decrease in sea surface pH and an increase in the surface seawater partial pressure of carbon dioxide (pCO2sw) of −0.0019 ± 0.0002 yr−1 and + 1.88 ± 0.16 μatm yr−1, respectively, from 1988 - 2007 (Dore et al., 2009). The seasonal and diurnal variations in seawater carbonate chemistry and calcium carbonate saturation states (Ω) within the coastal zone can be several times higher or lower than expected for oceanic waters due to local processes such as eutrophication, upwelling, groundwater and river runoff, and biological productivity (calcification and dissolution, and photosynthesis and respiration). This environmental complexity in coastal systems is not well constrained in global climate models, which restricts our ability to project future climate changes, including ocean acidification, under different greenhouse gas emission scenarios for these important ecosystems (Duarte et al., 2013; Fennel et al., 2019).
Coastal time-series are crucial to assess variability of the coastal ocean and coral reef carbonate chemistry across different time scales. Two buoys were deployed off of Honolulu, O’ahu, Hawai’i, one from 2008 to 2019 and another from 2008-2021, to assess anthropogenic impacts on water chemistry in a distressed coral reef. Such data are critical for understanding and mitigating the effects of human activities on marine ecosystems. The buoys experienced runoff from the Ala Wai Canal, whose drainage area spans the 19 square-mile Ala Wai Watershed from the Ko’olau Mountains to Māmala Bay. The watershed includes several significant streams, including Makiki, Mānoa, and Pālolo streams, which ultimately converge in the Ala Wai Canal. This canal, a product of early 1920s engineering, was designed to drain coastal wetlands, thereby facilitating the development of the famous Waikīkī District (Glenn and McMurtry, 1995). The time series data collected from these buoys have provided valuable insights into various ecosystem indices, ranging from water quality to ocean acidification and overall ecosystem health (Drupp et al., 2013; Terlouw et al., 2019). Furthermore, this dataset serves as a baseline, enabling comparisons with more pristine areas and providing a crucial understanding of long-term environmental changes and trends.
The primary purpose of this research is to comprehensively investigate the carbonate chemistry variability in the coastal ocean south of Honolulu, Hawai’i, with a particular focus on understanding the drivers of this variability. By examining this region’s unique characteristics, including its proximity to urban Honolulu and the presence of fringing reefs, we aim to provide valuable insights into the complex interactions between natural and anthropogenic factors that influence the CO2-carbonate system in coastal environments.
This study seeks to enhance our understanding of the intricate processes shaping the CO2-carbonate system in the coastal ocean. Our key research questions and objectives are as follows:
1. What are the trends in seawater pCO2 (partial pressure of CO2) in the study area over the past decade, and how do they compare to the global atmospheric CO2 trend?
2. What is the nature and magnitude of carbonate chemistry variability at different time scales, from diurnal to interannual, in the coastal waters south of Honolulu?
3. What are the main drivers of CO2-carbonate system variability in this region, and how do they contribute to changes in aragonite saturation state (ΩAr), a critical indicator of ocean acidification?
4. How do local drivers such as temperature, salinity, and freshwater inputs interact with global drivers like atmospheric CO2 concentrations to influence the CO2-carbonate system in these coastal waters?
2 Methods
2.1 Study sites
Ala Wai (AW) and Kilo Nalu (KN) buoys were both located on sand patches within fringing reef structures 200-300 m offshore south of urban Honolulu from 2008 to 2019 (KN) and 2021 (AW). The water depth at both sites is around 12 m. The coastline is relatively unprotected, and the buoys were subject to open ocean swells during the Northern Hemisphere summer. Residence times at both locations are thought to be short due to wind driven circulation, surface waves, and highly energetic tidal forcing, with tidal current speeds alongshore of 20 cm s-1 (Pawlak et al., 2009; Tomlinson et al., 2011). According to a benthic habitat survey from the early 2000s, the area surrounding AW has 10-50% live coral, while the immediate vicinity of KN is characterized as “uncolonized” or 90-100% turf algae, with live coral nearby (Battista et al., 2007). The AW site receives substantial amounts of freshwater discharge and associated sediment loads (turbidity spikes of >20 NTU reported by Tomlinson et al., 2011) from the Ala Wai Canal, which drains the majority of the urban Honolulu area (De Carlo et al., 2004; Tomlinson et al., 2011; Terlouw et al., 2019). In contrast, the KN site is not directly affected by freshwater discharge from the canal on a regular basis, except for during large storm events (Tomlinson et al., 2011; Terlouw et al., 2019). Discharge at a nearby USGS gauge in the Manoa-Palolo Drainage Canal, which accounts for 58% of waterflow into the Ala Wai Canal (Fryer, 1995), can reach well over 2000 cubic feet during and after storms, compared to a mean discharge of only 21 cubic feet. A study of the effect of storm events on the AW/KN pair can be found in Tomlinson et al. (2011). Urban inputs are still present at Kilo Nalu through submarine groundwater discharge, storm drains, and overland runoff (Terlouw et al., 2019).
The Woods Hole Oceanographic Institute Hawaii Ocean Time-Series Site (WHOTS) mooring serves as an open ocean reference for this study (Sutton et al., 2014). It is located at Station ALOHA (22°45’N, 158°W), 100km north of O’ahu, which was chosen to be representative of the oligotrophic North Pacific Subtropical Gyre (NPSG) [www.soest.hawaii.edu/whots/ , www.pmel.noaa.gov/co2/story/WHOTS].
2.2 Observations
2.2.1 Autonomous
Each buoy was equipped with a Moored Autonomous pCO2 (MAPCO2) system. The MAPCO2 instrument calibration and data Quality Assurance and Quality Control (QA/QC) processes are described in detail in (Sutton et al., 2014). The MAPCO2 houses a LI-COR LI-820 CO2 gas analyzer. Every three hours, the LI-820 measures the mole fraction of CO2 (xCO2) in the air, as well as in air equilibrated with surface seawater after a two-point in situ calibration with a zero and high standard reference gas. Buoys are also equipped with a conductivity-temperature-depth (CTD) sensor, providing sea surface temperature (SST) and salinity (SSS) measurements at 1 m depth, as well as turbidity, fluorescence and oxygen sensors. This enables the quantification of the partial pressure of CO2 in seawater and air (pCO2sw and pCO2air). Observations cover June 2008 to May 2019 (KN) and June 2008 to February 2021 (AW) (Sutton et al., 2016a, 2016b).
2.2.2 Discrete
The autonomous observations at both sites were supplemented periodically through direct measurements of total alkalinity (TA) and dissolved inorganic carbon (DIC), which are sufficient to fully constrain the CO2-carbonate system and thus validate carbonate system estimates derived from measured pCO2 and site-specific empirical relationships. Seawater samples at both sites were collected at the surface using borosilicate bottles and stored at room temperature following Dickson et al. (2007) protocols. Each sample was poisoned with a saturated solution of mercuric chloride (HgCl2) to prevent biological alteration and sealed tightly to prevent atmospheric gas exchange. The open-cell potentiometric TA analyses were measured with a precision of ± 3-5 µmol kg-1 by Gran titration using certified 0.1 N hydrochloric acid (HCl) titrant. The DIC samples were analyzed by measuring the infrared absorption of the CO2 released after the acidification of the sample with 10% phosphoric acid using an automated Apollo DIC analyzer. The precision for this method was ± 2-3 µmol kg-1. Certified Reference Materials (CRMs) were run after every three samples throughout the analyses. Chlorophyll, phosphate and silicate concentrations were collected periodically at the buoy sites and measured according to Strickland and Parsons (1972) during the period from 2008 to 2021. For detailed methodologies and data collection of the discrete samples see De Carlo et al. (2018) and Knor et al. (2018) datasets.
2.3 Trend analysis
Trends of Ocean Acidification Time Series (TOATS) software package, described comprehensively in Sutton et al. (2022) was utilized to analyze trends in pCO2sw, SST, and salinity. Monthly means are calculated from the autonomous high frequency data, and then de-trended using a simple linear regression. From this detrended time-series of monthly averages, climatological monthly and annual means are calculated. These represent long-term averages for each month and year. Monthly adjustments are then calculated by subtracting the annual mean from climatological monthly means. This step helps identify deviations from the long-term average for each specific month. The monthly adjustments are subtracted from the original time series of monthly means (with the trend included), and the linear trend of these de-seasoned monthly means is assessed using the Weighted Least Squares linear regression model from the statsmodels Python module (Seabold and Perktold, 2010) with Newey-West standard errors. In addition to ordinary least squares regression results (adjusted R2 value, p-value, slope error, and confidence intervals), the trend detection time is computed according to the Weatherhead et al. (1998) trend detection method.
There are substantial data gaps in the pCO2sw time-series at both moorings (AW: 2014-2016; KN: 2011-2014), which can make meaningful trend detection difficult (Figure 1). Gaps in the time series occurred intermittently due to instrument failure and annual buoy servicing. Thankfully, there is minimal overlap in data gaps between the two moorings. The average pCO2sw difference between KN and AW is small (7 µatm), and monthly mean pCO2 values are even closer (6 µatm on average). Consequently, for the TOATS trend analysis, data from both moorings were combined to create an overall “O’ahu South Shore” pCO2sw time series. Where data from both moorings was available, KN was prioritized due to its lower variability. The initial and final months for the combined time-series are taken from the same buoy (AW). Both datasets and the resulting combined dataset are shown in the Supplemental Information (Supplementary Figure 1). The pCO2sw trends were also evaluated at each mooring separately, to investigate the effect of the data gaps, and at a nearby open-ocean reference buoy, the WHOTS mooring at Station ALOHA (Sutton et al., 2014).
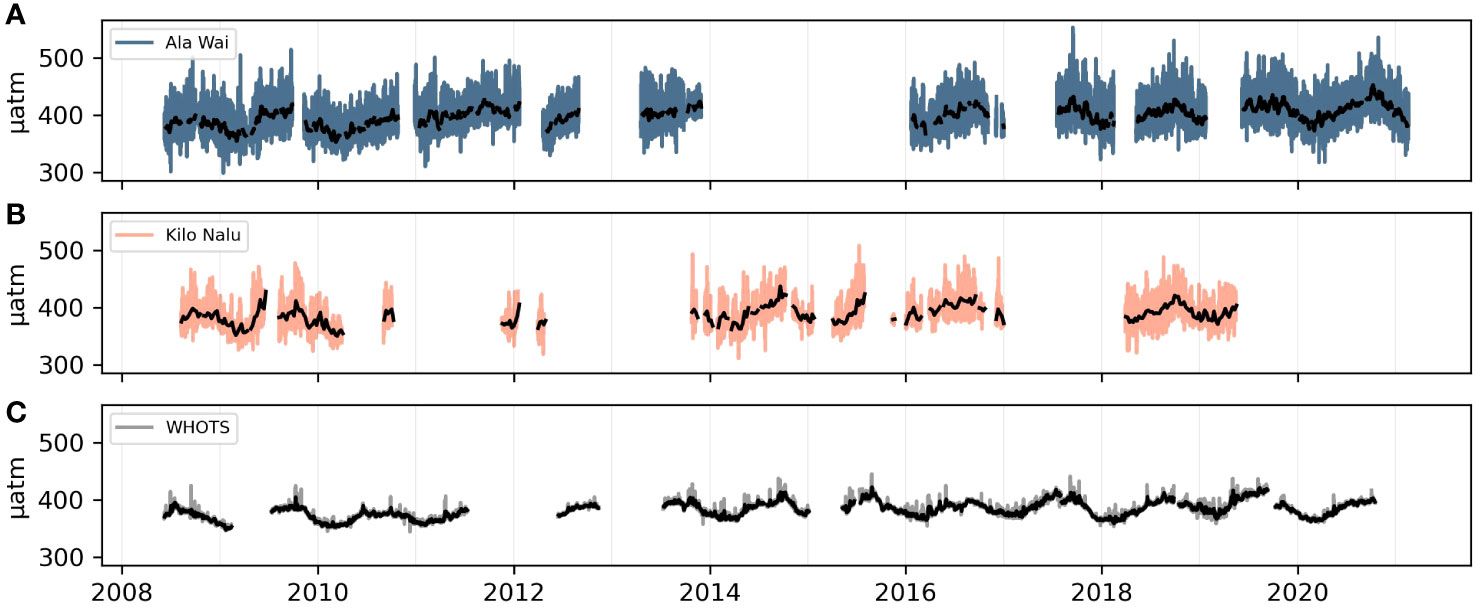
Figure 1 Observed pCO2sw time-series at coastal O‘ahu sites, AW (A) and KN (B), and the open-ocean reference station, WHOTS (C). A rolling mean with a 1-week window is shown in black for each site.
2.4 Variability on different time scales
Variability of pCO2sw at different time scales was evaluated, by iteratively calculating variability after averaging over higher-frequency time scales. Hence, “sub-diurnal” variability is quantified as the mean standard deviation of daily mean pCO2sw (largely the diurnal cycle). “Sub-monthly” variability is the mean standard deviation of daily mean pCO2sw averaged monthly (largely tidal fluctuations). “Sub-annual” variability is the mean standard deviation of monthly mean pCO2sw averaged annually (largely the seasonal cycle). Finally, “sub-decadal” variability is the standard deviation of annual means of pCO2sw of the whole time-series.
2.5 High frequency computation of CO2-carbonate system parameters using a TA-salinity empirical relationship
Two of four CO2-carbonate system variables (TA, DIC, pCO2 and pH) are needed to fully constrain this chemical equilibrium and all of its species, including quantities like the saturation state of aragonite (ΩAr), that are crucial indicators of ocean acidification and its potential biological impacts (Feely et al., 2009). Aragonite is a calcium carbonate mineral that makes up the skeletons of many marine calcifiers, including corals, and it is more soluble than calcite (Millero, 2007). Since discrete observations of TA and DIC were sporadic, and the high-frequency MAPCO2 observations are only of one parameter (pCO2sw), an alternative method was employed to investigate ΩAr on the south shore of Honolulu. The in-situ bottle measurements from both sites were used to determine if salinity could be used as a proxy for TA using the same relationship at both sites. For that, we consider the two stations to be end-members of a mixing process where fresh water from the Ala Wai canal mixes with seawater. We also assume that the average TA difference of 5.7 µmol kg-1 between AW and KN is smaller than the temporal variability. TA measurements demonstrated a moderate yet robust correlation with salinity (r2 = 0.62; RMES = ± 11.5 umol kg-1), supported by a significant p-value (p< 0.0001) and a substantial sample size (n = 184). A total of 212 discrete measurements were analyzed, but 28 samples fell outside of the 95% prediction bounds and are hence not considered in the linear regression model. The resulting linear relationship for TA is:
Where the uncertainties are the standard error of the slope and coefficient. The reef CO2 system was then fully constrained utilizing the MATLAB program CO2SYS (Van Heuven et al., 2011) with the calculated TA in conjunction with measured pCO2sw. Salinity, temperature, and pressure (1db – pressure at 1 meter) from the buoy were additional input parameters, as well as average silicate and phosphate concentrations at both sites from discrete measurements (silicate: 3.85 µmol kg-1, phosphate: 0.10 µmol kg-1). We applied the dissociation constants for K1 and K2 of Lueker et al. (2000) and the KHSO4- from Dickson et al. (1990).
Most of the errors are associated with the uncertainties of the TA linear model. These errors arise primarily from biological processes (e.g., calcification, calcium carbonate dissolution, denitrification and sulfate reduction) altering the TA/S ratio, and because of the low frequency of the discrete measurements. However, the modeled and in-situ TA show good agreement throughout the time series (Figure 2), and the differences over the annual mean were 3 and 8 μmol kg-1 for KN and AW, respectively. The average difference between pCO2sw buoy measurements and pCO2sw calculated from modeled TA and DIC was <10 µatm at AW and < 3 µatm at KN.
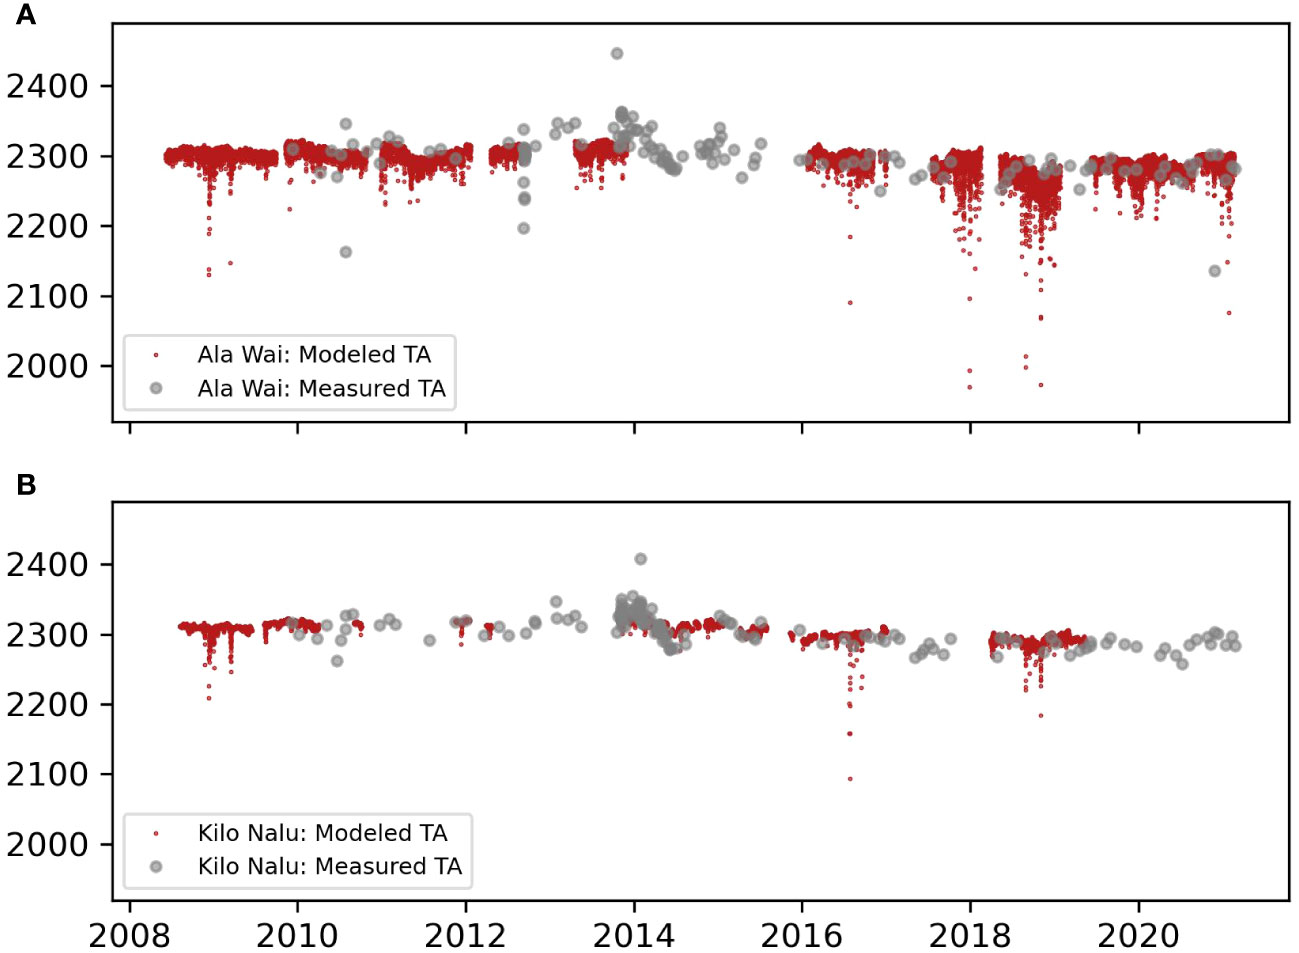
Figure 2 Modeled (red) and discrete (gray) time-series of TA at AW (A) and KN (B).
2.6 Drivers of ΩAr: salinity, temperature and anthropogenic CO2
To assess the contributions of salinity, temperature, and anthropogenic carbon uptake, we recalculate ΩAr in CO2SYS multiple times while holding certain parameters constant, to isolate each of these drivers. For the temperature influence, pCO2sw is normalized to median temperature (25.86°C) using the temperature-normalization from Takahashi et al. (1993), and temperature is held constant at 25.86°C, while salinity and TA vary as observed. The total temperature influence is then defined as the in-situ ΩAr minus ΩAr at median temperature. The temperature influence is further split into a direct influence on ΩAr, and the indirect influence via pCO2sw. In an analog manner, for the salinity influence, TA is normalized to median salinity (34.8), and salinity is held constant at 34.8, while temperature and pCO2sw vary as observed. The salinity influence is then defined as the in-situ ΩAr minus ΩAr at median salinity. The salinity influence is then also further split into a direct influence on ΩAr, and an indirect influence via TA. The combination of total temperature and salinity contributions constitutes physical carbon drivers. Finally, for the influence of anthropogenic CO2, an increase of 2.32 µatm yr-1 (Lan et al., 2023) is added to pCO2sw at t=0 for the whole time series, while TA, salinity and temperature are held constant at their t=0 values. The anthropogenic CO2 influence is then defined as the in-situ ΩAr minus ΩAr calculated from increasing pCO2sw with all other inputs constant. All biogeochemical carbon drivers are defined as the in-situ ΩAr minus total salinity, total temperature, and anthropogenic CO2 influence.
3 Results
3.1 Seawater pCO2 trends
Both AW and KN exhibit a significant increase in pCO2sw over the whole time-series (2008-2021 and 2008-2019, respectively) of 1.75 ± 0.25 µatm yr-1 (AW) and 1.89 ± 0.13 µatm yr-1 (KN). When both time-series are combined to address data gaps, the trend of 1.84 ± 0.27 µatm yr-1 is still significant (Figure 3; Table 1). The coastal sites trend is comparable to the observations at the nearby open-ocean WHOTS mooring at Station ALOHA, which experienced an annual 1.89 ± 0.21 µatm increase in pCO2sw from 2008-2021 (Table 2). All four trends are statistically indistinguishable.
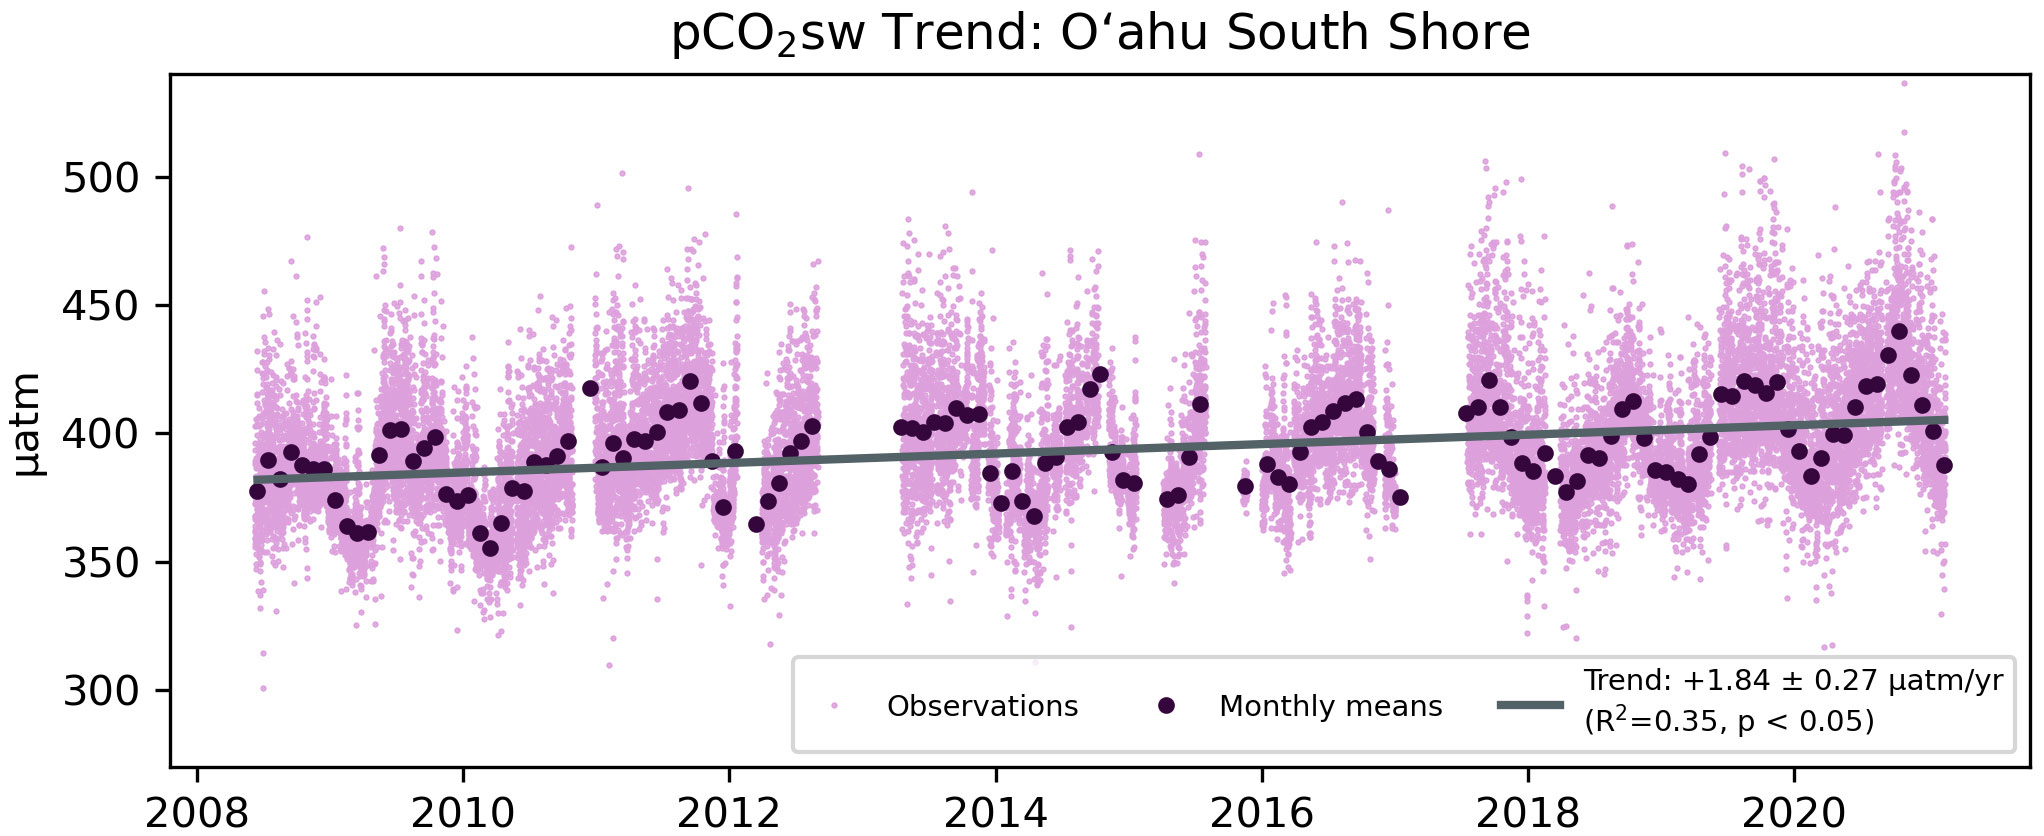
Figure 3 Combined pCO2sw observations (light purple) at AW and KN, with monthly means (dark purple) and trend (gray).
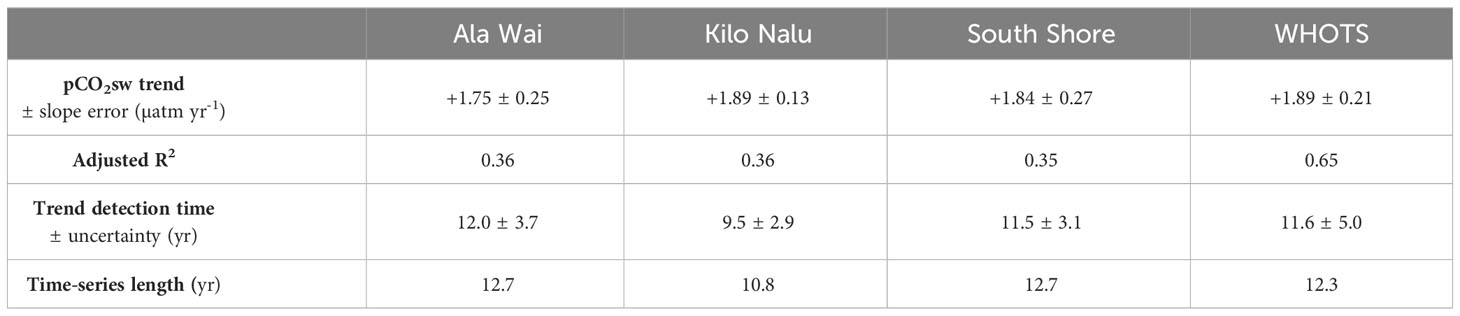
Table 1 Significant annual trends ± standard error observed at the Oahu and offshore time-series sites, quantified using TOATS (Sutton et al., 2022).
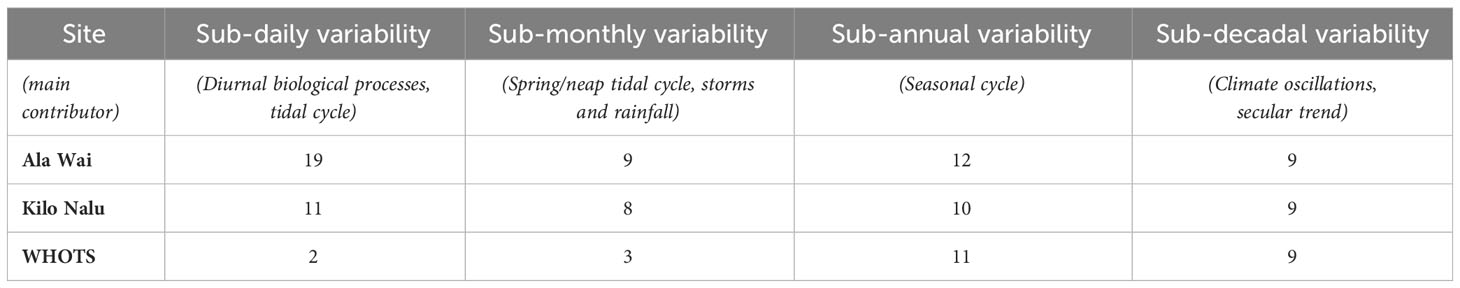
Table 2 Amplitude of pCO2sw variability in µatm at the Oahu and offshore buoys on different time scales, defined as the average standard deviation of daily, monthly, annual and total mean pCO2sw.
3.2 Seawater pCO2 variability
The south shore coastal sites show similar amplitudes to the open ocean reference (WHOTS) in their longer-term variability, with all three sites at ~10µatm in for both sub-annual (seasonal) and sub-decadal (interannual) variability (Table 2). In contrast, shorter-term variability is greatly enhanced at the coastal sites compared to the WHOTS site, with both AW and KN showing a three-fold larger sub-monthly variability (~9 µatm compared to 3 µatm, see also Figure 1). The diurnal cycle at WHOTS is minimal at 2 µatm, while Kilo Nalu’s mean sub-daily variability is five times higher (11 µatm) and Ala Wai’s almost ten times higher (19 µatm). In addition to pCO2sw variability, DIC and TA normalized to salinity of 35, nDIC (200 versus 140 µmol/kg) and nTA (275 versus 140 µmol/kg) also show larger ranges at AW compared to KN.
3.3 Discrete samples
Mean values for TA, DIC, chlorophyll-a and nutrients are reported in Table 3.

Table 3 Mean values for TA, DIC, chlorophyll-a and nutrients at AW and KN.
3.4 High-frequency ΩAr
Aragonite saturation state calculated both using the high-frequency model described in the methods (section 2.5), and from discrete samples is shown in Figure 4. The error for modeled ΩAr of 0.2 (~6%) is determined using the Orr et al. (2018) error propagation in CO2SYS, with model error for TA (11.5 µmol kg-1) and measurement uncertainties for pCO2sw, salinity and temperature (2 µatm, 0.016, 0.002°C) as inputs. The 6% error in ΩAr exceeds the 1% threshold for climate-level data quality specified for the quantification of long-term trends (Newton et al., 2015). Red arrows in Figure 4 indicate times where ΩAr drops below 2.82. This threshold was established as an annual tolerance limit for tropical coral reefs by Guan et al. (2015). Saturation state only fell below this threshold once at KN during the summer of 2016, but 13 times at AW. Twelve of the 13 instances occurred between December 2017 and December 2018.
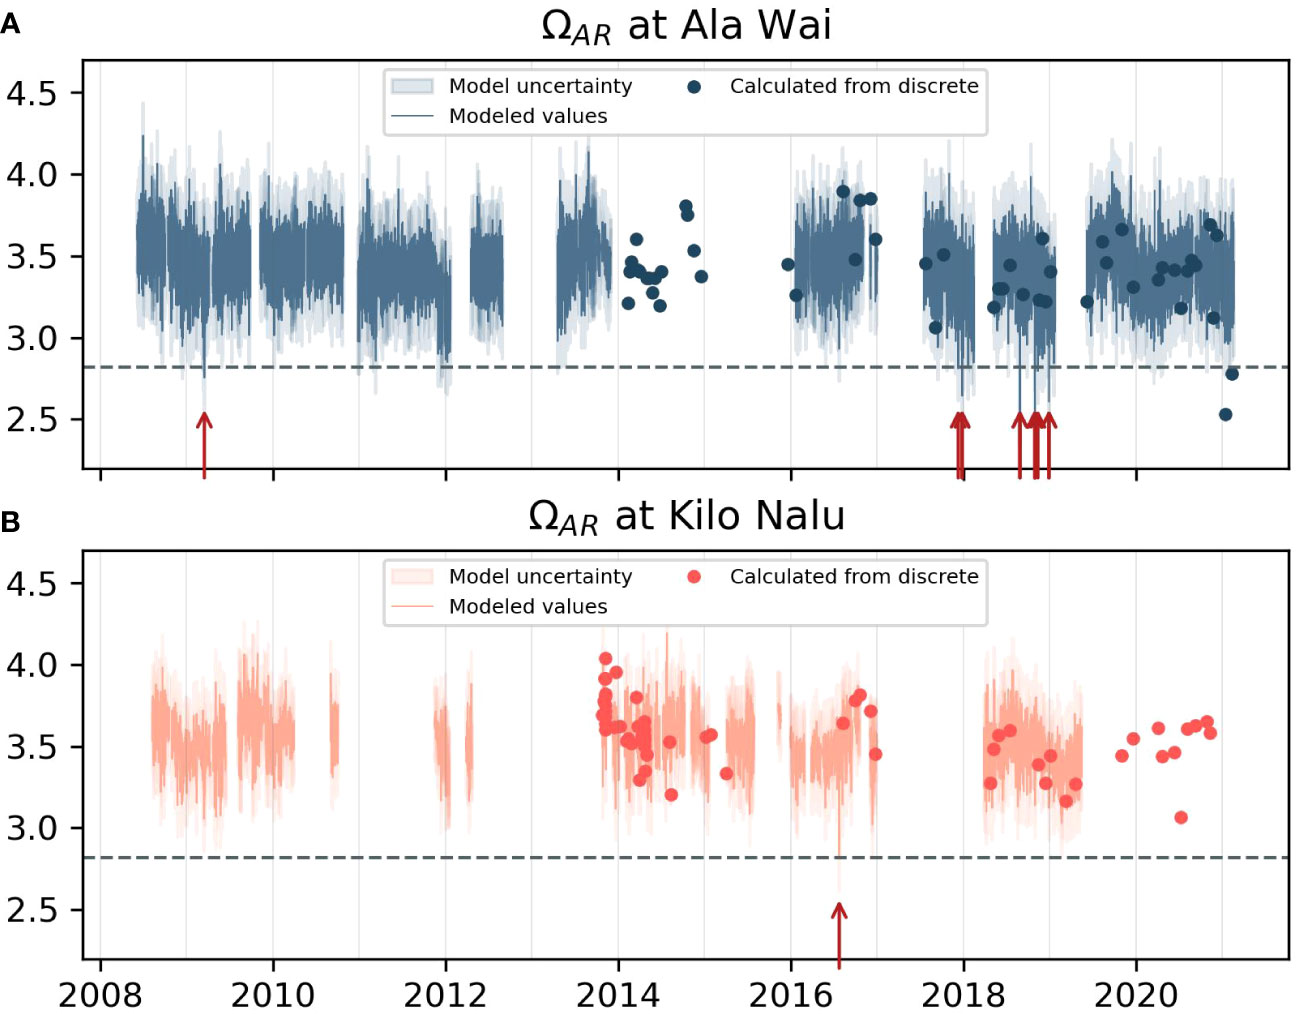
Figure 4 Aragonite saturation state calculated with the high-frequency model and from discrete TA/DIC data at AW (A) and KN (B), with shaded areas showing an uncertainty of 0.2. Red arrows indicate times where ΩAr drops below a threshold of 2.82 thought to be a biological limit for coral reef survival (Guan et al., 2015).
4 Discussion
4.1 Drivers of ΩAr: salinity, temperature and anthropogenic CO2
While pCO2sw variability at AW and KN from diurnal to interannual time scales has been characterized elsewhere (Drupp et al., 2013; Terlouw et al., 2019), our comprehensive south shore model that fully constrains the CO2-carbonate system provides a unique opportunity to conduct a more detailed examination of the factors driving this variability, including that of ΩAr, an important indicator variable for ocean acidification. The high-frequency ΩAr time-series does not exhibit a significant downward trend (Figure 4), as would be expected if the main or only driver of ΩAr was the (increasing) anthropogenic CO2 contribution. However, we do see a few instances of ΩAr dropping below a critical threshold later on in the time-series, particularly between December 2017 and December 2018 at AW (Figure 4).
Therefore, different processes influence ΩAr and modulate ocean acidification due to anthropogenic CO2 invasion at this location. Monthly means of the isolated contributions described in section 2.6 are shown in Figure 5.
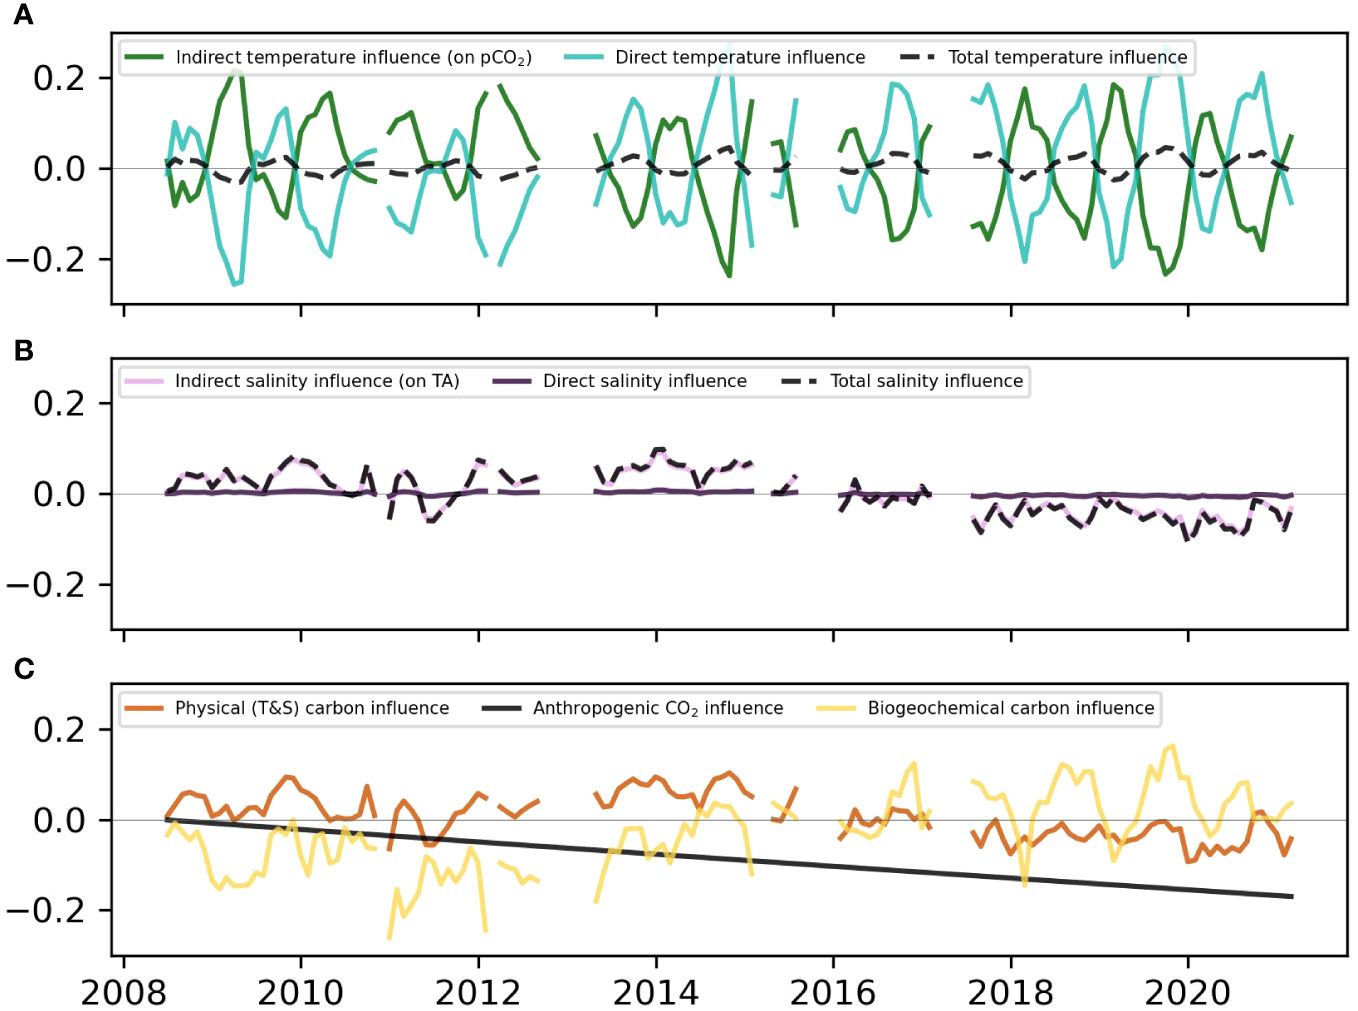
Figure 5 Time-series of monthly means of isolated ΩAr drivers for the combined south shore dataset, defined as in-situ ΩAr - ΩAr with each driver held constant: temperature (A), salinity (B), and biogeochemical and anthropogenic (C) drivers.
Temperature changes affect ΩAr directly by altering the equilibrium constant, but also indirectly via the temperature effect on pCO2sw (Takahashi et al., 1993). The direct and indirect effects of temperature on ΩAr (Figure 5A, green and turquoise lines) are substantial (up to ±0.25 over a monthly average), but they largely cancel out: When it is warmer, the direct temperature effect increases ΩAr, but higher temperature also raises pCO2sw by about 4% per degree SST increase, which indirectly decreases ΩAr (Takahashi et al., 1993). Overall, the direct temperature effect dominates and determines the sign of the total temperature effect (Figure 5A, dashed line). Therefore, temperature contribution accentuates the seasonal cycle with little interannual or higher-frequency variability: The temperature effect increases ΩAr in the summer and decreases ΩAr in the winter, since aragonite becomes more soluble at lower temperatures (lower ΩAr). SST is rising at +0.099 ± 0.011°C per year (r2 = 0.5, p<0.05) at the AW site, and is anticipated to continue increasing with anthropogenic climate change (Figure 6). Consequently, summer peaks in the temperature influence are generally higher during 2017-2021 (~0.03) than 2009-2011 (~0.01). Overall, the influence of temperature on ΩAr tends to be smaller than the other drivers, but it is expected that increasing ΩAr from rising SST in the future will, at least to some extent, counteract the decrease in ΩAr from anthropogenic CO2 invasion.
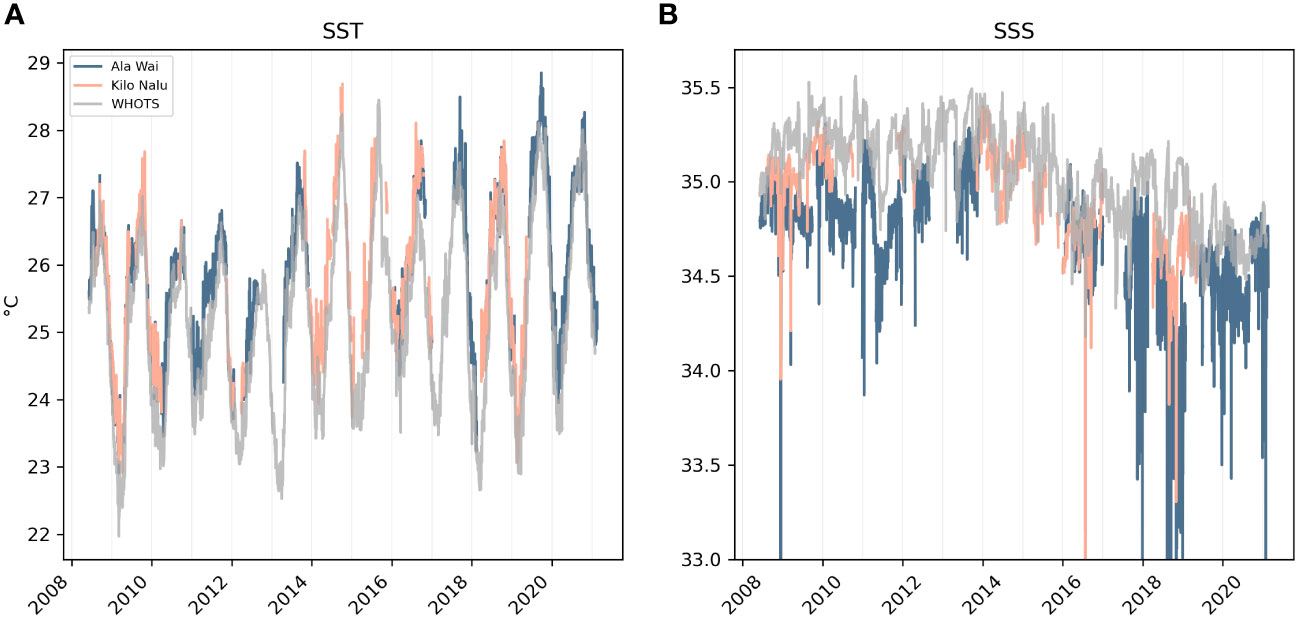
Figure 6 SST (A) and SSS (B) from CTDs at AW, KN and WHOTS.
Salinity is a somewhat stronger driver of ΩAr than temperature at this location (Figure 5C), and the larger contribution is the influence of salinity on TA (Figure 5B, pink line). The direct influence of salinity on ΩAr is negligible (Figure 5B, black line). The most notable feature in the salinity effect (via TA) is the interannual variability, with the first half of the time-series (2008-2015) showing a positive contribution of salinity to ΩAr, while the second half (2015-2021) is characterized by a decrease of ΩAr from salinity changes. ΩAr is influenced by salinity in two ways that work against each other: Thermodynamically, higher salinity increases the solubility of aragonite (decreases ΩAr) by increasing the K*spAr (the apparent solubility product constant for aragonite). However, higher salinity is also associated with higher concentrations of [Ca2+] and [CO32-], which increase ΩAr and alkalinity. The second mechanism clearly overpowers the first here, and low salinity is associated with low ΩAr, and high salinity with high ΩAr, driven by TA changes. As can be seen in Figure 6, the interannual change of the salinity contribution to ΩAr corresponds to a regional high salinity regime (at AW, KN, and WHOTS) between 2008-2015 followed by a period of regionally low salinity since 2015. Additionally, low ΩAr spikes that dip below the 2.82 threshold (Figure 4) are all associated with low salinity excursions (below 33.5) that occurred most frequently between 2017-2018. This suggests that extremely low ΩAr events at this site are mainly caused by a regional low-salinity regime combined with enhanced freshwater input from terrestrial runoff and/or precipitation. This change in salinity could also indicate a shift in source waters, which might include a change in carbonate chemistry.
The biogeochemical carbon drivers (Figure 5C, yellow line) include in-situ biological processes (e.g., photosynthesis/respiration and calcification/dissolution), and mixing with sources that have deviating CO2-carbonate chemistry, such as porewaters, groundwater discharge, or offshore water masses with a different geochemical makeup. Additionally, the DIC : TA ratio of the freshwater endmember in estuaries is known to affect coastal carbonate chemistry, and freshwater inputs can decouple changes in pH and ΩAr (Moore-Maley et al., 2018). The advected and in-situ biogeochemical drivers make up the largest influence on ΩAr. A component of this biogeochemistry creates a strong seasonality in-phase with the temperature influence on ΩAr, and there is interannual variability that mirrors that of the salinity contribution (low in the first half of the time-series, high in the second half).
It is likely that the positive contribution to ΩAr in the summer from the biogeochemical component is due to DIC loss from seasonally elevated biological productivity and outgassing at these sites increasing ΩAr, which is very sensitive to DIC : TA ratios. This corroborates previous findings about pCO2 dynamics at these sites (Drupp et al., 2013; Terlouw et al., 2019). The interannual variability in the biogeochemical term is more enigmatic, but also a crucial component to examine, as it is the main factor that has been preventing a substantial ΩAr decrease from rising anthropogenic CO2, as well as the negative influence of a salinity decrease since 2015, which has only been counteracted slightly by an increase in temperature (Figure 5C). If the water mass change responsible for the salinity decrease since 2015 includes altered carbon chemistry, it might be influencing ΔpCO2. Then, the ocean uptake of CO2 could be changing with time in a way that is not captured by the anthropogenic or salinity influences. It is also possible that the positive contribution to ΩAr from the biogeochemical drivers comes from a relative increase in TA. This excess TA could stem from dissolution of calcium carbonate sediments, from net dissolution within nearby coral reefs, and/or dissolution in the water column or sediments. This hypothesis is explored through estimating relative importance of reef metabolic processes below.
4.2 Drivers of ΩAr: photosynthesis/respiration and calcification/dissolution
The relative influence of photosynthesis/respiration and calcification/dissolution on CO2-carbonate chemistry is further investigated using slopes of salinity-normalized TA (nTA) and DIC (nDIC) from discrete bi-weekly samples at the buoys. Station ALOHA is used as an open-ocean endmember for the coastal sites. Using data from the Hawaii Ocean Time-series (HOT) at Station ALOHA between 2008-2021 (Lukas et al., 2001), multiple linear regression equations for TA and DIC with salinity and temperature at this open-ocean site are established. Measurements were selected from 2008 to 2021, and for the top 30m of the water column. Robust linear correlations of salinity and temperature with TA (r2 = 0.94, n = 217, p<0.001, RMSE = 3.63 µmol kg-1) and DIC (r2 = 0.82, n = 217, p< 0.001; RMSE = 5.43 µmol kg-1) support the assumption of conservative mixing mechanisms between freshwater and seawater end‐members in this region. The resulting linear relationship for the ocean end-member TA and DIC were determined to be as follows:
The theoretical oceanic end-member TAoce and DICoce for coastal locations were determined using the observed salinity and temperature from KN and AW buoys. Assuming that Station ALOHA represents an open-ocean endmember for AW and KN sites, any differences (Δ) between the observed nTA and nDIC at the buoys and nTA and nDIC predicted using the salinity and temperature relationship of oceanic end-member (ΔnDIC/ΔnTA) can then be attributed to biogeochemical processes in the coastal ocean that alter the slopes at known proportions (Deffeyes, 1965; Suzuki & Kawahata, 2003; Watanabe et al., 2006; Shamberger et al., 2011; Yeakel et al., 2015; Page et al., 2016; Cyronak et al., 2018). Although exact quantification of these processes needs additional information on quantities like residence time, this approach enables an assessment of whether coastal reef systems are net calcifying or dissolving, and net autotrophic or heterotrophic (Cyronak et al., 2018).
The relative changes in ΔnTA/ΔnDIC (coastal or buoy – oceanic) are shown in Figure 7, with black lines indicating the known effects of calcification/dissolution and photosynthesis/respiration. Calcification consumes 2 moles of TA for every mole of DIC consumed, while dissolution produces 2 moles of TA for every mole of DIC produced. Although photosynthesis produces only small amounts (0.16 moles) of TA for every mole of DIC consumed, with equal amounts of TA consumed when DIC is produced during respiration, these reactions are responsible for the significant diurnal changes in ΩAr and pCO2sw.
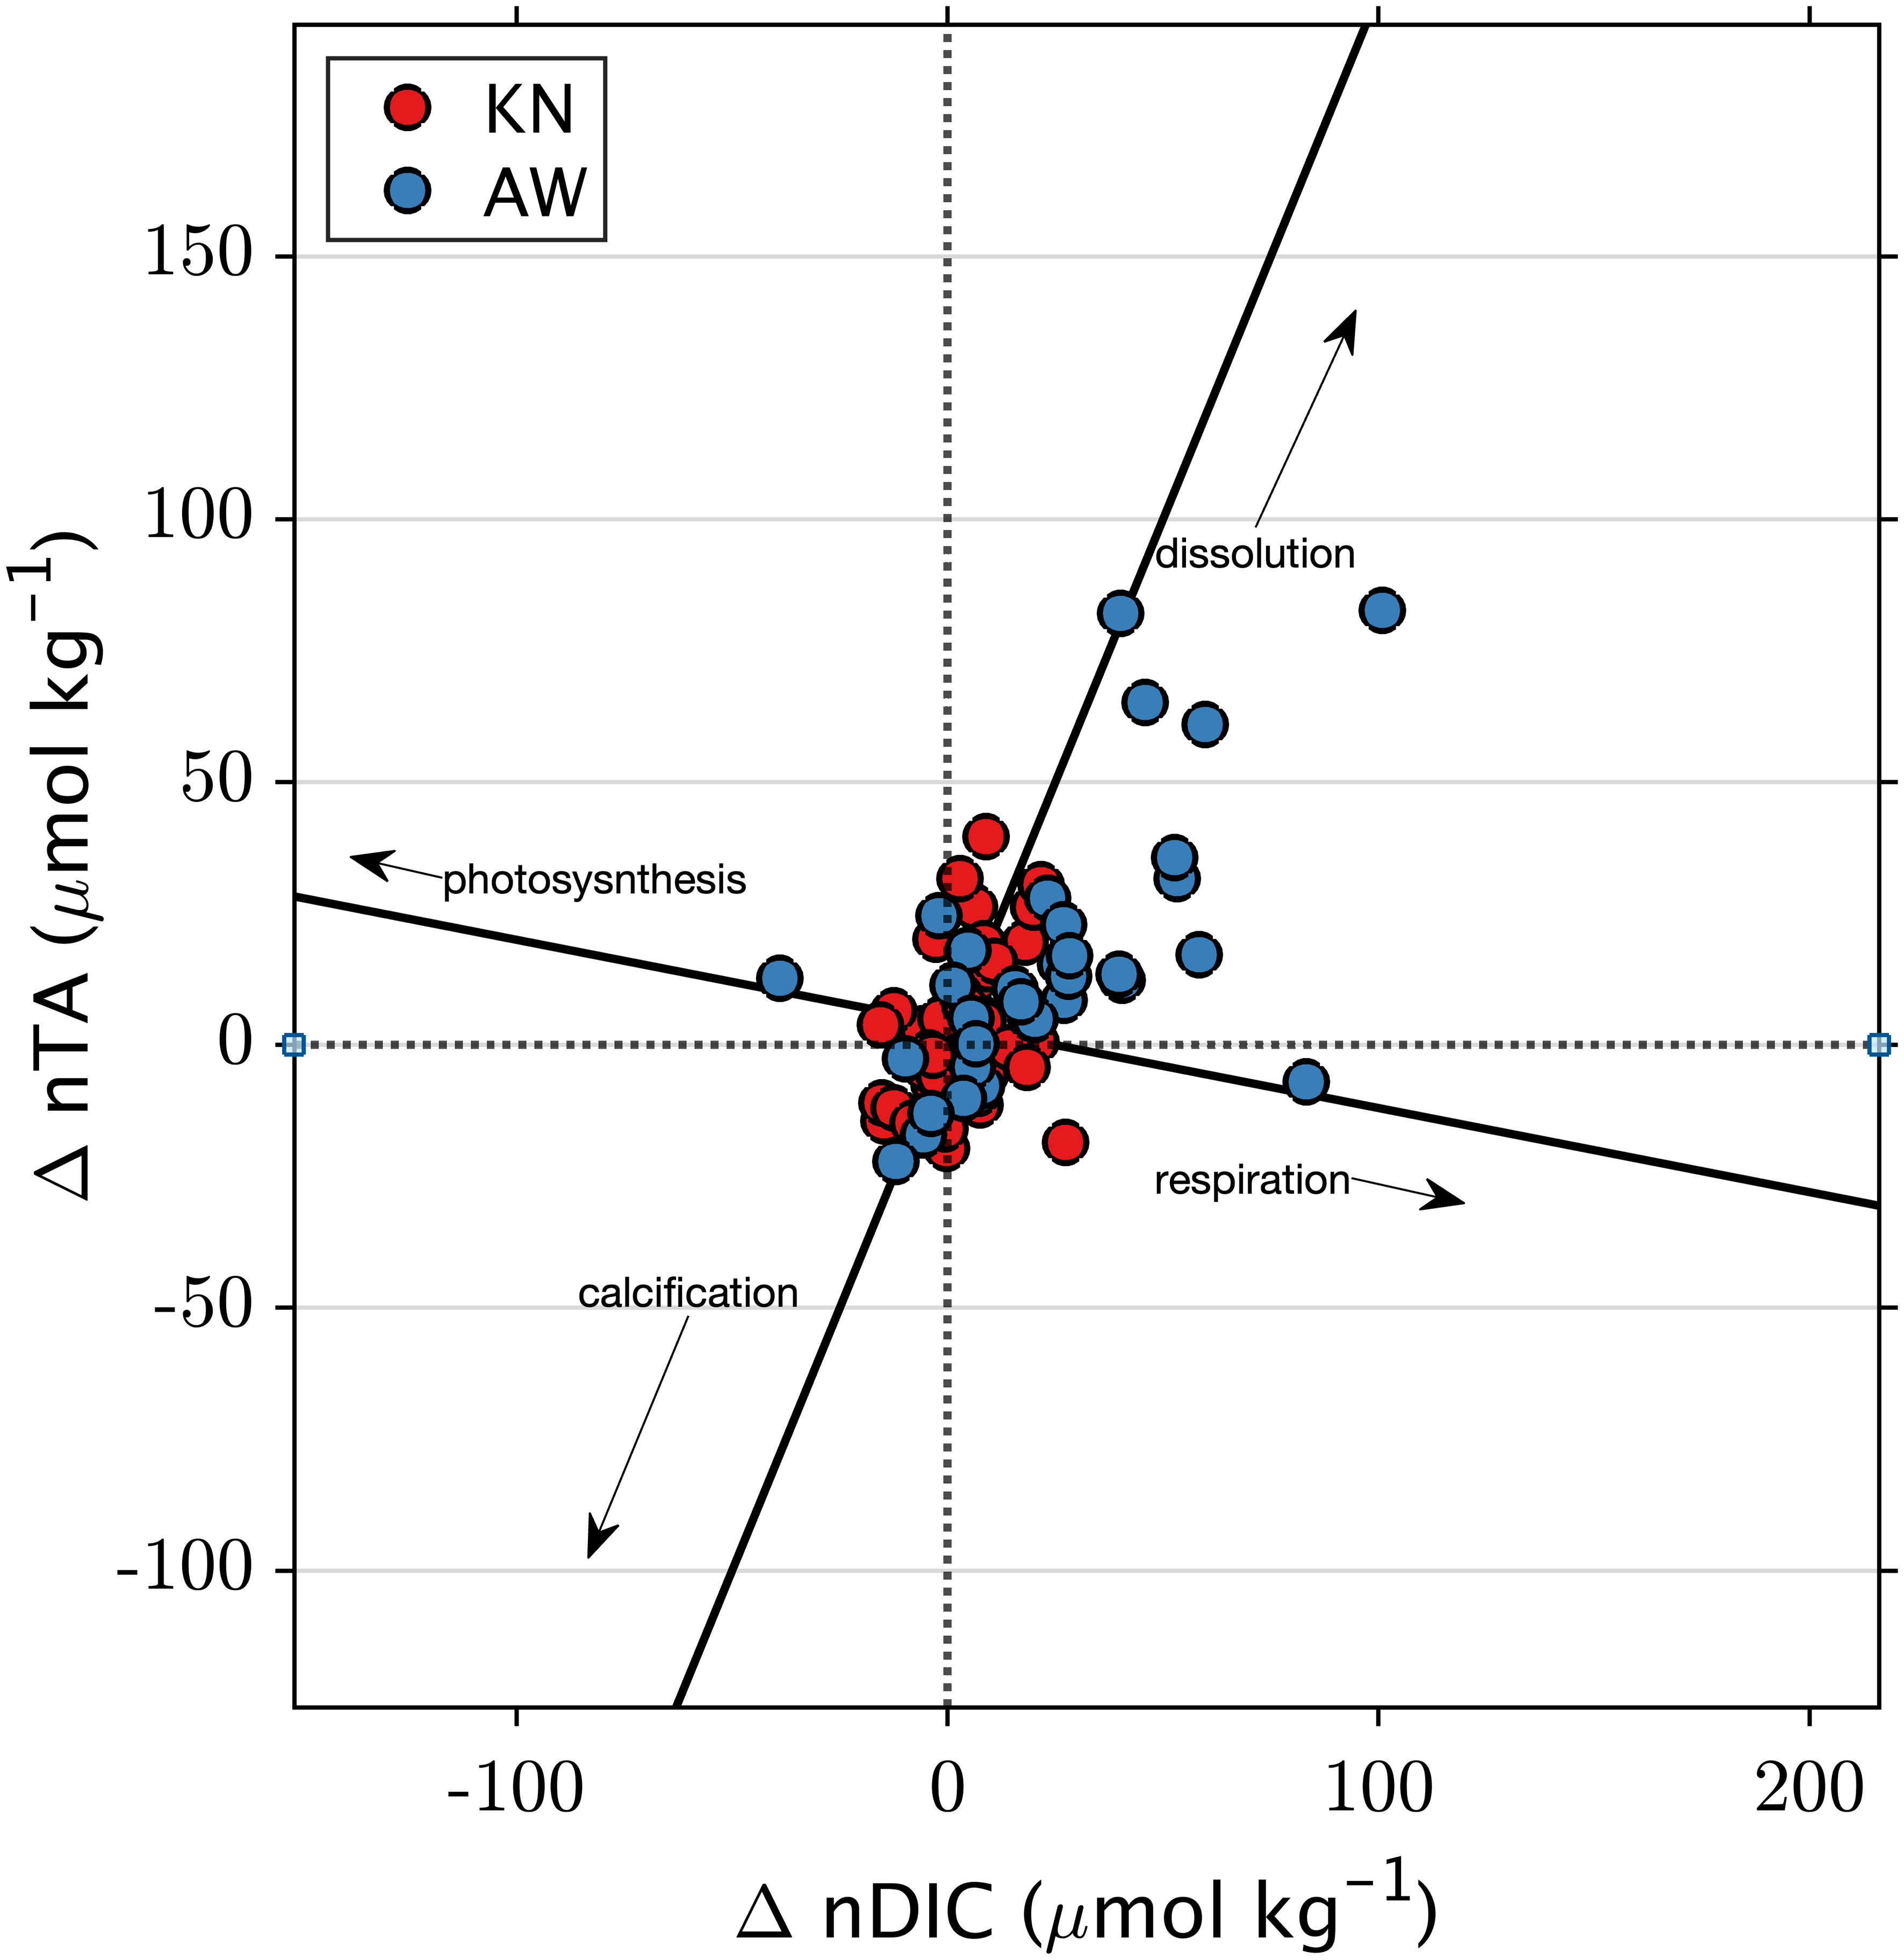
Figure 7 ΔnTA and ΔnDIC at KN and AW; the difference between observed ratios and ratios predicted using open-ocean relationships of DIC and TA with temperature and salinity.
The ΔnTA/ΔnDIC diagram in Figure 7 is divided into quadrants centered at zero. The center point on the ΔnTA/ΔnDIC diagram represents a condition where the ΔnTA and ΔnDIC are both zero, indicating that the observed values match the expected oceanic conditions at this central reference point. A line with a slope close to -0.16 suggests a prevalence of organic carbon production (photosynthesis/respiration) over inorganic carbon production (calcification/dissolution). When calcification (lower left quadrant) or dissolution (upper right quadrant) dominates, data points align along a slope of 2. A slope closer to one indicates a balance between net inorganic and organic metabolic processes. The slope of ΔnTA/ΔnDIC is 0.55 (SE = 0.13, t-test = 4.4, n = 34, p< 0.05) at AW, and 0.46 (SE = 0.20, t-test = 2.3, n = 46, p< 0.05) at KN. Notably, the observed slopes at KN and AW are not significantly different (p = 0.72) from each other. This indicates that variations in nTA and nDIC are likely driven by a combination of ecosystem metabolism and dissolution. At AW, there is an excess of 10 ± 26 µmol kg-1 (median ± standard deviation) nTA and 19 ± 26 µmol kg-1 nDIC relative to the predicted open-ocean values. Most points fall into the top right quadrant, indicating net dissolution and net respiration. In contrast, at KN, differences relative to the predicted oceanic values are generally much smaller (<1 µmol kg-1 nTA and 3 ± 11 µmol kg-1 nDIC), although the majority of observations still indicate net respiration.
The insights from TA/DIC slopes provide essential information regarding the relative influence of Net Ecosystem Calcification (NEC) versus Net Ecosystem Production (NEP) on variations in carbonate chemistry (Cyronak et al., 2018). The slopes of ΔnTA:ΔnDIC also serve as valuable indicators for comprehending how NEP and NEC contribute to changes in nearshore ΩAr (Muehllehner et al., 2016, DeCarlo et al., 2017). Our hypothesis centers on the idea that the increase in nTA and nDIC arising from dissolution and respiration would lead to an elevation in ΩAr when compared to ocean source water. The following equation relates the ΔnTA:ΔnDIC slope to the NEC-to-NEP ratio (NEC : NEP) as proposed by Suzuki and Kawahata (2003):
A NEC : NEP ratio of 0.87 maintains approximately constant ΩAr, whereas higher ratios decrease ΩAr and lower ratios increase ΩAr for nDIC and nTA values typically observed at AW and KN (e.g., DeCarlo et al., 2017). The ΔnTA:ΔnDIC slopes were 0.55 ± 0.12 (AW) and 0.46 ± 0.20 (KN), indicating an NEC : NEP ratio of 0.38 at AW and 0.30 at KN. This suggests that organic carbon processes (i.e., respiration) play a more prominent role at both sites. Muehllehner et al. (2016) established a relationship between the slope of the metabolic vector and its impact on ΩAr, and we anticipate that metabolic processes will yield positive feedback in ΩAr relative to offshore ocean water. Metabolic processes increase ΩAr by 0.013 at AW, and only by 0.001 at KN. This difference is attributed to the higher increase in nTA and nDIC observed at the AW site, resulting in a vector magnitude (√(ΔnTA2 + ΔnDIC2)) of 36 ± 29 µmol kg−1 (mean ± standard deviation STD), whereas the KN site exhibited a lower magnitude of 14 ± 9 µmol kg−1. This supports the hypothesis that respiration could be contributing to the introduction of CO2 and stimulating the dissolution of carbonate sediments, either within the water column or in the benthic environment. This suggests that dissolution processes might have the potential to elevate the ΩAr values at AW relative to KN and open ocean. Testing this hypothesis on shorter timescales, such as daily or sub-daily time scales, would require a more precise characterization of the TA model or the incorporation of an additional carbonate parameter.
5 Conclusions
A significant trend in pCO2sw of +1.84 ± 0.27 µatm yr-1 is detected on the south shore of O’ahu. This trend is significant despite the considerable higher frequency variability (sub-diurnal to sub-annual) that is present especially at the AW site, and to a smaller extent at the KN site. The secular trend in pCO2sw is one of multiple drivers that influence the whole CO2-carbonate system equilibrium, which are characterized utilizing a variety of approaches. Previous studies suggest that carbonate chemistry at AW and KN is largely controlled by mixing with land-based sources, with additional increased respiration and some water column dissolution (Drupp et al., 2013; Terlouw et al., 2019). Choosing ΩAr as a parameter to examine ocean acidification and its modulation, this study confirms the importance of land-based freshwater pulses, which caused ΩAr to drop below the critical threshold for coral reef survival twelve times in a single year at the AW, but not the KN site. On inter-annual time scales, effects of (globally) increasing temperature and (regionally) decreasing salinity on ΩAr have been counteracting each other. Presumably, the regional low-salinity regime, which is largely due to changes in rainfall patterns associated with large-scale climatic oscillations (Lukas & Santiago-Mandujano, 2008) will switch to a high-salinity regime on a multi-annual to decadal time-scale. Increasing salinity along with rising SST might then dampen or even suppress the long-term decrease of ΩAr from anthropogenic CO2 invasion for a few years to decades. A significant contribution of enhanced dissolution, likely of carbonate sediments, to maintaining relatively high ΩAr on the south shore despite the influences of decreasing salinity, high respiration and increasing anthropogenic CO2 is confirmed by examining ΔnTA/ΔnDIC between observed values and those predicted using an open-ocean relationship with salinity and temperature. Dissolution of carbonate sediments at or near the AW and KN locations seems to be buffering acidification due to both rising pCO2sw and increased freshwater input from terrestrial runoff/precipitation and regional salinity changes.
Data availability statement
The datasets generated and analyzed for this study are open-access and can be found in the NOAA National Centers for Environmental Information Ocean Carbon and Acidification Data System (NCEI OCDAS) at https://www.ncei.noaa.gov/access/ocean-carbon-acidification-data-system/oceans/Moorings/Ala_Wai.html for Ala Wai (Knor et al., 2018; Sutton et al., 2016a), and at https://www.ncei.noaa.gov/access/ocean-carbon-acidification-data-system/oceans/Moorings/Kilo_Nalu.html for Kilo Nalu (Knor et al., 2018; Sutton et al., 2016b). These links include autonomous and discrete datasets.
Author contributions
LK: Data curation, Formal analysis, Investigation, Methodology, Visualization, Writing – original draft, Writing – review & editing. MM: Data curation, Formal analysis, Methodology, Visualization, Writing – review & editing. CS: Conceptualization, Funding acquisition, Investigation, Resources, Supervision, Writing – review & editing. AS: Conceptualization, Data curation, Funding acquisition, Resources, Writing – review & editing.
Funding
The author(s) declare financial support was received for the research, authorship, and/or publication of this article. We thank several funders and contributors for supporting the Ala Wai and Kilo Nalu time series: PMEL, PacIOOS, NOAA OAP CIMAR NA21NMF4320043, and the University of Hawaii Sea Grant College Program, SOEST, under Institutional Grant No. NA14OAR4170071. This is PMEL contribution number 5558, and SOEST contribution number 11771.
Acknowledgments
Thanks to Eric DeCarlo for the establishment and maintenance of the time series for most of their lifetime, and to Michael Tomlinson, Patrick Drupp, Gerianne Terlouw, Ryan Tabata, Noah Howins, and Dylan Boeman for their invaluable contributions to field- and lab work over the years. Thank you also to Sylvia Musielewicz and the PMEL team for all of their work on the MAPCO2 buoy network. Thanks to Jason Jones at the Hawaii Institute of Marine Biology, as well as Clint Collins, Liv Wheeler, David Pence, and Mike Pamaatat at the UH Diving Safety Program, and to the Hawaii Yacht Club for vessel and diving support during annual buoy servicing operations.
Conflict of interest
The authors declare that the research was conducted in the absence of any commercial or financial relationships that could be construed as a potential conflict of interest.
Publisher’s note
All claims expressed in this article are solely those of the authors and do not necessarily represent those of their affiliated organizations, or those of the publisher, the editors and the reviewers. Any product that may be evaluated in this article, or claim that may be made by its manufacturer, is not guaranteed or endorsed by the publisher.
Supplementary material
The Supplementary Material for this article can be found online at: https://www.frontiersin.org/articles/10.3389/fmars.2024.1335438/full#supplementary-material
References
Battista T. A., Costa B. M., Anderson S. M. (2007). Shallow-water benthic habitats of the main eight Hawaiian islands (Technical memorandum NOS NCCOS 61) (NOAA Biogeography Branch). Available at: https://products.coastalscience.noaa.gov/collections/benthic/e97hawaii/data2007.aspx.
Brander L., van Beukering P. (2013). The total economic value of U.S. coral reefs: A review of the literature. 8.
Cesar H. S. J., Beukering P. V. (2004). Economic valuation of the coral reefs of hawai’i. Pacific Sci. 58, 231–242. doi: 10.1353/psc.2004.0014
Cyronak T., Andersson A. J., Langdon C., Albright R., Bates N. R., Caldeira K., et al. (2018). Taking the metabolic pulse of the world’s coral reefs. PloS One 13 (1), e0190872. doi: 10.1371/journal.pone.0190872
De Carlo E. H., Beltran V. L., Tomlinson M. S. (2004). Composition of water and suspended sediment in streams of urbanized subtropical watersheds in Hawaii. Appl. Geochemistry 19, 1011–1037. doi: 10.1016/j.apgeochem.2004.01.004
DeCarlo T. M., Cohen A. L., Wong G. T. F., Shiah F., Lentz S. J., Davis K. A., et al. (2017). Community production modulates coral reef pH and the sensitivity of ecosystem calcification to ocean acidification. J. Geophysical Research: Oceans 122 (1), 745–761. doi: 10.1002/2016JC012326
De Carlo E. H., Terlouw G., Drupp P. S. (2018). Dissolved inorganic carbon, total alkalinity, temperature, and salinity collected from surface discrete observations using coulometer, alkalinity titrator and other instruments from the coral reef MPCO2 buoys at Ala Wai, CRIMP-2, Kaneohe, and Kilo Nalu from 2009-08-13 to 2015-12-31 (NCEI Accession 0177741) [dataset]. NOAA Natl. Centers Environ. Information. doi: 10.25921/D22M-4H65
Deffeyes K. S. (1965). CARBONATE EQUILIBRIA: A GRAPHIC AND ALGEBRAIC APPROACH. Limnology Oceanography 10 (3), 412–426. doi: 10.4319/lo.1965.10.3.0412
Dickson A. G., Wesolowski D. J., Palmer D. A., Mesmer R. E. (1990). Dissociation constant of bisulfate ion in aqueous sodium chloride solutions to 250.degree.C. J. Phys. Chem. 94 (20), 7978–7985. doi: 10.1021/j100383a042
Dickson A. G., Sabine C. L., Christian J. R., Bargeron C. P., North Pacific Marine Science Organization (2007). Guide to best practices for ocean CO2 measurements (North Pacific Marine Science Organization).
Dore J. E., Lukas R., Sadler D. W., Church M. J., Karl D. M. (2009). Physical and biogeochemical modulation of ocean acidification in the central North Pacific. Proc. Natl. Acad. Sci. 106, 12235–12240. doi: 10.1073/pnas.0906044106
Drupp P. S., De Carlo E. H., Mackenzie F. T., Sabine C. L., Feely R. A., Shamberger K. E. (2013). Comparison of CO2 dynamics and air–sea gas exchange in differing tropical reef environments. Aquat. Geochemistry 19, 371–397. doi: 10.1007/s10498-013-9214-7
Duarte C. M., Hendriks I. E., Moore T. S., Olsen Y. S., Steckbauer A., Ramajo L., et al. (2013). Is ocean acidification an open-ocean syndrome? Understanding anthropogenic impacts on seawater pH. Estuaries Coasts 36, 221–236. doi: 10.1007/s12237-013-9594-3
Feely R., Doney S., Cooley S. (2009). Ocean acidification: present conditions and future changes in a high-CO2 world. Oceanography 22, 36–47. doi: 10.5670/oceanog.2009.95
Fennel K., Alin S., Barbero L., Evans W., Bourgeois T., Cooley S., et al. (2019). Carbon cycling in the North American coastal ocean: A synthesis. Biogeosciences 16, 1281–1304. doi: 10.5194/bg-16-1281-2019
Fryer P. (1995). Science and engineering studies of the ala wai canal, an urban estuary in honolulu. PACIFIC Sci. 49, 319.
Glenn C. R., McMurtry G. M. (1995). Scientific studies and history of the ala wai canal, an artificial tropical estuary in Honolulu. PACIFIC Sci. 49.
Grigg R. W. (1995). Coral reefs in an urban embayment in Hawaii: A complex case history controlled by natural and anthropogenic stress. Coral Reefs 14, 253–266. doi: 10.1007/BF00334349
Gruber N., Hauri C., Lachkar Z., Loher D., Frölicher T. L., Plattner G.-K. (2012). Rapid progression of ocean acidification in the california current system. Science 337, 220–223. doi: 10.1126/science.1216773
Guan Y., Hohn S., Merico A. (2015). Suitable environmental ranges for potential coral reef habitats in the tropical ocean. PloS One 10, e0128831. doi: 10.1371/journal.pone.0128831
Kleypas J., Allemand D., Anthony K., Baker A. C., Beck M. W., Hale L. Z., et al. (2021). Designing a blueprint for coral reef survival. Biol. Conserv. 257, 109107. doi: 10.1016/j.biocon.2021.109107
Knor L., Meléndez M., Howins N., Boeman D., Lechner E., De Carlo E. H., et al. (2018). Dissolved inorganic carbon, total alkalinity, water temperature and salinity collected from surface discrete observations using coulometer, alkalinity titrator and other instruments from the coral reef MPCO2 buoys at Ala Wai, CRIMP-2, Kaneohe, and Kilo Nalu from 2016-01-08 to 2022-12-21 (NCEI Accession 0176671) [dataset] (NOAA National Centers for Environmental Information). doi: 10.25921/PE6V-QG74
Lan X., Tans P., Thoning K., NOAA Global Monitoring Laboratory (2023). Trends in globally-averaged CO2 determined from NOAA Global Monitoring Laboratory measurements (NOAA GML). doi: 10.15138/9N0H-ZH07
Lueker T. J., Dickson A. G., Keeling C. D. (2000). Ocean pCO2 calculated from dissolved inorganic carbon, alkalinity, and equations for K1 and K2: Validation based on laboratory measurements of CO2 in gas and seawater at equilibrium. Mar. Chem. 70 (1–3), 105–119. doi: 10.1016/S0304-4203(00)00022-0
Lukas R., Church M. J., Karl D. M. (2001). Physical and biochemical oceanographic data from the Hawaii Ocean Time-series (HOT) program collected by University of Hawaii at Station ALOHA in the Pacific Ocean 100 miles north of Oahu, Hawaii, since 1988. (Dataset gov. noaa.nodc:Station-ALOHA-HOT) (NOAA National Centers for Environmental Information). Available at: https://www.ncei.noaa.gov/archive/accession/Station-ALOHA-HOT.
Lukas R., Santiago-Mandujano F. (2008). Interannual to interdecadal salinity variations observed near Hawaii: Local and remote forcing by surface freshwater fluxes. Oceanography 21 (1), 46–55.
Millero F. J. (2007). The marine inorganic carbon cycle. Chem. Rev. 107, 308–341. doi: 10.1021/cr0503557
Moore-Maley B. L., Ianson D., Allen S. E. (2018). The sensitivity of estuarine aragonite saturation state and pH to the carbonate chemistry of a freshet-dominated river. Biogeosciences 15 (12), 3743–3760. doi: 10.5194/bg-15-3743-2018
Muehllehner N., Langdon C., Venti A., Kadko D. (2016). Dynamics of carbonate chemistry, production, and calcification of the Florida Reef Tra c–2010): Evidence for seasonal dissolution. Global Biogeochemical Cycles 30 (5), 661–688. doi: 10.1002/2015GB005327
Newton J., Feely R., Jewett E., Williamson P., Mathis J. (2015). Global ocean acidification observing network: requirements and governance plan. Second Edition, GOA-ON. Available at: http://www.goa-on.org/docs/GOA-ON_plan_print.pdf
Orr J. C., Epitalon J.-M., Dickson A. G., Gattuso J.-P. (2018). Routine uncertainty propagation for the marine carbon dioxide system. Mar. Chem. 207, 84–107. doi: 10.1016/j.marchem.2018.10.006
Page H. N., Andersson A. J., Jokiel P. L., Rodgers K. S., Lebrato M., Yeakel K., et al. (2016). Differential modification of seawater carbonate chemistry by major coral reef benthic communities. Coral Reefs 35 (4), 1311–1325. doi: 10.1007/s00338-016-1490-4
Pawlak G., De Carlo E. H., Fram J. P., Hebert A. B., Jones C. S., McLaughlin B. E., et al. (2009). Development, deployment, and operation of Kilo Nalu nearshore cabled observatory. OCEANS 2009-EUROPE, 1–10. doi: 10.1109/OCEANSE.2009.5278149
Sabine C. L., Feely R. A., Gruber N., Key R. M., Lee K., Bullister J. L., et al. (2004). The Oceanic Sink for Anthropogenic CO 2. Science 305 (5682), 367–371. doi: 10.1126/science.1097403
Shamberger K. E. F., Feely R. A., Sabine C. L., Atkinson M. J., DeCarlo E. H., Mackenzie F. T., et al. (2011). Calcification and organic production on a Hawaiian coral reef. Mar. Chem. 127 (1–24), 64–75. doi: 10.1016/j.marchem.2011.08.003
Salisbury J., Green M., Hunt C., Campbell J. (2008). Coastal acidification by rivers:A threat to shellfish? Eos Trans. Am. Geophysical Union 89, 513–513. doi: 10.1029/2008EO500001
Seabold S., Perktold J. (2010). Statsmodels: Econometric and statistical modeling with python. (Python). doi: 10.25080/issn.2575-9752.
Strickland J. D. H., Parsons T. R. (1972). A practical handbook of seawater analysis. Ottawa Canada Fisheries Res. Board Canada 310. doi: 10.25607/OBP-1791
Suzuki A., Kawahata H. (2003). Carbon budget of coral reef systems: An overview of observations in fringing reefs, barrier reefs and atolls in the Indo-Pacific regions. Tellus B: Chem. Phys. Meteorology 55 (2), 428. doi: 10.3402/tellusb.v55i2.16761
Sutton A. J., Battisti R., Carter B., Evans W., Newton J., Alin S., et al. (2022). Advancing best practices for assessing trends of ocean acidification time series. Front. Mar. Sci. 9. doi: 10.3389/fmars.2022.1045667
Sutton A. J., Sabine C. L., De Carlo E. H., Musielewicz S., Maenner-Jones S., Dietrich C., et al. (2016a). High-resolution ocean and atmosphere pCO2 time-series measurements from mooring Alawai_158W_21N in the North Pacific Ocean (NCEI Accession 0157360) [dataset] (National Centers for Environmental Information). doi: 10.3334/cdiac/otg.tsm_alawai_158w_21n
Sutton A. J., Sabine C. L., De Carlo E. H., Musielewicz S., Maenner-Jones S., Dietrich C., et al. (2016b). High-resolution ocean and atmosphere pCO2 time-series measurements from mooring Kilo_Nalu_158W_21N in the North Pacific Ocean (NCEI Accession 0157251) [dataset] (National Centers for Environmental Information). doi: 10.3334/cdiac/otg.tsm_kilo_nalu_158w_21n
Sutton A. J., Sabine C. L., Maenner-Jones S., Lawrence-Slavas N., Meinig C., Feely R. A., et al. (2014). A high-frequency atmospheric and seawater pCO2 data set from 14 open-ocean sites using a moored autonomous system. Earth Syst. Sci. Data 6, 353–366. doi: 10.5194/essd-6-353-2014
Takahashi T., Olafsson J., Goddard J. G., Chipman D. W., Sutherland S. C. (1993). Seasonal variation of CO 2 and nutrients in the high-latitude surface oceans: A comparative study. Global Biogeochemical Cycles 7 (4), 843–878. doi: 10.1029/93GB02263
Terlouw G. J., Knor L. A. C. M., De Carlo E. H., Drupp P. S., Mackenzie F. T., Li Y. H., et al. (2019). Hawaii coastal seawater CO2 network: A statistical evaluation of a decade of observations on tropical coral reefs. Front. Mar. Sci. 6. doi: 10.3389/fmars.2019.00226
Tomlinson M., De Carlo E., McManus M., Pawlak G., Steward G., Sansone F., et al. (2011). Characterizing the effects of two storms on the coastal waters of OA’hu, hawai’i, using data from the pacific islands ocean observing system. Oceanography 24, 182–199. doi: 10.5670/oceanog.2011.38
Van Heuven S., Pierrot D., Rae J. W. B., Lewis E., Wallace D. W. R. (2011). MATLAB program developed for CO2 system calculations (ORNL/CDIAC-105b).
Watanabe A., Kayanne H., Hata H., Kudo S., Nozaki K., Kato K., et al. (2006). Analysis of the seawater CO 2 system in the barrier reef-lagoon system of Palau using total alkalinity-dissolved inorganic carbon diagrams. Limnology Oceanography 51 (4), 1614–1628. doi: 10.4319/lo.2006.51.4.1614
Weatherhead E. C., Reinsel G. C., Tiao G. C., Meng X., Choi D., Cheang W., et al. (1998). Factors affecting the detection of trends: Statistical considerations and applications to environmental data. J. Geophysical Research: Atmospheres 103, 17149–17161. doi: 10.1029/98JD00995
Keywords: ocean acidification, coral reef, coastal, runoff, aragonite, climate change, carbon dioxide, pollution
Citation: Knor LACM, Meléndez M, Sabine CL and Sutton AJ (2024) Drivers of CO2-carbonate system variability in the coastal ocean south of Honolulu, Hawai’i. Front. Mar. Sci. 11:1335438. doi: 10.3389/fmars.2024.1335438
Received: 08 November 2023; Accepted: 08 February 2024;
Published: 05 March 2024.
Edited by:
Eva Krasakopoulou, University of the Aegean, GreeceReviewed by:
Kelly A. Kearney, University of Washington, United StatesPhillip Williamson, University of East Anglia, United Kingdom
Copyright © 2024 Knor, Meléndez, Sabine and Sutton. This is an open-access article distributed under the terms of the Creative Commons Attribution License (CC BY). The use, distribution or reproduction in other forums is permitted, provided the original author(s) and the copyright owner(s) are credited and that the original publication in this journal is cited, in accordance with accepted academic practice. No use, distribution or reproduction is permitted which does not comply with these terms.
*Correspondence: Lucie A. C. M. Knor, luciek@hawaii.edu