Research on the change of the storage volume of the Nordic Seas Overflows over the last 40 years
 Wenqi Shi1
  Minjie Xu
 Xianqing Lv
- 1National Marine Environmental Monitoring Center, Ministry of Ecology and Environment, Dalian, China
- 2School of Ocean, Yantai University, Yantai, China
- 3Frontier Science Center for Deep Ocean Multispheres and Earth System (FDOMES) and Physical Oceanography Laboratory, Ocean University of China, Qingdao, China
- 4Laoshan Laboratory, Qingdao, China
The Nordic Sea overflow, being a significant driver of the thermohaline circulation, exerts a substantial influence on environmental dynamics in the Arctic and globally. A better understanding about the trend of the storage volume of the Nordic Seas Overflows is of paramount importance to a realistic assessment of the North Atlantic circulation and variability. EN4.2.2 reanalysis data were utilized to acquire the monthly average time series of overflow water storage volume in the Nordic Sea from 1950 to 2022. The storage volume demonstrates seasonal variations, with fluctuations of approximately 10% around the average. Over the period from 1980 to 2022, the average volume per decade exhibited a consistent decrease. Linear fitting of the annual average data estimated the overall relative change trend in the last 43 years to be -7.2 ± 2.6%. However, the quality of the EN4.2.2 data brings the average error of about 12% in the calculation of the overflow storage volume, which implies that the downward trend requires further validation. From a spatial standpoint, the Norwegian Sea, particularly the Lofoten Basin, is the primary region where overflow water storage volume in the Nordic seas have decreased. This decrease corresponds to an increase in ocean temperatures within the upper layer (0-600m) of both the Lofoten Basin and the Norwegian Basin. The warming of these regions has directly impacted the overflow water storage volume, leading to its reduction. It is noteworthy that the ocean temperature rise in the upper layer is more influenced by the Atlantic inflow rather than air-sea flux, particularly in the Norwegian Basin. This is attributed to the substantial increase in SST in the North Atlantic, which aligns with the warm current regions in the Atlantic Ocean, and the lack of statistical significance in linear trend of the air-sea heat flux. Furthermore, there has been a more rapid reduction in the overflow storage volume in the Norwegian Sea from 2011 to 2022. Specifically, the annual average overflow volume from 2018 to 2022 dropped below the previous lowest value. Concurrently, the salinity of the upper Norwegian Sea and the Atlantic inflow decreased considerably, while there has been no significant change in ocean temperature. Therefore, this short-term fluctuation is predominantly attributed to the decrease in Atlantic inflow salinity. Interestingly, the decrease in overflow water volume in the Nordic Seas does not follow a linear pattern in relation to increasing ocean temperature; instead, it exhibits an accelerating trend. If the ocean temperature rises by 1°C, the overflow water volume in the Nordic Seas will decrease to 86% of the total volume. Overall, the overflow water storage in the Norwegian Sea undergoes complex interannual variations and is notably influenced by the influx from the Atlantic Ocean.
1 Introduction
The Nordic Sea (Norwegian, Greenland, and Iceland Seas) serves as the primary link connecting the Arctic Ocean and the North Atlantic Ocean. The northern part of the Nordic Sea is connected to the Arctic Ocean through the Fram Strait. The sill depth of this strait is about 2600m, making it the only deep-water channel in the Arctic Ocean. As a result of global climate change and its amplification in the Arctic, the Nordic Sea is particularly impacted by climate change and, in turn, exerts a significant feedback effect on climate change. Relevant studies have demonstrated that the North Atlantic meridional overturning circulation transports heat from the upper ocean to the deep ocean, effectively slowing down the global warming trend (Chen and Tung, 2014; Stolpe et al., 2018; Caesar et al., 2020; Kim et al., 2023). Alterations in the overflow intensity of the Nordic Sea can influence the thermohaline circulation, leading to changes in the global warming process (Zhang et al., 2011). Such changes can impact the distribution and transmission of oceanic heat in the Arctic and potentially exacerbate Arctic warming (Telesiński et al., 2022). In the Nordic Seas, seawater shallower than the depth of the Greenland-Scotland Ridge (GSR) (840m) and with a potential density () greater than 27.8 kg/m3 could overflow. Theoretical arguments imply that the overflow transport is associated with the pressure difference between both sides of the GSR at the depth of the overflow core (Crease, 1965; Whitehead, 1998; Girton et al., 2006; Käse, 2006; Olsen et al., 2008; Smedsrud et al., 2022). The Nordic Sea serves functioned as a transit station or temporary reserve for overflow water, where the storage volume of overflow water indicates its intensity and directly affects overflow intensity through barocline (Yang and Pratt, 2013). By understanding the trend of the storage volume, we can gain insights into the behavior and variability of these overflows, which is essential for predicting and studying climate patterns. Besides, the Nordic Seas Overflows are also important for the formation of deep water masses, which are essential for the transport and storage of heat, carbon, and other substances in the ocean. Changes in the storage volume can have implications for the exchange of these substances between the surface and deep ocean, which can impact global biogeochemical cycles and climate. Therefore, studying changes in the storage volume of overflow water in the Nordic Sea is of great significance.
Previous research has estimated that the storage volume of overflow water above the GSR sill depth in the Nordic Sea can provide decades of overflow without water source renewal (Hansen and Østerhus, 2000; Käse, 2006; Smedsrud et al., 2022). However, the above estimation assumes that high density seawater shallower than the depth of GSR can be freely supplied for overflow, disregarding the fundamental dynamic laws controlling ocean circulation. The large-scale ocean circulation in the Nordic Sea is nearly geostrophic, with streamlines aligned along the isobaths (Nøst and Isachsen, 2003). Consequently, the majority of dense water is unable to freely overflow as it is confined within closed geostrophic contours in the deep basin. The study of Yang and Pratt (Yang and Pratt, 2013) revealed that approximately 80% to 85% of the dense water does not immediately spill over the ridge and the effective capacity of the reservoir for overflow water is only 15% to 20%, which is the volume that is not prevented by conservative, nearly geostrophic dynamics from overflowing the ridge. Therefore, the Nordic Seas has a relatively small capacity as a dense water reservoir and thus the overflow transport is sensitive to climate change (Yang and Pratt, 2013).
Several investigations have indicated a significant reduction in deep water production in the Nordic Seas since the 1960s, with the depth of the deep water in Greenland being less than 1000m in 2006 (Bönisch et al., 1997; Marshall and Schott, 1999; Latarius and Quadfasel, 2010; Yang and Neelin, 2010). Modern climate simulations have demonstrated that the both the overflow transport in the Nordic Seas and the deep ocean convection in the Greenland Sea are showing a weakening trend (Dong and Sutton, 2005; Gregory et al., 2005; Guemas and Salas-Mélia, 2008). However, both observations and model data indicate no significant trend in overflow transport (Serra et al., 2010; Yang and Pratt, 2013). Olsen et al. (Olsen et al., 2008) utilized an ocean general circulation model to indicate that deepening isopycnals in the Norwegian Sea have contributed to a decrease in pressure difference across the Greenland–Scotland ridge. However, this has been compensated by changes in sea level, resulting in no significant trend in volume transport. Eldevik et al. (2009) found that the main source for change in the overflow waters is the Atlantic water circulating in the Nordic seas, rather than the open-ocean convection.
As the production of overflow water in the Nordic Sea decreases while the volume transport remains unchanged, a significant decrease in the storage volume of Nordic Seas Overflows is expected if the overflow water supplied by the Arctic Ocean remains constant. To verify whether the storage volume of overflow water is indeed decreasing and to identify the main reasons and mechanisms leading to this variation, the reanalyzed long-term hydrographic data are used to construct the variation series of the storage volume of the Nordic Seas Overflows and analyze its trend. The paper is organized as follows. After the introduction, Section 2 provides a description of the data and methodology. The reduction in the storage volume of the Nordic Seas Overflows and the changes in the properties of the overflow water are presented in Section 3. Section 4 discusses the reasons for the decrease in overflow water storage volume. Finally, Section 5 examines the impacts of future ocean warming on the storage volume of the Nordic Seas Overflows.
2 Data and methodology
2.1 Data
The hydrological data used to analyze the changes in the storage volume, ocean temperature and salinity profiles in the Nordic Seas are derived from the monthly average analysis data of EN.4.2.2 (Good et al., 2013). The EN.4.2.2 is provided by the Met Office Hadley Centre (https://www.metoffice.gov.uk/hadobs/en4/). The EN4 dataset combines data from four sources: Argo, the Arctic Synoptic Basin-wide Oceanography (ASBO) project, the Global Temperature and Salinity Profile Program (GTSPP), and the World Ocean Database (WOD), which have high reliability. The horizontal resolution is 1°×1°, covering the area of 1°E-360°E, 83°S-89°N. In the vertical direction, the data is divided into 42 levels, with varying water layer thickness ranging from 10 meters in the upper layer to 300 meters in the deep layer.
The monthly average climatological temperature data of the Nordic Seas, obtained from HydroBase2 (http://www.whoi.edu/hydrobase/php/index.php), are provided by Woods Hole Oceanographic Institution (Curry, 2001). These observations have a horizontal resolution of 0.25°×0.25°, and cover the period from 1953 to 2002. The dataset is developed based on the technique of averaging along the isopycnic surface, which was previously employed by Lozier et al. (Lozier et al., 1995). Its advantage is that it maintains the temperature and salinity structure well during the averaging process, reflecting the highly changing frontal structure in the ocean (Chang and Chao, 2000). HydroBase2 is used for studying the impact of different warming scenarios on the storage volume of the Nordic Seas overflow.
The air-sea fluxes are computed using net heat fluxes, net fresh water fluxes, and surface solar radiation. The atmospheric variables necessary for these parameterizations are acquired from the ERA5 hourly reanalysis data (Hersbach et al., 2020) with a spatial resolution of 1/4°. ERA5 is the fifth generation ECMWF atmospheric reanalysis of the global climate covering the period from January 1940 to the present. Besides, Sea Surface Temperature (SST) data are sourced from the NOAA National Center for Environmental Prediction (NCEP) Optimum Interpolation (OI) SST monthly products (https://rda.ucar.edu/datasets/ds277.0/), with a horizontal resolution is 1°×1° (Smith et al., 2008).
2.2 Calculation of storage volume of overflow waters
The calculation of the volume of overflow water focuses on water shallower than 840m and with a potential density greater than 27.8 kg/m3 (Eldevik et al., 2009). The study area encompasses the Nordic Seas, as depicted in Figure 1. The red small triangles in Figure 1 represent the stations of EN4 data used to determine the storage volume of overflow waters in the Nordic Sea, totaling 784 stations. Additionally, the blue circle points are the data grid points used for analyzing Atlantic inflow in Section 4.2. To derive the overflow water volume, the vertical density profile is computed for each grid using ocean temperature and salinity data from EN.4.2.2 data and the depth corresponding to a potential density of 27.8 kg/m3 is calculated by interpolation. Subsequently, taking into account the average water depth at each grid point, the thickness of the overflow layer at each grid point is determined. Multiplying the thickness of the overflow layer by the area of the grid yields the overflow water volume for that specific grid. Finally, the storage volume of overflow waters in the Nordic Sea is obtained by summing the overflow water volume across all grids within the Nordic Sea (the sum range is enclosed by the red dashed line in Figure 1).
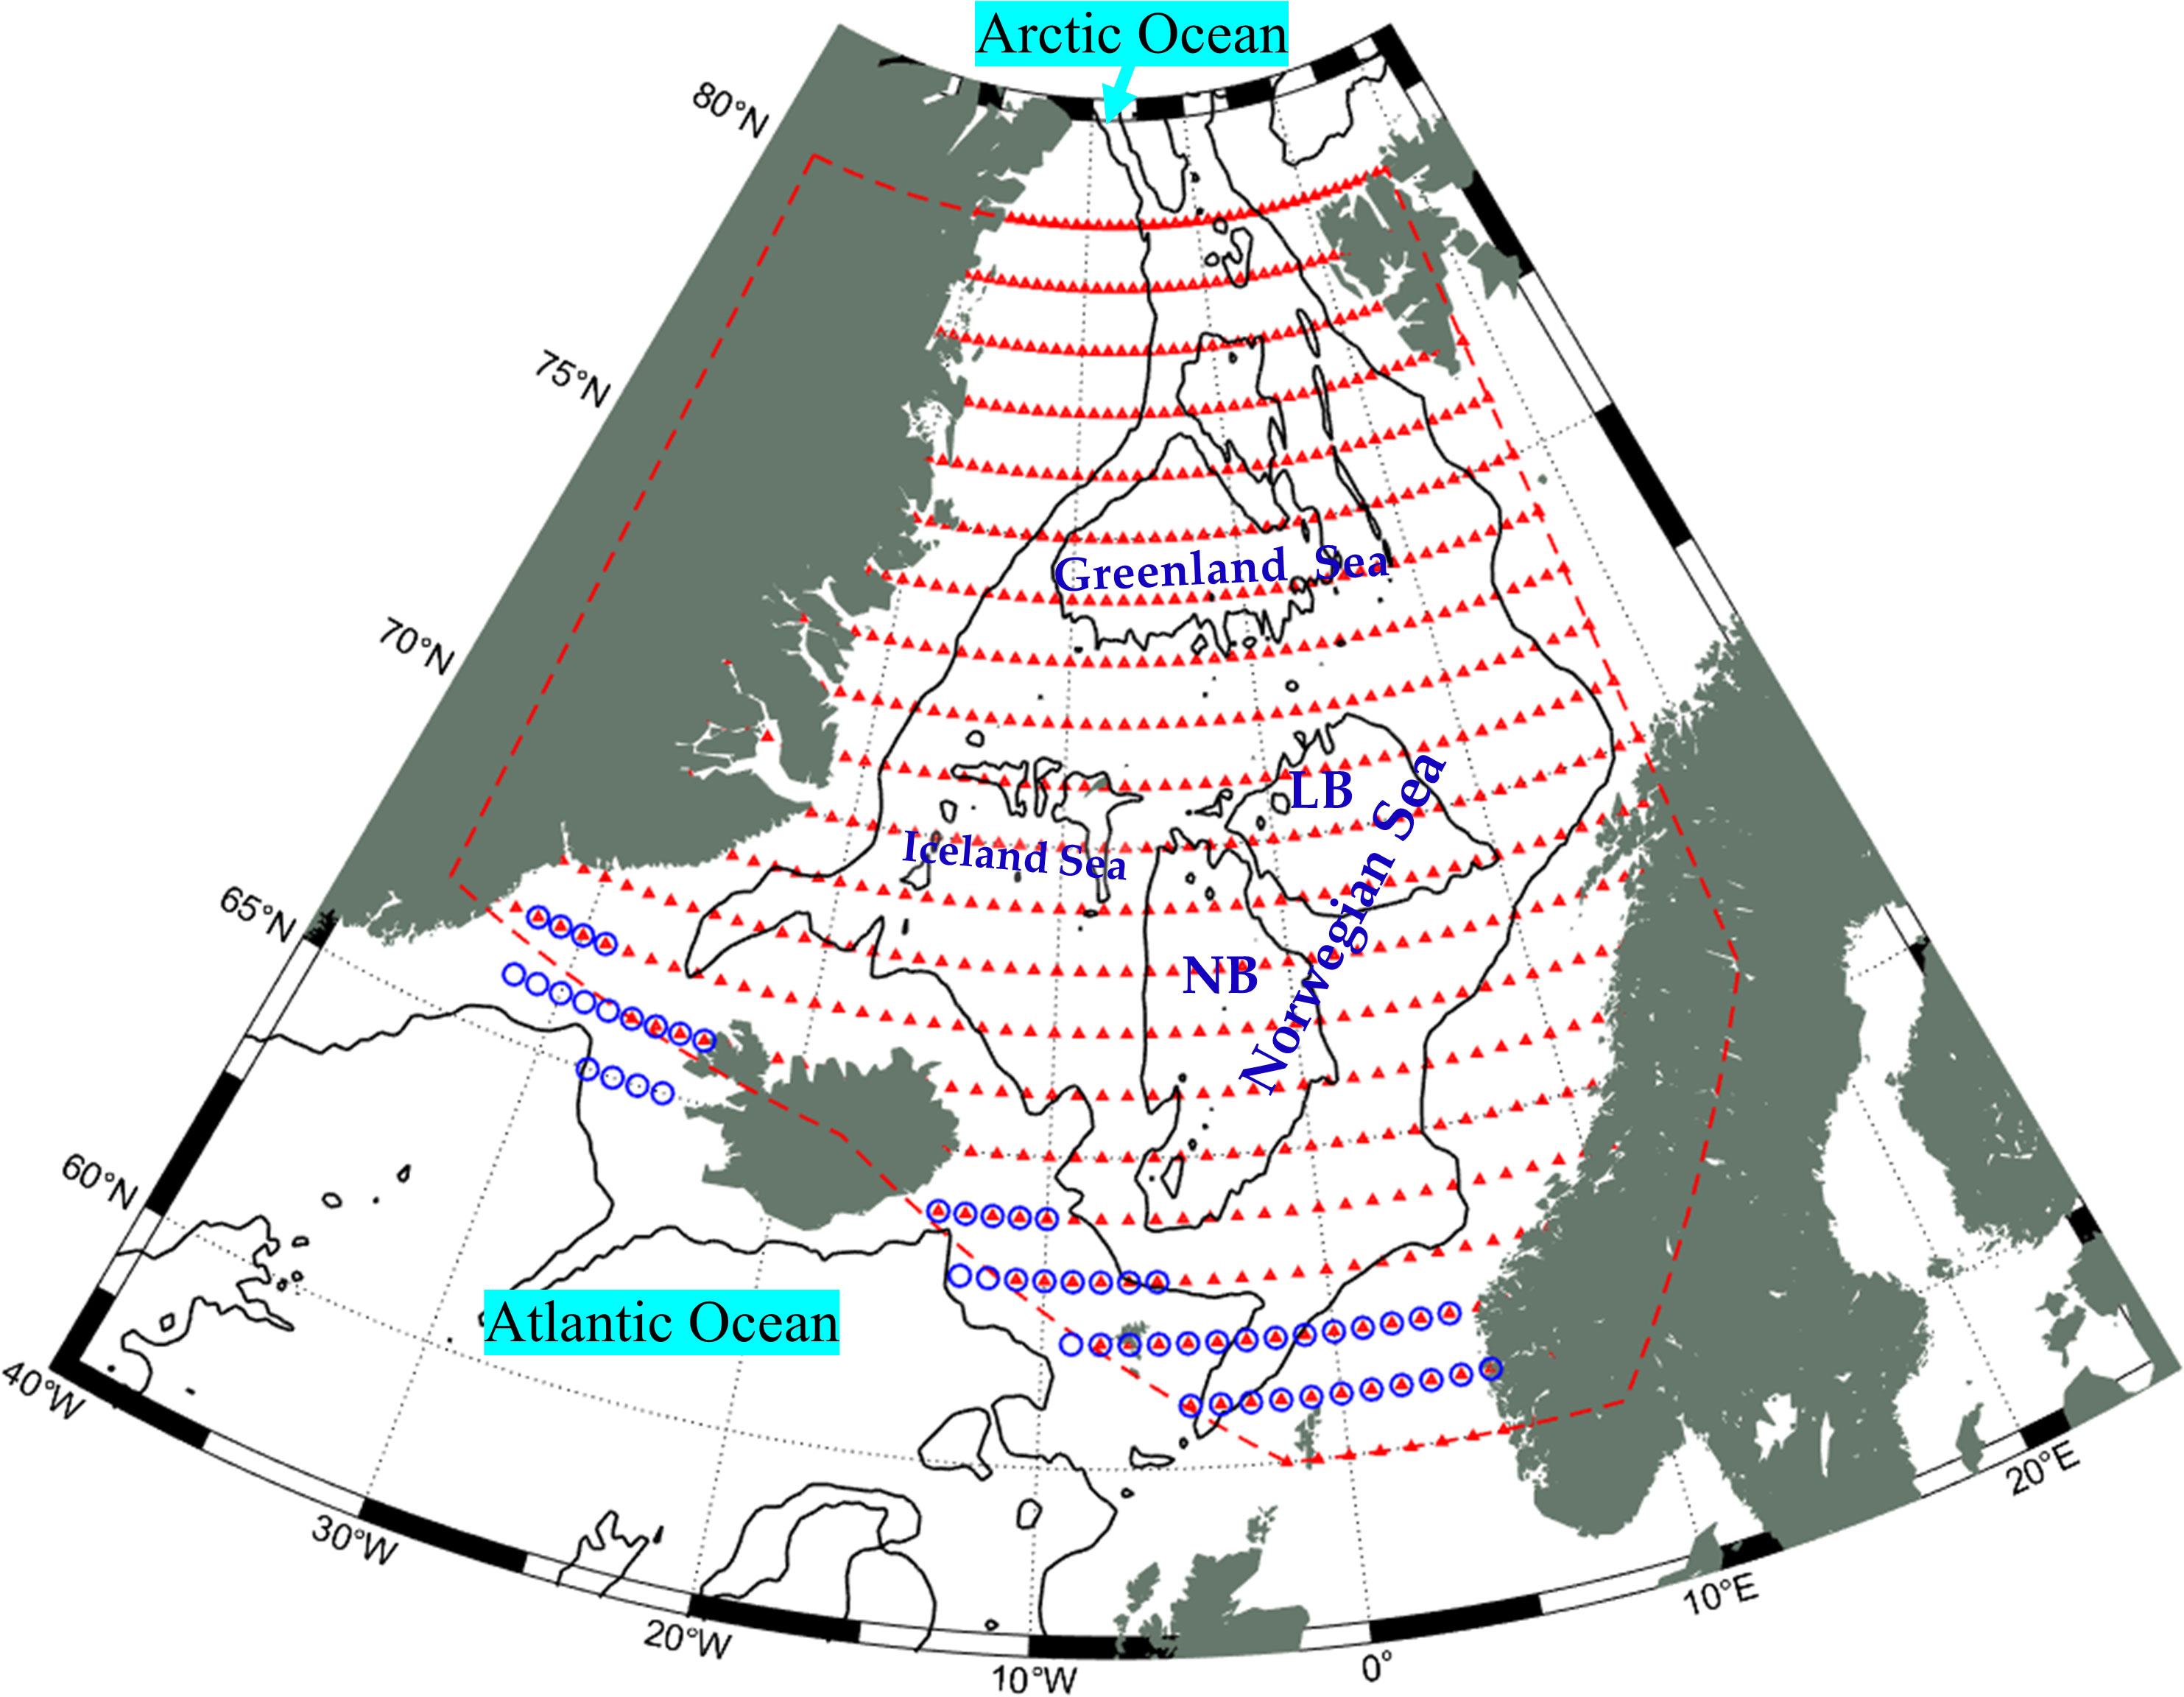
Figure 1 Topographic map of the Nordic Sea and EN4 data (red small triangles). Note: The Nordic Sea is composed of the Norwegian Sea, the Icelandic Sea and the Greenland Sea. In the Norwegian Sea, LB stands for the Lofoten Basin and NB stands for the Norwegian.
When calculating the storage volume of overflow waters, it is important to consider the discontinuous vertical stratification and uncertainty in ocean temperature and salinity of EN.4.2.2, as they can introduce errors. The vertical layering of EN4 data is uneven. For water depths below 110m, the layer thickness is 10m. In the water depth range of 110m to 315m, the layer thickness increases from 12m to 40m. Beyond 315m, the layer thickness rapidly increases from 60m to 150m. In the area shallower than 800m, there are 25 layers with varying thicknesses: 5m, 15m, 25m, 35m, 45m, 56m, 66m, 77m, 87m, 98m, 110m, 122m, 135m, 149m, 166m, 185m, 207m, 235m, 271m, 315m, 373m, 447m, 541m, 657m, 800m, 968m. To estimate the vertical error of each layer, we consider it to be half the thickness of the layer where the water with a potential density of 27.8 kg/m3 is located. The average variation amplitude, calculated as maximum and minimum difference, caused by the layer thickness of the annual average overflow water is 5.15×10⁴ km3, which corresponds to approximately 4% of the storage volume of overflow waters. Consequently, the average calculation error resulting from the layer thickness is approximately 2% of the overflow water volume. Given its relatively small magnitude, this error can be disregarded.
In addition, the EN.4.2.2 is assimilated by multiple measured data, introducing uncertainty errors in the ocean temperature and salinity of each grid point and layer (Good et al., 2013). Variations in ocean temperature and salinity can affect the calculated density, consequently impacting the estimation of the Nordic Sea overflow volume. To account for data uncertainty and obtain the maximum value of the Nordic Sea overflow volume, the density can be calculated by adding the temperature uncertainty errors to the ocean temperature and subtracting the salinity uncertainty errors from the salinity. Conversely, the minimum value of the Nordic Sea overflow volume can be obtained. Figure 2 illustrates the annual variation of calculation errors in the Nordic Sea overflow volume caused by uncertainty in ocean temperature and salinity. The average variation amplitude, calculated as maximum and minimum difference, caused by temperature uncertainty of the annual average overflow water is 1.35×10⁵ km3, which accounts for approximately 10.7% of the storage volume of overflow waters. This suggests that the temperature uncertainty has a significant impact on the calculation of overflow water volume, with an average calculation error of approximately 5.3%. The combined error from ocean temperature and salinity uncertainty reaches approximately 10% of the overflow water volume.
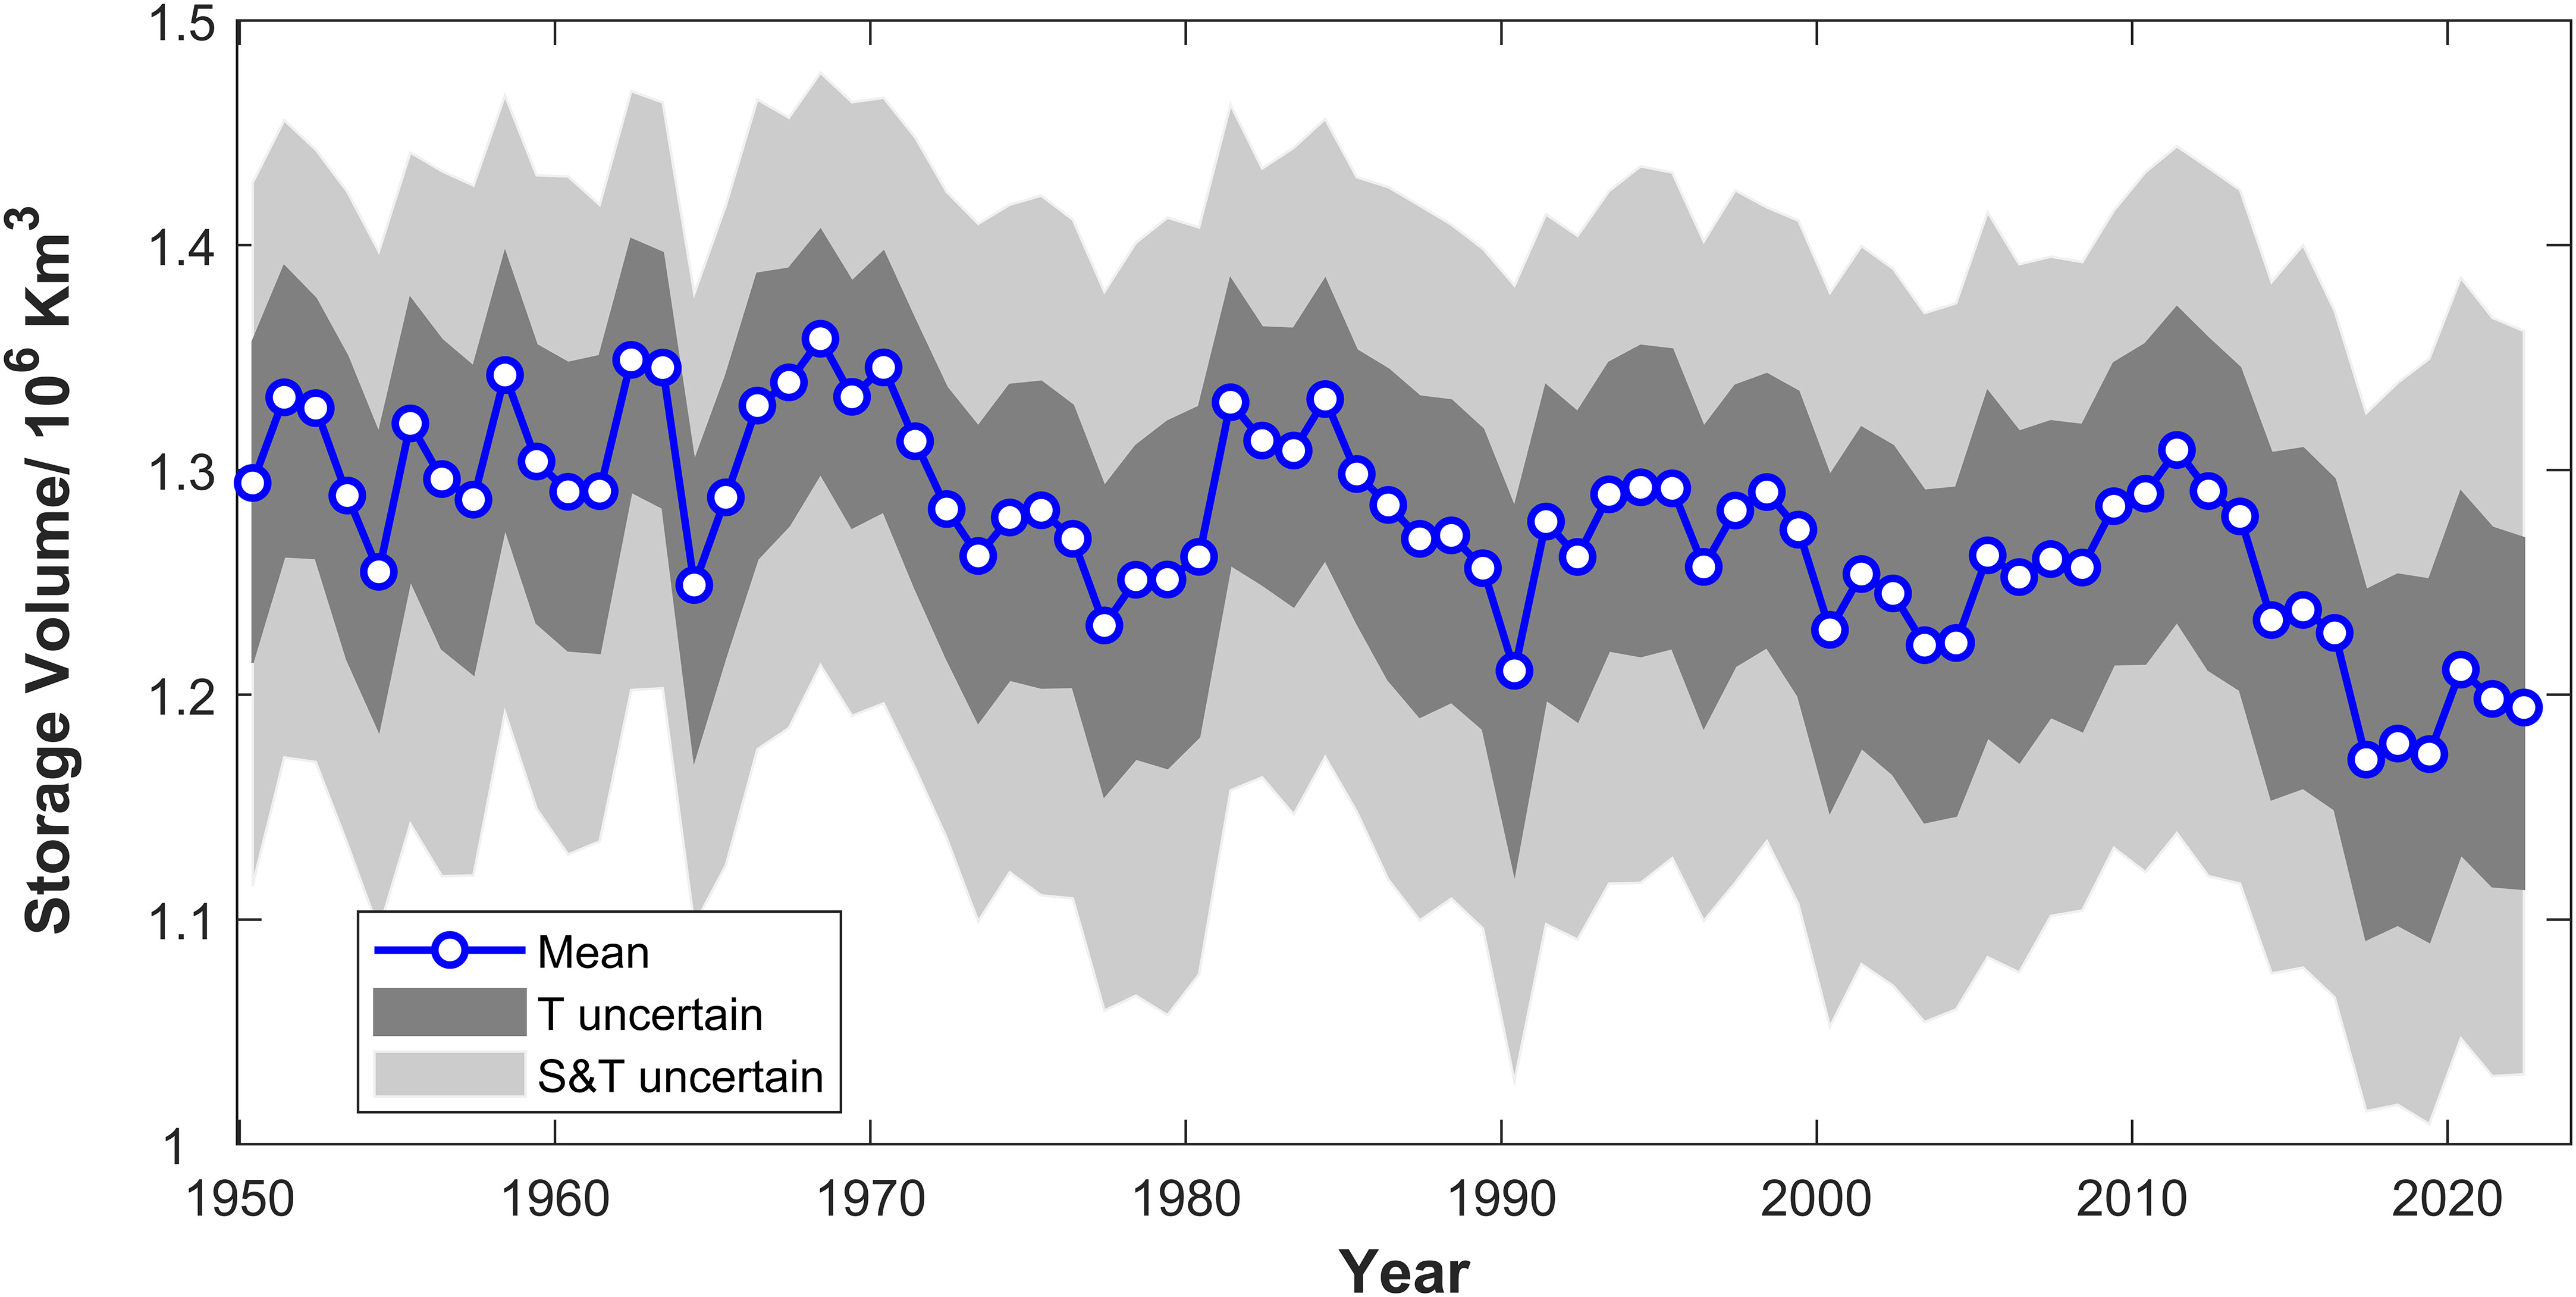
Figure 2 Annual variation of calculation errors in the Nordic Sea overflow volume caused by uncertainty in ocean temperature and salinity.
3 The change in the storage volume of the Nordic Seas Overflows
3.1 Temporal variation of the storage volume of the Nordic Seas Overflows
The storage volume of the overflow water exhibits seasonal variations (Figure 3), with seasonal fluctuations of approximately 10% around the average overflow. Spring experiences higher overflow, while autumn sees less. This phenomenon may be attributed to the seasonal generation of overflow water in the Nordic Seas, with high-density overflow water generally occurring in winter.
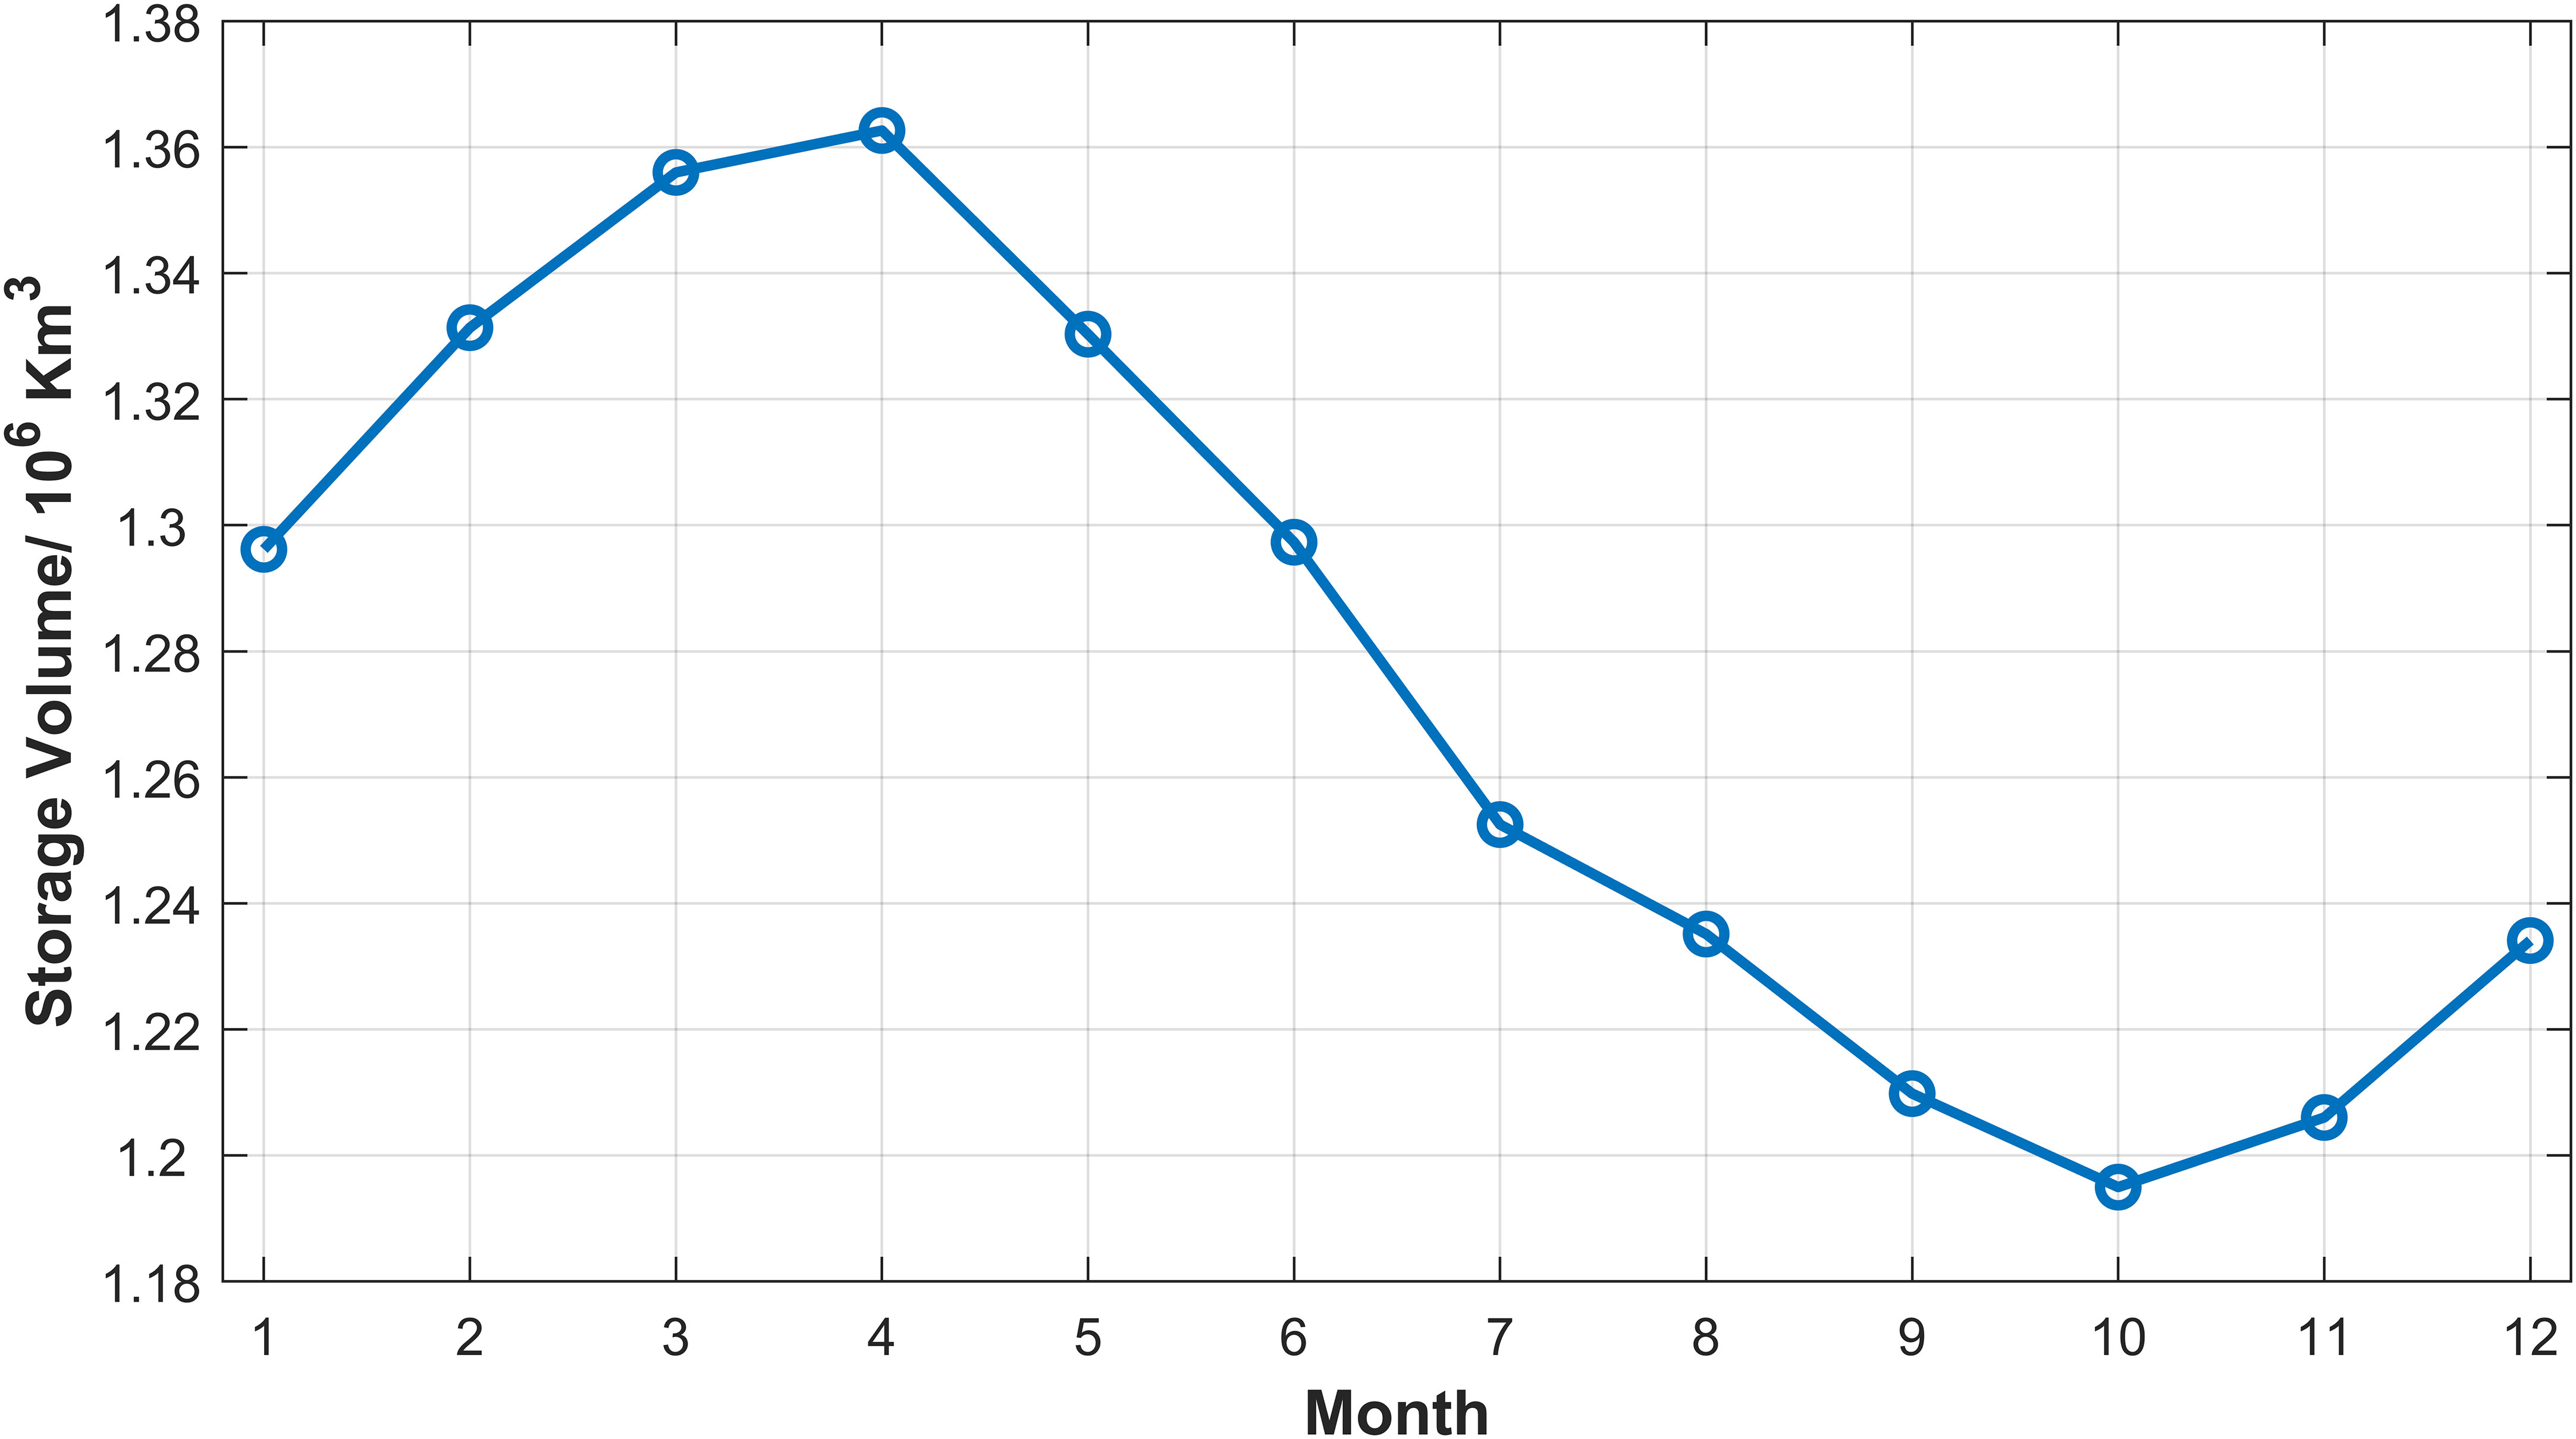
Figure 3 The seasonal variation of the storage volume of the Nordic Seas overflows.
The volume transport of the Denmark Strait (DS) overflow does not display significant seasonal variation, with a seasonal fluctuation amplitude of less than 0.2Sv (1Sv (sverdrup) = 106 m3s-1). This accounts for only 5% of the total fluctuation amplitude (Jochumsen et al., 2012). When comparing the volume transport of overflow water across the three channels in the Nordic Seas, only the Faroe Bank Channel (FBC) exhibits significant seasonal fluctuations, accounting for approximately 8% of the total fluctuation energy, with the highest volume transport occurs during summer. Observations indicate that the total volume transport of overflow water in the Nordic Seas is approximately 5 Sv, with half of this passing through DS and 1/3 passing through FBC (Hansen and Østerhus, 2007). Therefore, the seasonal fluctuation characteristics of the volume transport of overflow water in the Nordic Seas are not significant. However, during winter, there is a continuous generation of overflow water, which leads to the maximum storage volume of overflow water in April under the accumulation. In contrast, no overflow water is generated during summer. As a result, under continuous overflow conditions, the storage volume of overflow water in the Nordic Seas significantly decreases, reaching its minimum in October.
Based on Figure 4, the storage volume of the Nordic Seas overflows has shown a downward and fluctuating trend from 1950 to 2022. Analyzing the interdecadal change of the overflow water volume, it can be noted that the downward trend from the 1950s to the 1980s was not significant. However, since the 1980s, the average volume per decade has consistently decreased. The storage volume of the Nordic Seas overflows decreased from 1.29×10⁶ km3 in the 1980s to 1.25×10⁶ km3 in the 2010s. In recent years, the storage volume dropped to 1.20×10⁶ km3, indicating a decrease of approximately 7% of the overflow water volume. Besides, from the data quality of EN.4.2.2, there are more observation data after the 1980s. Therefore, this paper primarily focuses on analyzing the storage volume of Nordic Seas overflows after the 1980s. The annual average storage volume of Nordic Seas overflows from 1980 to 2022 was linearly fitted, resulting in a calculated descent speed of (-2.1 ± 0.7)×103 km3/a, which passed the 95% confidence test. The analysis of the datasets revealed that the average storage volume of overflow water in the Nordic Sea during this period was approximately 1.26×10⁶ m3. Based on this, the total relative change trend in the last 43 years can be estimated to be -7.2 ± 2.6%.
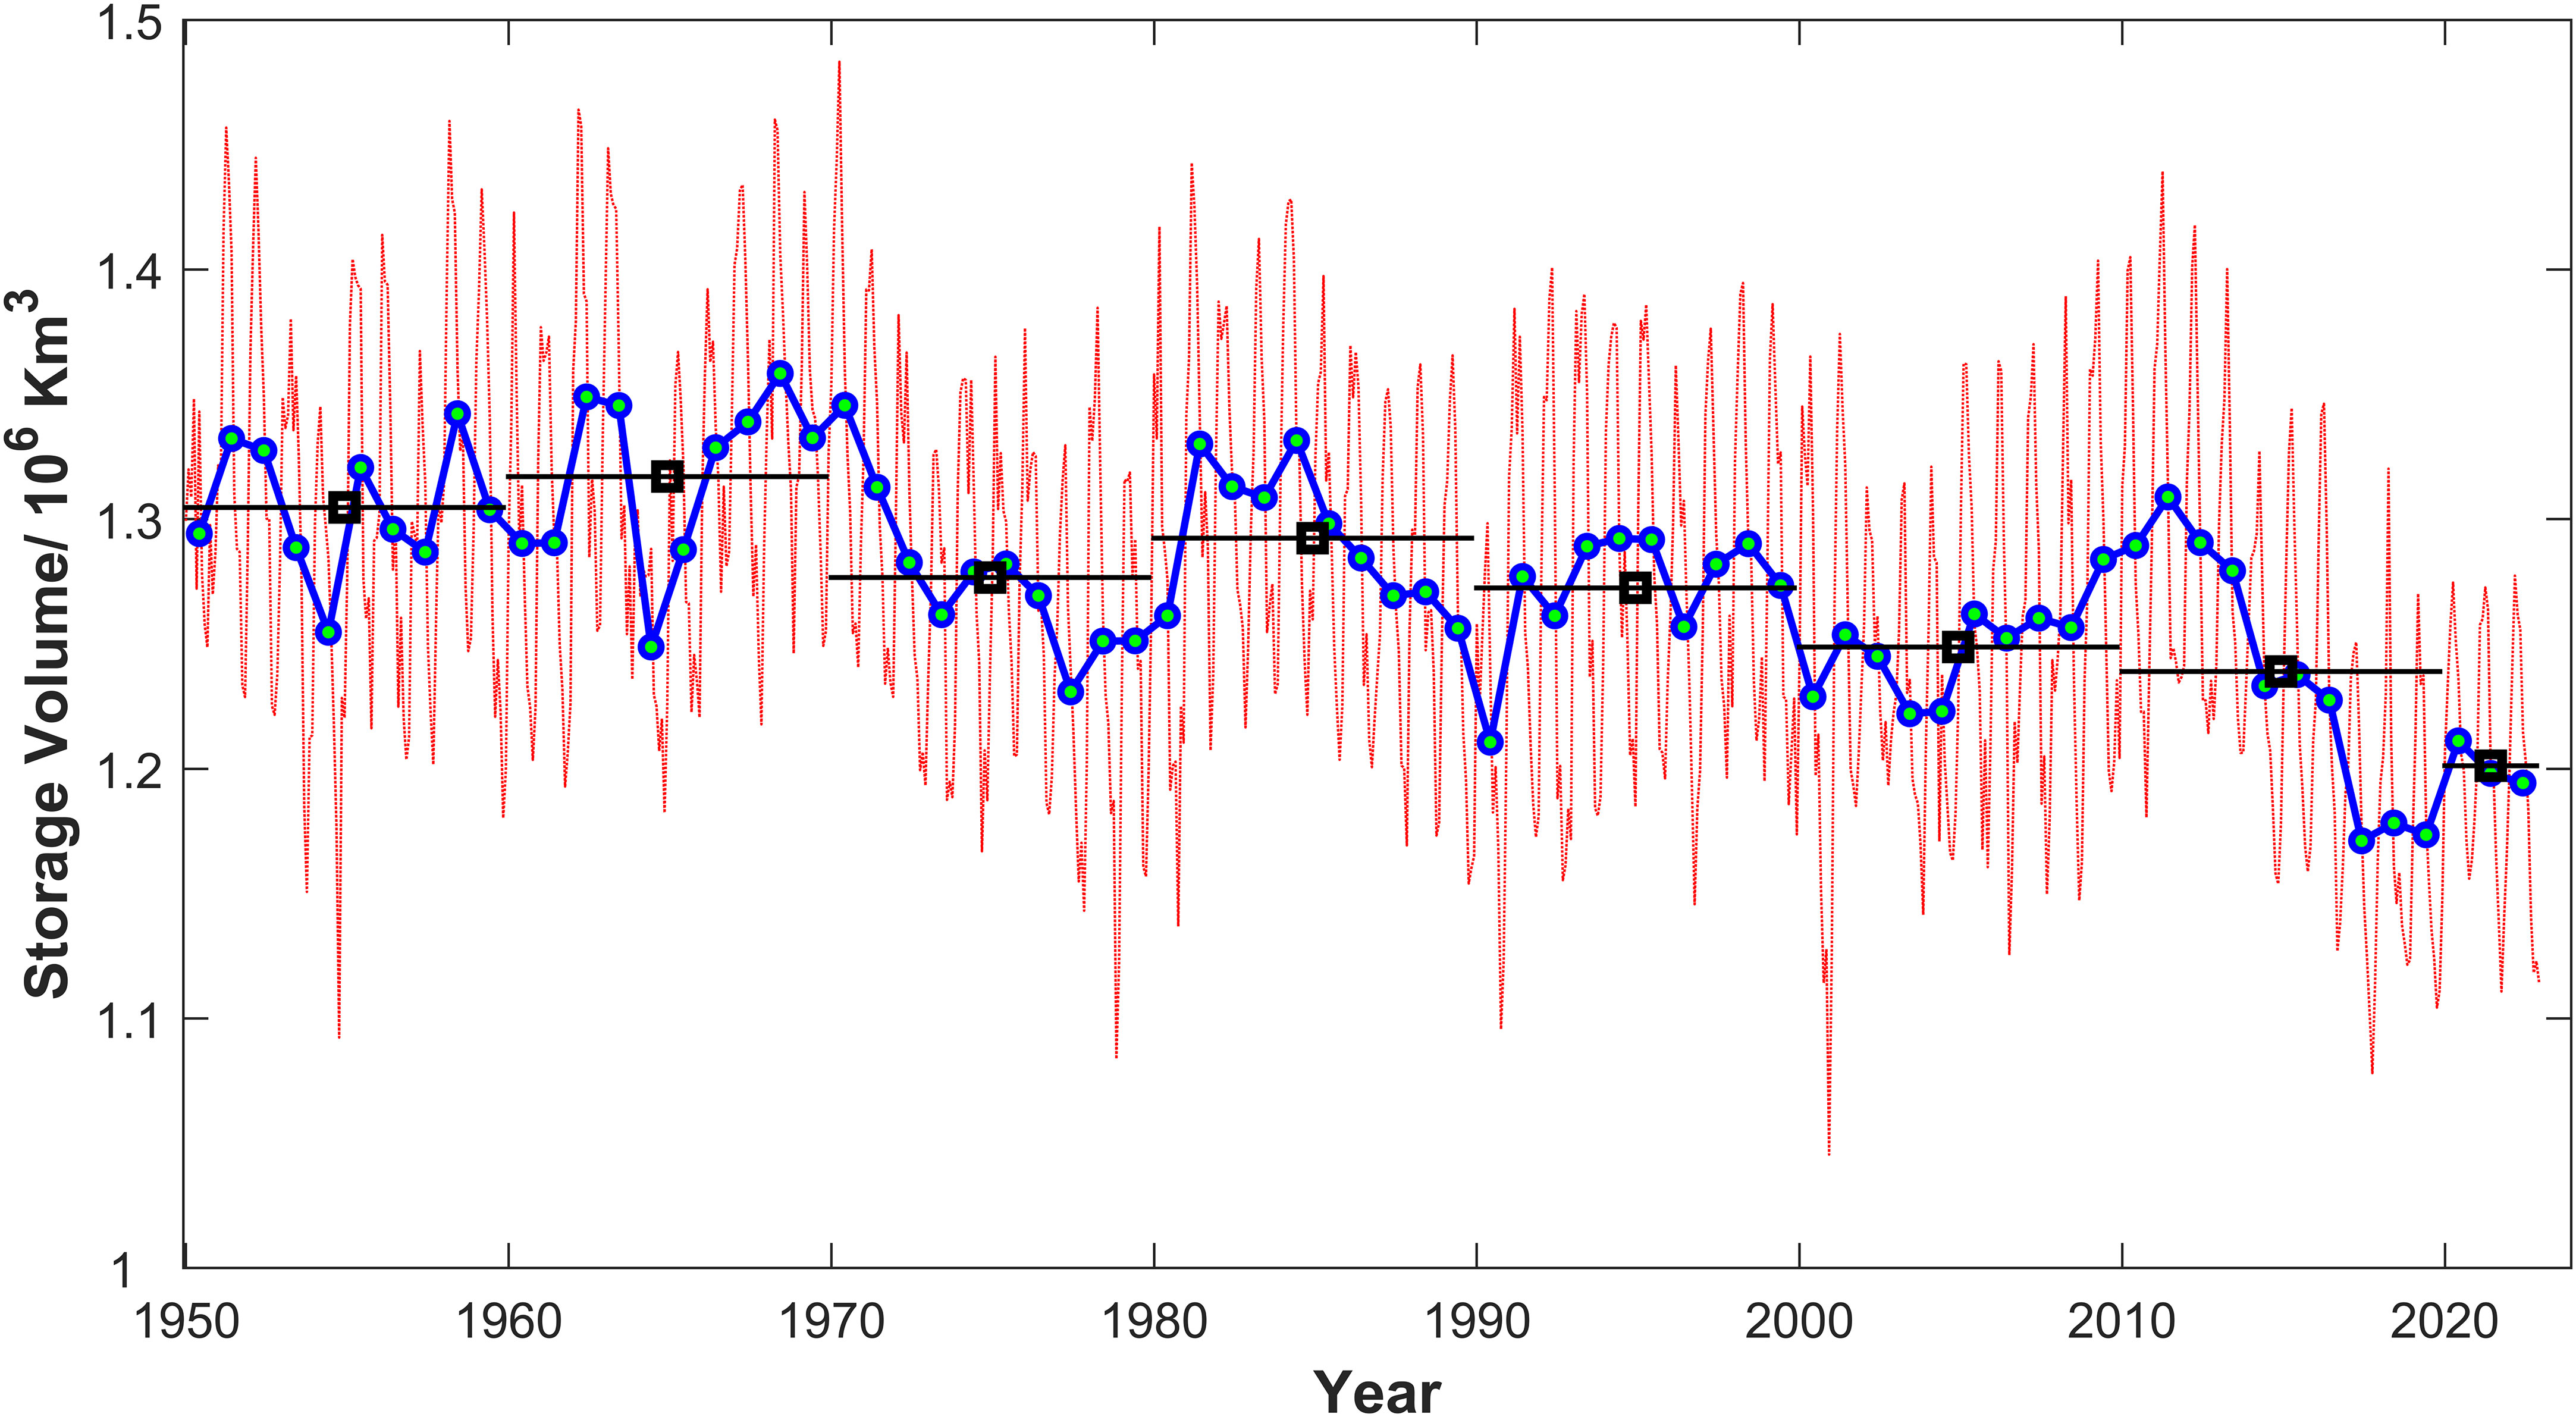
Figure 4 Time series and trends of the storage volume of the Nordic Seas Overflows. The red dashed line represents the monthly average data; The blue line represents the curve after removing seasonal changes; The green dots represent the annual average data; The black line represents the result of the age average.
However, it can be found from Section 2.2 that the errors caused by layer thickness account for approximately 2.0% of the overflow water volume and the collective error resulting from the uncertainty in ocean temperature and salinity amounts to approximately 10%. As a result, the vertical resolution, temperature uncertainty, and salinity uncertainty inherent in the EN4.2.2 data can lead to a potential error in the calculated overflow volume of ±12%. This indicates that the margin of error significantly surpasses the observed decrease, which may or may not actually exist. Further validation of this downward trend is necessary after accumulating additional data.
Additionally, there was a notable decrease in the volume of overflow water in the Nordic Seas from 2011 to 2022. From the initial volume of 1.31×10⁶ km3 in 2011, the storage volume decreased to around 1.17×10⁶ km3 in 2018, and then followed by a subsequent rise to 1.20×10⁶ km3 in 2020. The overall decrease during this period amounted to approximately 8.4%. Notably, from 2018 to 2022, the annual average volume of overflow water in the Nordic Seas was lower than the minimum annual average volume between 1950 and 2018, indicating a discernible trend of accelerated decline. A similar pattern was observed from 1985 to 1995, wherein the volume of overflow water experienced a brief and rapid decrease followed by an increase. Consequently, the rapid decline observed in the past decade may represent a short-term fluctuation and may not persist in the future. It is possible that overflow water storage volume will demonstrably increase in the coming years, reverting to the long-term pattern of gradual decline.
3.2 Spatial variation of the storage volume of the Nordic Seas Overflows
The density of 27.8 kg/m3 defines the upper limit of the overflow layer. Figures 5A, B depict the depth of the upper limit of the overflow layer in the Nordic Seas during the 1980s and the last 12 years (2010-2022), respectively. The depth of the upper limit of the overflow layer in the Greenland Sea and the Icelandic Sea is 0m, indicating that the density of surface seawater exceeds 27.8 kg/m3. Compared to the depth of the upper limit of the overflow layer during the 1980s and the last 12 years, the depth in the Lofoten Basin has shown a significant increase, suggesting a decrease in the density of the upper layer.
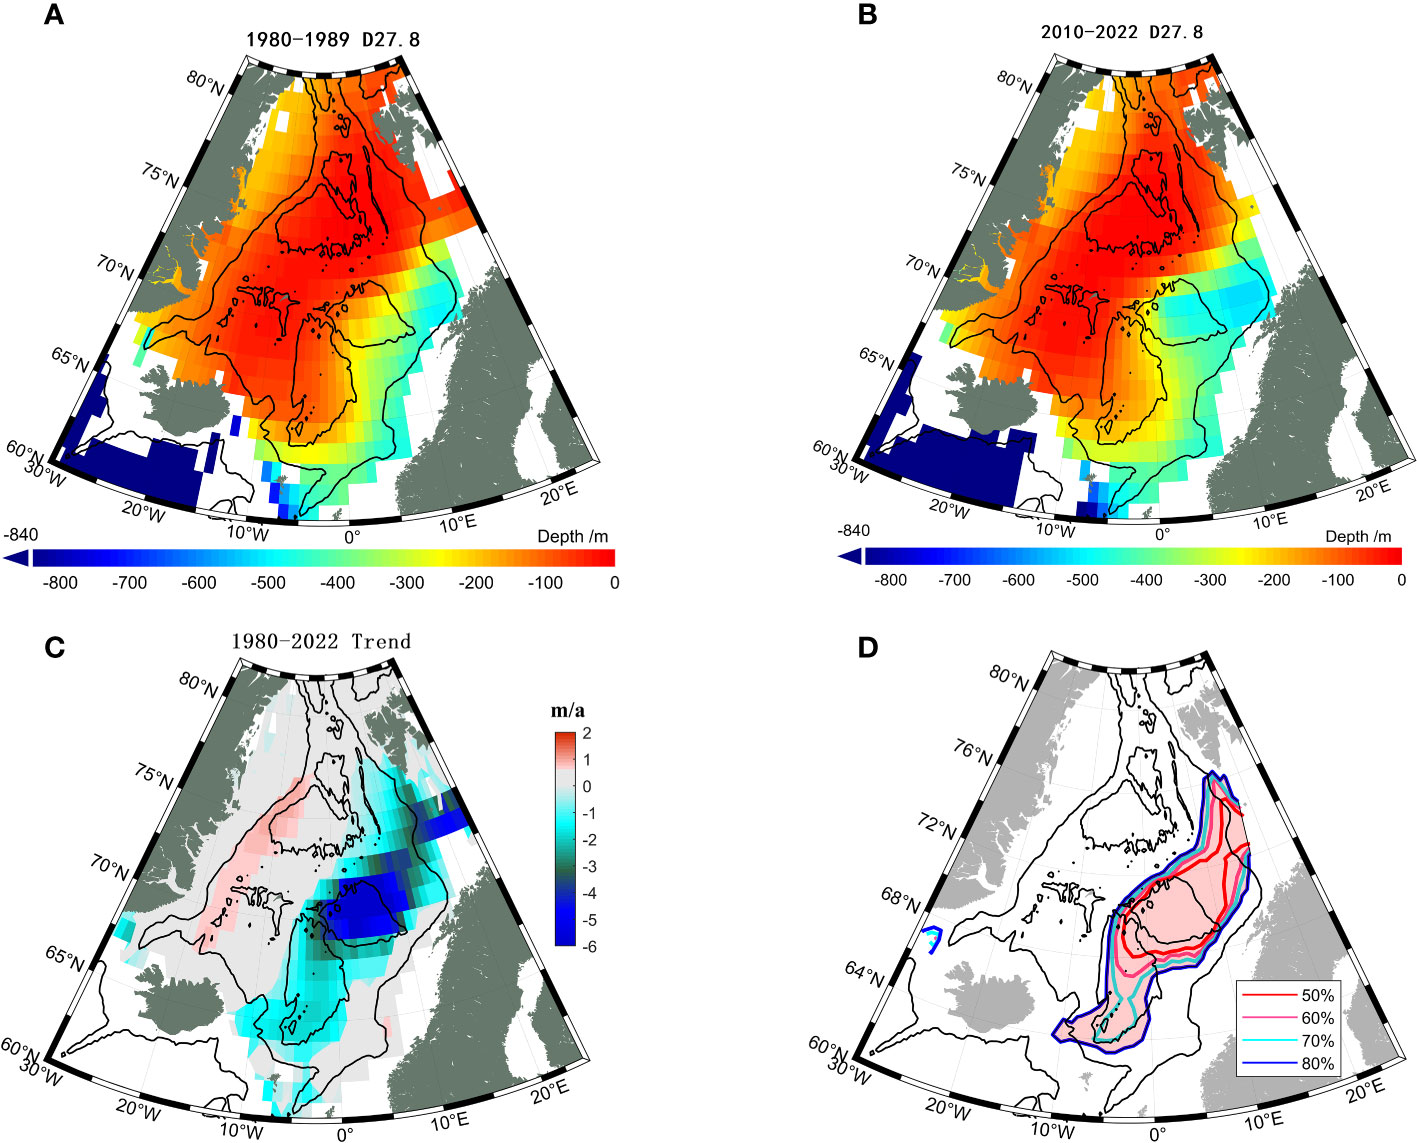
Figure 5 The spatial distribution of the change of the overflow layer in the Nordic seas. Spatial distribution of the depth of the upper limit of the overflow layer in the Nordic Seas for 1980–2004 (A) and 2004–2014 (B), and change rate of the overflow layer thickness above 840m in the Nordic Seas (C). The cumulative contribution of extreme values to the magnitude of change rate (D). The trend was obtained through direct linear fitting of monthly mean data. The black lines in this and subsequent spatial distribution figures represent 1000 and 3000 m bathymetrical contour lines.
The Norwegian Sea, representing 37% of the total area of the Nordic Seas, has experienced an 80% decrease in the storage volume of overflow water, of which the reduced storage volume of the Lofoten Basin contributes 50%. The storage volume of the Lofoten Basin and surrounding areas (red area in Figure 5D) decreased by 70%, accounting for 27% of the Nordic Seas area. These areas, including the Lofoten Basin and surrounding areas, play a significant role in the stagnation of the average sea level rise in the Nordic Seas. Therefore, they are defined as the core area responsible for the reduced storage volume of overflow water.
Figures 5A, B reveal the rate of change in the overflow layer thickness and the cumulative contribution of extreme values to this rate. The average change rate of the depth of the upper limit of the overflow layer in the Nordic Seas is -1.3m/a (Figure 5C), indicating a decrease in the storage volume of overflow water. The descent speeds for areas with 80%, 70%, 60%, and 50% decreases in the storage volume are greater than 0.32m/a, 0.59m/a, 0.82m/a, and 1.10m/a, respectively. The Norwegian Sea region accounted for 80% of the reduction in the storage volume of overflow water in the Nordic Seas, with the Lofoten Basin and its surrounding areas (areas shaded red in Figure 5D) experiencing the most significant decline. Despite the areas of the Norwegian and Lofoten Basins comprising only approximately 27% of the total area of the Nordic Seas, they contributed to approximately 70% of the reduction in the storage volume of overflow water. Consequently, these two basins were the main regions contributing to the reduction in the storage volume of overflow water.
4 Analyzing the reasons for the potential decrease in overflow water storage volume
The reduction in the depth of the upper limit of the overflow layer in the Nordic Seas indicated a decrease in the density of the upper seawater. The changes in the seawater density of the upper layers primarily result from variations in ocean temperature and salinity. To quantitatively analyze the contribution of ocean temperature and salinity to the density reduction, we calculated the linear rates of change for average ocean temperature and salinity at different depths in the core region. These linear change rates were then multiplied by the volume expansion coefficient and salinity compression coefficient, respectively. Figure 6A reveals that the increase in ocean temperature is the main factor behind the decrease in density of the upper seawater in the core region. The linear trends of ocean temperature, salinity and density over depth for the upper 840 m are shown in Figure 6B, which were calculated from the 1980–2022 time series data. To perform the calculation, we averaged the data within 50m layers in the upper 500 m and 100m layers from 500 to 840 m. The purplish-red line in Figure 6B represents the mean ocean temperature trend (0.014 K/a) for the depth range of 0–840 m. Notably, significant ocean temperature increases are observed in each layer at depths less than 550 meters. The surface layer exhibits the highest rate of ocean temperature rise, approximately 0.03K/a. Moreover, the ocean temperature rise rate gradually decreases with increasing depth, and no significant trend changes are observed at depths greater than 600 m. Most water layers do not show significant trend changes in salinity, and the amplitude of change is minimal. The rate of density change at different depths is relatively consistent with ocean temperature. Thus, the decrease in overflow water storage volume in the Nordic Seas from 1980 to 2022 is attributed to the rise in ocean temperature in the upper layer (0-600 meters) of the Lofoten Basin and the Norwegian Basin.
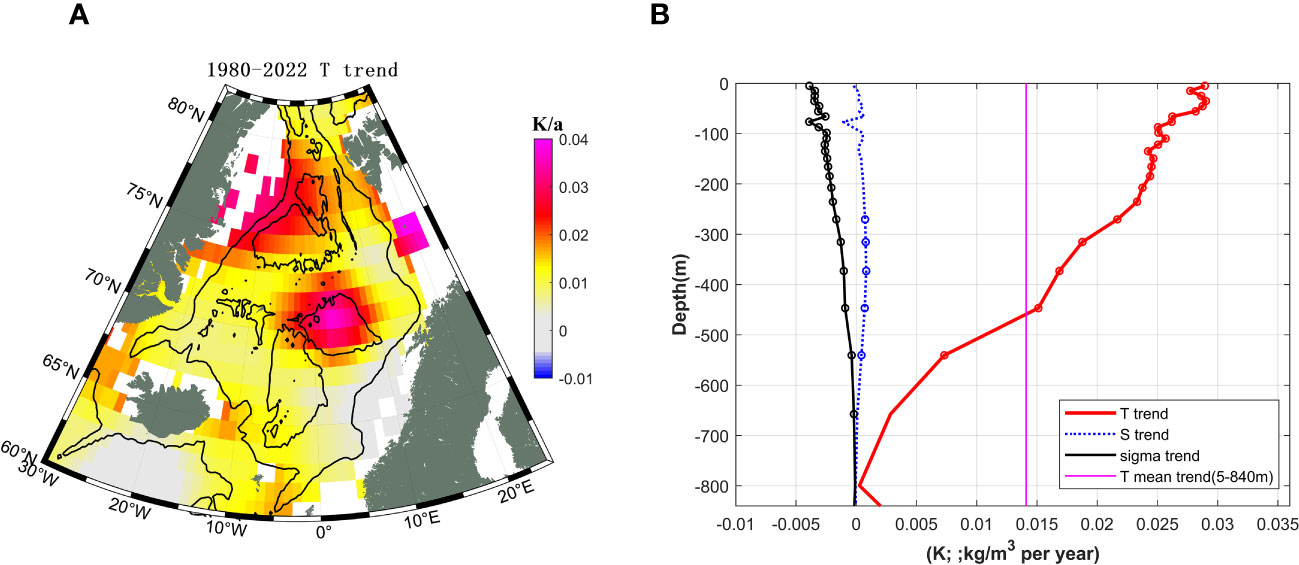
Figure 6 The spatial distribution of ocean temperature change rate for the upper 840 m, as calculated from the time series 1980–2022 (A). Profiles of ocean temperature, salinity and density trends for the Norwegian Sea (B).
The processes responsible for changes in the upper seawater include air-sea flux, lateral flux, and vertical flux within the ocean (Carvalho and Wang, 2020; Iakovleva and Bashmachnikov, 2021). Generally, vertical exchange is limited, and Figure 6 demonstrates that there are no significant alterations in water properties beyond a depth of 600m. Consequently, ocean temperature changes in the upper layer are minimally influenced by vertical flux within the ocean. Research indicates that the shallow waters of the Norwegian Sea, with depths shallower than 600m, are primarily influenced by local air-sea flux, southward Atlantic inflow, and western Arctic water from the Arctic Ocean (Rossby et al., 2009). The Lofoten Basin is predominantly impacted by the inflow of Atlantic water, with its upper layer being predominantly occupied by Atlantic water (Köhl, 2007). Conversely, the Norwegian Basin experiences direct influence from the cold and fresh water emanating from the Icelandic Sea, alongside the influence of warm Atlantic water (Curry and Mauritzen, 2005; Mork et al., 2014; Brakstad et al., 2023). On the western margin of the Nordic Seas, cold Arctic water flows southward with the East Greenland Current (EGC), constantly mixing with the returning Atlantic water. The majority of this water enters the western North Atlantic, but a fraction of this water flows directly back into the Norwegian Basin as the East Icelandic Current (EIC). Curry and Mauritzen (Curry and Mauritzen, 2005) highlighted that the Norwegian Sea would be affected by the cold Arctic water during periods of predominantly negative North Atlantic Oscillation (NAO) index and strong northerly winds. However, between 1993 and 2014, a strongly negative NAO occurred solely in 2010 without concurrent strong northerly winds (Mork et al., 2014), so the impact of the EIC on the Norwegian Sea was minimal. Furthermore, Figure 6A illustrates that the amplitude of ocean temperature increase in the Lofoten Basin surpasses that in the Norwegian Basin, suggesting a more pronounced influence of Atlantic inflow on the upper seawater in the Norwegian Sea. In summary, the Norwegian Sea primarily experienced the influence of the Atlantic inflow and demonstrated a lesser impact from the EIC from 1980 to 2022.
Focusing on the Atlantic inflow and air-sea flux, this paper discusses the mechanism of the ocean temperature rise of the upper layer in the Norwegian Sea and the reasons for the decrease in overflow water storage volume.
4.1 Effect of the air-sea flux
The air-sea heat flux is the sum of surface solar shortwave radiation, longwave radiation, and latent and sensible fluxes. The trends of the heat flux, SST and SAT (Surface Air Temperature) in the Nordic Seas from 1982 to 2022 calculated by ERA5 data are shown in Figure 7. The linear trend of the air-sea heat flux in most sea areas of the Nordic Seas was not statistically significant, except for some marginal sea areas, there was a downward trend in ocean heat dissipation (Figure 7A). As indicated in Appendix A, an increase in ocean temperature of 0.014K/a at depths shallower than 840m can be attributed to a growth rate of 1.51 W/(m2·a) in air-sea heat flux. However, there is no notable trend of air-sea heat flux in the Lofoten Basin, where the ocean temperature rises rapidly at 0.015K/a.
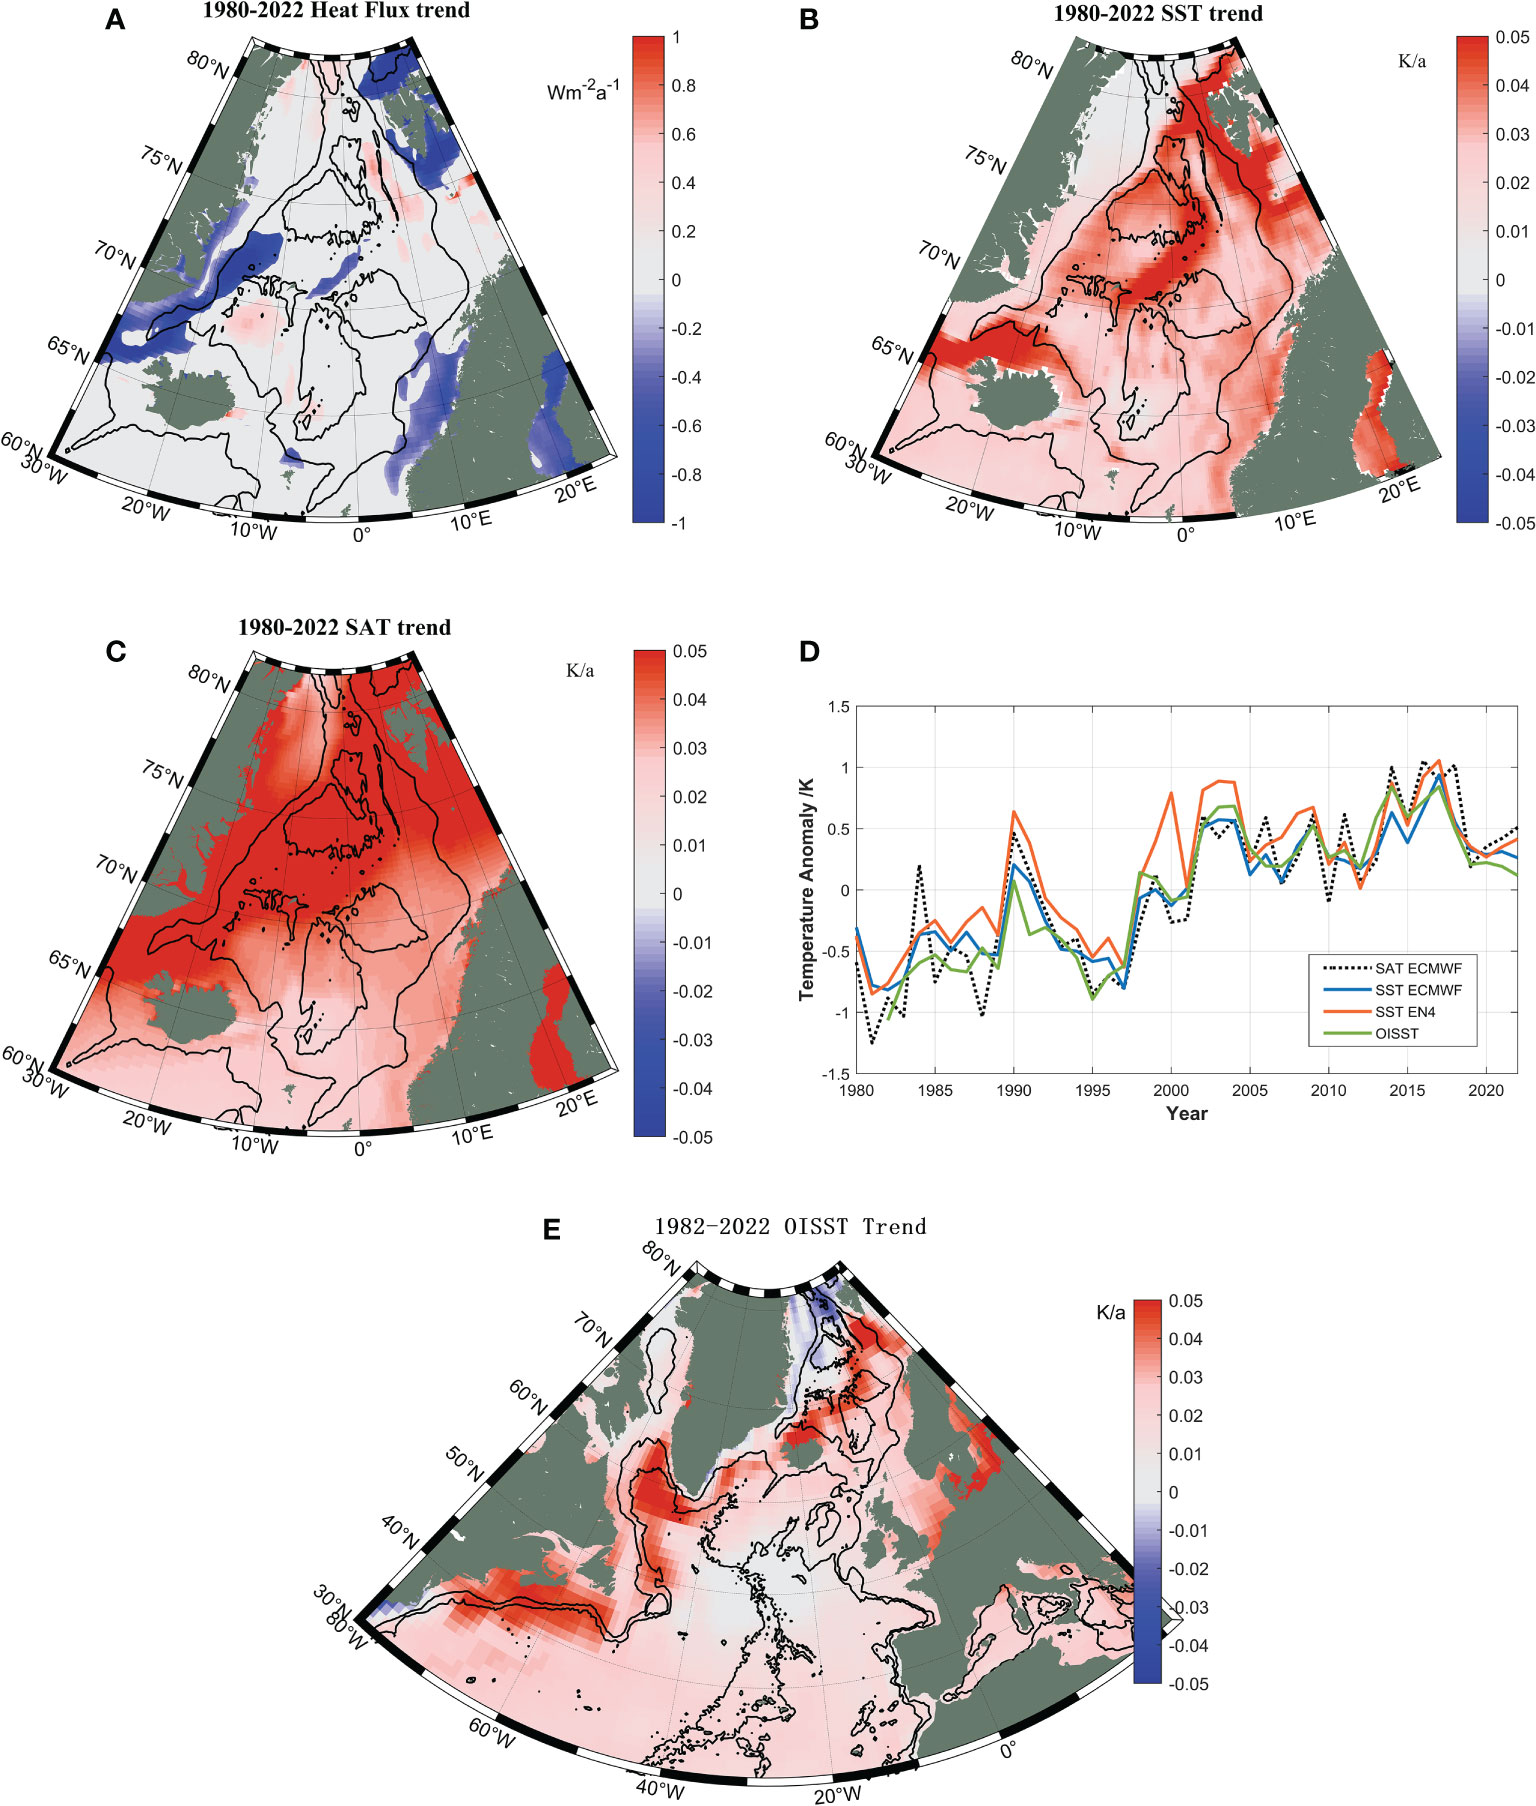
Figure 7 The trend of the heat flux, SST and SAT in the Nordic Seas from 1982 to 2022. (A) The heat flux trend, (B) SST trend and (C) SAT trend were calculated by ERA5 data. (D) Comparison of SST anomalies and SAT anomalies with those calculated by EN4.2.2 and OISST data. (E) SST change rate from 1982 to 2022 calculated by OISST data.
The ocean temperature anomalies derived from the ERA5, EN4.2.2 and OISST data all exhibit a significant increase in SST in the Nordic Seas, and the amplitudes of SST increase obtained from these three datasets are consistent. As shown in Figures 7B, C, the trends of SST and SAT calculated using ERA5 data in the Norwegian Sea are nearly identical. The mean trends of SST and SAT in the Norwegian Sea are estimated to be (3.08 ± 0.72)×10-2°C/a and (3.79 ± 1.03)×10-2°C/a, respectively. Given that air has lower density and specific heat capacity compared to the ocean, it is implausible for the temperature increase in the Norwegian Sea’s upper 600m to be driven solely by rising air temperature. The average air-sea heat flux in the Norwegian Sea from 1980 to 2022 is -224 W/m2, indicating that the ocean releases heat into the atmosphere. The increase in air temperature in the Norwegian Sea might be attributed to the increase in SST. However, it is worth noting that the increase in air temperature supports the elevation of SST.
In addition, the SST trend observed in the core area using ERA5 data aligns with that of EN4.2.2. The SST change rate from 1982 to 2022 calculated by OISST data can reach 0.05°C/a in the Norwegian Basin. As shown in Figure 7E, the region experiencing a significant SST increase in the North Atlantic correspond to warm current regions in the Atlantic Ocean. These findings suggest that the Atlantic inflow caused the rapid warming of the upper layer in the Norwegian Basin.
In brief, the available evidence does not support the hypothesis that the rapid warming of the upper layer water in the Norwegian Sea was caused by air-sea heat flux.
4.2 Effect of the Atlantic inflow
In the Norwegian Sea, there are two ways to alter the properties of upper seawater influenced by the high temperature and high salinity Atlantic inflow. One approach involves modifying the properties of the Atlantic inflow, while the other involves changing the overflow transport of the Atlantic inflow. Across the Iceland-Faroe-Shetland Channel, the high salinity Atlantic water entered the Nordic Seas. The time series of average ocean temperature and salinity for the Atlantic Inflow Water (AIW) and Norwegian Sea Upper Water (NUW) are shown in Figure 8. The AIW is identified as the water at the pink station (Figure 1), with a depth of less than 600m and salinity greater than 35.1 (Wang et al., 2015). The NUW refers to the water below 600m in the Norwegian Sea. The average ocean temperature ascending speed of the AIW is (1.2 ± 0.7)×10-2°C/a and that of the NUW is (2.3 ± 0.6)×10-2°C/a. Besides, the average salinity ascending speeds of the AIW and NUW are (-1.7 ± 4.8)×10-4 a-1 and (3.4 ± 8.2)×10-4 a-1 respectively, both of which fail to pass the 95% confidence test and there is no significant trend.
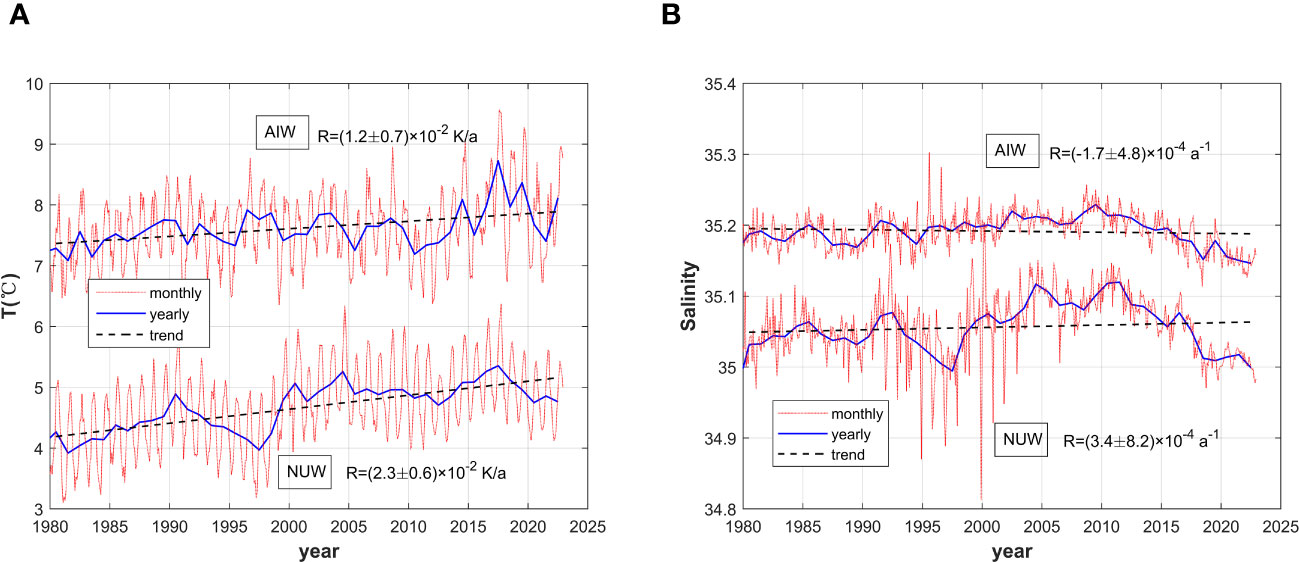
Figure 8 The observation stations of AIW and time series of average ocean temperature (A) and salinity (B) of the AIW and NUW.
The upper water of the Norwegian Sea is directly affected by the Atlantic inflow water, and the warming Atlantic inflow water is the primary factor behind the warming of the upper water in the Norwegian Sea. However, the warming AIW alone is insufficient to account for the warming of NUW. If the NUW heats up from the AIW, the volume of the Atlantic inflow should also increase significantly to contribute to the greater temperature rise of the NUW. Previous studies have indicated that the warming of the AIW is synchronized with the increase in the volume of the Atlantic inflow (Furevik and Nilsen, 2005; Mork et al., 2014; Tsubouchi et al., 2021). Furthermore, the ocean temperature of the Atlantic inflow is 3°C higher than that of the Norwegian Sea upper water (Figure 8). Therefore, although the warming amplitude of AIW is smaller than that of NUW, it has the potential to significantly warm the upper water in the Norwegian Sea through increased inflow transport.
Upon comparing Figures 4, 8, it is evident that the ocean temperature of NUW exhibited no significant trend from 2011 to 2022, while the salinity of NUW experienced a substantial decrease. Consequently, the noteworthy reduction in the overflow water storage volume in the Nordic Sea during this timeframe can be primarily attributed to the decline in the salinity of the upper water in the Norwegian Sea. Additionally, the salinity of AIW also notably decreased during this period. From 2011 to 2022, the AIW salinity declined from 35.21 psu to 35.14 psu, representing a decrease of 0.07 psu, while the NUW salinity decreased from 35.12 psu to 35.0 psu, denoting a decrease of 0.10 psu. Thus, it can be inferred that the substantial reduction in the Nordic Sea’s overflow water storage volume during this period was also predominantly influenced by the inflow from the North Atlantic.
5 The ongoing influence under future ocean warming
Increasing ocean temperature is among the most prominent aspects of the Earth’s climate change, with the average ocean temperature predicted to increase by +3°C by 2100 (IPCC, 2021). As the ocean temperature gradual increases, the density of the upper seawater decreases. In this study, HydroBase 2 was utilized to analyze the changes in the temperature of the overflow water in the upper seawater of the Nordic Seas in response to the rising ocean temperature.
The spatial distribution of the depth of the upper limit of the overflow layer in the Nordic Seas calculated by HydroBase 2 is shown in Figure 9, which correlates well with EN4.2.2 calculation results depicted in Figure 5B. The overflow water volume in the Nordic Seas calculated based on Hydrobase 2 is estimated to be 1.201×10⁶ km3, which is essentially equivalent to the estimate derived from EN4.2.2.
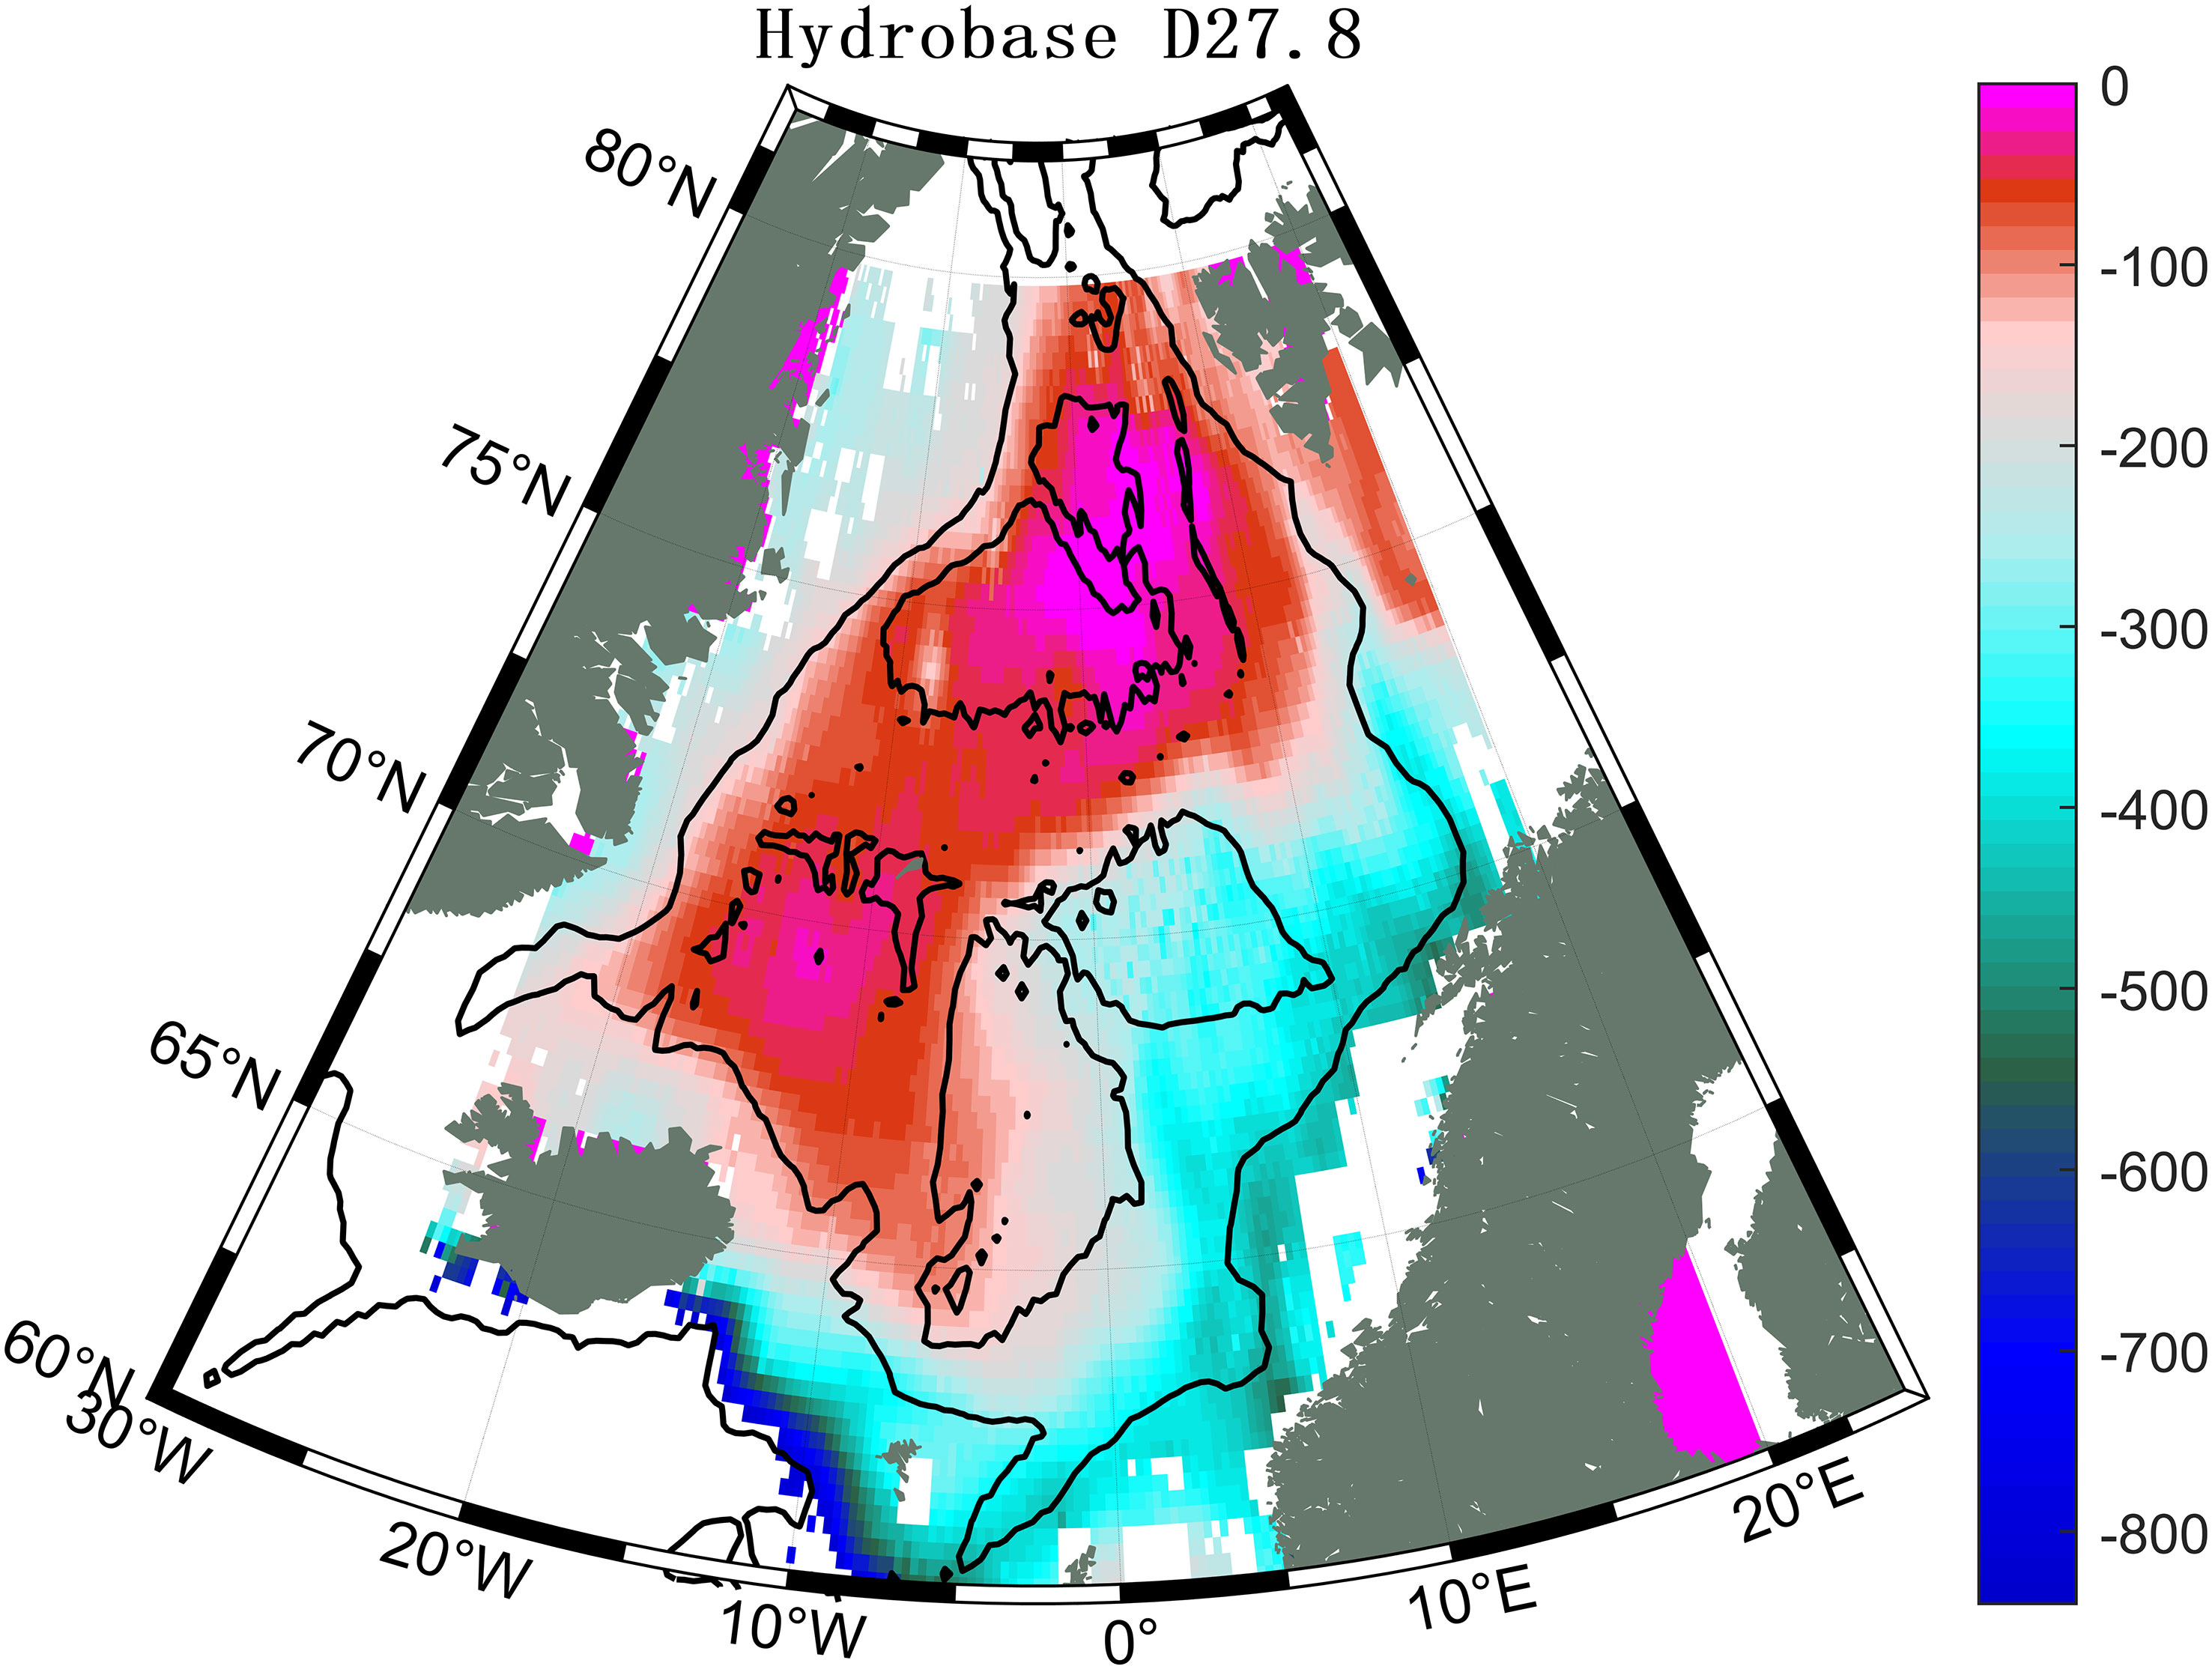
Figure 9 The spatial distribution of the depth of the upper limit of the overflow layer in the Nordic Seas calculated by HydroBase 2.
Figure 10 shows the changes in the overflow water volume under different warming amplitudes in the shallow water at depths less than 840m. The temperature rise step size is 0.2°C, with a total temperature rise of 6°C, and the change curve of overflow water volume under different increasing temperatures is obtained. As shown in Figure 10, the decrease in overflow water volume is not linear as the ocean temperature increases. When the ocean temperature increases by 1°C, the overflow water volume decreases to 86% of the total volume. In addition, when the ocean temperature increases by 2°C, 2.8°C and 3.2°C, the overflow water volume decreases to 70%, 51%, and 37%, respectively. When the ocean temperature increases by 4°C, the overflow water volume decreases to 0. Therefore, the descent curve is not linear and shows an accelerating trend with the increasing ocean temperature.
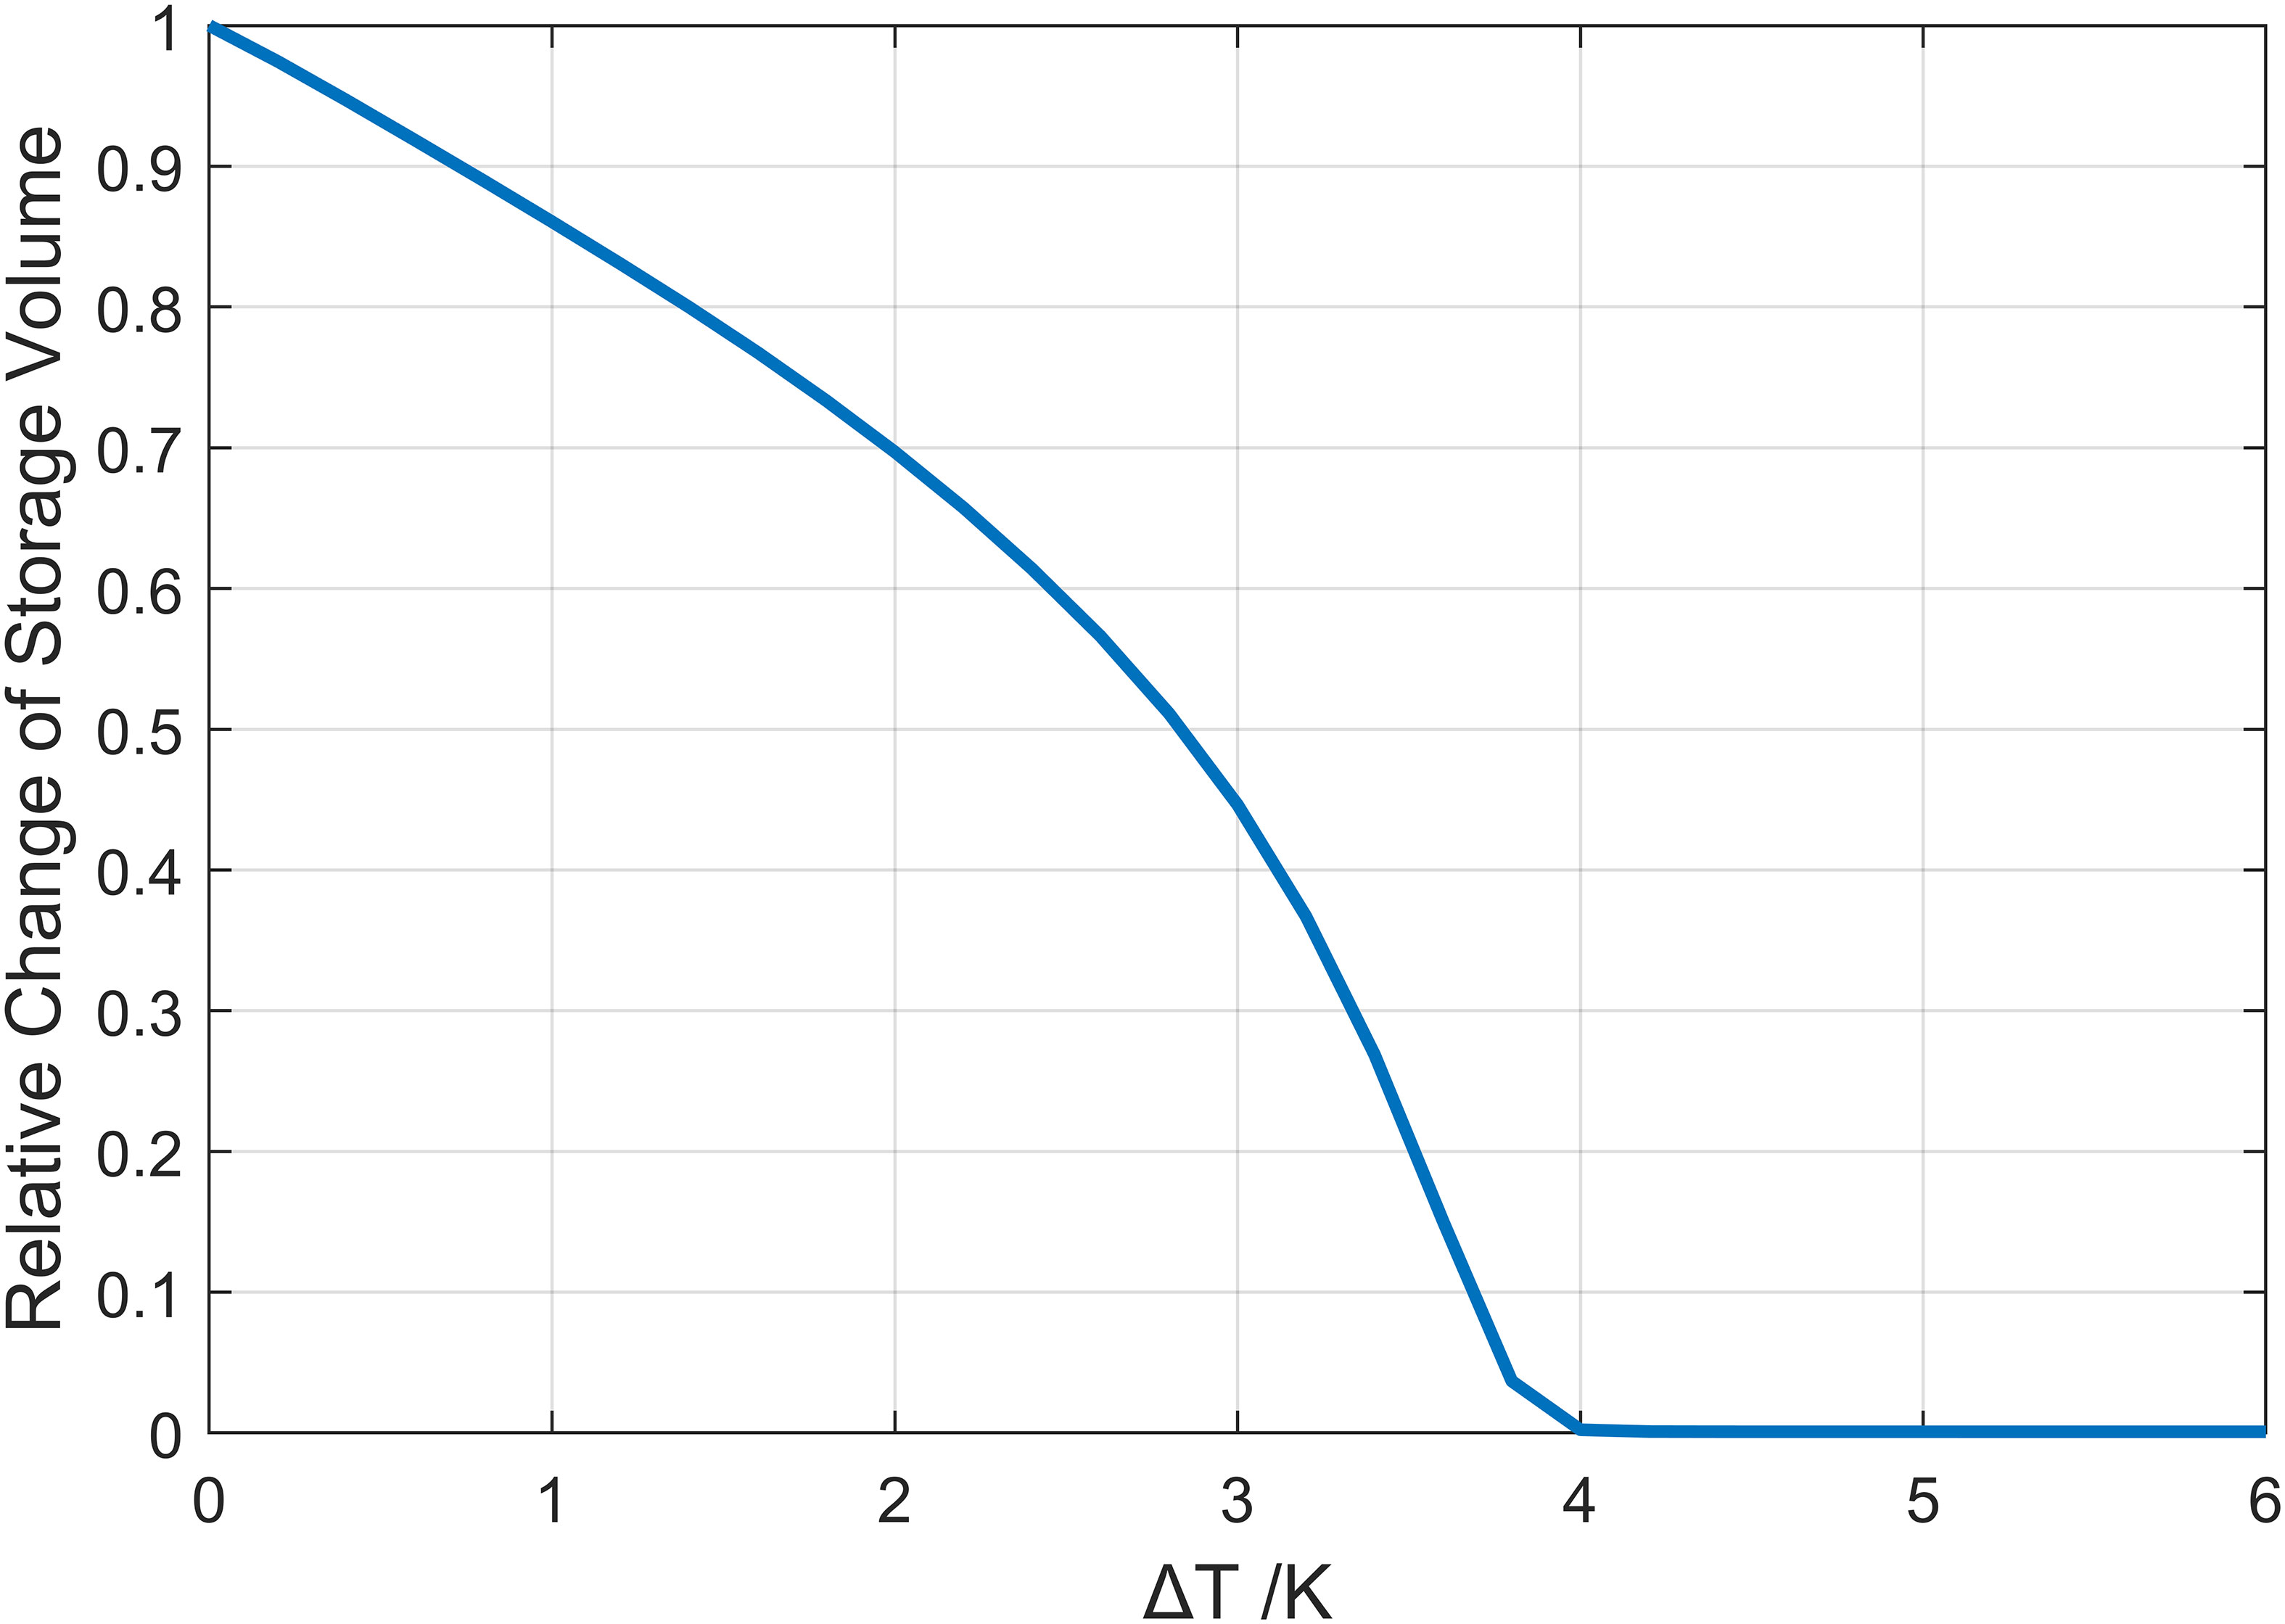
Figure 10 Changes in the overflow water volume under different warming amplitudes in the shallow water (depth<840m).
The changes in the depth of the upper limit of the overflow layer in the Nordic Seas under different warming amplitudes are shown in Figure 11. The Lofoten Basin exhibits the most substantial decrease in overflow water volume, indicating a faster decline compared to other areas under the same warming scenarios. With a 1°C increase in ocean temperature, the upper limit of the overflow layer in the Lofoten Basin experiences a 300m decrease, while the decrease in overflow water volume is comparatively smaller in the Icelandic Sea and the Greenland Sea. The rapid decline of the overflow water volume in the Lofoten Basin is related to the specific characteristics of the upper ocean temperature and salinity structure. The decrease of 10% of the overflow water volume corresponds to a 0.8°C increase in ocean temperature, which is consistent with the warming amplitude of the Lofoten Basin.
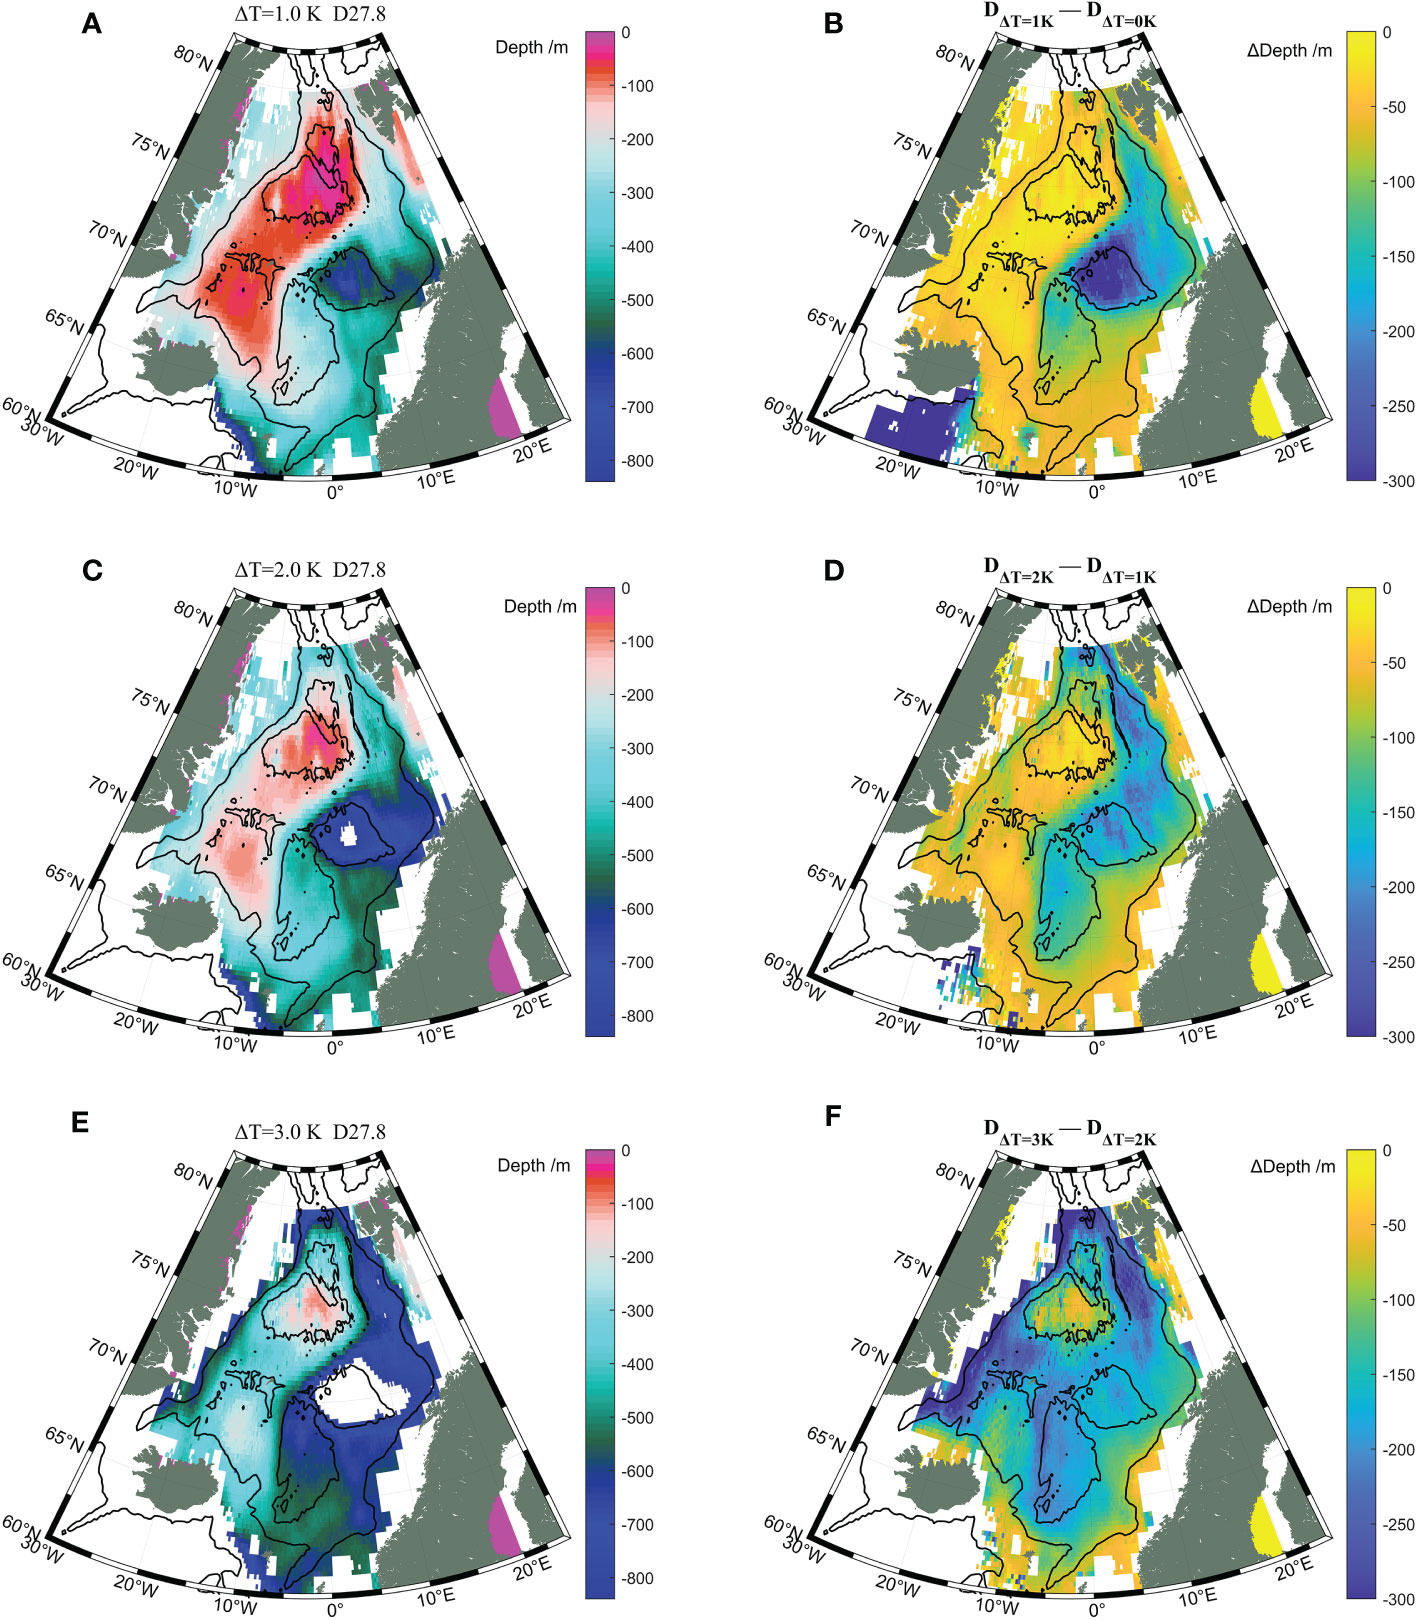
Figure 11 The depth of the upper limit of the overflow layer in the Nordic Seas under different warming amplitudes of (A) 1.0K, (C) 2.0K and (E) 3.0K. The changes of the upper limit of the overflow layer between (B) 1K and 0K, (D) 2K and 1K, (F) 3K and 2K. K is the Kelvin temperature, and its variation is equal to that of Celsius temperature.
With a 2°C increase in ocean temperature, the overflow water volume in the Norwegian Sea decreases significantly, while the decrease in overflow water volume remains less pronounced in the Icelandic Sea and the Greenland Sea. As the ocean temperature rises by 3°C, the overflow water volume in the Nordic Seas, excluding the Greenland Sea, experiences a substantial reduction, and the depth of the upper limit of the overflow layer in the Lofoten Basin drops below 840m, indicating a complete absence of overflow water in that region. Therefore, it is necessary to focus on the changes in the overflow water storage volume of the Lofoten Basin in the future.
6 Conclusions
Based on the EN4.2.2 reanalysis data, a 73-year time series was constructed, encompassing monthly, annual, and decadal averages of the overflow water storage volume in the Nordic Sea from 1950 to 2022. Subsequently, the time series was used to extract the multiscale temporal variation characteristics of the overflow water storage volume in the Nordic Sea. Upon analyzing the monthly average data, it is evident that the storage volume of the overflow water demonstrates seasonal variations, exhibiting fluctuations of approximately 10% around the average overflow. Specifically, spring months show higher overflow, while autumn months exhibit lower levels.
The decline of the overflow water storage volume is particularly notable from 1980 to 2022. Since the 1980s, there has been a steady decrease in the decadal average overflow water storage volume. The annual average storage volume of overflow water in the Nordic Seas during the period from 1980 to 2022 was linearly fitted, revealing a calculated significant descent speed of -2.1×10³ km3/a. The overall relative change in the past 43 years is estimated to be -7.2 ± 2.6%. However, the average error in the calculated overflow water storage volume, due to vertical discontinuities, ocean temperature uncertainties, and salinity uncertainties in the EN4 data, amounts to approximately 12%. The findings indicate that the long-term declining trend lacks significance, necessitating further research for validation. If the long-term downward trend persists, moreover, the reduction in overflow water is primarily concentrated in the Norwegian Sea, particularly in the Lofoten Basin, which is the core area of the decrease in overflow water. The increase in the ocean temperature of the upper layer of the Lofoten Basin is the main factor contributing to the decrease in the overflow water storage volume.
To discuss the mechanism of the increase in the ocean temperature of the upper layer in the Norwegian Sea, the effects of the Atlantic inflow and air-sea flux on the overflow water were analyzed using the ERA5 and OISST data. There is no significant trend of air-sea heat flux in the Lofoten Basin, where the ocean temperature rises rapidly. The rise rates of SST and SAT in the Norwegian Sea are almost equal and existing evidence does not support that the rapid warming of the upper layer water in the Norwegian Sea was caused by air-sea heat flux. Besides, although the warming amplitude of Atlantic inflow water is smaller than that of the Norwegian Sea upper water, increased inflow transport can cause significant warming in the Norwegian Sea upper water.
The overflow water storage volume in the Nordic Sea has exhibited a more rapid decline from 2011 to 2022. Specifically, the annual average storage volume in the Nordic Sea between 2018 and 2022 have been lower than the historical minimum values. This short-term rapid reduction is primarily attributed to declining upper-layer salinity in the Norwegian Sea, aligning with reduced salinity in the Atlantic inflow. This observation further underscores the substantial influence of the Atlantic inflow on the overflow water stock in the Nordic Sea.
As the ocean temperature of the Nordic Seas increases in the future, the overflow water volume in the Lofoten Basin will first decrease and disappear at the earliest. Besides, the overflow water volume in the Nordic Seas does not decrease linearly with increasing ocean temperature but has an accelerating trend. When the ocean temperature increases by 4°C, the overflow water volume in the Nordic Seas will decrease to 0. When the overflow water volume in the Nordic Seas disappears, the depth of the upper limit of the overflow layer will be greater than the depth of the overflow channel. The overflow in the Nordic Seas may become unstable, similar to the current overflow in the Iceland-Faroe Ridge, and will exhibit significant fluctuations forced by wind stress. It is also possible that there may be less dense overflow water. Whether the overflow flow will decrease or the density of overflow water will decrease, both are manifestations of the weakening of the overflow in the Nordic Seas. The long-term downward trend identified in this study cannot be definitively confirmed due to limitations in the quality of current ocean data. Nonetheless, as a significant component of the Atlantic meridional overturning circulation, the reduction in overflow in the Nordic Seas will inevitably impact the global circulation system and warrants careful consideration.
In summary, understanding the trend of the storage volume of the Nordic Seas Overflows is crucial for understanding climate patterns, predicting impacts on weather and ecosystems, and studying oceanic processes. Monitoring and studying these overflows help us better comprehend and address the complex dynamics of the Earth’s climate system. It is hoped that the potential long-term reduction trend of overflow water storage volume derived from this study, as well as the accelerated reduction expected from continued warming in the future, will capture the attention of stakeholders.
Data availability statement
The original contributions presented in the study are included in the article/supplementary material. Further inquiries can be directed to the corresponding author.
Author contributions
WS: Funding acquisition, Methodology, Software, Validation, Writing – original draft. MX: Validation, Writing – review & editing. XL: Validation, Writing – review & editing.
Funding
The author(s) declare financial support was received for the research, authorship, and/or publication of this article. This research was funded by the National Natural Science Foundation of China, grant number 41806219, the Central Guidance on Local Science and Technology Development Fund of Dalian City (“Research on marine dynamic in-situ monitoring technology for risk warning of coastal nuclear power cold source blockage risk in Dalian”).
Acknowledgments
We acknowledge all the reviewers for their valuable suggestions.
Conflict of interest
The authors declare that the research was conducted in the absence of any commercial or financial relationships that could be construed as a potential conflict of interest.
Publisher’s note
All claims expressed in this article are solely those of the authors and do not necessarily represent those of their affiliated organizations, or those of the publisher, the editors and the reviewers. Any product that may be evaluated in this article, or claim that may be made by its manufacturer, is not guaranteed or endorsed by the publisher.
References
Bönisch G., Blindheim J., Bullister J. L., Schlosser P., Wallace D. W. R. (1997). Long-term trends of temperature, salinity, density, and transient tracers in the central Greenland Sea. J. Geophys. Res. Oceans. 102, 18553–18571. doi: 10.1029/97JC00740
Brakstad A., Gebbie G., Våge K., Jeansson E., Ólafsdóttir R. (2023). Formation and pathways of dense water in the Nordic Seas based on a regional inversion. Prog. Oceanogr. 212,102981. doi: 10.21335/NMDC
Caesar L., Rahmstorf S., Feulner G. (2020). On the relationship between Atlantic meridional overturning circulation slowdown and global surface warming. Environ. Res. Lett. 15, 024003. doi: 10.1088/1748-9326/ab63e3
Carvalho K. S., Wang S. (2020). Sea surface temperature variability in the Arctic Ocean and its marginal seas in a changing climate: Patterns and mechanisms. Glob. Planet. Change. 193, 103265. doi: 10.1016/j.gloplacha.2020.103265
Chang C.-W. J., Chao Y. (2000). A comparison between the world ocean atlas and hydrobase climatology. Geophys. Res. Lett. 27, 1191–1194. doi: 10.1029/1999GL002379
Chen X. Y., Tung K. K. (2014). Varying planetary heat sink led to global-warming slowdown and acceleration. Science 345, 897–903. doi: 10.1126/science.1254937
Crease J. (1965). The flow of Norwegian Sea Water through the Faroe bank channel. Deep-Sea Res. Oceanogr. Abstracts. 12, 143–150. doi: 10.1016/0011-7471(65)90020-3
Curry R. (2001). HydroBase 2: A database of hydrographic profiles and tools for climatological analysis 81. Woods Hole Oceanographic Institute. Available at: http://www.whoi.com/science/PO/hydrobase/.
Curry R., Mauritzen C. (2005). Dilution of the northern north Atlantic ocean in recent decades. Sci. (1979) 308, 1772–1774. doi: 10.1126/science.1109477
Dong B., Sutton R. T. (2005). Mechanism of interdecadal thermohaline circulation variability in a coupled ocean–atmosphere GCM. J. Clim. 18, 1117–1135. doi: 10.1175/JCLI3328.1
Eldevik T., Nilsen J.E.Ø., Iovino D., Anders Olsson K., Sandø A. B., Drange H. (2009). Observed sources and variability of Nordic seas overflow. Nat. Geosci. 2, 406–410. doi: 10.1038/ngeo518
Furevik T., Nilsen J. E. Ø. (2005). Large‐Scale atmospheric circulation variability and its impacts on the Nordic Seas Ocean Climate‐a Review. In: The Nordic Seas: An Integrated Perspective, Geophysical Monograph Series, 158 (4), 385–396. doi: 10.1111/j.1365-3032.1980.tb00247.x
Girton J. B., Pratt L. J., Sutherland D. A., Price J. F. (2006). Is the faroe bank channel overflow hydraulically controlled? J. Phys. Oceanogr. 36, 2340–2349. doi: 10.1175/JPO2969.1
Good S. A., Martin M. J., Rayner N. A. (2013). EN4: Quality controlled ocean temperature and salinity profiles and monthly objective analyses with uncertainty estimates. J. Geophys. Res. Oceans. 118, 6704–6716. doi: 10.1002/2013JC009067
Gregory J. M., Dixon K. W., Stouffer R. J., Weaver A. J., Driesschaert E., Eby M., et al. (2005). A model intercomparison of changes in the Atlantic thermohaline circulation in response to increasing atmospheric CO 2 concentration. Geophys. Res. Lett. 32, L12703. doi: 10.1029/2005GL023209
Guemas V., Salas-Mélia D. (2008). Simulation of the Atlantic meridional overturning circulation in an atmosphere-ocean global coupled model. Part II: weakening in a climate change experiment: a feedback mechanism. Clim. Dyn. 30, 831–844. doi: 10.1007/s00382-007-0328-8
Hansen B., Østerhus S. (2000). North Atlantic–Nordic seas exchanges. Prog. Oceanogr. 45, 109–208. doi: 10.1016/S0079-6611(99)00052-X
Hansen B., Østerhus S. (2007). Faroe bank channel overflow 1995–2005. Prog. Oceanogr. 75, 817–856. doi: 10.1016/j.pocean.2007.09.004
Hersbach H., Bell B., Berrisford P., Hirahara S., Horányi A., Muñoz-Sabater J., et al. (2020). The ERA5 global reanalysis. Q. J. R. Meteor. Soc 146, 1999–2049. doi: 10.1002/qj.3803
Iakovleva D. A., Bashmachnikov I. L. (2021). On the seesaw in interannual variability of upper ocean heat advection between the North Atlantic Subpolar Gyre and the Nordic Seas. Dynam. Atmos. Oceans. 96, 101263. doi: 10.1016/j.dynatmoce.2021.101263
IPCC (2021). “IPCC 2021: summary for policymakers,” in Climate Change 2021: The Physical Science Basis. Eds. MassonDelmotte V., Zhai P., Pirani A., Connors S. L., Péan C., Berger S., Caud N., Chen Y., Goldfarb L., Gomis M. I., Huang M., Leitzell K., Lonnoy E., Matthews J. B. R., Maycock T. K., Waterfield T., Yelekçi O., Yu R., Zhou B. (Cambridge, United Kingdom and New York, NY, USA: Contribution of Working Group I to the Sixth Assessment Report of the Intergovernmental Panel on Climate Change).
Jochumsen K., Quadfasel D., Valdimarsson H., Jónsson S. (2012). Variability of the Denmark Strait overflow: Moored time series from 1996-2011. J. Geophys. Res. Oceans. 117, C12003. doi: 10.1029/2012JC008244
Käse R. H. (2006). A Riccati model for Denmark Strait overflow variability. Geophys. Res. Lett. 33, L21S09. doi: 10.1029/2006GL026915
Kim H.–J., An S.–I., Park J.–H., Sung M.–K., Kim D., Choi Y., et al. (2023). North Atlantic oscillation impact on the Atlantic Meridional Overturning Circulation shaped by the mean state. NPJ Clim. Atmos. Sci. 6 (1), 25. doi: 10.1038/s41612-023-00354-x
Köhl A. (2007). Generation and stability of a quasi-permanent vortex in the Lofoten basin. J. Phys. Oceanogr. 37, 2637–2651. doi: 10.1175/2007JPO3694.1
Latarius K., Quadfasel D. (2010). Seasonal to inter-annual variability of temperature and salinity in the Greenland Sea Gyre: heat and freshwater budgets. Tellus. A. 62, 497–515. doi: 10.1111/j.1600-0870.2010.00453.x
Lozier M. S., Owens W. B., Curry R. G. (1995). The climatology of the North Atlantic. Prog. Oceanogr. 36, 1–44. doi: 10.1016/0079-6611(95)00013-5
Marshall J., Schott F. (1999). Open-ocean convection: Observations, theory, and models. Rev. Geophy. 37, 1–64. doi: 10.1029/98RG02739
Mork K. A., Skagseth Ø., Ivshin V., Ozhigin V., Hughes S. L., Valdimarsson H. (2014). Advective and atmospheric forced changes in heat and fresh water content in the Norwegian Sea 1951-2010. Geophys. Res. Lett. 41, 6221–6228. doi: 10.1002/2014GL061038
Nøst O. A., Isachsen P. E. (2003). The large-scale time-mean ocean circulation in the Nordic Seas and Arctic Ocean estimated from simplified dynamics. J. Mar. Res. 61, 175–210. doi: 10.1357/002224003322005069
Olsen S. M., Hansen B., Quadfasel D., Østerhus S. (2008). Observed and modelled stability of overflow across the Greenland–Scotland ridge. Nature 455, 519–522. doi: 10.1038/nature07302
Rossby T., Prater M. D., Søiland H. (2009). Pathways of inflow and dispersion of warm waters in the Nordic seas. J. Geophys. Res. 114, C04011. doi: 10.1029/2008JC005073
Serra N., Käse R. H., Köhl A., Stammer D., Quadfasel D. (2010). On the low-frequency phase relation between the Denmark Strait and the Faroe-Bank Channel overflows. Tellus. A. 62, 530–550. doi: 10.1111/j.1600-0870.2010.00445.x
Shi W., Zhao J., Lian X., Wang X., Chen W. (2017). Slowdown of sea surface height rises in the Nordic seas and related mechanisms. Acta Oceanol. Sin. 36, 20–33. doi: 10.1007/s13131-017-1027-x
Smedsrud L. H., Muilwijk M., Brakstad A., Madonna E., Lauvset S. K., Spensberger C., et al. (2022). Nordic seas heat loss, Atlantic inflow, and arctic sea ice cover over the last century. Rev. Geophy. 60, e2020RG000725. doi: 10.1029/2020RG000725
Smith T. M., Reynolds R. W., Peterson T. C., Lawrimore J. (2008). Improvements to NOAA’s historical merged land–ocean surface temperature analysis, (1880–2006). J. Clim. 21, 2283–2296. doi: 10.1175/2007JCLI2100.1
Stolpe M. B., Medhaug I., Sedlácek J., Knutti R. (2018). Multidecadal variability in global surface temperatures related to the Atlantic meridional overturning circulation. J. Clim. 31, 2889–2906. doi: 10.1175/JCLI-D-17-0444.1
Telesiński M. M., Łącka M., Kujawa A., Zajączkowski M. (2022). The significance of Atlantic Water routing in the Nordic Seas: The Holocene perspective. Holocene 32, 1104–1116. doi: 10.1177/09596836221106974
Tsubouchi T., Våge K., Hansen B., Larsen K. M. H., Østerhus S., Johnson C., et al. (2021). Increased ocean heat transport into the Nordic Seas and Arctic Ocean over the period 1993–2016. Nat. Clim. Chan.g 11, 21–26. doi: 10.1038/s41558-020-00941-3
Wang X., Zhao J., Li T., Zhong W., Jiao Y. (2015). Hydrographic features of the Norwegian Sea and the Greenland Sea in summer 2012. Adv. Earth Sci. (in Chinese) 30, 346–356. doi: 10.11867/j.issn.1001-8166.2015.03.0346
Whitehead J. A. (1998). Topographic control of oceanic flows in deep passages and straits. Rev. Geophy. 36, 423–440. doi: 10.1029/98RG01014
Yang J., Neelin J. D. (2010). Sea-Ice Interaction andtheStabHity cf the Thermohaline Circulation. Atmosphere-Ocean 35, 433–469. doi: 10.1080/07055900.1997.9649599
Yang J., Pratt L. J. (2013). On the effective capacity of the dense-water reservoir for the nordic seas overflow: some effects of topography and wind stress. J. Phys. Oceanogr. 43, 418–431. doi: 10.1175/JPO-D-12-087.1
Zhang R., Delworth T. L., Rosati A., Anderson W. G., Dixon K. W., Lee H. C., et al. (2011). Sensitivity of the North Atlantic Ocean Circulation to an abrupt change in the Nordic Sea overflow in a high resolution global coupled climate model. J. Geophys. Res. 116, C12024. doi: 10.1029/2011jc007240
Appendix: Method for calculating changes in ocean temperature caused by air-sea flux
Based on the research conducted by Shi et al. (2017), thermodynamic formulas (Equations A1, A2) can be utilized to analyze the impact of air-sea heat flux on ocean temperature changes in the upper water column.
where H represents the height of the water column, ρ denotes the mean density of the water column, α is the thermal expansion coefficient, Cp is the specific heat capacity of seawater, ΔE represents the change in heat flux, ΔT is the resultant temperature change, and Δh is the resultant change to the height of water column.
Based on the information provided, assuming that the changes in seawater properties caused by air-sea flux uniformly act on the water columns shallower than 840 m (H=840 m), we can analyze the impact of these changes on the temperature of the upper water column. In the Norwegian Sea, typical shallow seawater properties are considered to be 10 °C for the initial temperature. The specific heat capacity of seawater is assumed to be 4×10³ J/(kg·°C), and the pressure Pz is approximately 3×10⁶ Pa. The thermal expansion coefficient of seawater based on TEOS_10 is 1.715×10⁻⁴ K–1. Then the change in heat flux amounting to 1.0 W/(m2·a) could result in a heating rate of 0.94×10⁻² °C/a for the upper water (shallower than 840 m). The increase in the ocean temperature of 0.014K/a can be caused by a growth rate of 1.51 W/(m2·a) of air-sea heat flux.
Keywords: Nordic Seas Overflows, storage volume, Atlantic inflow, air-sea flux, data analysis
Citation: Shi W, Xu M and Lv X (2024) Research on the change of the storage volume of the Nordic Seas Overflows over the last 40 years. Front. Mar. Sci. 11:1302978. doi: 10.3389/fmars.2024.1302978
Received: 27 September 2023; Accepted: 24 January 2024;
Published: 07 February 2024.
Edited by:
Francisco Machín, University of Las Palmas de Gran Canaria, SpainReviewed by:
Borja Aguiar-González, University of Las Palmas de Gran Canaria, SpainXi Liang, National Marine Environmental Forecasting Center, China
Copyright © 2024 Shi, Xu and Lv. This is an open-access article distributed under the terms of the Creative Commons Attribution License (CC BY). The use, distribution or reproduction in other forums is permitted, provided the original author(s) and the copyright owner(s) are credited and that the original publication in this journal is cited, in accordance with accepted academic practice. No use, distribution or reproduction is permitted which does not comply with these terms.
*Correspondence: Minjie Xu, minjiexu@ytu.edu.cn