Risk zonation of submarine geological hazards in the Chengdao area of the Yellow River subaqueous delta
 Zhenhao Wang
 Xing Du
 Yongfu Sun2
 - 1First Institute of Oceanography, MNR, Qingdao, Shandong, China
- 2National Deep Sea Center, Qingdao, Shandong, China
Submarine geological disasters occur frequently in the Chengdao area of the Yellow River subaqueous delta, which seriously threaten the safe operation of marine engineering in the region. Therefore, it is of great significance to carry out risk zonation for this region. The current study presents a detailed assessment of risk zones related to submarine geological hazards in this region based on analytical hierarchy process (AHP). The system of assessment index for risk zonation was established with four aspects of hydrodynamic condition, engineering geological environment, disaster geological conditions and human engineering activities. Eight geological hazard evaluation factors were selected and the distribution characteristics of each evaluation factor were discussed in detail by combining qualitative analysis and quantitative calculation. The risk level of submarine geological hazards in the Chengdao area are divided into four types: low risk, relatively low risk, relatively high risk, and high risk. The results show that the areas with a high geological hazard risk in this region are mainly distributed in the areas with water depths of 9–12 m, where the hydrodynamic effect is strong, with many human engineering activities, and seriously suffered from geologic hazards. The study results can provide scientific basis for engineering construction and hazard prevention in the Chengdao area.
1 Introduction
With the development of marine resources and marine engineering construction, the risk assessment of marine geological hazards is particularly important (Chen et al., 2020; Liu et al., 2023). Marine geological hazard risk zonation is the basis of regional marine geological hazard risk assessment, which can provide a scientific basis for marine development planning, engineering construction, and comprehensive management (Souza and Suguio, 2003). The geological hazards in the Yellow River Delta region have been a hot spot in marine engineering geology research in recent years. In the past few decades, due to the diversion of the Yellow River Estuary and the sharp drop in runoff, the sediment source has tended to be cut off. Under the action of external loads such as waves, currents, and storm surges, the seabed in the abandoned Laohekou area (Chengdao area) has suffered severe erosion and various geological disasters have developed. All types of geological disasters are closely related to the development and utilization of resources and engineering protection in the waters in the Chengdao area, and they seriously threaten the safety of oil platforms and submarine cables and pipelines (Guo et al., 2023). For example, in 2003, the seabed sediment near oil production platform CB12B in the Chengdao area was liquefied and disturbed by ocean dynamics, which caused the breakdown of two submarine cables (Xu et al., 2009). In 2010, a capsizing accident occurred on the Shengli Operation No. 3 workover platform near the CB22C well group platform in the Chengdao Oilfield, resulting in the death of two people and a direct economic loss of 5.92 million yuan (Du, 2013). In 2019, typhoon Lekima caused a great deal of damage to coastal seawalls and roads. Therefore, the risk zonation of submarine geological hazards in this area is very important.
Since the relationships between various factors affecting the occurrence of and damage caused by geological disasters are extremely complex, and the quantification of each factor is also relatively difficult, in geological disaster risk assessment, the key to the accuracy and scientificity of the evaluation results is the selection of evaluation indicators and the rationality of the weight determination (Zhang et al., 2015; Gamboa et al., 2021).
At present, the weight determination methods can be mainly divided into two categories: subjective weighting methods and objective weighting methods. The more common evaluation models mainly include the fuzzy comprehensive evaluation method, analytic hierarchy process (AHP), gray clustering method, artificial neural network method, comprehensive index method, and multivariate statistical method (Sun et al., 2012). The AHP is a qualitative and quantitative multi-objective decision analysis method, and it is suitable for situations where the target structure is complex and the necessary data are lacking. It can organize various factors in complex problems in a certain interrelated orderly level and can provide a comparable quantitative basis for analysis, decision-making, prediction, or development control (Subedi et al., 2019; Hu et al., 2021; Wei et al., 2021). Therefore, based on the AHP, in this paper, an evaluation index hierarchy model is established and weight calculations are conducted to make the zonation results more scientific and accurate.
The Yellow River Delta is formed by the deposition of sediment transported by the Yellow River into the sea. It contains a national wetland type nature reserve, the Yellow River Delta Wetland, and the second largest oil industry base in the country, the Shengli Oilfield. A large number of offshore oil and gas development projects and ecological protection projects in the Chengdao area are threatened by natural disasters. With the gradual strengthening of the exploration and development of seabed resources and the construction of marine engineering facilities, more and more attention has been paid to research on the geological hazards in this region. Since the 1990s, some research has been conducted on the zonation of marine engineering geological hazards (Liu et al., 2000; Du et al., 2008). However, relatively few studies have been conducted on the risk zonation of the geological hazards in the Chengdao area, and there is still a lack of overall analysis and evaluation. Based on a large amount of investigation work conducted during the National Special Project for Marine Public Welfare Industry “Research on Key Technologies for Prediction, Evaluation, Prevention, and Control of Offshore Submarine Geological Hazards,” in this study, the Chengdao area, which is located on the edge of the underwater delta of the Yellow River, was selected as a typical geological disaster research area. We have collected the research results over the years and the historical data and analysis results related to marine engineering development, and we comprehensively analyzed the 1) marine hydrometeorological environmental conditions and hydrodynamic characteristics, 2) seabed topography, 3) soil layer structure, 4) soil engineering geological characteristics, and 5) types and distribution of geological hazards and other marine engineering geological environment data. Based on the AHP, our research on geological hazard risk zonation not only provides a scientific basis for geological environmental protection, geological disaster prevention, and engineering development activities in the Chengdao area, but it also provides a reference for the development of large-scale sea area geological hazard risk zonation research and development.
2 Geological hazards in the Chengdao area
The Chengdao area is located in the shallow sea area, with a water depth of about 0~18m, on the northern margin of the Yellow River Delta and the south coast of Bohai Bay (Figure 1), and it is the core area for offshore oil development in the Shengli Oilfield. Since it was officially put into development in 1993, more than 100 platforms of various types have been built and connected to each other through submarine cables and pipelines, forming a development system for submarine oil transportation, gas transportation, water injection, power transmission, and mixed oil and gas transportation to shore.
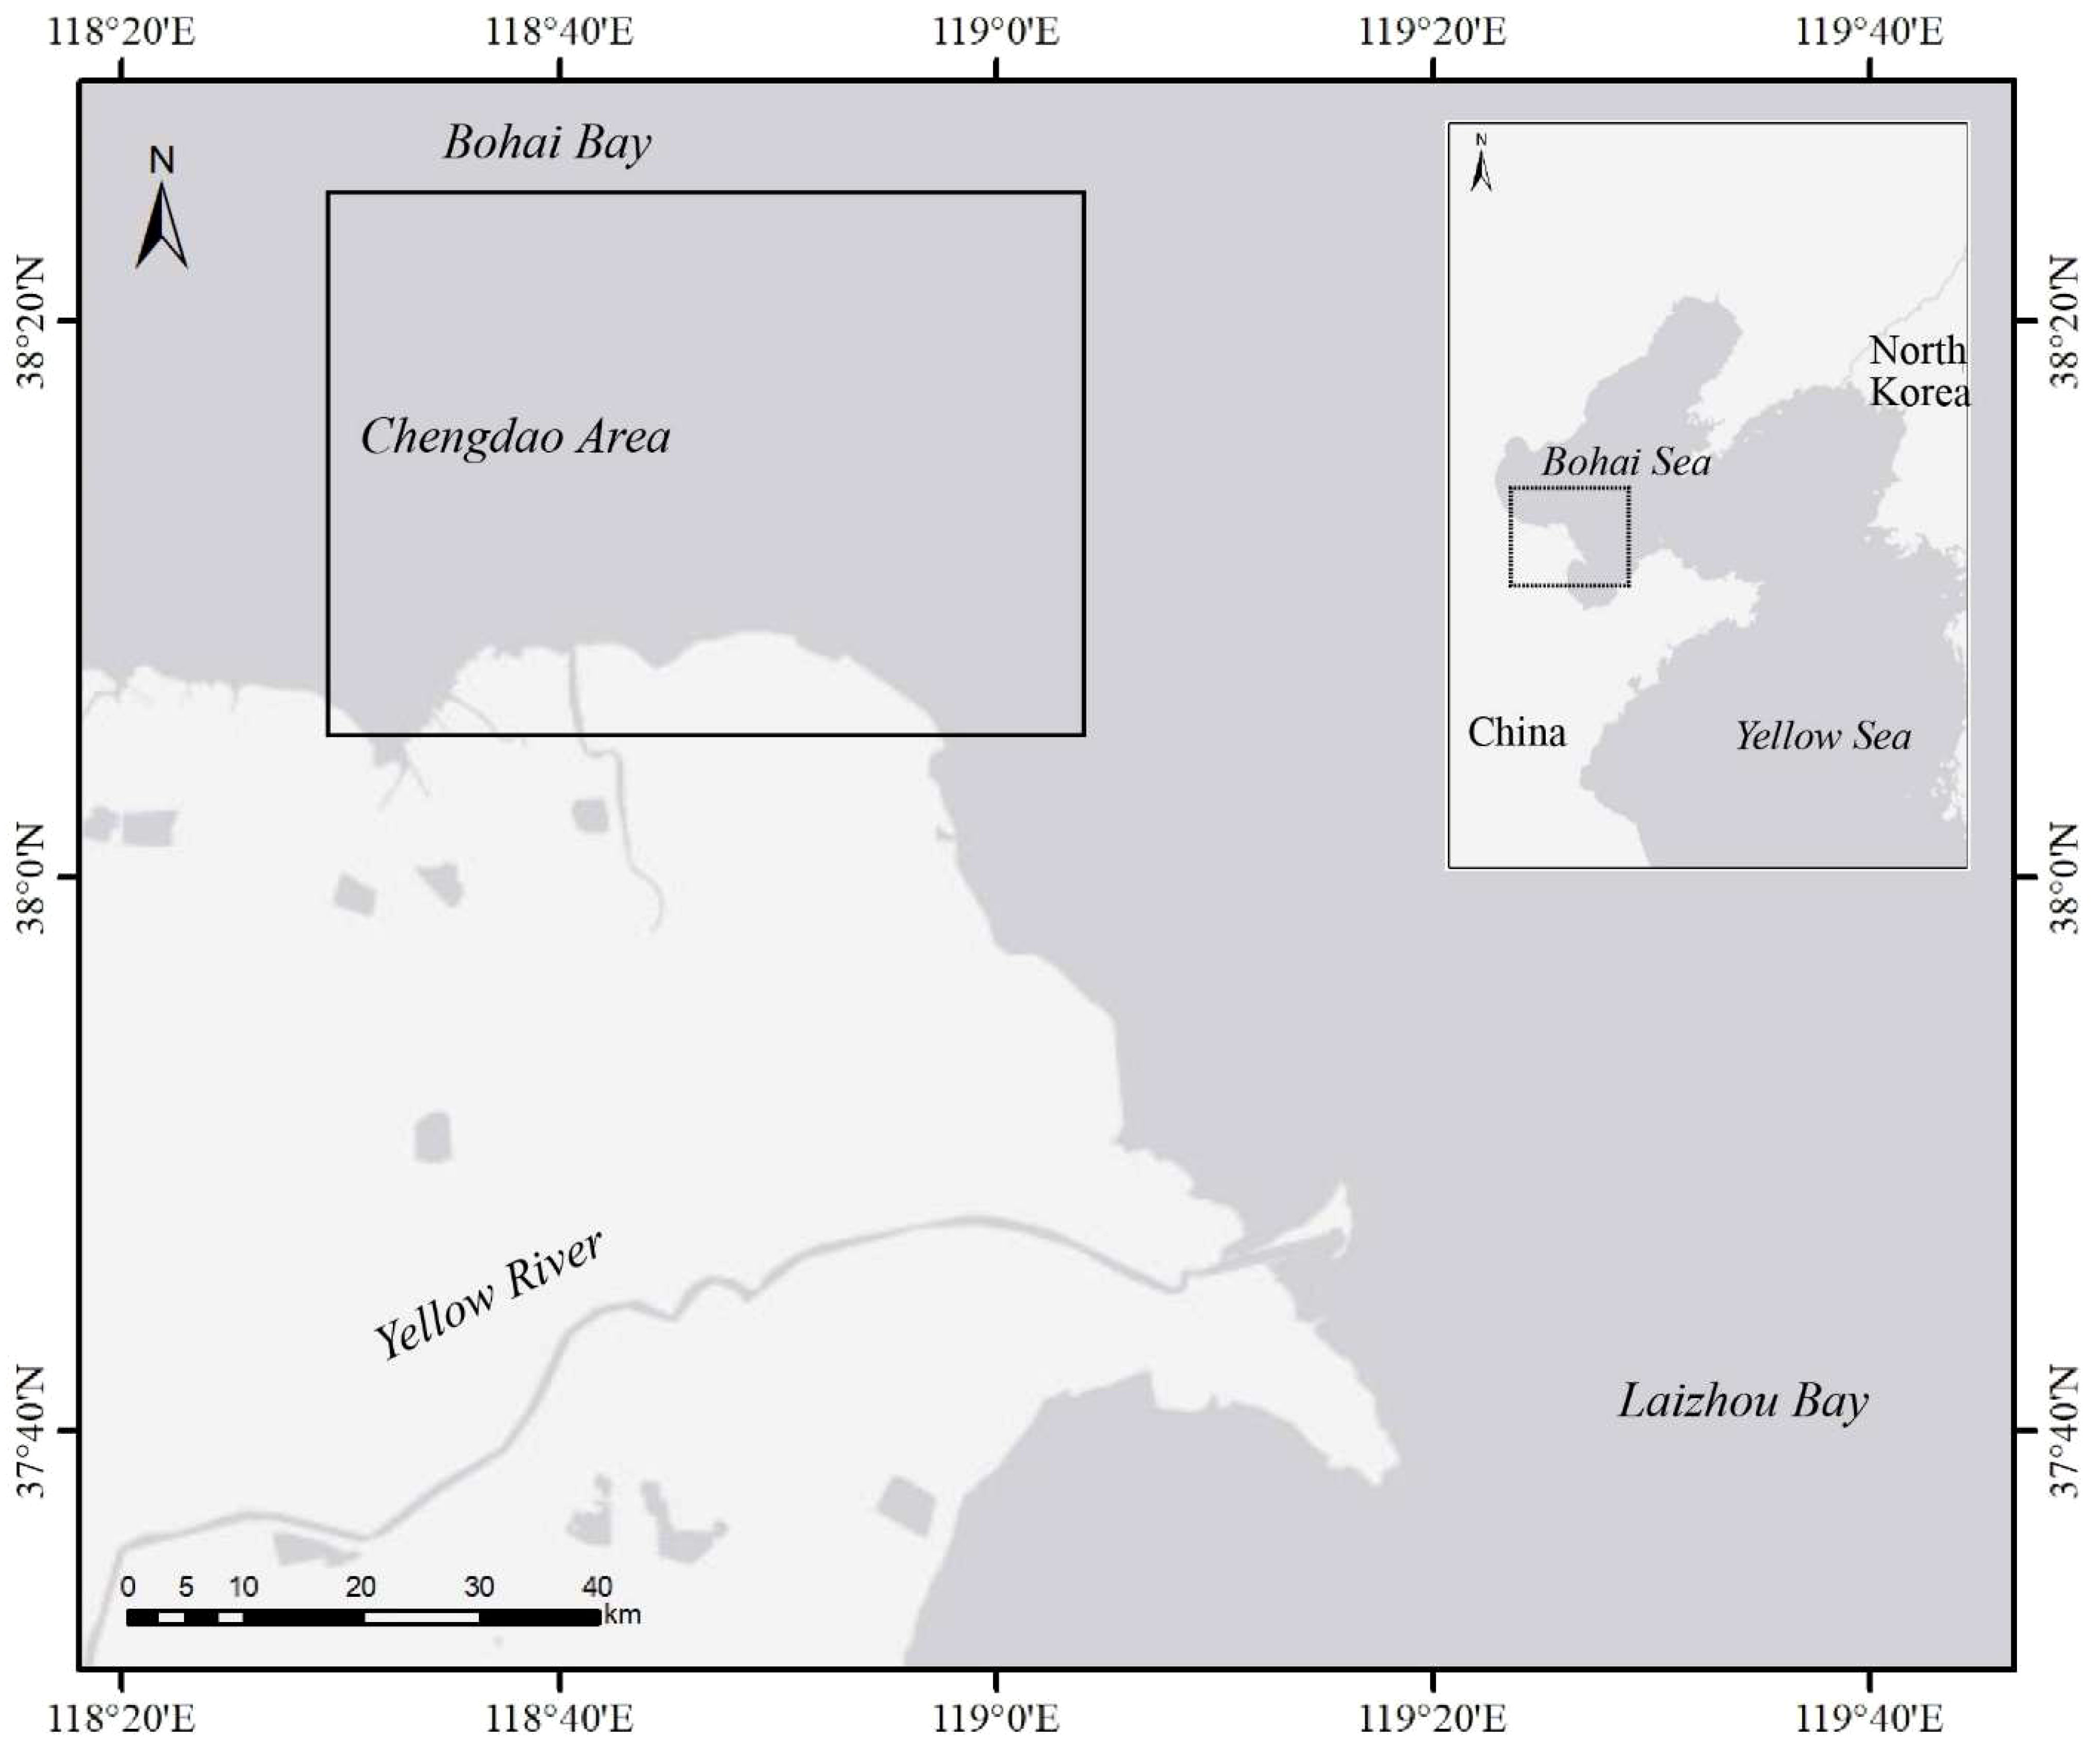
Figure 1 Map of the Yellow River delta, China, with the Chengdao study area marked by a res rectangle.
The surface sediments in the Chengdao area are mainly composed of two sub-deltas formed during the Shenxiangou flow path from 1953 to 1964 and the Diaokou flow path from 1964 to 19769 (Xue, 1993). After the Yellow River was diverted from Qingshuigou to the sea in 1976, the area experienced a rapid erosion stage from 1976 to 1986, a slow erosion stage from 1986 to 1996, and an erosion-silting adjustment stage dominated by erosion after 1996 (Li et al., 2000). With the exception of the current estuaries, which are slowly subsiding outwards, almost all other coasts are in a state of erosion (Chu et al., 2006). The maximum erosion rate of the seabed in this area was 61 cm/a during the periods (Li et al., 2000). According to previous research results, the surface sediments in the Chengdao Oilfield area are dominated by silt that is prone to liquefaction damage. Due to the distribution of a large amount of loose silt soil with a high water content on the seabed in this area, various types of geological disasters are prone to occur (Prior et al., 1986; Liu et al., 2017; Zhang et al., 2020).
The geological hazards in the Chengdao area are widely developed and of complex and diverse types, including sediment liquefaction, silt flow, subsidence, erosion, and deposition, and their mechanism is mainly induced by marine dynamics (Wang and Liu, 2016; Wang et al., 2018). Most of the above-mentioned geological disasters are manifested as disturbed strata in the shallow stratum section (shown as Figure 2B) (Sun et al., 2008). The combination structure of sediment particles after instability is broken, recombined, and rearranged under the action of the wave reciprocating load, and the original bedding structure of the macroscopic seabed is disturbed. Moreover, the seepage of the pore water inside the sediment carries the fine sediment particles out of the soil skeleton, and the movement of the soil particles caused by this action also disturbs the original bedding structure of the seabed (Wang et al., 2020).
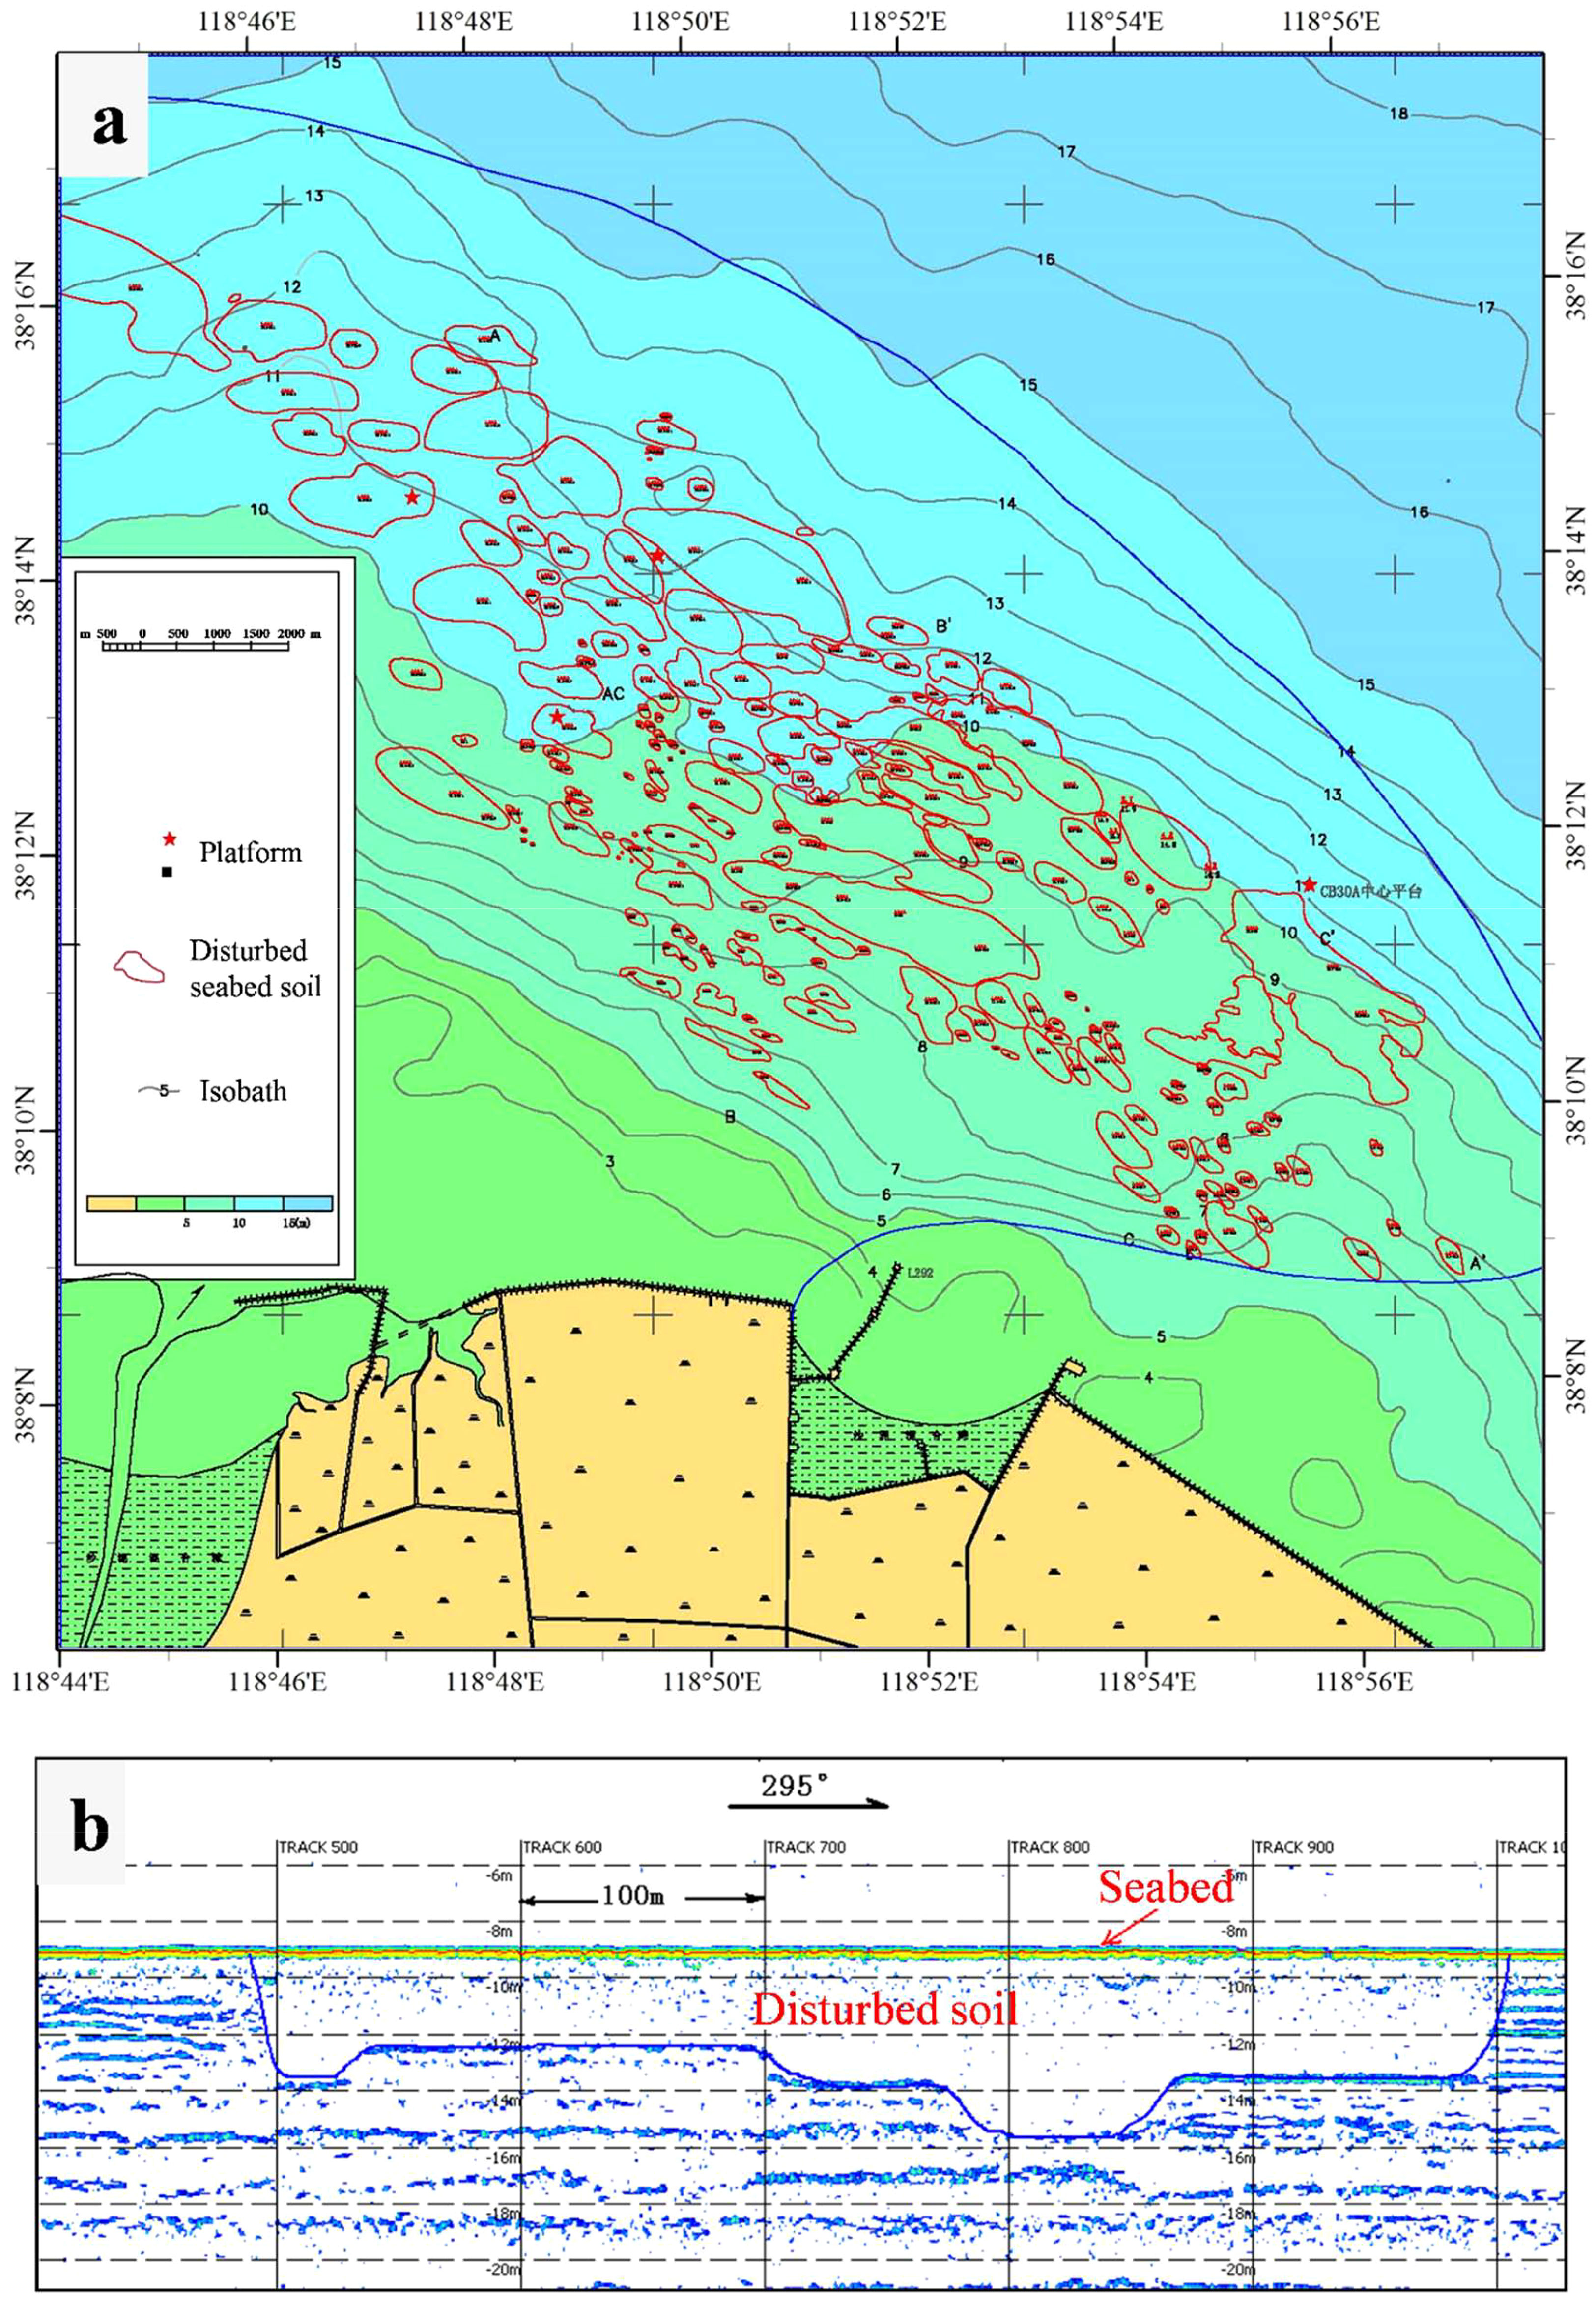
Figure 2 (A) Distribution map of disturbed seabed soil in the research area of the Chengdao Oilfield. (B) Profile map of soil disturbed in the shallow strata.
According to the obtained high-resolution shallow strata section data, the distribution range of the submarine disturbed seabed in the key research area of the Chengdao Oilfield was delineated (shown as Figure 2A). The disturbed seabed in the study area was mainly distributed between the 5 m isobath and the 13 m isobath. Most of the disturbance areas were spindle-shaped, and the size of the disturbance area was complex and changeable, ranging from a small area (tens of square meters) to a maximum area of 1.8 km2. Their major axis was roughly in the direction of northwest to southeast.
3 Geological hazard risk zonation index system
3.1 Selection of evaluation factors
Earthquakes are a key factor in marine geological hazards. According to previous studies, the causative mechanism of geological hazards in the Yellow River Delta is mostly induced by hydrodynamics (Wang and Liu, 2016; Wang et al., 2018). Compared with storm surges and other marine dynamics, earthquakes occur less frequently (Liu et al., 2022), so they were not considered in this study. In this study, geological hazard risk zonation of the Chengdao area in the underwater delta of the Yellow River was carried out, focusing on the geological hazards caused by hydrodynamics, and the relevant evaluation factors were selected accordingly. Following the principles of combining scientificity with practicality, combination of quantitative research and combination of versatility and operability, and thus, an evaluation system consisting of three layers was designed. Layer A is the target layer, and the goal is to realize the geological hazard risk zonation for the entire study area. Layer B is the criterion layer, which is divided into four themes: the oceanic hydrodynamic conditions (B1), engineering geological environment (B2), disaster geological conditions (B3), and human engineering activities (B4). Layer C is the factor layer. In this evaluation, a total of eight detailed indicators for quantifiable evaluation were determined. The evaluation factor hierarchy is shown in Figure 3.
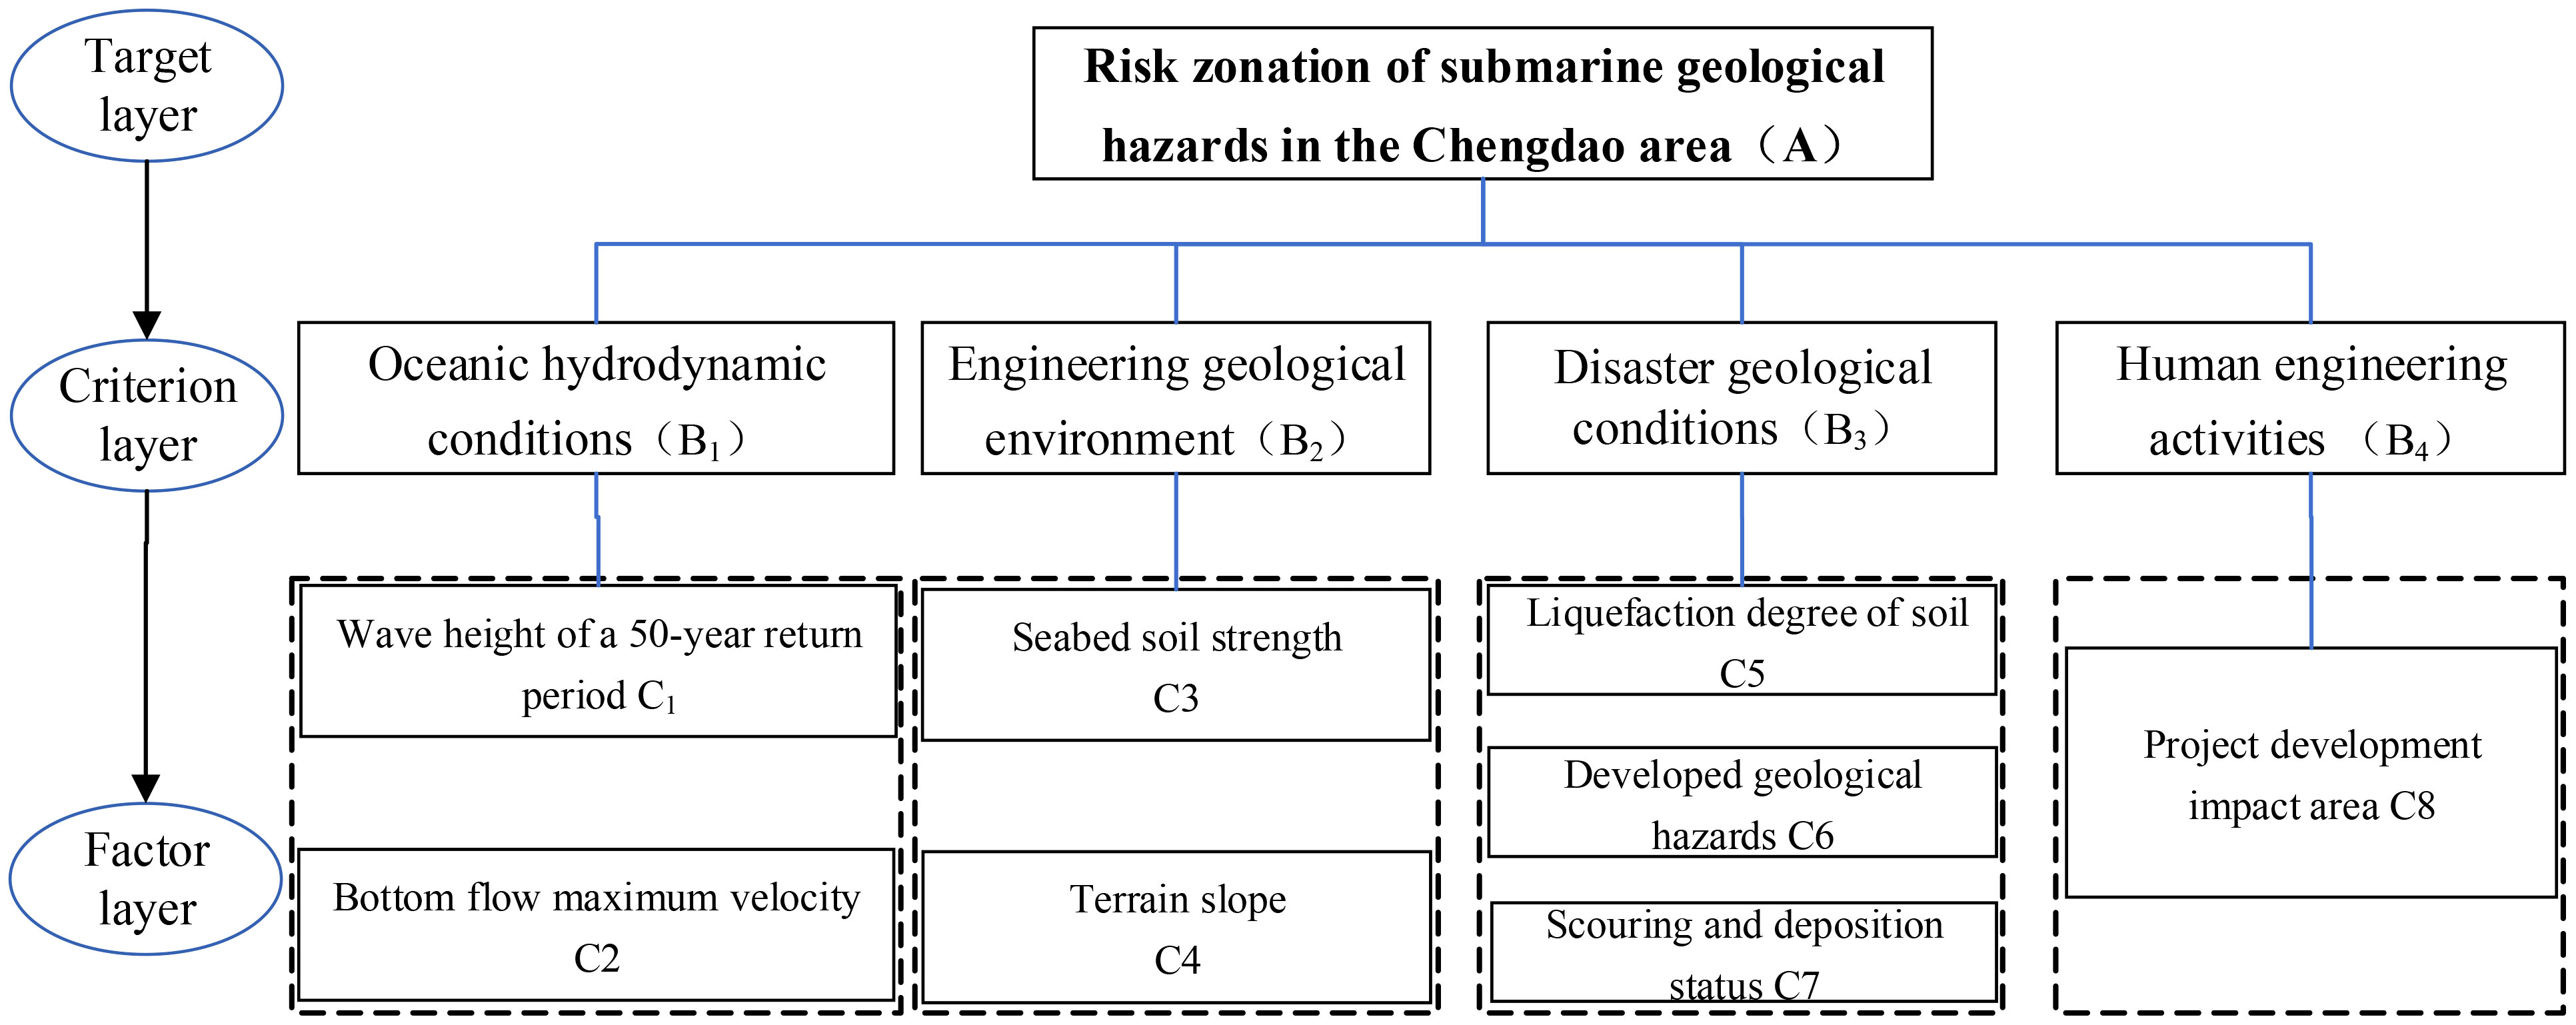
Figure 3 The analytical hierarchy model for evaluation index system of geological hazards regionalization in the Chengdao area.
The index data for each evaluation factor used in this study were obtained from a large amount of investigation work conducted during the National Special Project for Marine Public Welfare Industry “Research on Key Technologies for Prediction, Evaluation, Prevention, and Control of Offshore Submarine Geological Hazards.” Under dynamic seawater conditions, the scour–silting state, wave height of a 50-year return period, and bottom current maximum velocity data were collected from changes in sea water depth data and hydrodynamic observation station data. The seabed soil strength and terrain slope in the engineering geological environment were obtained from drilling data and water depth data for the sea area. The data sources of the soil liquefaction degree and developed geological hazards under geological disaster conditions were numerical calculations based on wave height data and borehole sampling geotechnical test analysis data, as well as data from geological hazard investigations. Human engineering activities mainly included the existing platforms and pipelines in the sea area. The borehole data included data for 42 boreholes, covering two categories of liquefied silt and unliquefied silt. The drillhole locations are shown in Figure 4.
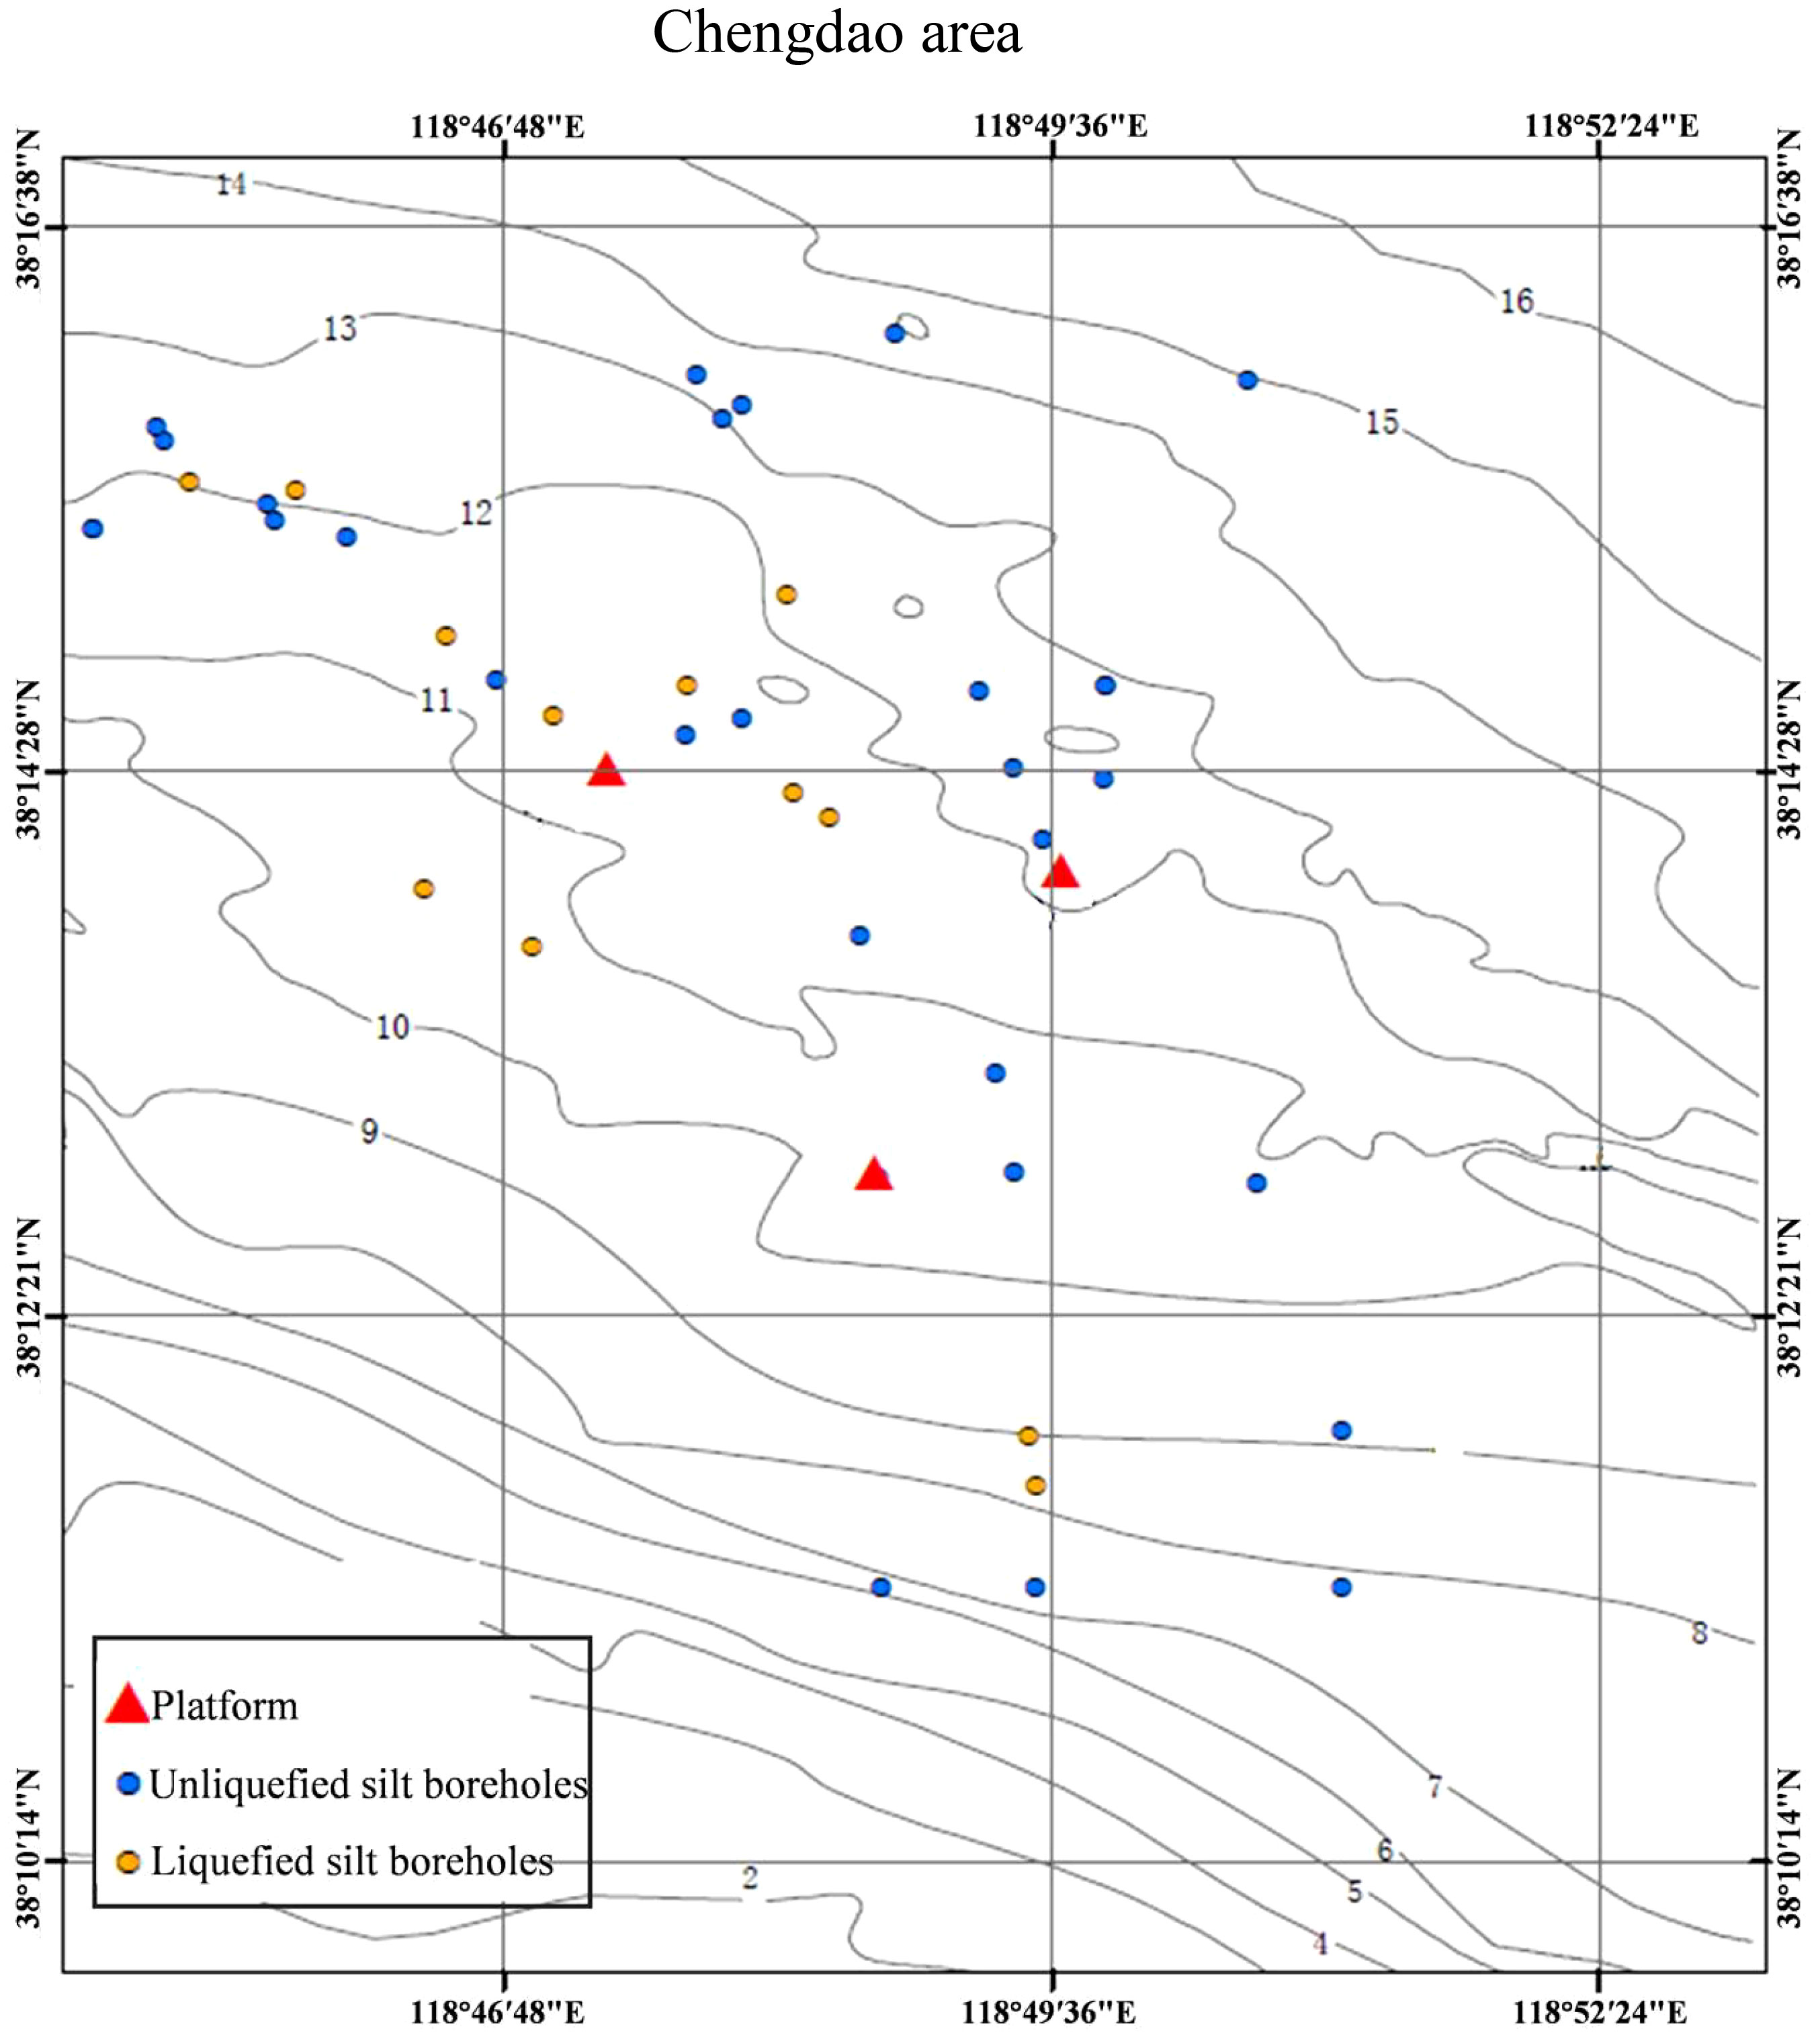
Figure 4 Locations of drills in the Chengdao area.
3.2 Quantitative grading of evaluation indicators
The assessment indicators for submarine geological hazard risk zonation in the Chengdao area were divided into quantitative indicators and qualitative indicators. The quantitative indicators were obtained from survey data statistics or calculations, and the qualitative indicators were obtained from qualitative analysis of the survey data. The quantification and grading process of each evaluation index is described in detail below.
3.2.1 Oceanic hydrodynamic conditions
3.2.1.1 Wave height of a 50-year return period
The hydrodynamic conditions mainly consider the significant wave height and the maximum flow velocity. Combined with the service life of the engineering facilities, the significant wave height with a return period of 50 years is selected as the grading index. The Simulating WAves Nearshore (SWAN) model (Booij et al., 1999) has been selected for application in this case given that it is successfully applied (internationally) by numerous users for the offshore and shallow waters of different seas (Akpınar et al., 2012). The grading standard is as follows: 0–0.5 m (slight waves, small waves); 0.5–2.5 m (light waves, medium waves); 2.5–4 m (big waves); and >4 m (huge waves).
3.2.1.2 Bottom flow maximum velocity
According to numerical simulation results, the maximum flow velocity at the bottom of the Chengdao area is divided into four levels based on the flow velocity values. The specific flow rate classification standards are as follows: 0–0.5 m/s; 0.5–1 m/s; 1–1.5 m/s; and >1.5 m/s.
3.2.2 Engineering geological environment
2.2.2.1 Seabed soil strength
The strength of the seabed soil is mainly divided according to its bearing capacity, which is obtained through a large number of drilling and geotechnical testing data. The classification standards are as follows:<50 kPa; 50–80 kPa; 80–110 kPa; and >110 kPa.
3.2.2.2 Terrain slope
The terrain slope is mainly obtained based on water depth data, and the specific classification standards are as follows:<1/2000, 1/2000–1/1000, 1/1000–1/500, and >1/500.
3.2.3 Geological disaster conditions
3.2.3.1 Liquefaction degree of soil
The liquefaction of the seabed soil is mainly determined by the soil parameters and hydrodynamic parameters. At present, the commonly used liquefaction criterion methods mainly include shear force criterion (comparing the anti-liquefaction shear stress strength of soil with the cyclic shear stress caused by waves) and excess pore pressure criterion (liquefaction will occur when the cumulative excess pore pressure generated by wave load is greater than the effective stress of overlying soil). We used the above two liquefaction criterion methods to calculate the liquefaction depth under the action of 50-year return period waves and classify the soil liquefaction degree accordingly. Generally, cohesive soils do not liquefy, so the division of easily liquefied soils is limited to silt and sandy soils. The grading standard is based on the liquefaction limit depth of the seabed soil calculated under the action of waves with a 50-year return period. According to the liquefaction depth, the degree of liquefaction of the soil is divided into four grades. The specific classification standards are as follows: 0–0.5 m (difficult to liquefy); 0.5–1 m (slightly liquefied); 1–1.5 m (moderately liquefied); and 1.5–2 m (severely liquefied).
2.2.3.2 Developed geological hazards
According to the field survey and collected data, the geological hazards in the study area are identified and classified, and the grades are manually classified based on the density of the geological hazards in the study area. Taking liquefaction disturbance as the main geological hazard, features such as silt flow and subsidence pits are superimposed to determine the distribution of the geological hazards in the study area, and the areas with multiple types of geological hazards are classified as severe disaster areas. The specific grading standards are as follows: no obvious disasters, slight disasters, moderate disasters, and severe disasters.
3.2.3.3 Scouring and deposition status
The evaluation indicators of the scouring and deposition status are classified according to the annual average erosion or deposition volume and are obtained through comparison of multiple water depth surveys. The specific classification standards are as follows:<−0.1 m or >0.1 m (severe scouring or deposition); −0.1–−0.05 m or 0.05–0.1 m (moderate scouring or deposition); −0.05–−0.02 m or 0.02–0.05 m (slight scouring or deposition); and −0.02–0.02 m (dynamic balance).
3.2.3.4 Human engineering activities
Human engineering activities are mainly divided into the core area, buffer zone, potential impact area, and non-influence area according to the occurrence of strong, medium, weak, and no marine engineering development activities. The core area mainly includes engineering structures such as platforms, docks, and breakwaters, as well as various types of sea areas that have been used for breeding, reclamation, and marine protection areas. The impact of changes in natural environmental conditions on the core area is the most important thing to pay attention to. Disasters caused by changes in the marine environment may have a serious impact on the human engineering activity area. On the contrary, marine engineering structures also contribute to the occurrence of geological disasters such as seabed erosion, soil liquefaction. The scope of the core area is comprehensively delineated according to the various types and modes of sea use in the Maritime Survey Specifications, and the actual project area is extended outward by 20–100 m. The buffer zone is defined as an area within a certain range outside the core area, which can play a buffering role in the actual engineering area after natural geological disasters occur. It is stipulated that the expansion of the core area by 500 m is the buffer zone. Under normal circumstances, geological disasters that occur farther than 500 m from the center of the existing engineering impact area have little impact on the human engineering area, but severe geological disasters can still affect engineering facilities, so it is stipulated that the potential impact area is 1 km outside the buffer zone. The boundary of the potential impact area is more than 1.5 km from the actual engineering facility boundary. In general, it is difficult for geological hazards formed 1.5 km away to affect engineering facilities, so the rest of the area is the no impact area.
3.3 Assignment of evaluation indicators
The determination of the evaluation index is conducted from the judgment matrix constructed in the AHP. The relative importance of each factor at the same level to the criteria of the previous level is compared in pairs, and the scale value is determined through repeated expert consultation and feedback to complete the construction of the judgment matrix. First, the judgment matrix of level B is established according to the target, and the weight is calculated. Second, the judgment matrix of level C is established and the weight is calculated. Finally, the weight of each evaluation factor contributing to the total target can be calculated by combining all of the judgment matrices.
The consistency test is carried out to determine whether the obtained weight is reasonable using the test formula , (Saaty, 1988; Saaty, 2003), where CR is the consistency index, CI is the consistency ratio, RI is the average random consistency index, max is the largest characteristic root, and n is the order of the matrix. If CR<0.1, the consistency test is passed, and the weight obtained is reasonable. The comprehensive weight of each evaluation index is listed in Table 1.
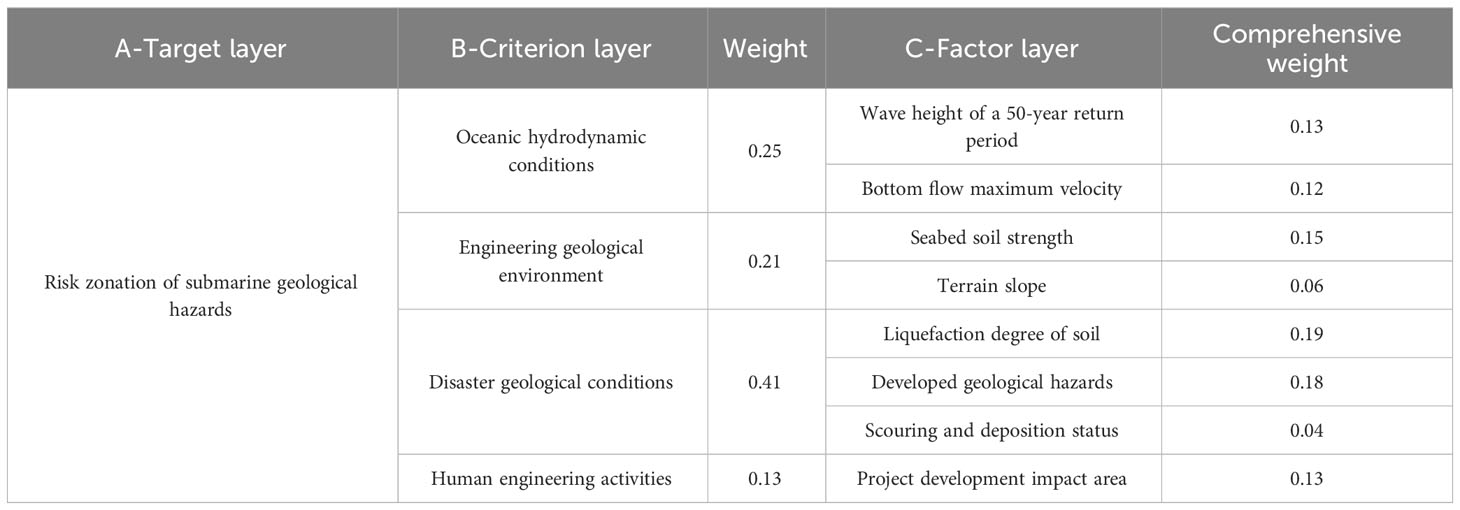
Table 1 The evaluation index and weight for geological hazards regionalization in the Chengdao area.
4 Geological hazard zonation
4.1 Single-factor evaluation and zonation results
4.1.1 Zonation based on the wave height of a 50-year return period in the Chengdao area
The wave heights of a 50-year return period in the Chengdao area are divided into four levels according to their size (Figure 5). The wave heights in the northern part of the sea area are relatively high, and the wave heights gradually decrease as the water depth decreases in the near-shore direction. The wave height contour line is consistent with the shoreline and isobath. The first demarcation line is between the 6–9 m water depth contours, and the northern sea area is the area where the wave height is greater than 4 m. The wave height in the second area is 2.5–4 m. This area is located near platforms L163, ZX163, and ZH104. The third area has a wave height of a 50-year return period of less than 2.5 m and is located within about 2 km of the shore. The area with a wave height of a 50-year return period of less than 0.5 m is extremely small and is not shown in the figure.
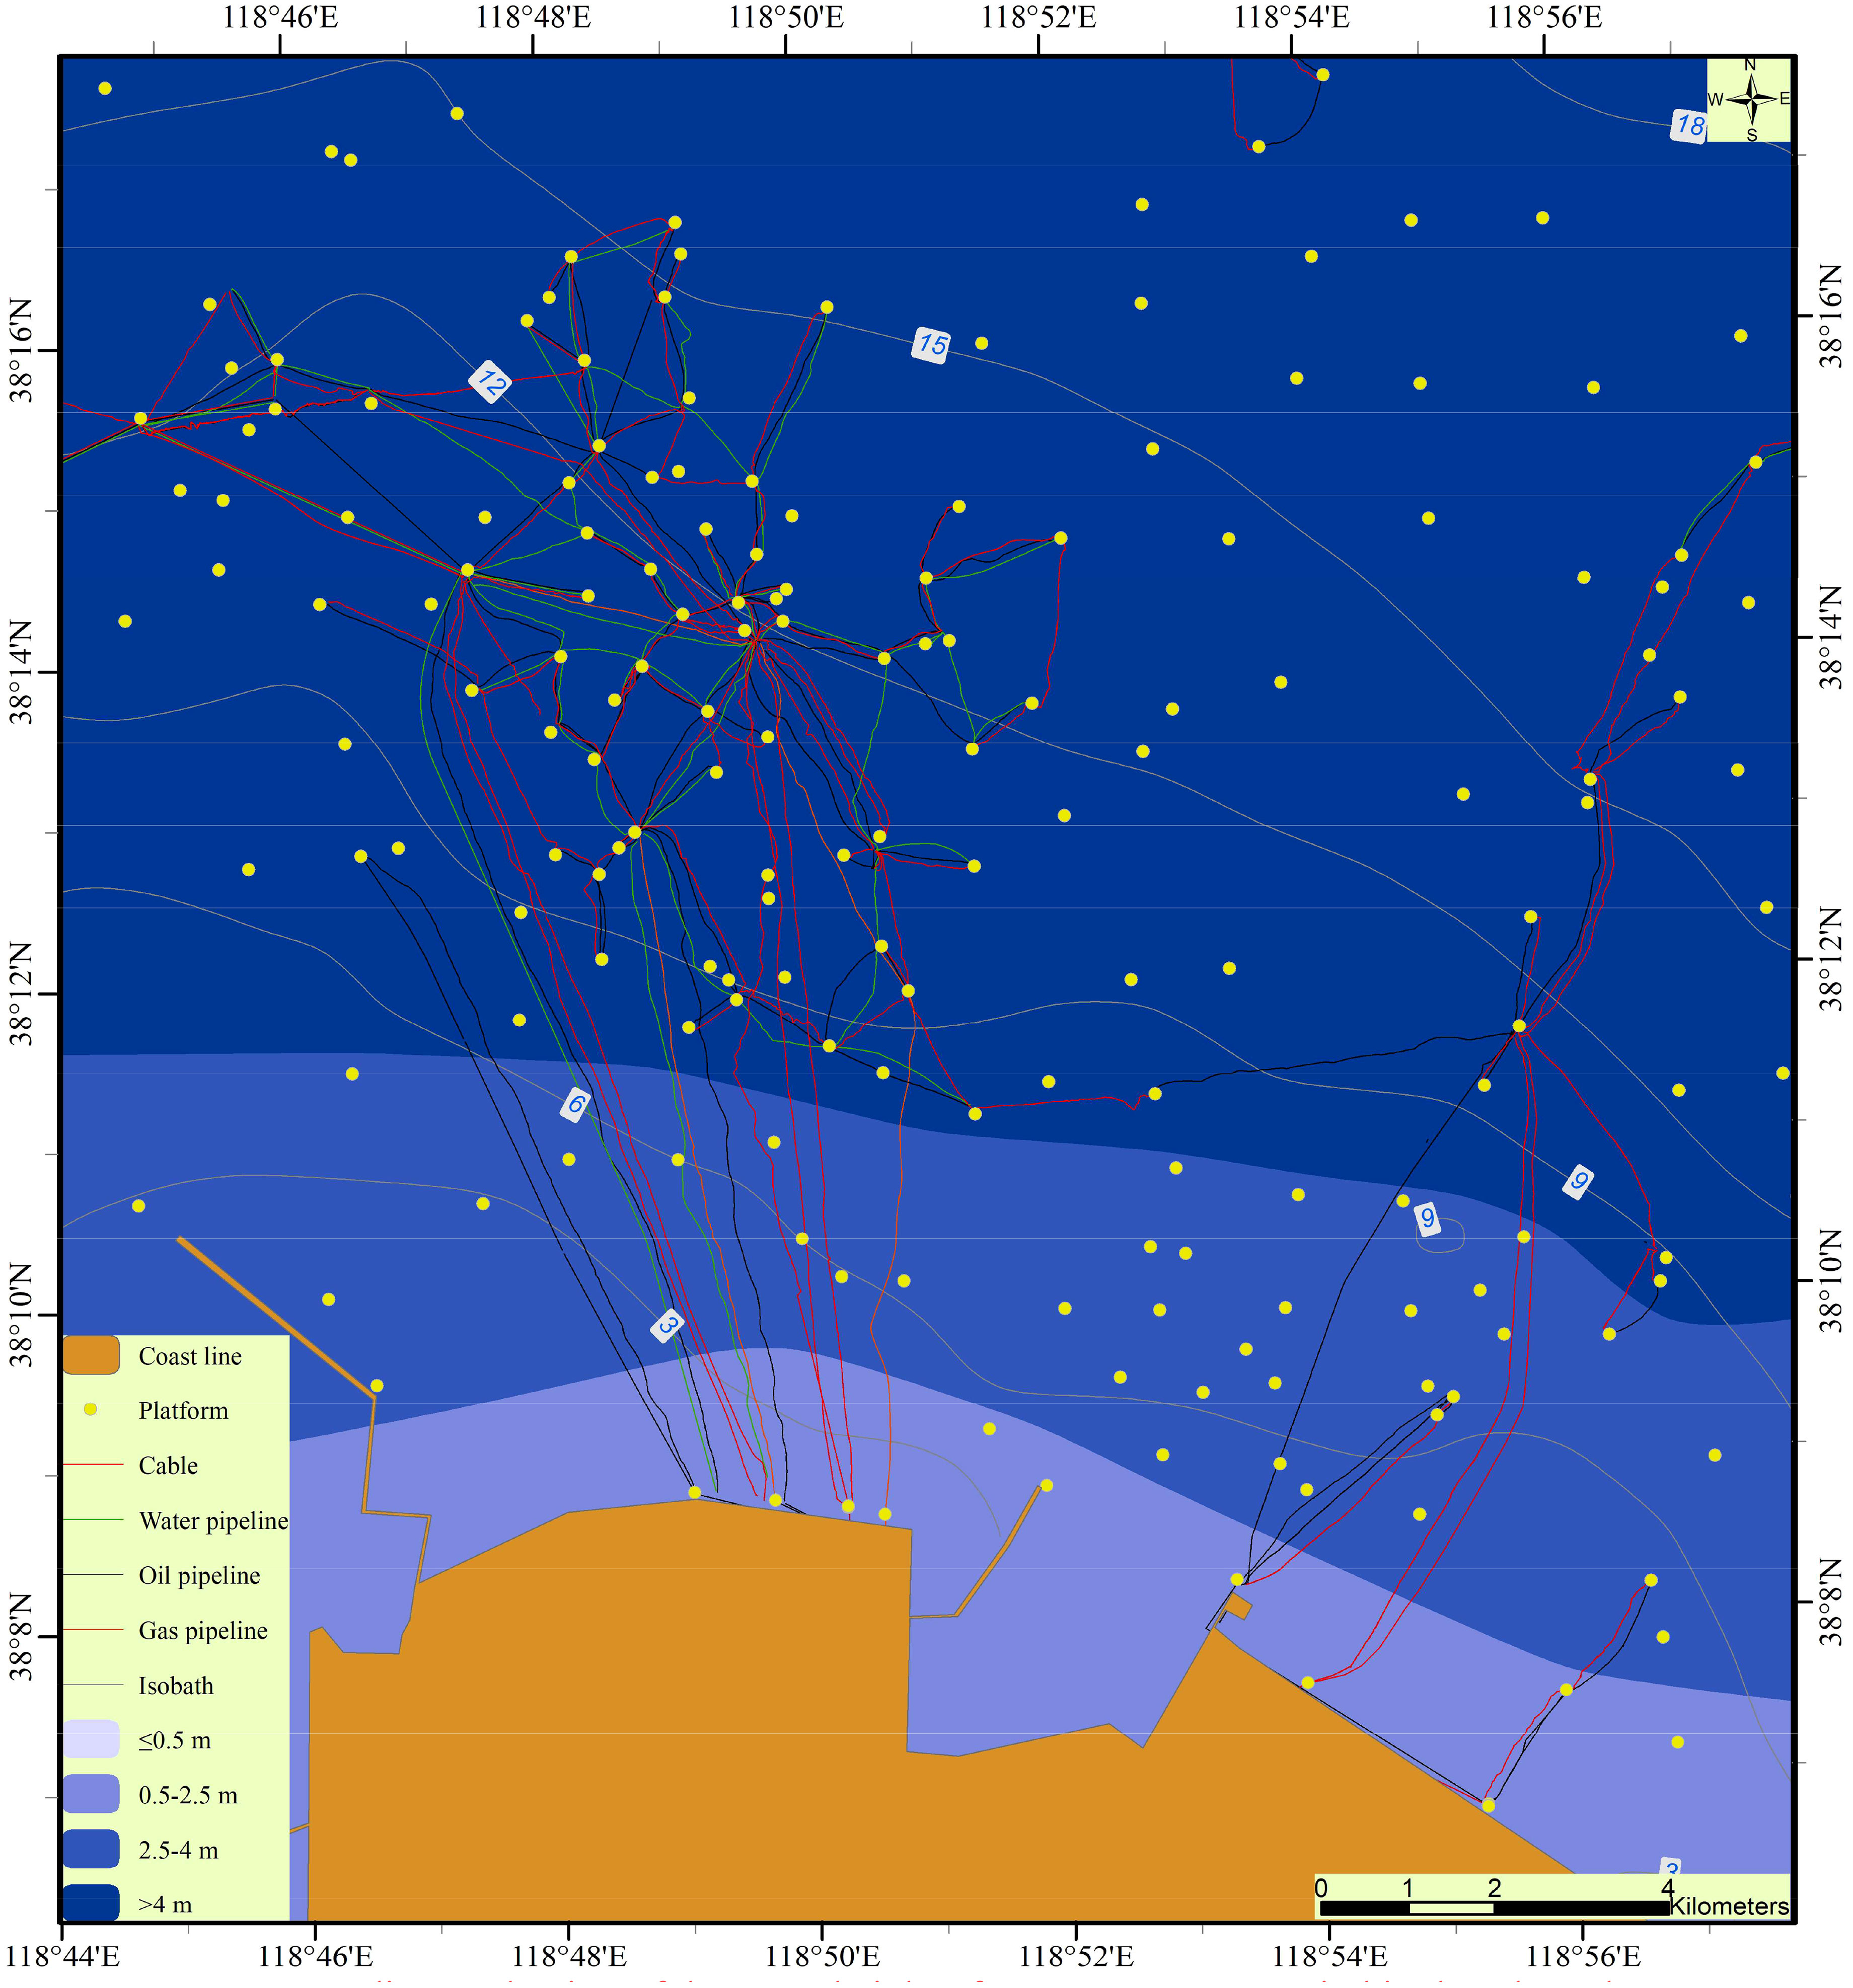
Figure 5 Grading evaluation of the wave height of a 50-year return period in the Chengdao area.
4.1.2 Zonation based on the maximum bottom velocity in the Chengdao area
The maximum flow velocity at the bottom of the Chengdao area is divided into four grades according to the flow velocity (Figure 6). Bounded by the vicinity of platforms CB11C, CB12, CB701, CB158, and ZH103, the northern part is the area where the maximum bottom flow velocity is greater than 1.5 m/s. Affected by the coastline, the current boundary line is roughly parallel to the coastline. The sea area south of the boundary line is basically at the 1–1.5 m/s level, and only a small part of the near-shore area is at the 0.5–1 m/s level.
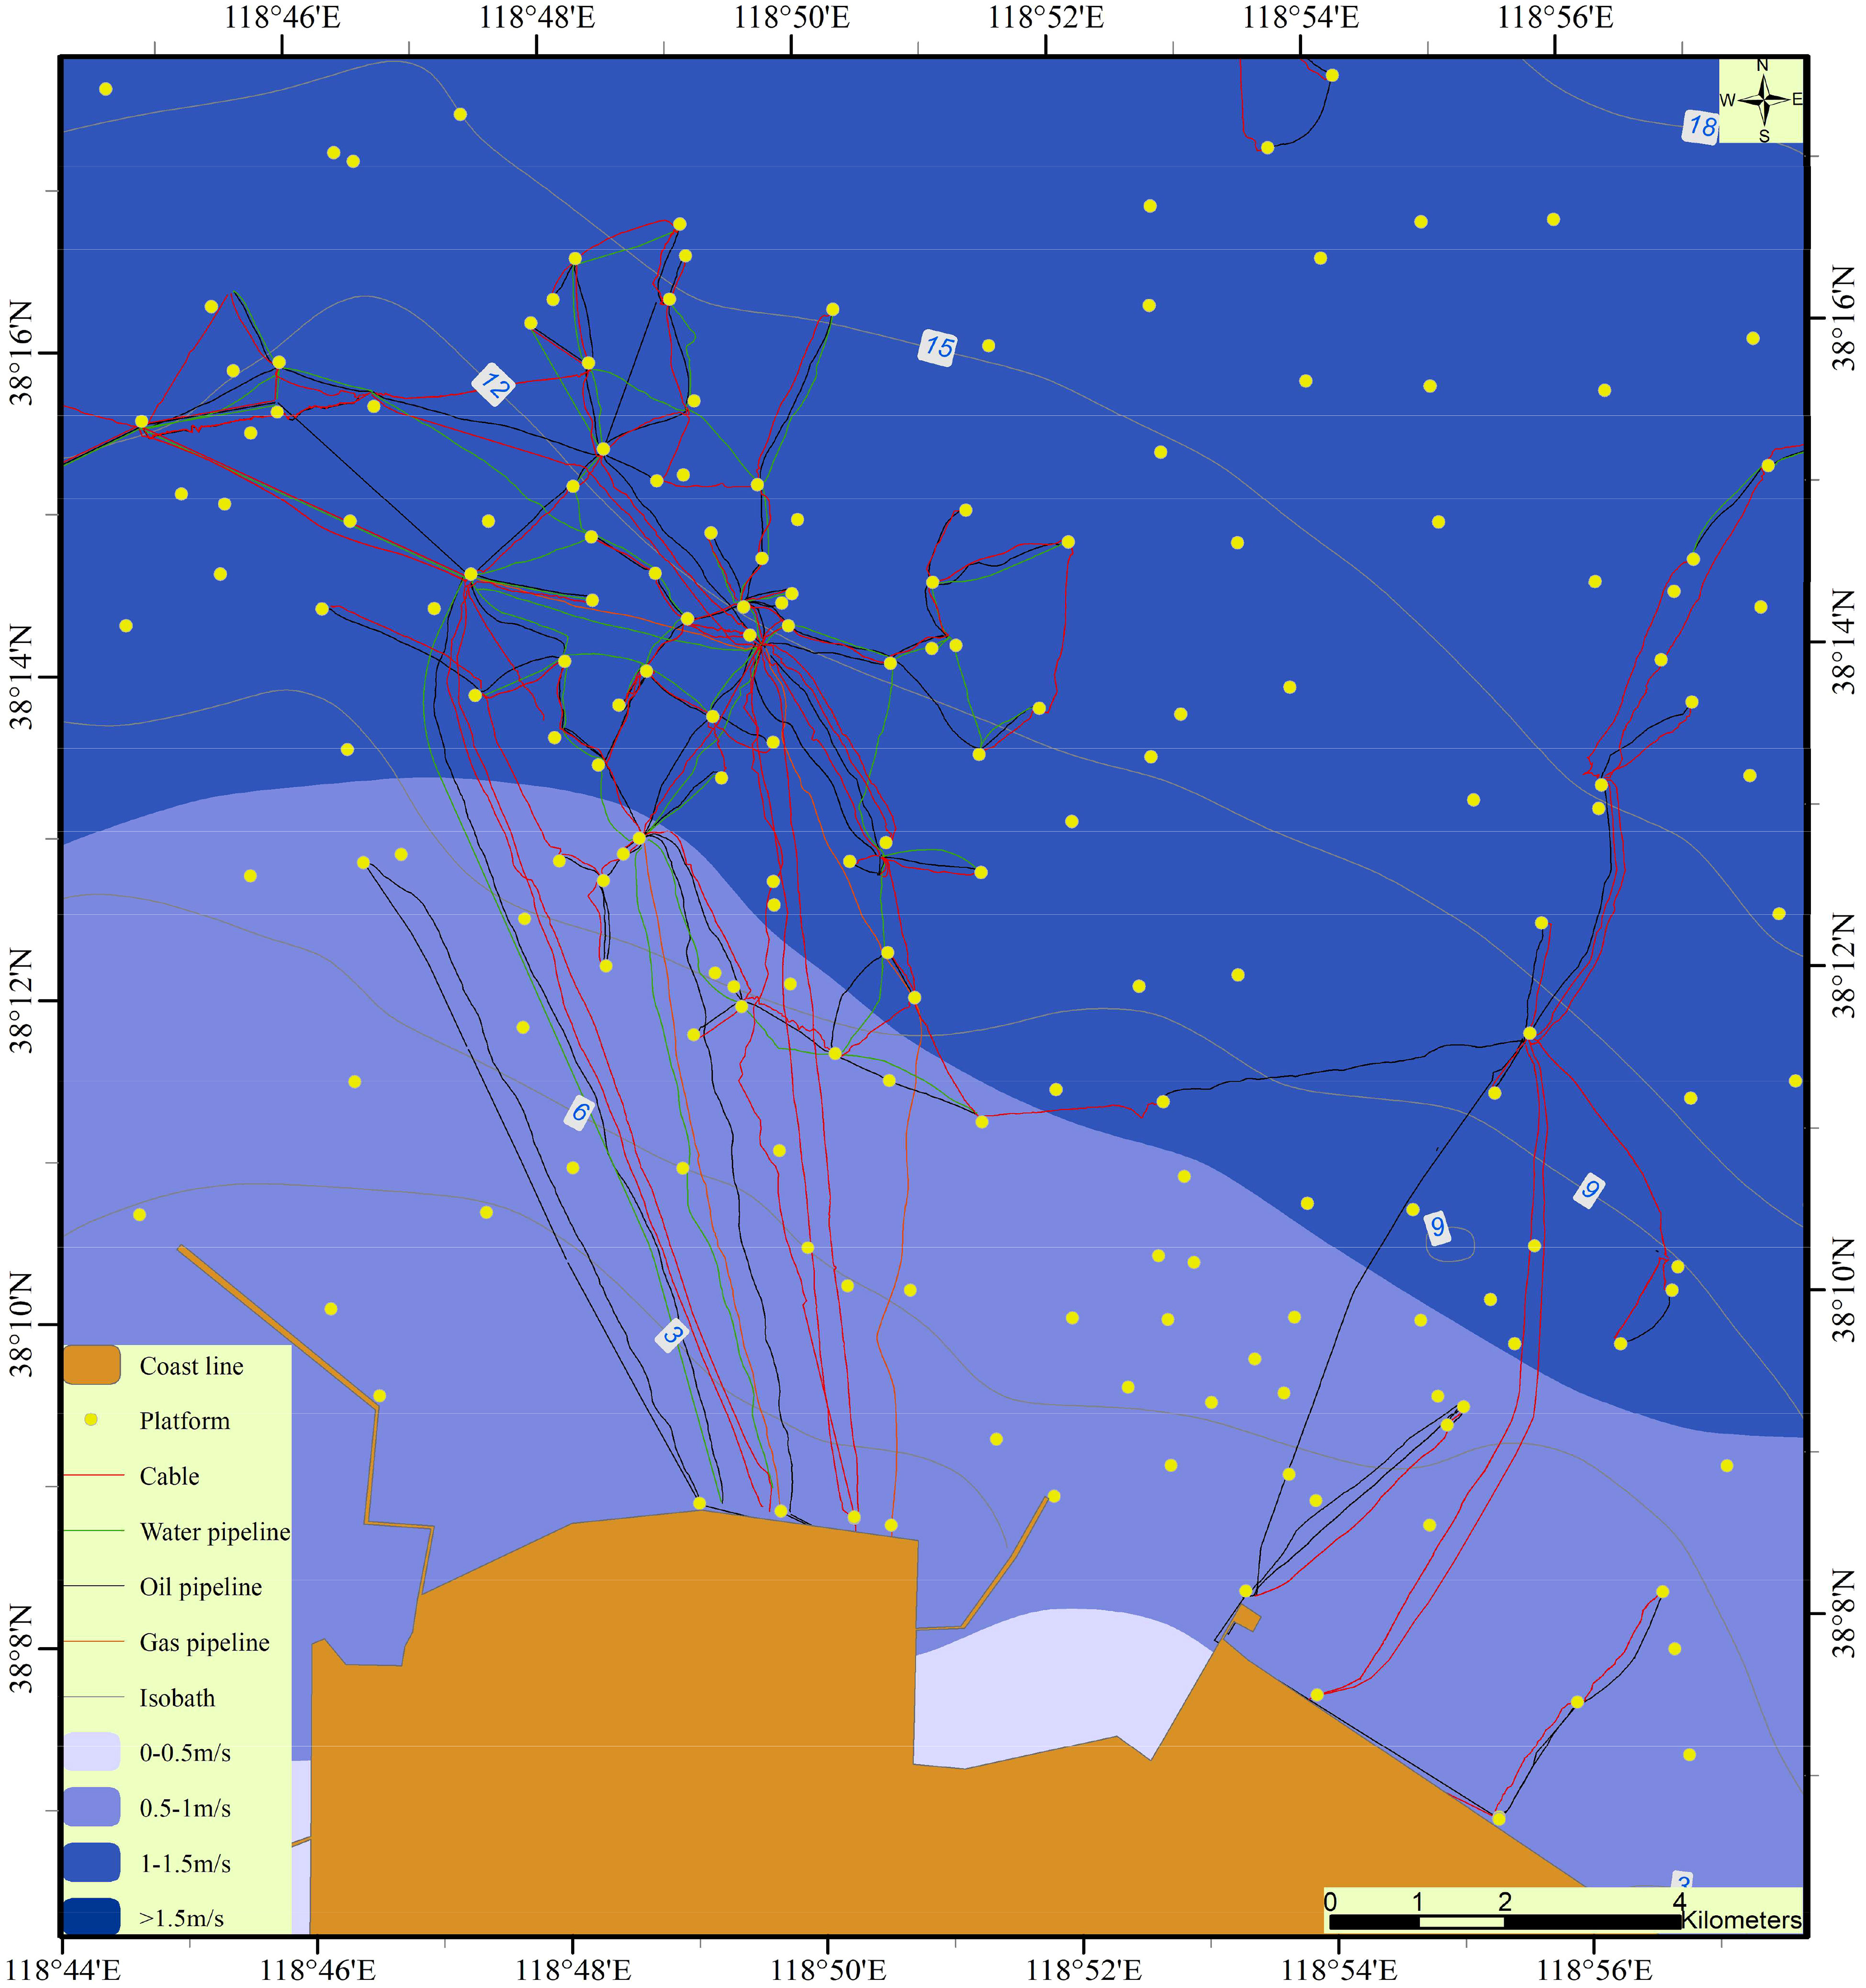
Figure 6 Grading evaluation of the bottom maximum flow velocity in the Chengdao area.
4.1.3 Zonation based on the surface soil bearing capacity in the Chengdao area
The bearing capacity is divided into four levels according to the size of the value (Figure 7). The bearing capacity is mainly related to the type of seabed sediments and the transformation by the wave dynamics. The area with a bearing capacity of less than 50 kPa in the study sea area is located at the northeast end where the water depth is greater than 15 m, and the main sediment type in this area is silty clay. Extending from this area, the bearing capacity of some of the areas between the 12 m and 15 m water depth isobaths is 50–80 kPa. The type of seabed sediments in this area is also silty clay, but the sediment type gradually transitions to silt as the water depth decreases. As the water depth decreases further, the remaining part is mainly the area with a bearing capacity of greater than 80 kPa. Among them, the vicinity of platforms CB4E, CB29, and CB243 and other platforms and the areas surrounding platforms CB5 and CB154 are the areas with a bearing capacity of greater than 110 kPa. In addition, the main part of the entire offshore oil production area, which extends toward the northwest to the boundary, is an area with a bearing capacity of greater than 110 kPa. The seabed sediments in this area are mainly silt, and in some places, they are silt sand, which has a high bearing capacity.
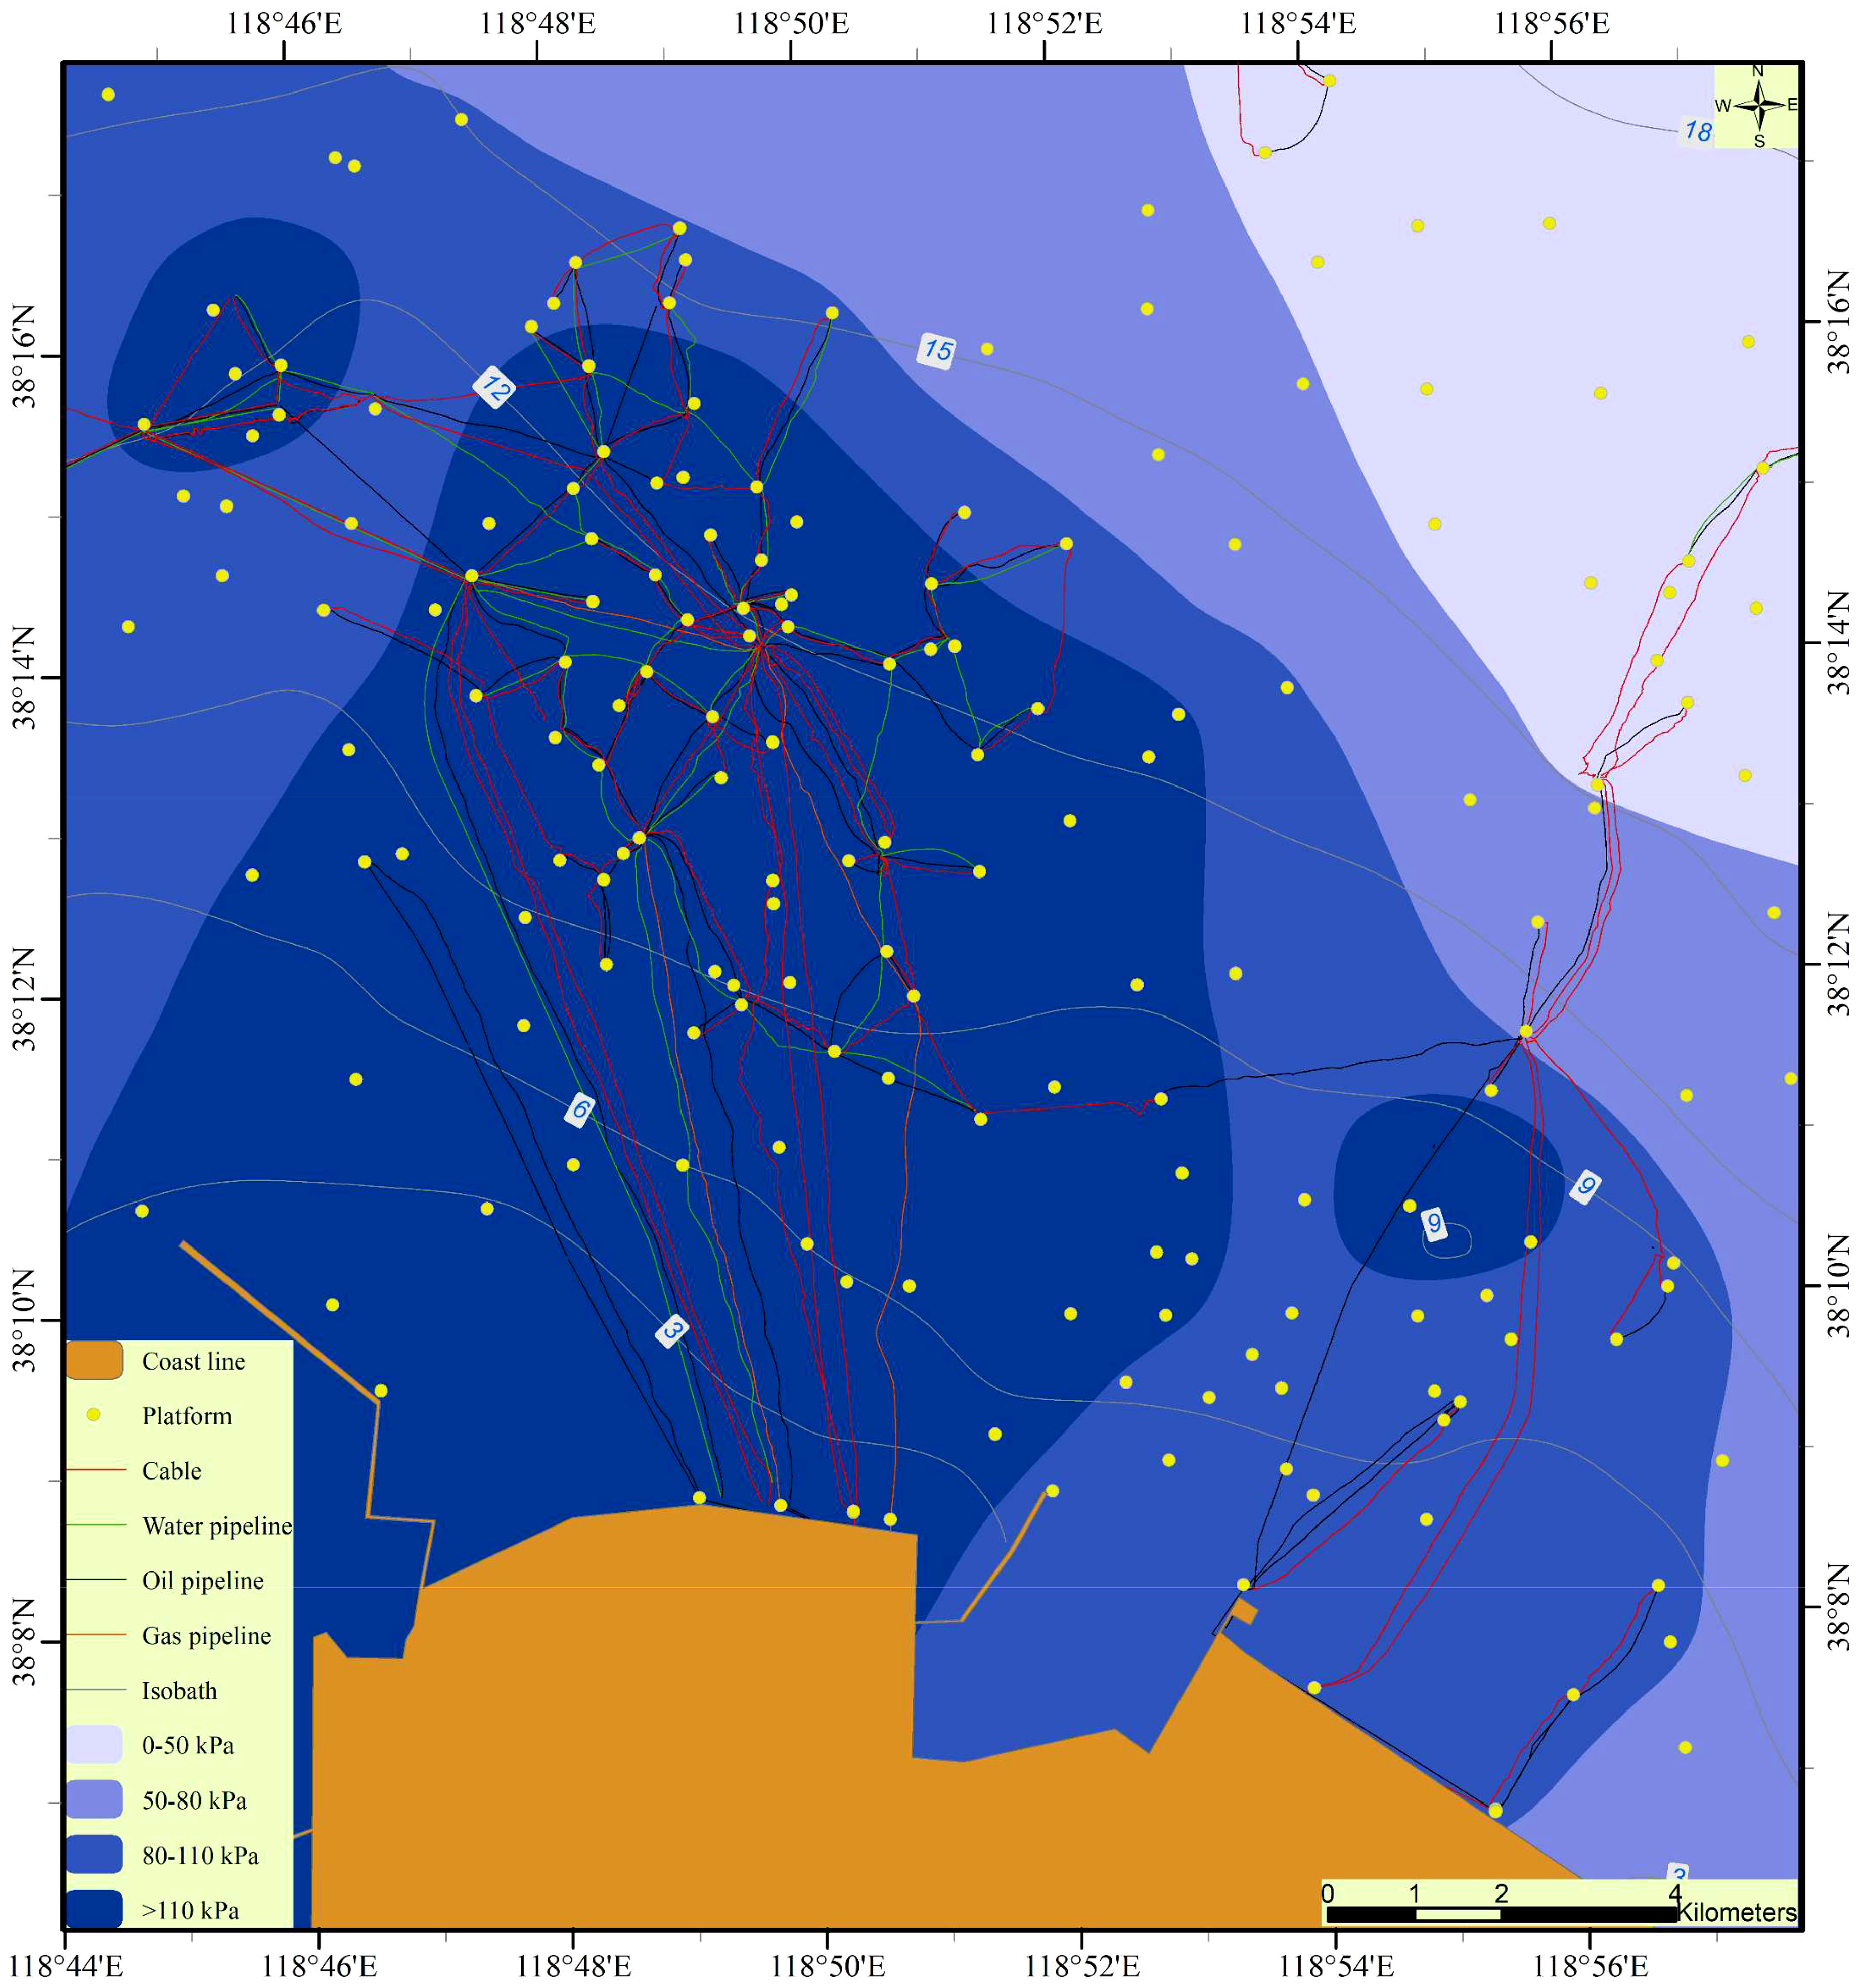
Figure 7 Grading evaluation of the bearing capacity of shallow soil in the Chengdao area.
4.1.4 Zonation based on the terrain slope in the Chengdao area
The terrain in the study area is relatively flat, and most of the area is within the 1/1000–1/500 level (Figure 8). In the area with greater water depths in the northeast, the slope is smaller, and the long axis of the shape of the area is parallel to the isobath. In the study area, there are two strips with large slopes, which are located near the 6 m water depth isobath and the 12 m isobath and are oriented parallel to the isobaths. The gradient changes are most obvious near these two strips, and the internal slope is greater than 1/1000. In the area with a slope of greater than 1/1000, some areas have a slope of greater than 1/500, indicating that the hydrodynamic effect is relatively strong in these areas, causing large fluctuations in the seabed topography.
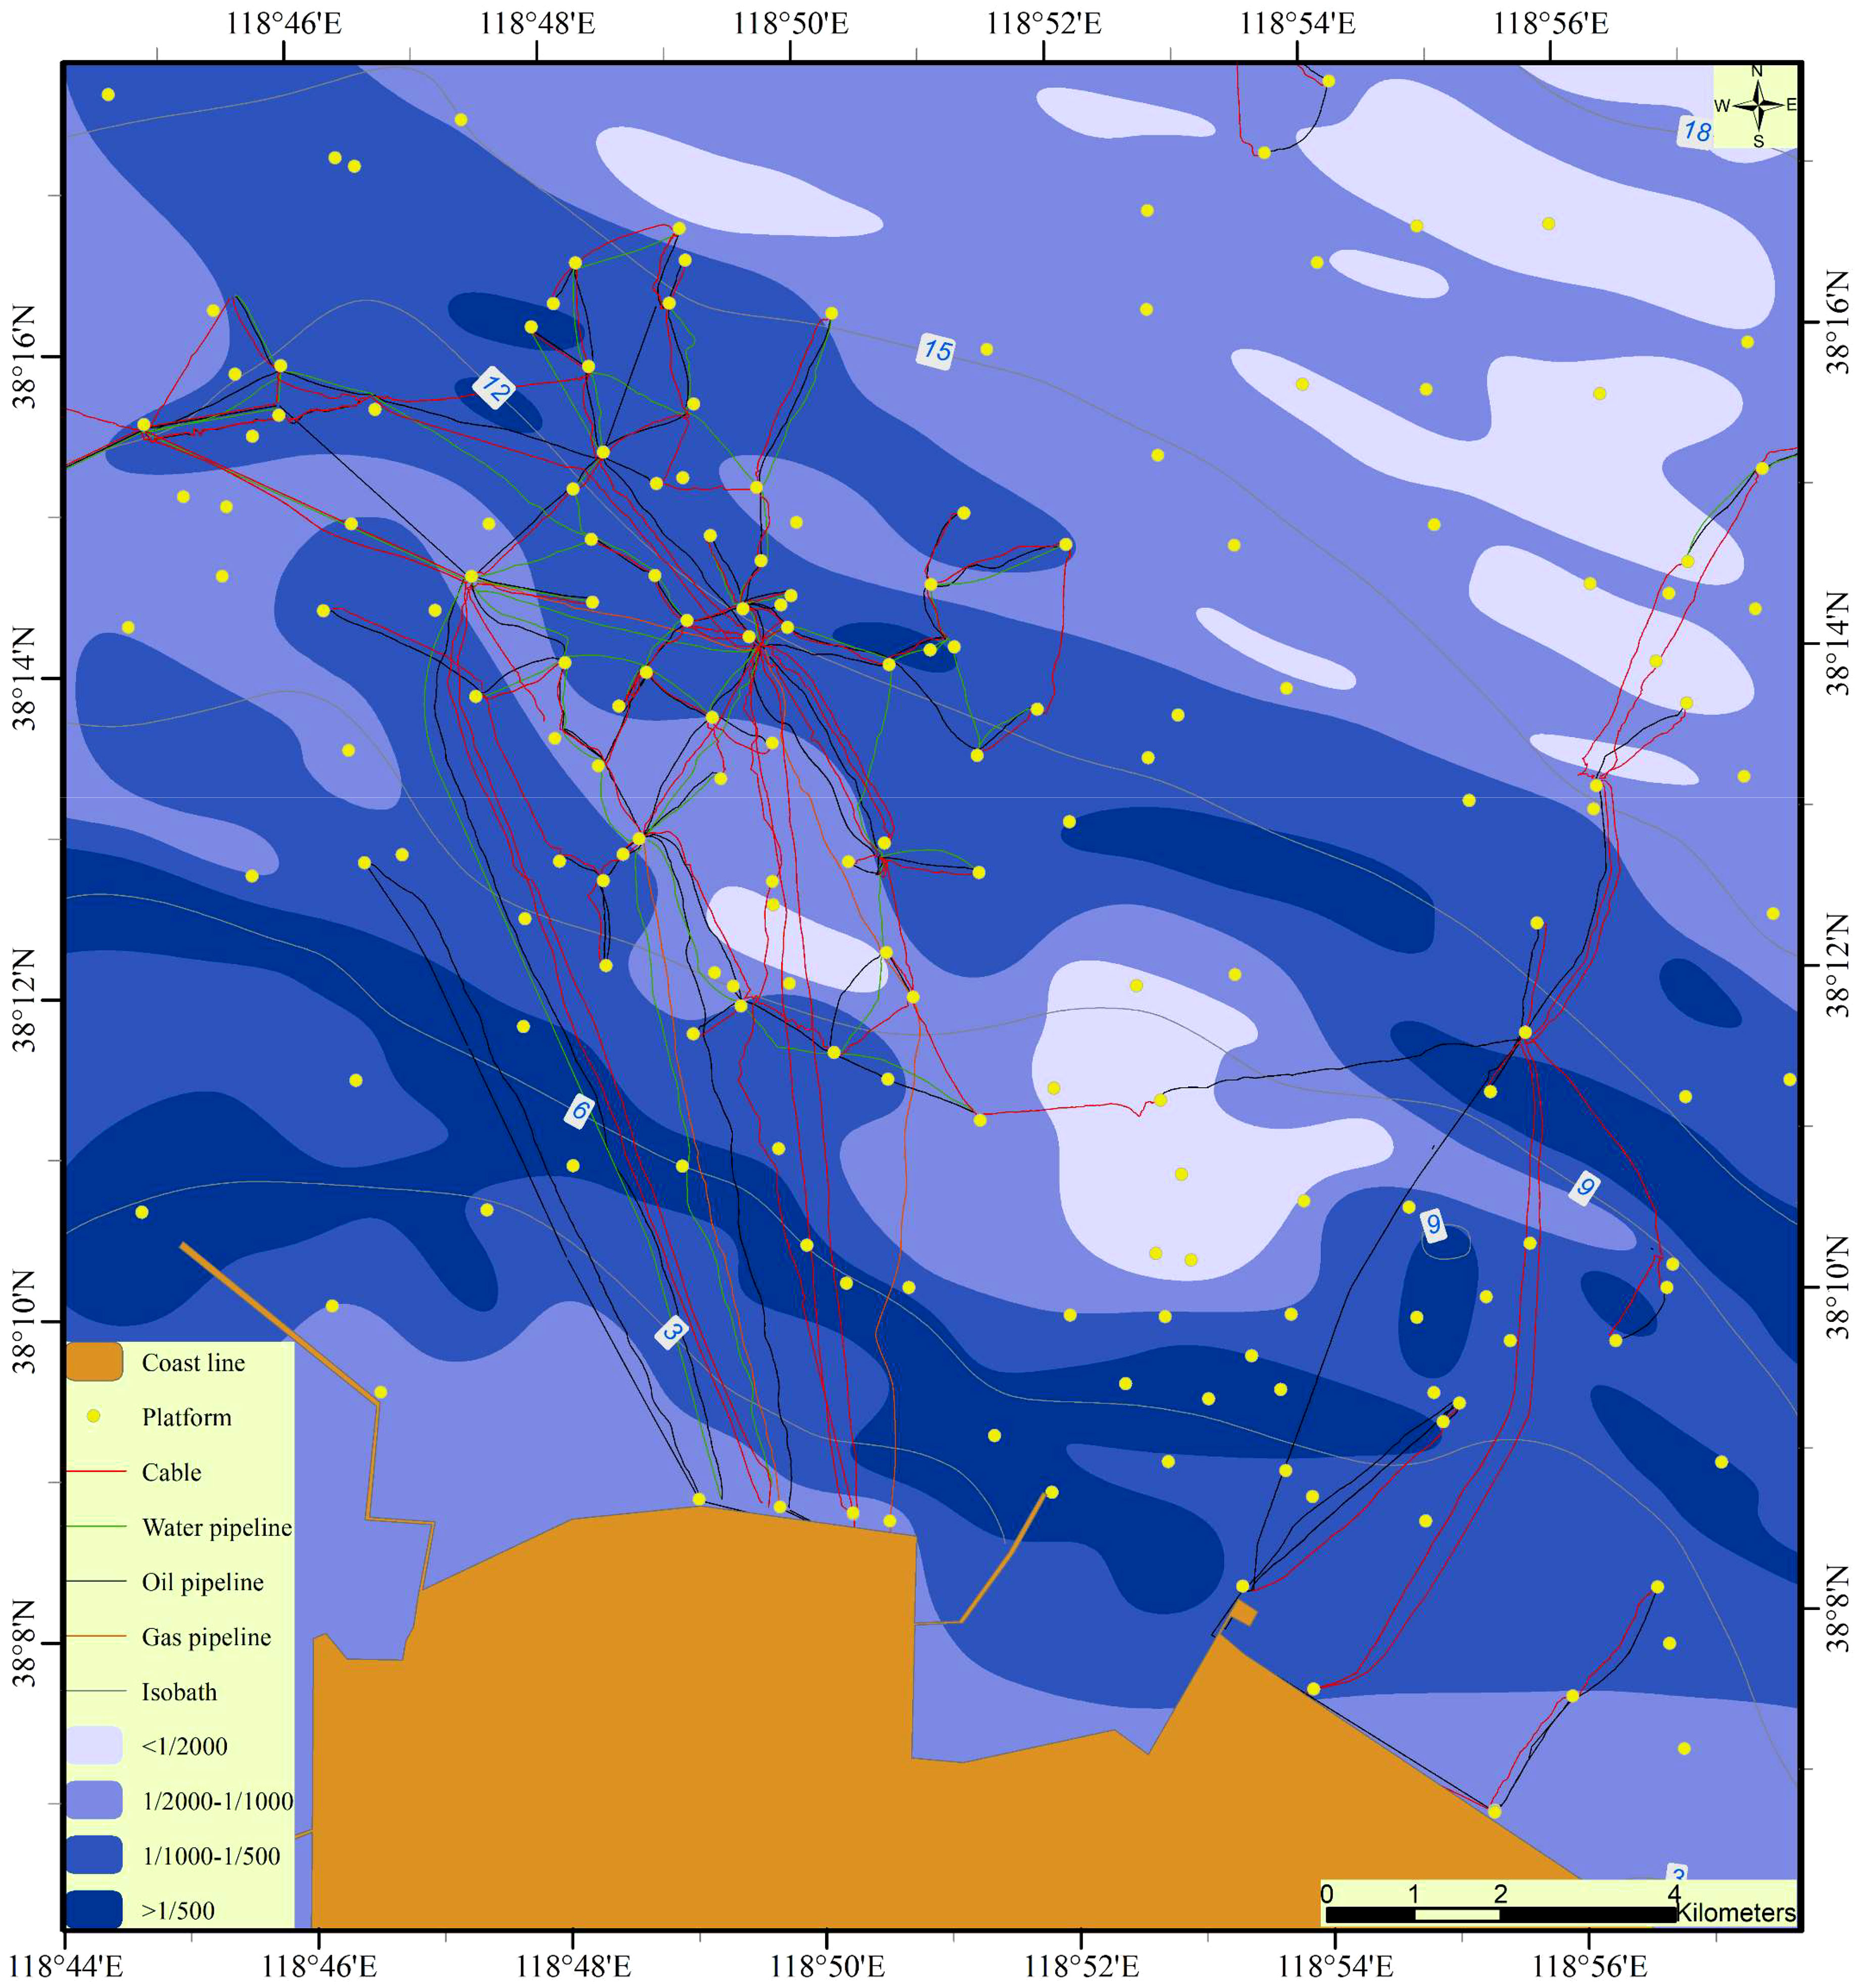
Figure 8 Grading evaluation of the terrain slope in the Chengdao area.
4.1.5 Zonation based on the soil liquefaction degree in the Chengdao area
The seabed sediments in the underwater delta of the Yellow River are mainly silt, which liquefies under strong hydrodynamic forces. According to the liquefaction limit depth of the seabed soil calculated under the action of waves of a 50-year return period, the liquefaction degree of the soil in the study area is divided into four levels (Figure 9). In the severe liquefaction areas, the sediment is silt that is prone to liquefaction, and the hydrodynamic effect is relatively strong. The actual data show that severe liquefaction has occurred in this area. In the moderate liquefaction areas, liquefaction is also more likely to occur, but the degree of liquefaction is smaller than that in the severe liquefaction areas. These areas are mainly distributed in the current estuary area. The degree of liquefaction in the slight liquefaction area is smaller, and liquefaction may occur, but the performance is not obvious. In the difficult to liquefy areas, the seabed sediments are not within the liquefiable range, are usually clay sediments or medium-sand and above coarse-grained sediments, and generally do not liquefy.
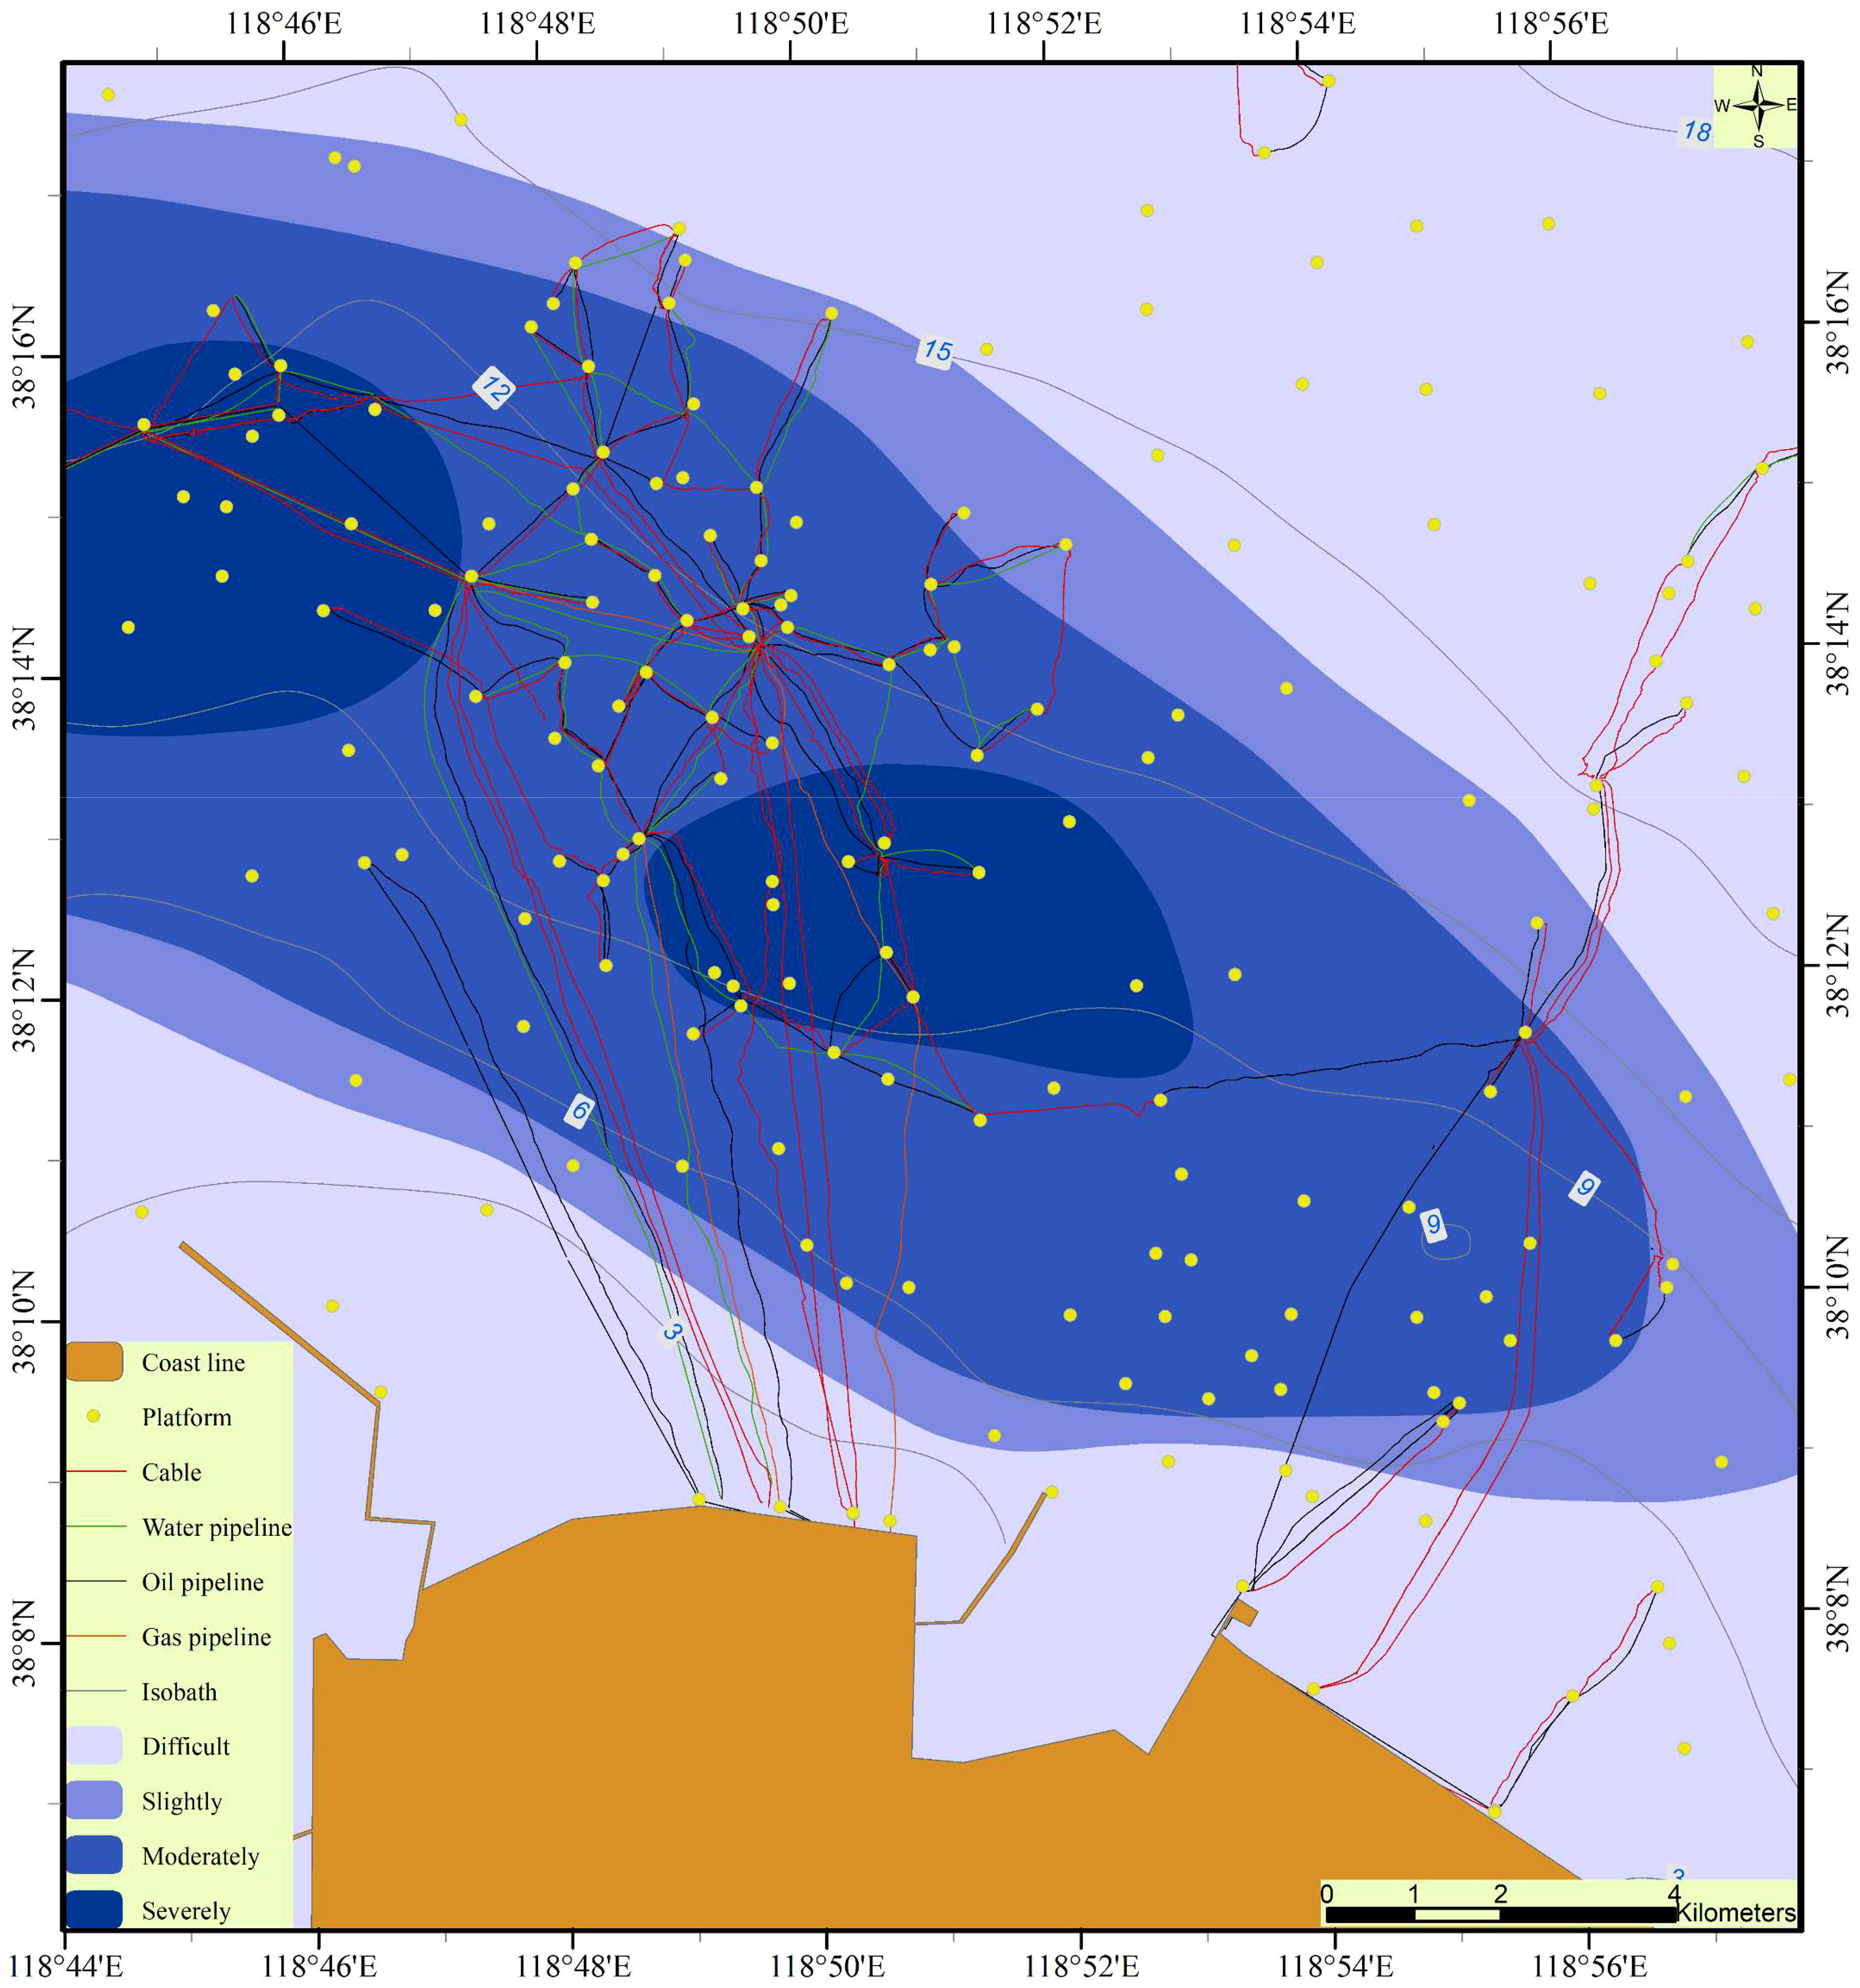
Figure 9 Grading evaluation of the liquefaction degree of soil in the Chengdao area.
The northeastern and southwestern parts of the study area are not easily liquefied. When the water depth is greater than 15 m, it is difficult for the wave conditions in this study area to generate sufficient cyclic loads on the seabed to make it liquefy. When the water depth is less than 5 m, the wave breaks and the wave energy gradually decreases, making it difficult to liquefy the sediment. The slight liquefaction area is roughly located between the 5–6 m and 13–15 m isobaths, and the strike has a strong correlation with the water depth line. This area is located in the transition area between the easy to liquefy area and the difficult to liquefy area, so it belongs to the slight liquefaction area. The sediment type in the medium liquefaction area is mainly silt that is easy to liquefy, and the wave conditions in this area are sufficient to generate large cyclic loads that can cause liquefaction. However, affected by the thickness of the liquefiable sediments on the seafloor surface, the maximum liquefaction depth is limited to the surface thickness. Therefore, the severe liquefaction zone only exists in two regions, which have thicker liquefiable surface silt layers.
4.1.6 Zonation based on the developed geological hazards in the Chengdao area
The liquefaction process of the silt seabed caused by the hydrodynamic action in the Chengdao area can form obvious disturbed strata, which can even further develop into geological disasters such as silt flows and subsidence pits. Based on the distribution of the developed liquefied disturbed formations, silt flows and subsidence were observed during the survey. The distribution of the developed geological hazards in the Chengdao area is shown in Figure 10. When carrying out engineering construction in disaster areas, it is necessary to conduct detailed geophysical prospecting and drilling surveys to understand the possibility of potential geological disasters and their impacts.
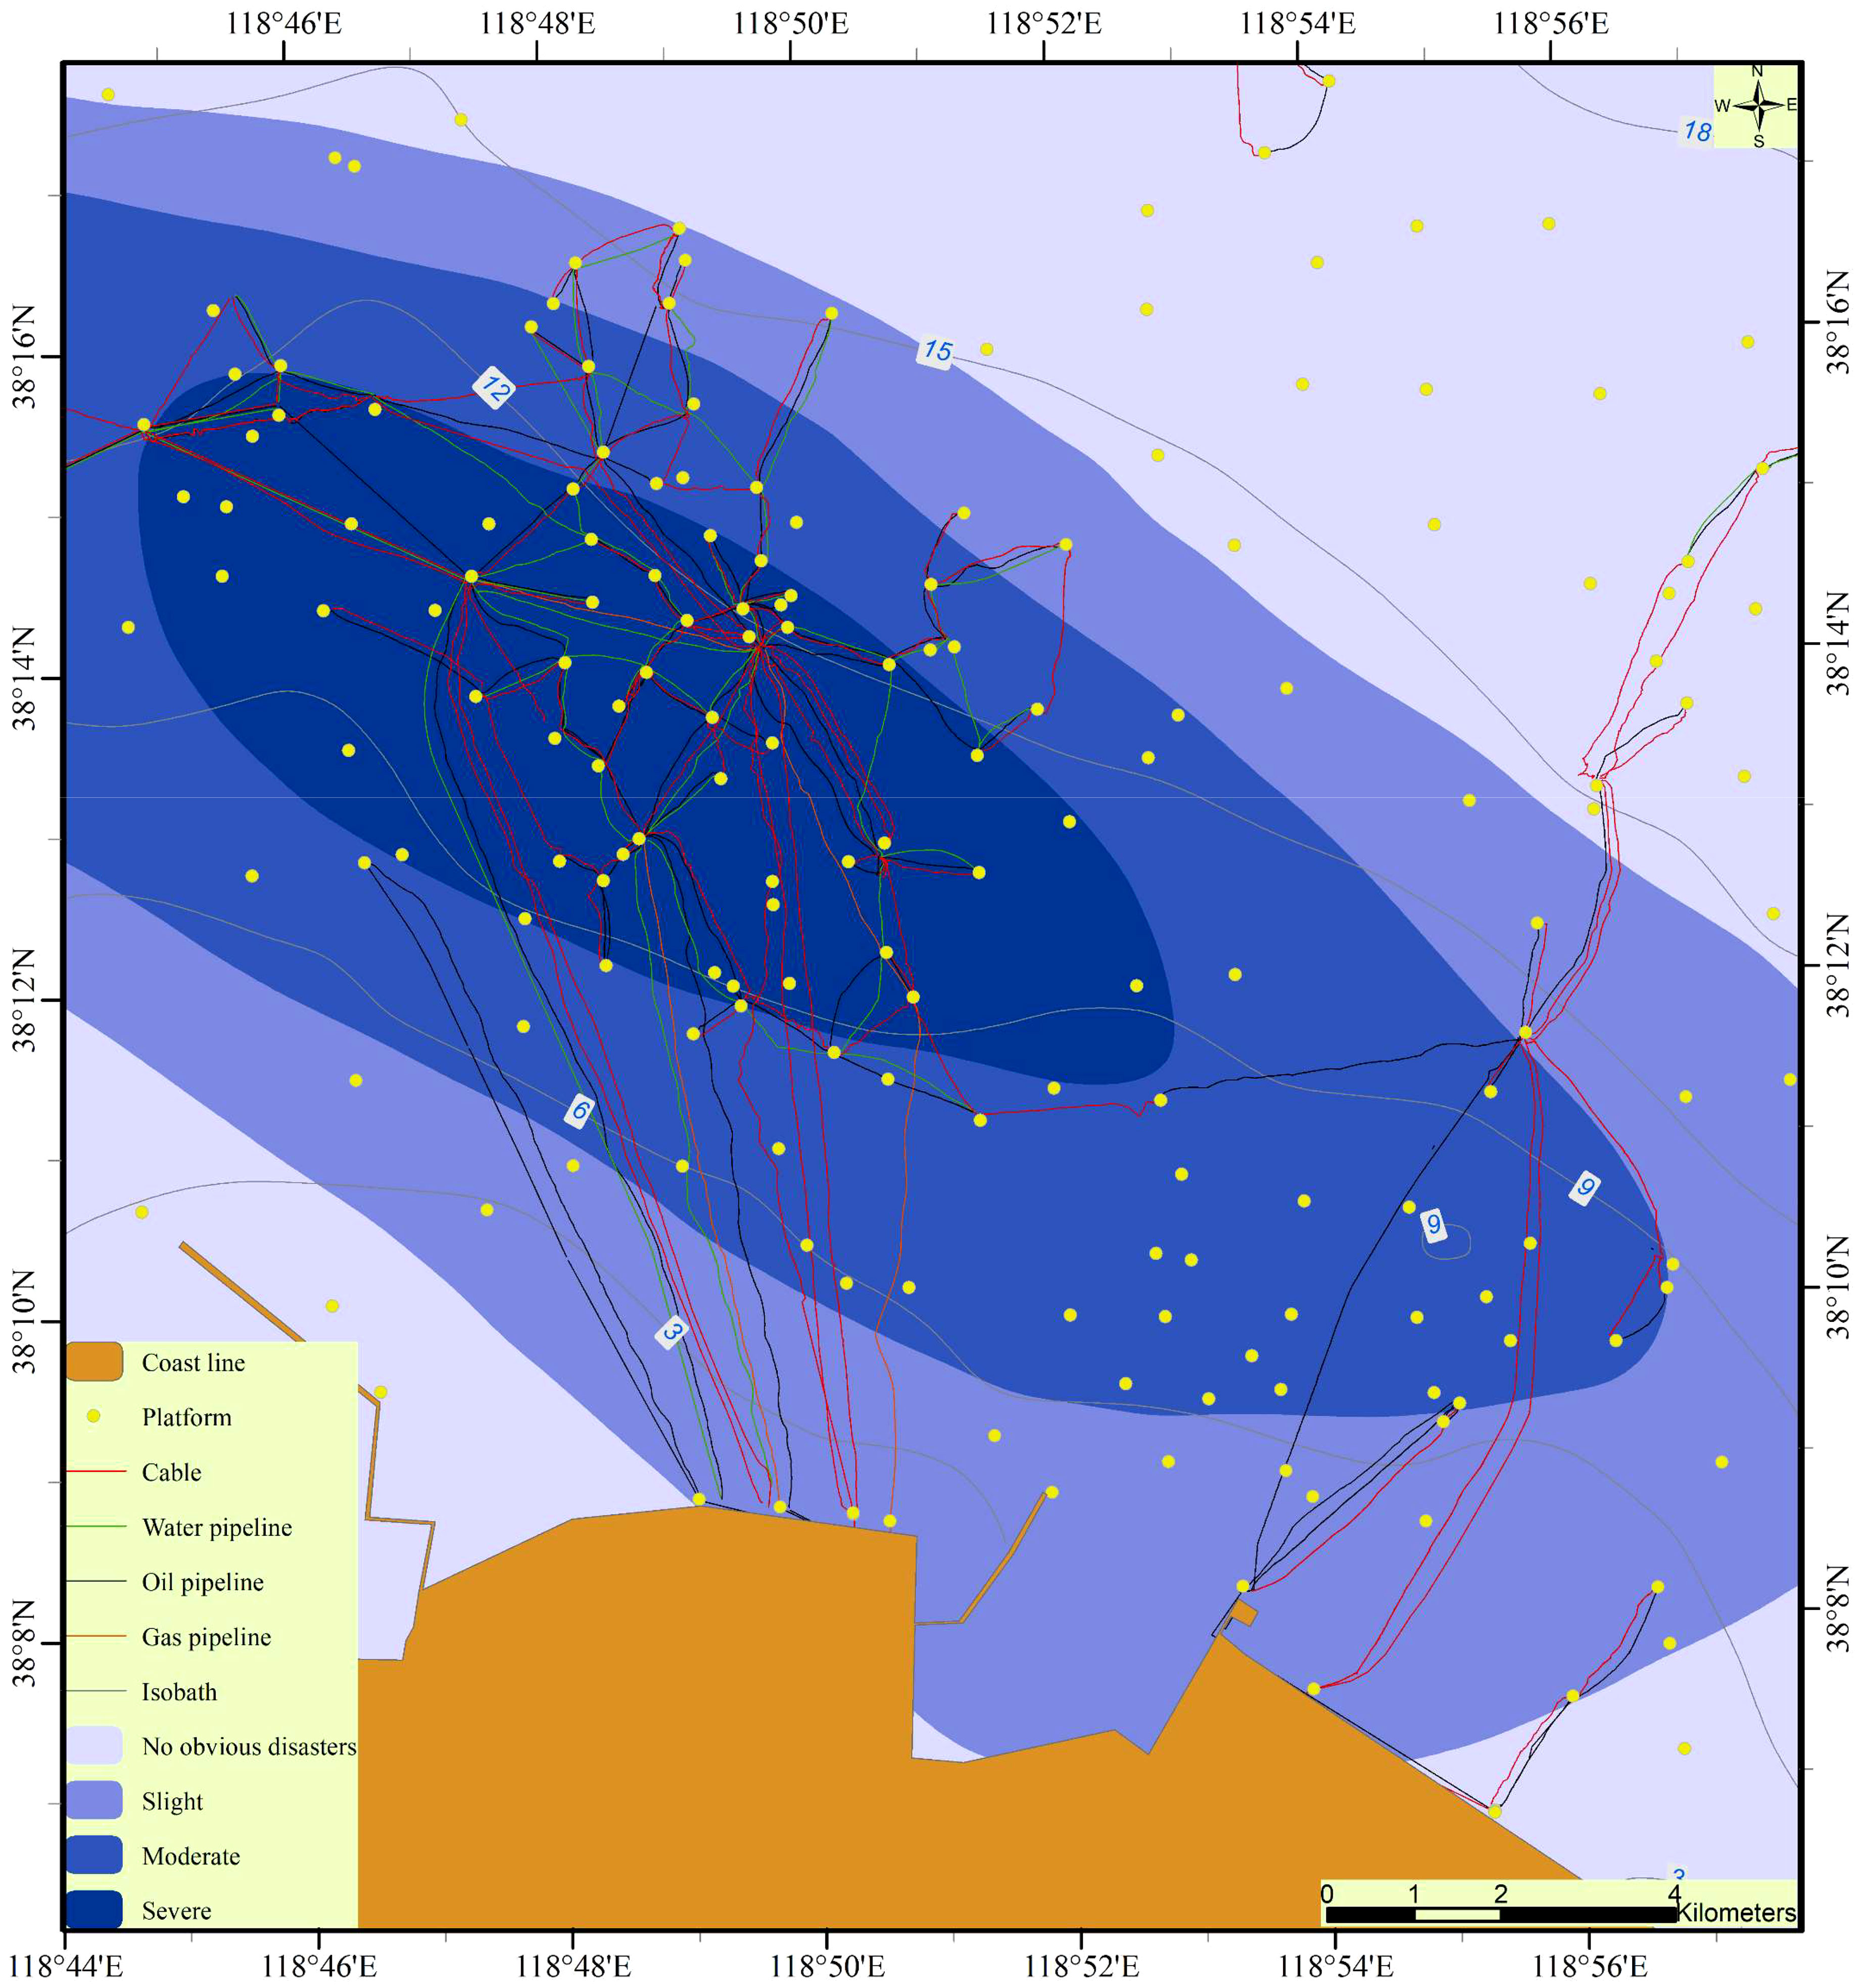
Figure 10 Grading evaluation of the developed geological hazards in the Chengdao area.
Affected by the liquefaction zone, the severe liquefaction areas are mainly distributed in the positions where the oil production platforms are widely distributed and the water depth is 9–12 m. The long axis of this area is parallel to the water depth isobath. The moderate liquefaction area is located on the periphery of the severe liquefaction area, between the 6–14 m water depth isobaths. The slight liquefaction area is located in the area with water depths of between 3 and 15 m, which extends from northwest to southeast.
4.1.7 Zonation based on the annual mean scouring and deposition in the Chengdao area
The average annual scouring and deposition in most of the Chengdao area is in a moderate even severe state (Figure 11), which is mainly distributed in shallow sea area with water depth less than 15m. The severe affected area extends from northwest to southeast until it intersects with the shoreline and is larger in the southeast of the study area. The sea area with water depth greater than 15m is basically in a state of dynamic balance.
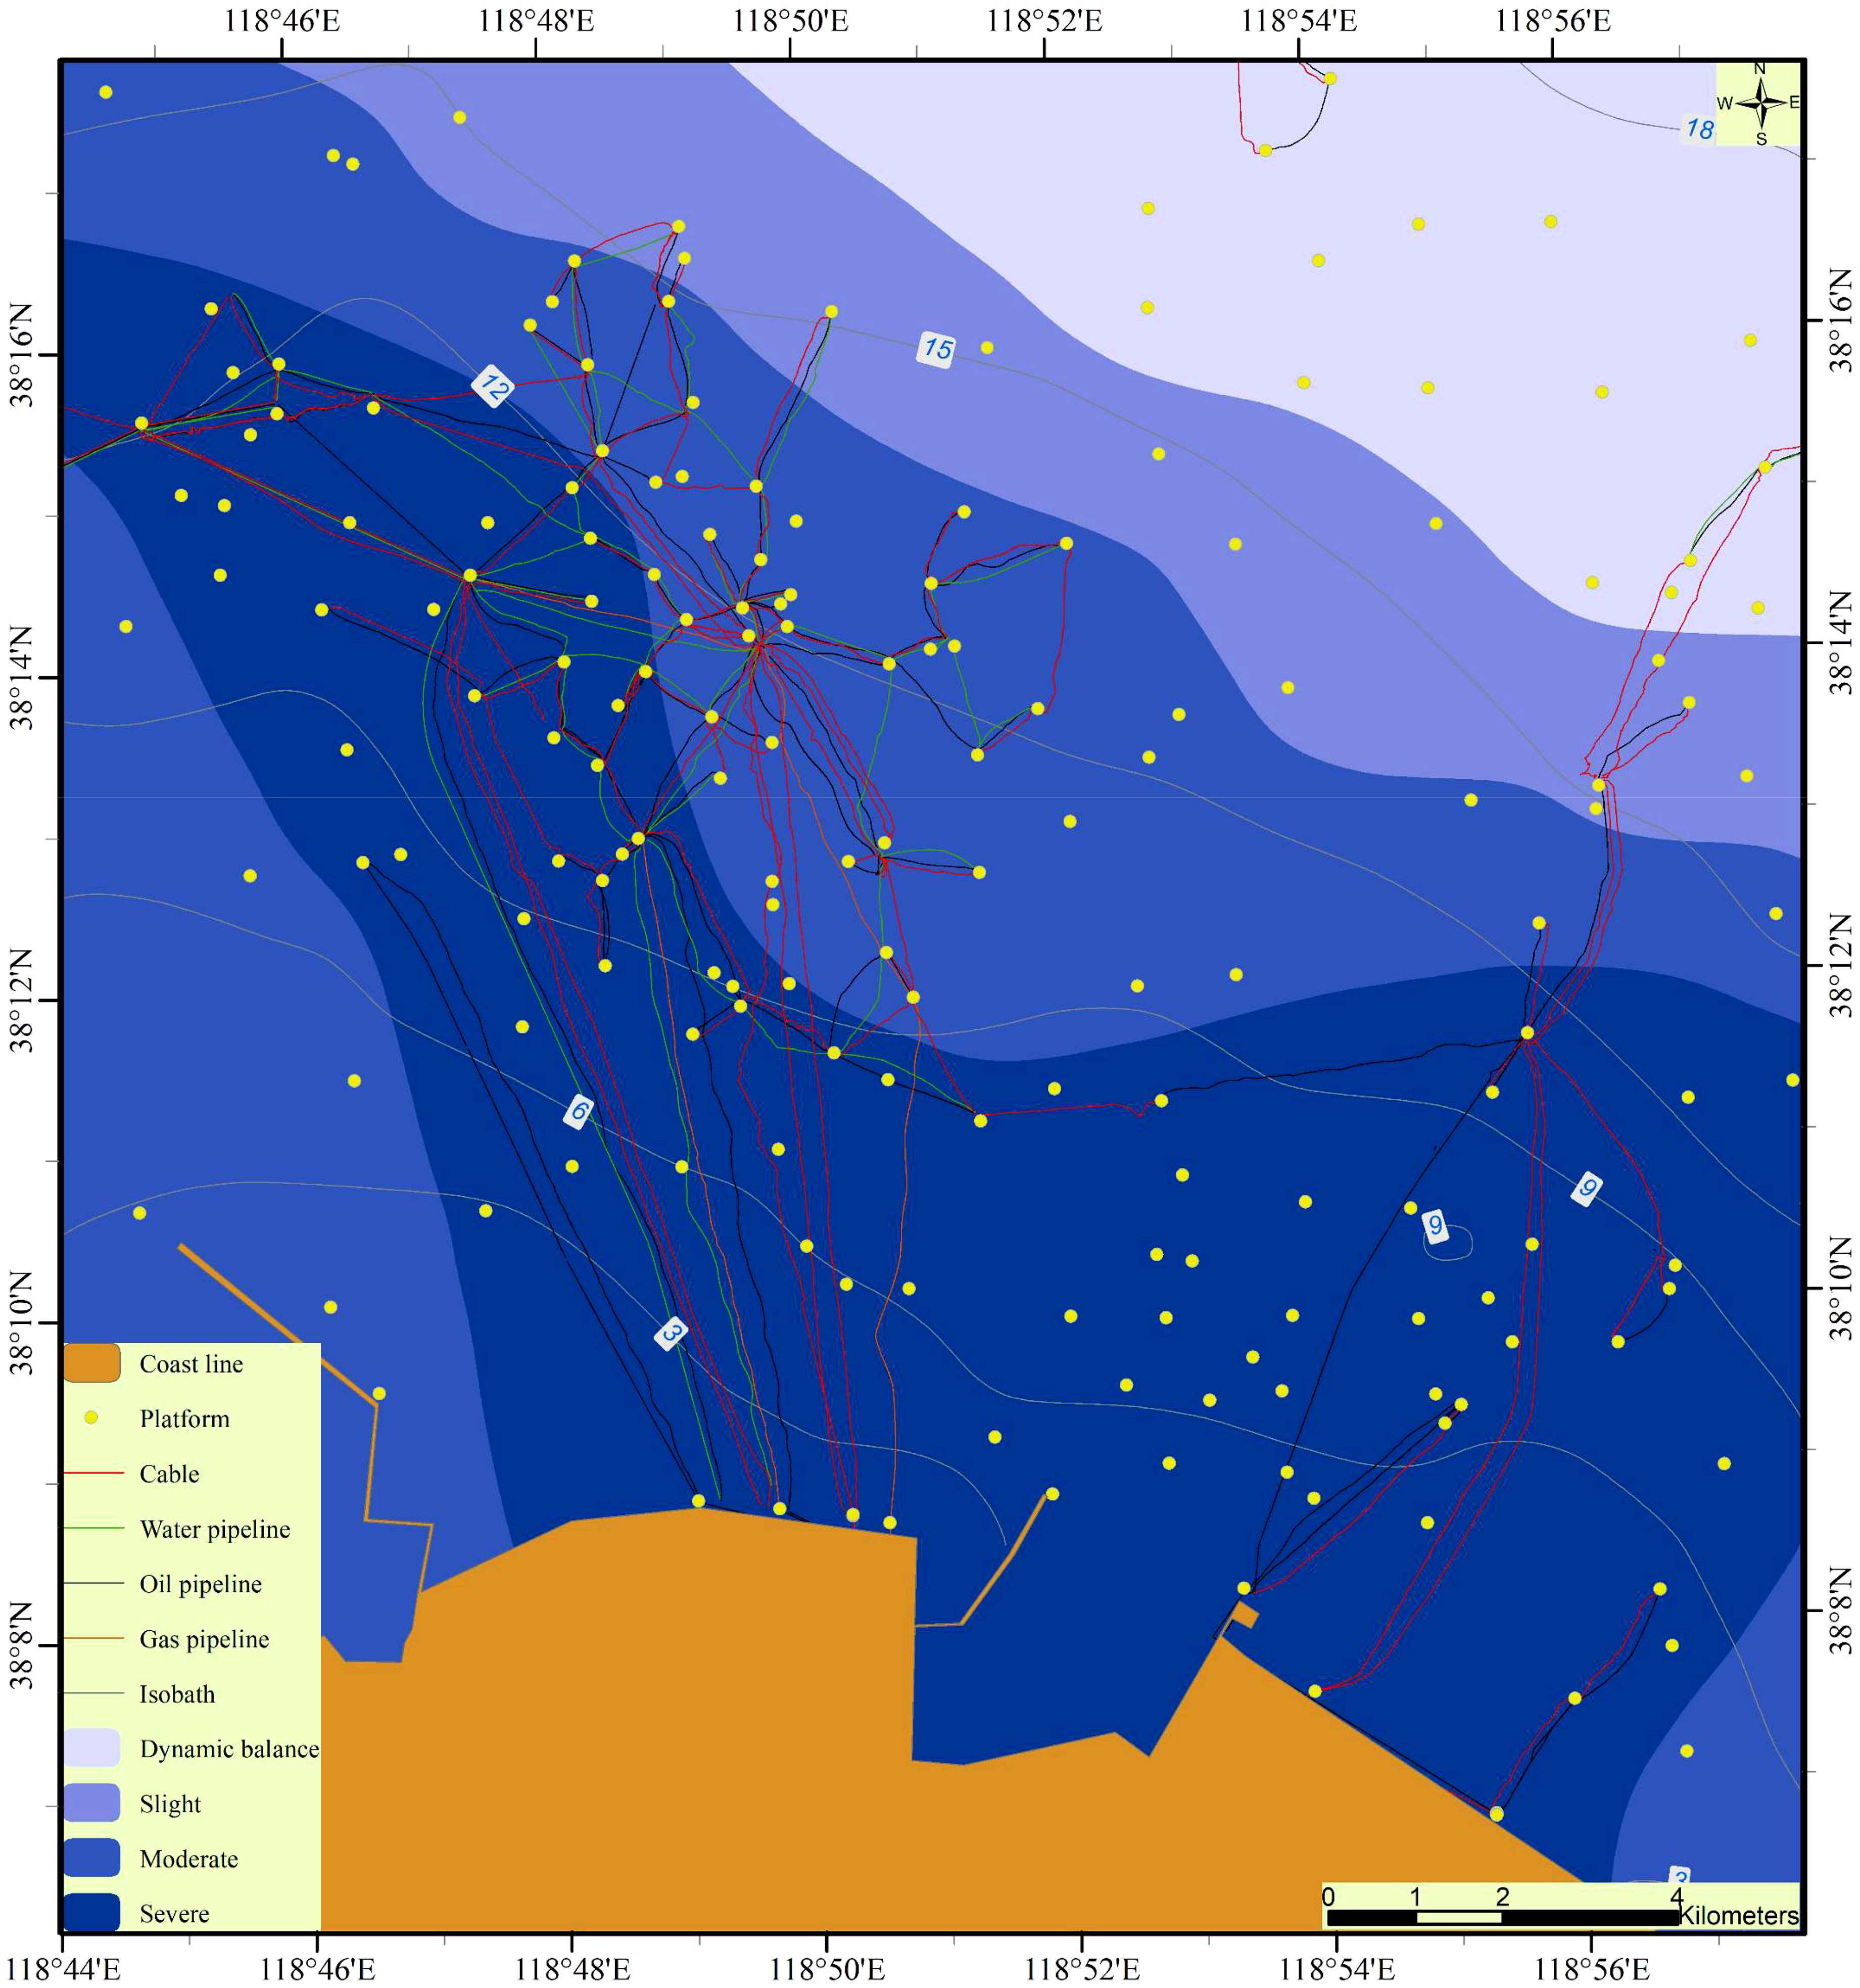
Figure 11 Grading evaluation of average annual scouring and silting amount in the Chengdao area.
4.1.8 Zonation based on the project development impact in the Chengdao area
The Chengdao area is the main area of the Shengli Offshore Oilfield, and there are many oil production platforms and submarine umbilical cables in this area. The project development impact areas are divided into four categories: the core area, buffer area, potential impact area, and unaffected area. It can be seen from Figure 12 that the core area is closely surrounded by engineering structures and is mainly distributed in the western part of the study area as a band-shaped area perpendicular to the shoreline. The buffer area and the potential impact area extend outward in turn, and the rest of the area is the unaffected area. In general, due to the influence of the widely distributed engineering facilities in this region, the project influence areas occupy a significant portion of the region.
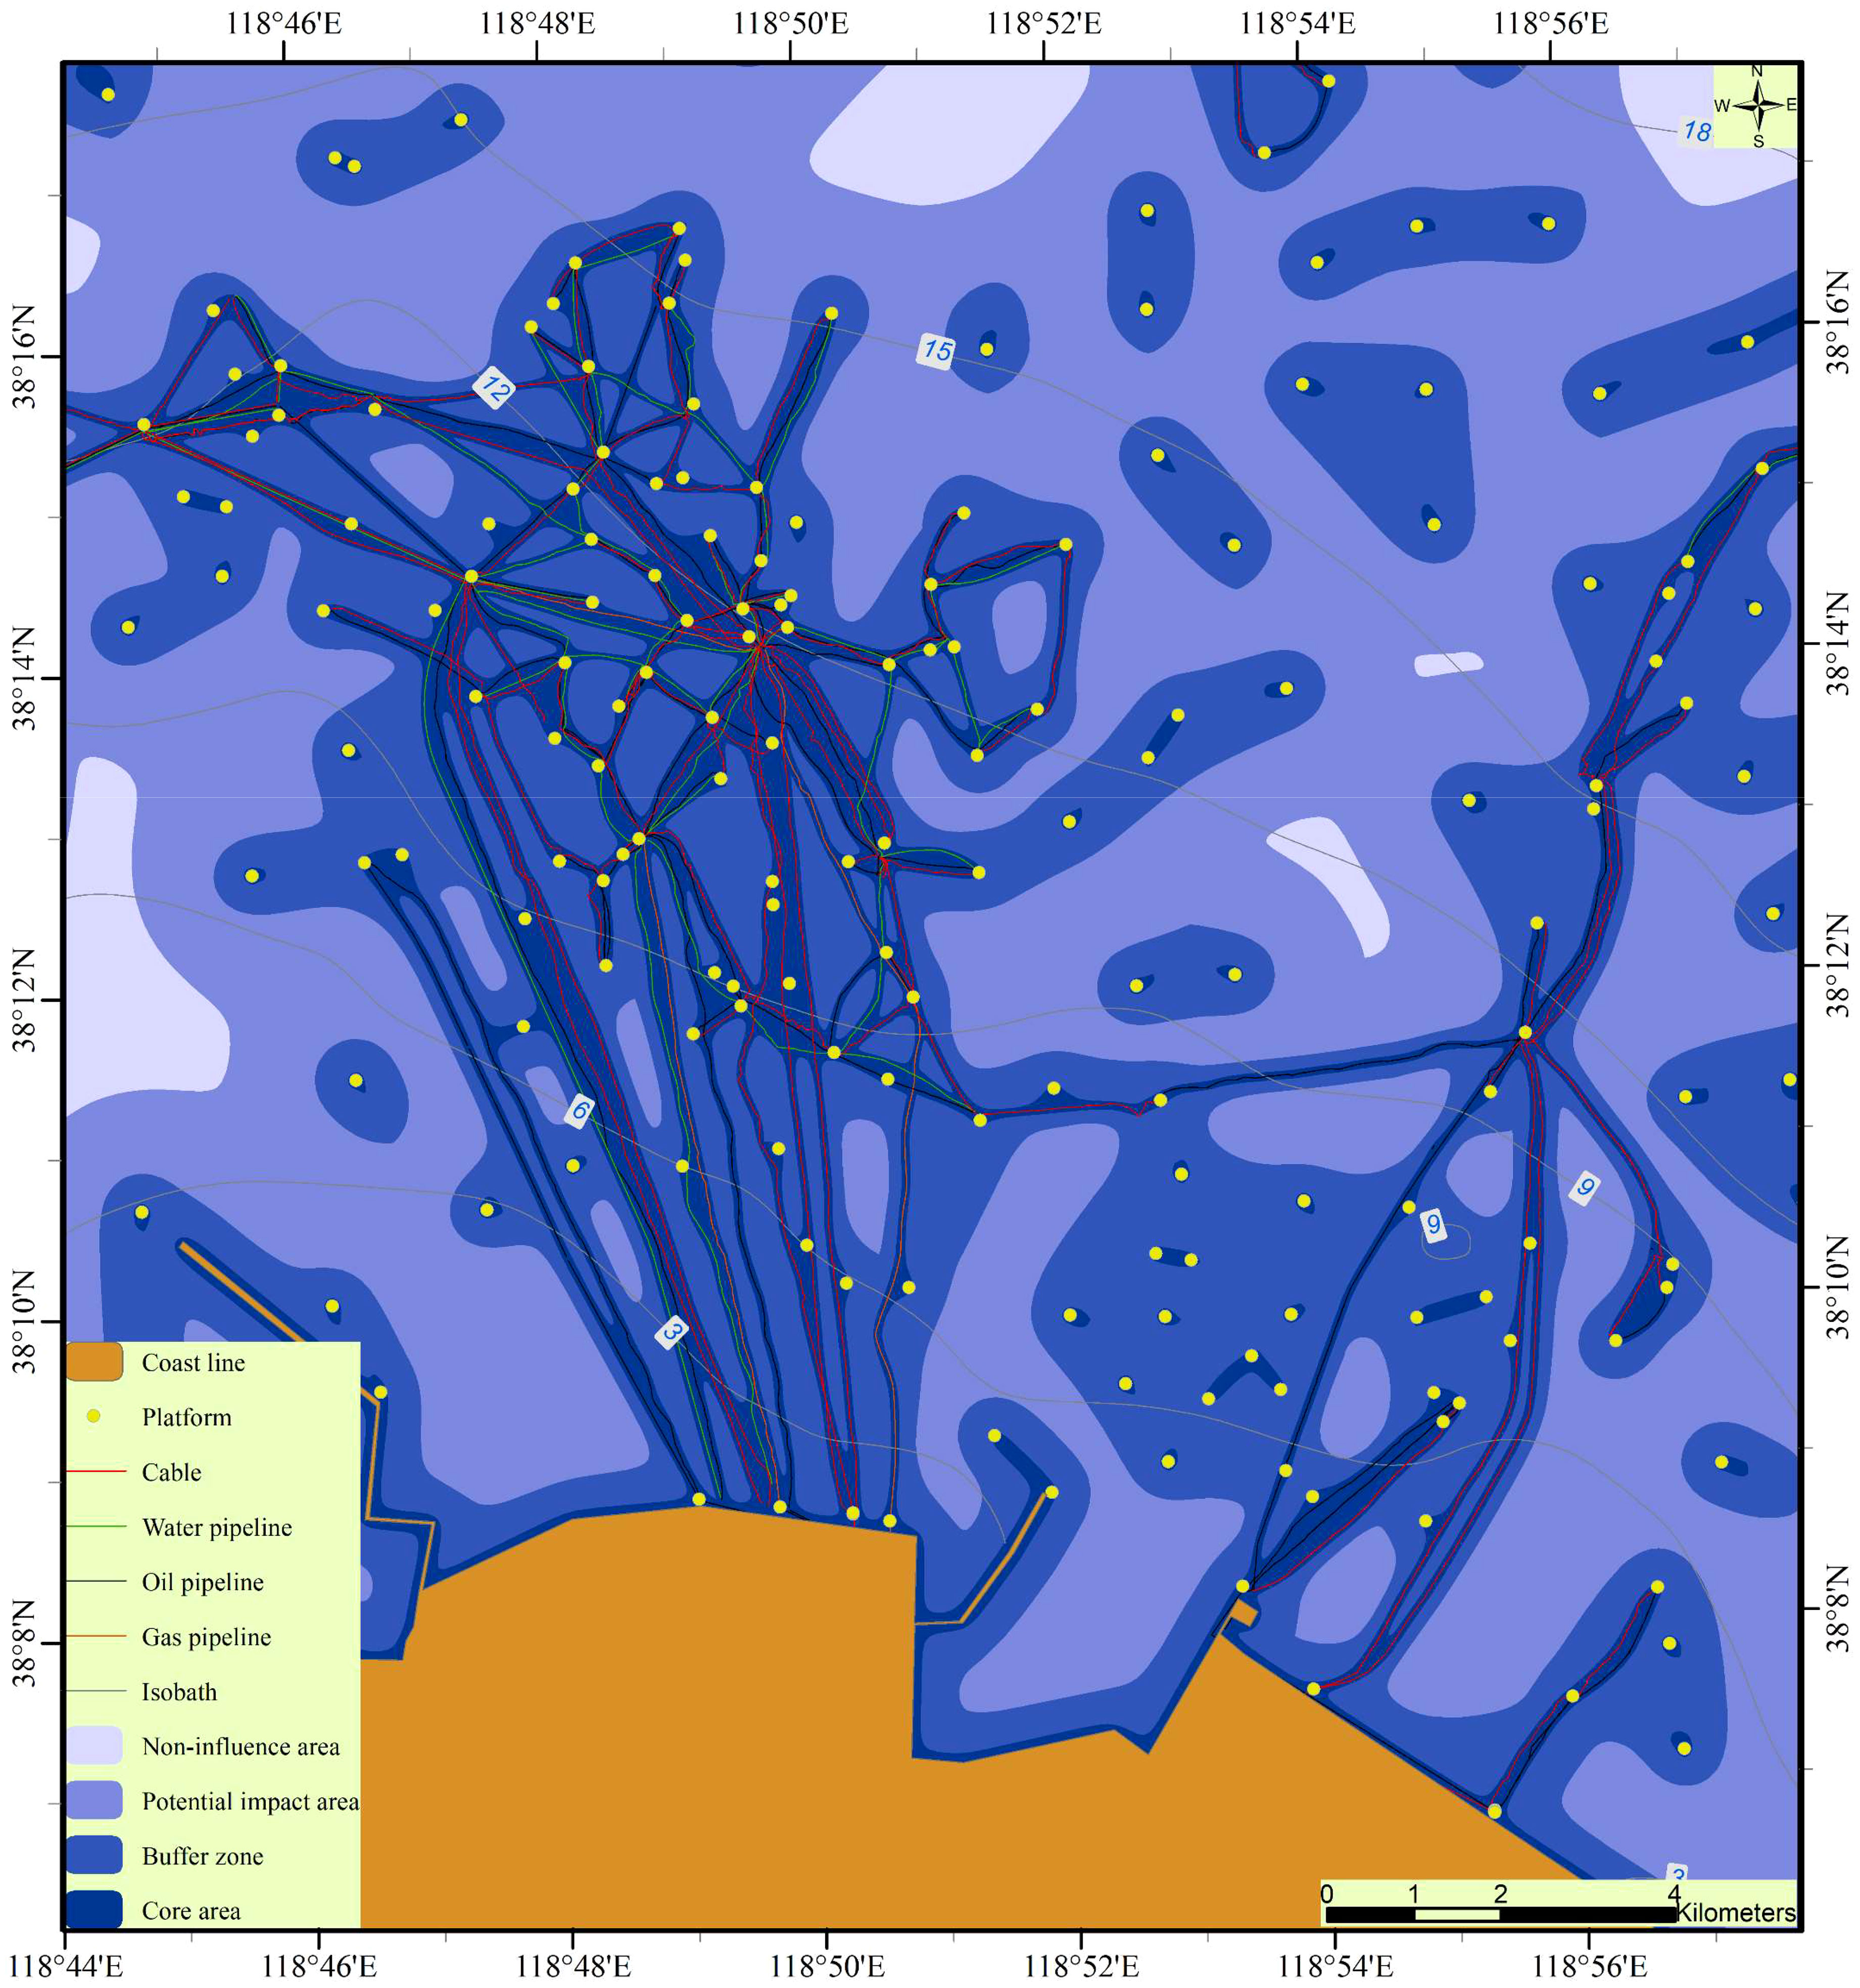
Figure 12 Grading evaluation of the engineering effects area in the Chengdao area.
4.2 Comprehensive geological hazard risk zonation results
The comprehensive risk zonation map of geological hazards in the Chengdao area is shown in Figure 13. The distribution is roughly parallel to the isobaths. The geological hazard risk can be divided into four levels: low risk, relatively low risk, relatively high risk, and high risk. The low-risk areas are mainly distributed above the 3 m water depth contour at the southwest end of the study area. The water depth at this location is shallow, the seabed sediment type is silt, the bearing capacity is relatively high, the hydrodynamic effect is relatively weak, and there are few areas where geological hazards and human engineering activities have developed. Therefore, this area is a stable area that is not prone to geological disasters. The relatively low-risk areas are mainly distributed in water depths of between 3–6 m and 13–15 m and in the southeast end of the study area, and these areas are distributed in a circular shape as a whole. Compared with the low-risk area, the water depth, terrain slope, human activities, degree of easy liquefaction, and degree of geological hazard development are all greater. Therefore, the degree of the occurrence of geological disasters is greater, but not to the extent that these areas are prone to occur. The relatively high-risk areas are mainly distributed in water depths of 6–9 m, 12–13 m, and >15 m. Compared with the relatively stable areas, the hydrodynamic conditions, human engineering activities, and developed geological disasters in this area continue to strengthen, so the occurrence of geological disasters continues to increase. In addition, since the bottom sediment type in the area with water depths of >15 m gradually transitions from silt to silty clay, the bearing capacity of the foundation is very small, so this is also a relatively high-risk area. The area with water depths of 9–12 m is a high-risk area, in which the hydrodynamic effects are strong, human engineering activities are more numerous, and geological hazards have seriously developed.
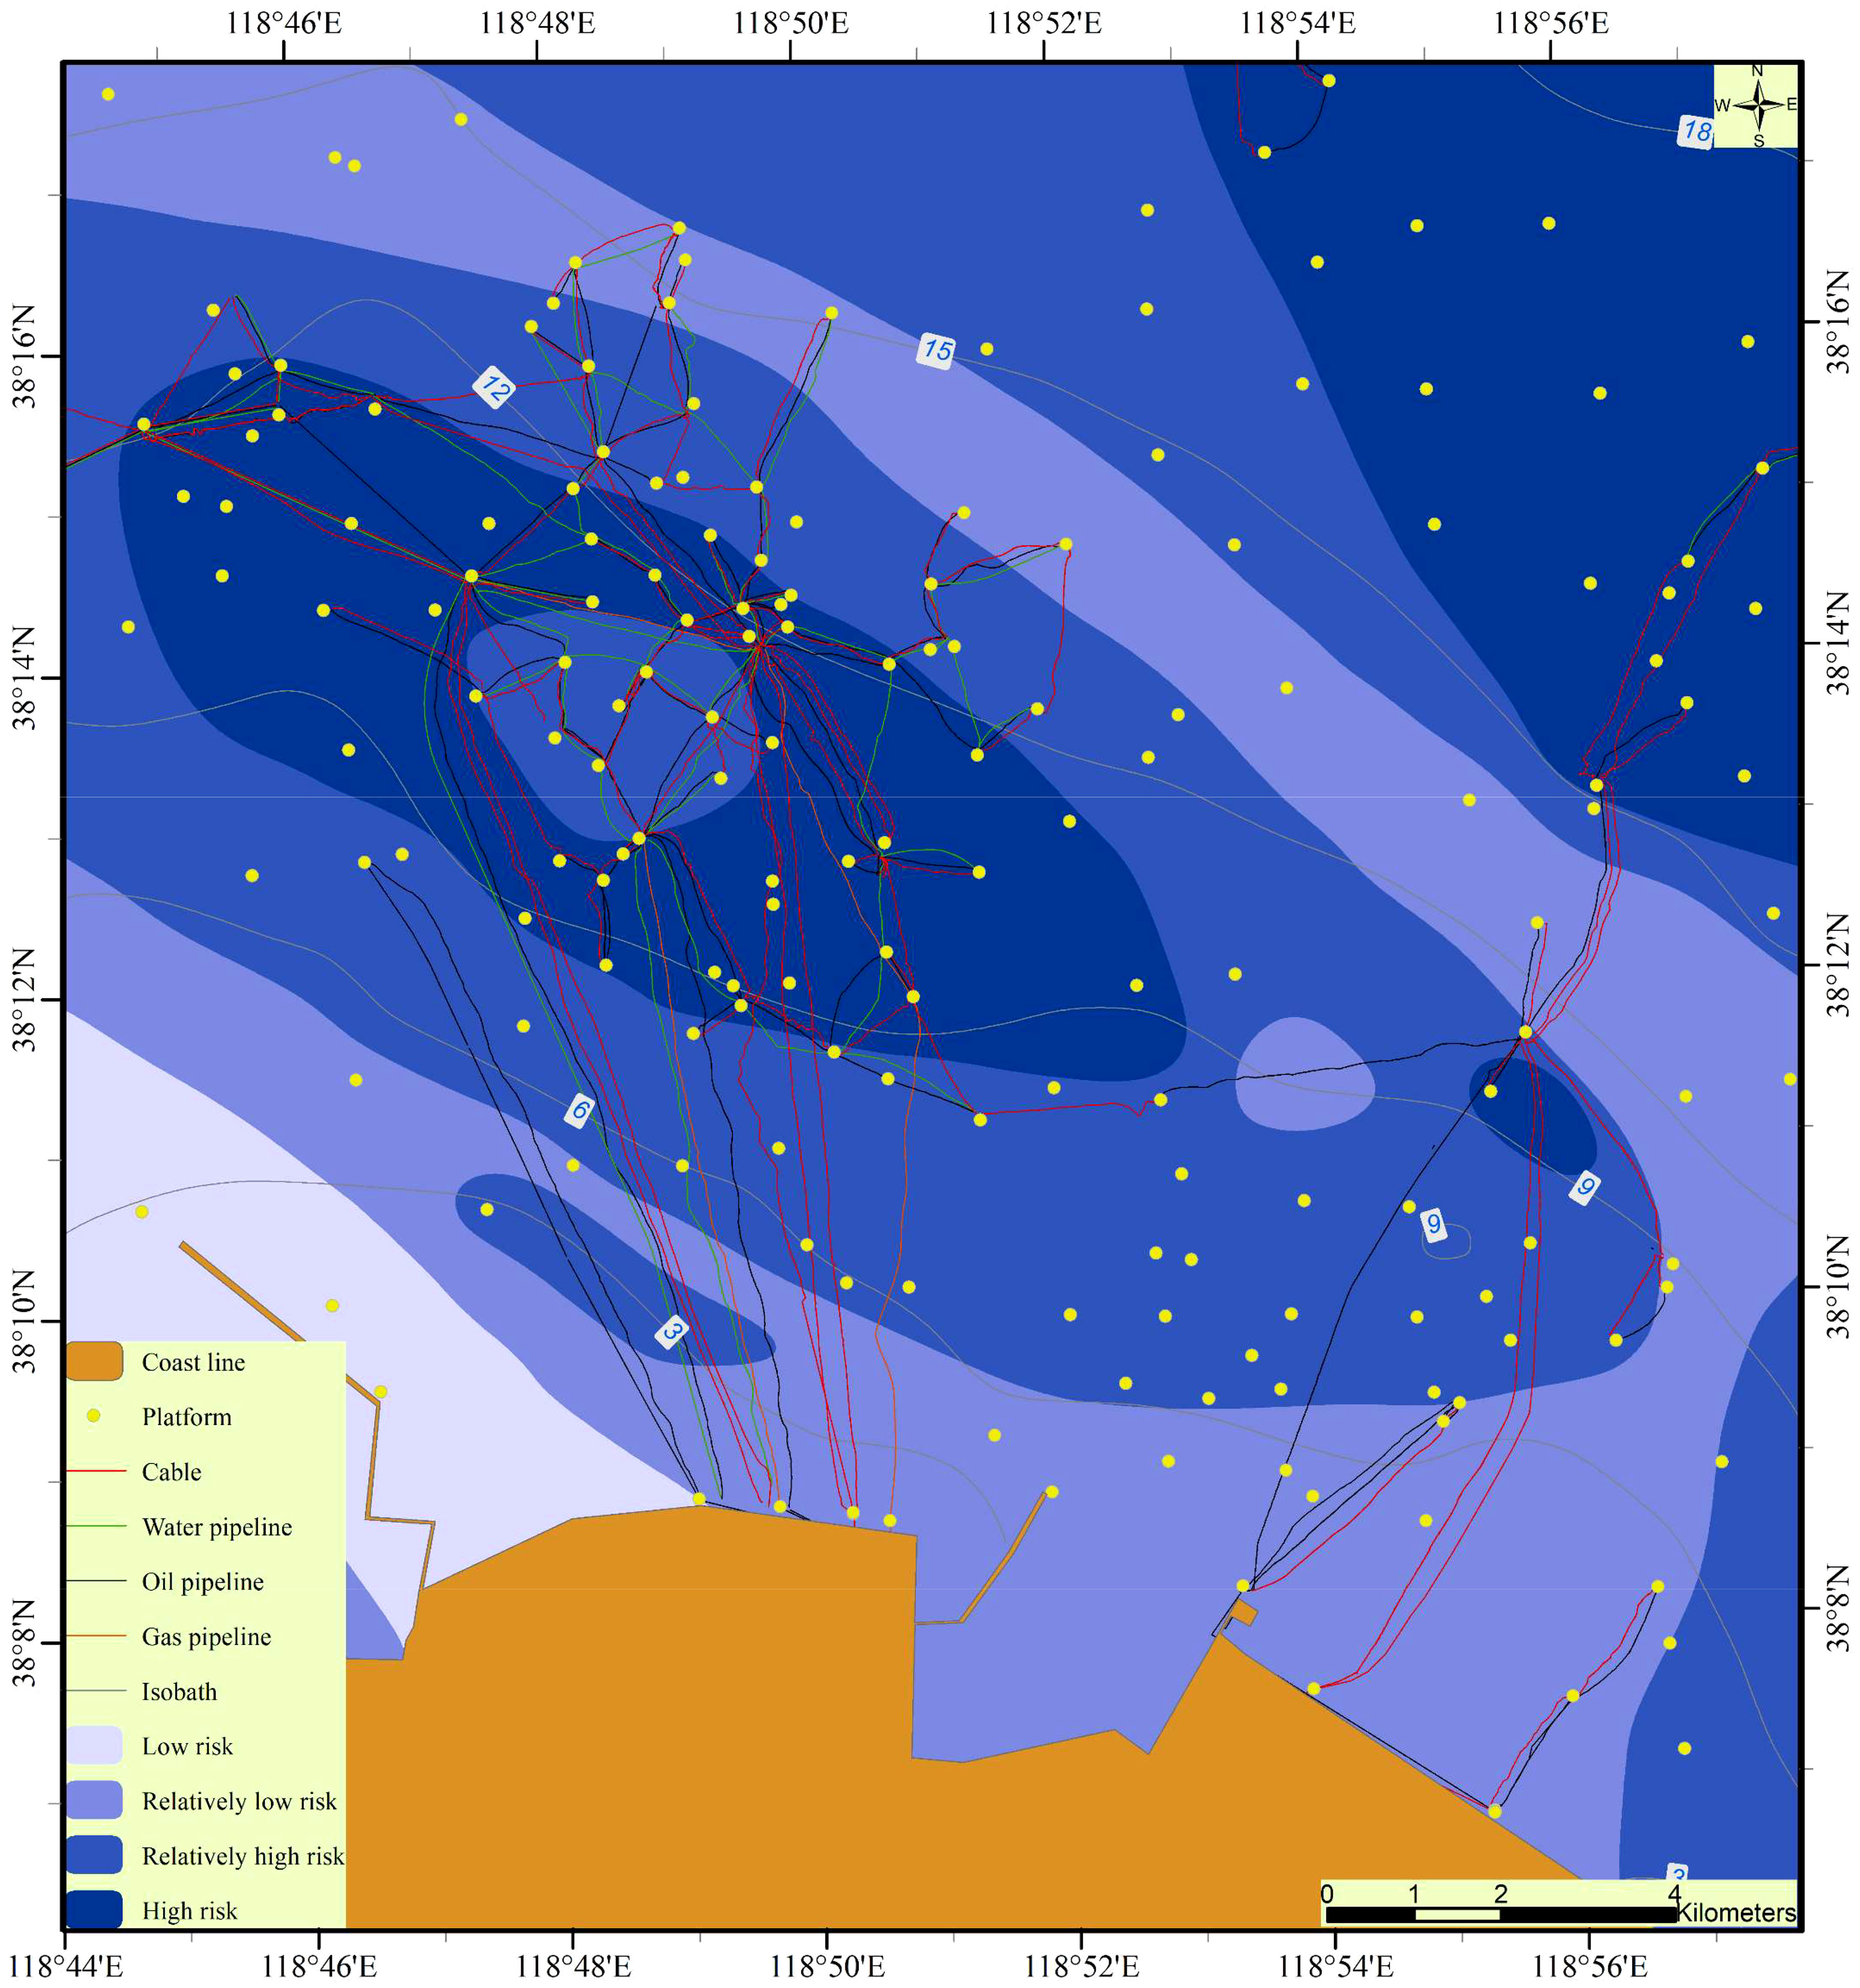
Figure 13 The geological hazard assessment zoning map of the Chengdao area.
5 Conclusions
Based on a large amount of geological hazard survey data in the Chengdao area of the Yellow River subaqueous delta, geohazard zonation research was carried out through the AHP, and a geological hazard zonation index system consisting of four criterion layers and eight factor layers was established. Each evaluation index was quantified and graded. The main conclusions of this study are as follows. The AHP was used to assign different weights to each index in order to analyze the results of the marine geological hazard risk zonation. The results show that the areas with a high geological hazard risk in the Chengdao area are mainly distributed in the areas with water depths of 9–12 m. In these areas, the hydrodynamic effect is strong, with many human engineering activities, and the developed geological hazards are serious. Under the action of the hydrodynamic conditions, geological disasters such as liquefaction and erosion have relatively strong impacts. The results of this study can provide a scientific basis for geological environmental protection, geological disaster prevention, and marine engineering development activities in the Chengdao area.
Data availability statement
The raw data supporting the conclusions of this article will be made available by the authors, without undue reservation.
Author contributions
ZW: Funding acquisition, Methodology, Writing – original draft, Writing – review & editing. XD: Conceptualization, Methodology, Writing – original draft. YFS: Conceptualization, Funding acquisition, Resources, Writing – original draft. YPS: Conceptualization, Funding acquisition, Resources, Writing – review & editing, Writing – original draft. LD: Data curation, Investigation, Writing – original draft. QZ: Data curation, Investigation, Writing – original draft. WJ: Visualization, Writing – original draft.
Funding
The author(s) declare financial support was received for the research, authorship, and/or publication of this article. This work was supported by the National Special Project for Marine Public Welfare Industry (201005005), and in part by the National Natural Science Foundation of China (42107207), the Shandong Provincial Natural Science Foundation (ZR2020QD067).
Conflict of interest
The authors declare that the research was conducted in the absence of any commercial or financial relationships that could be construed as a potential conflict of interest.
Publisher’s note
All claims expressed in this article are solely those of the authors and do not necessarily represent those of their affiliated organizations, or those of the publisher, the editors and the reviewers. Any product that may be evaluated in this article, or claim that may be made by its manufacturer, is not guaranteed or endorsed by the publisher.
References
Akpınar A., van Vledder G. P., Kömürcü M.İ., Özger M. (2012). Evaluation of the numerical wave model (SWAN) for wave simulation in the Black Sea. Continental Shelf Res. 50, 80–99. doi: 10.1016/j.csr.2012.09.012
Booij N. R. R. C., Ris R. C., Holthuijsen L. H. (1999). A third-generation wave model for coastal regions: 1. Model description and validation. J. Geophys. Res.: Oceans 104 (C4), 7649–7666. doi: 10.1029/98JC02622
Chen Y., Zhang L., Liao C., Jiang M., Peng M. (2020). A two-stage probabilistic approach for the risk assessment of submarine landslides induced by gas hydrate exploitation. Appl. Ocean Res. 99, 102158. doi: 10.1016/j.apor.2020.102158
Chu Z. X., Sun X. G., Zhai S. K., Xu K. H. (2006). Changing pattern of accretion/erosion of the modern Yellow River (Huanghe) subaerial delta, China: Basedon remote sensing images. Mar. Geol. 227 (1), 13–30. doi: 10.1016/j.margeo.2005.11.013
Du F. C. (2013). Research on the geological causes of ShengLi well workover platform III overturning accident (Qingdao, China: Ocean University of China).
Du J., Li P. Y., Wei W., Cao C. X., Liu L. J. (2008). Stability zoning of hazard geology in coastal zone of China. J. Nat. Disasters 04, 5–10.
Gamboa D., Omira R., Terrinha P. (2021). A database of submarine landslides offshore West and Southwest Iberia. Sci. Data 8 (1), 185. doi: 10.1038/s41597-021-00969-w
Guo X. S., Liu X. L., Li M. Q., Lu Y. (2023). Lateral force on buried pipelines caused by seabed slides using a CFD method with a shear interface weakening model. Ocean Eng. 280, 114663. doi: 10.1016/j.oceaneng.2023.114663
Hu J., Motagh M., Wang J., Qin F., Zhang J., Wu W., et al. (2021). Karst collapse risk zonation and evaluation in Wuhan, China based on analytic hierarchy process, logistic regression, and inSAR angular distortion approaches. Remote Sens. 13, 5063. doi: 10.3390/rs13245063
Li G., Zhuang K., Wei H. (2000). Sedimentation in the Yellow River delta. Part III. Seabed erosion and diapirism in the abandoned subaqueous delta lobe. Mar. Geol. 168 (1), 129–144. doi: 10.1016/S0025-3227(00)00053-0
Liu S. Q., Liu X. Q., Wang S. J., Guo Y. G. (2000). Kinds of hazardous geology and division in South China Sea. Chin. J. Geological Hazard Control 04, 42–47.
Liu X. L., Wang Y. Y., Zhang H., Guo X. S. (2023). Susceptibility of typical marine geological disasters: an overview. Geoenvironmental Disasters 10 (1), 1–31. doi: 10.1186/s40677-023-00237-6
Liu X. L., Zhang M. S., Zhang H., Jia Y. G., Zhu C. Q., Shan H. X. (2017). Physical and mechanical properties of loess discharged from the Yellow River into the Bohai Sea, China. Eng. Geol. 227, 4–11. doi: 10.1016/j.enggeo.2017.04.019
Liu X. L., Zhang S. Y., Zheng J. W. (2022). Research progress and countermeasures on geological hazards induced by extreme storms in the Yellow River Delta. Mar. Geol. Front. 38 (11), 28–39.
Prior D. B., Yang Z. S., Bornhold B. D., Keller G. H., Lin Z. H., Wiseman W. J., et al. (1986). The subaqueous delta of the modern Huanghe (Yellow River). Geomarine Lett. 6 (2), 67–75. doi: 10.1007/BF02281642
Saaty T. L. (1988). “Multicriteria decision making: the analytic hierarchy process,” in Planning, Priority Setting, Resource Allocation (New York, NY, USA: McGraw-Hill).
Saaty T. L. (2003). Decision-making with the AHP: why is the principal eigenvector necessary. Eur. J. Operational Res. 145 (1), 85–91. doi: 10.1016/S0377-2217(02)00227-8
Souza C. R. D. G., Suguio K. (2003). The Coastal erosion Risk Zoning and the São Paulo State Plan for coastal management. J. Coast. Res. SI 35, 530–547.
Subedi P., Subedi K., Thapa B., Subedi P. (2019). Sinkhole susceptibility mapping in Marion County, Florida: Evaluation and comparison between analytical hierarchy process and logistic regression based approaches. Sci. Rep. 9, 7140. doi: 10.1038/s41598-019-43705-6
Sun Q., Chang F. Q., Lu H. Q. (2012). Regional risk evaluation of shallow geological hazard by fuzzy evaluation method in the pearl river estuary. Periodical Ocean Univ. China 42 (001), 131–135.
Sun Y. F., Dong L. F., Song Y. P. (2008). Analysis of characteristics and formation of disturbed soil on subaqueous delta of Yellow River. Rock Soil Mechanics 29 (006), 1494–1499.
Wang H., Liu H. J. (2016). Evaluation of storm wave-induced silty seabed instability and geo-hazards: a case study in the Yellow River delta. Appl. Ocean Res. 58, 135–145. doi: 10.1016/j.apor.2016.03.013
Wang Z. H., Jia Y. G., Liu X. L., Wang D., Shan H. X., Guo L., et al. (2018). In situ observation of storm-wave-induced seabed deformation with a submarine landslide monitoring system. Bull. Eng. Geol. Environ. 77 (3), 1091–1102. doi: 10.1007/s10064-017-1130-4
Wang Z. H., Sun Y. F., Jia Y. G., Shan Z. G., Shan H. X., Zhang S. T., et al. (2020). Wave-induced seafloor instabilities in the sub- aqueous Yellow River Delta – Initiation and process of sediment failure. Landslides 17, 1849–1862. doi: 10.1007/s10346-020-01399-2
Wei A., Li D., Zhou Y., Deng Q., Yan L. (2021). A novel combination approach for karst collapse susceptibility assessment using the analytic hierarchy process, catastrophe, and entropy model. Nat. Hazards 105, 405–430. doi: 10.1007/s11069-020-04317-w
Xu G. H., Sun Y. F., Wang X., Hu G. H., Song Y. P. (2009). Wave-induced shallow slides and their features on the subaqueous Yellow River delta. Can. Geotechnical J. 46 (12), 1406–1417. doi: 10.1139/T09-068
Xue C. (1993). Historical changes in the Yellow River delta, China. Mar. Geol. 113 (3-4), 321–330. doi: 10.1016/0025-3227(93)90025-Q
Zhang H., Liu X. L., Jia Y. G., Du Q. Z., Sun Y. F., Yin P., et al. (2020). Rapid consolidation characteristics of Yellow River-derived sediment: Geotechnical characterization and its implications for the deltaic geomorphic evolution. Eng. Geol. 270, 105578. doi: 10.1016/j.enggeo.2020.105578
Keywords: risk zonation, submarine geological hazards, evaluation index system, analytic hierarchy process, the Yellow River subaqueous delta
Citation: Wang Z, Du X, Sun Y, Song Y, Dong L, Zhou Q and Jiang W (2023) Risk zonation of submarine geological hazards in the Chengdao area of the Yellow River subaqueous delta. Front. Mar. Sci. 10:1285437. doi: 10.3389/fmars.2023.1285437
Received: 30 August 2023; Accepted: 09 October 2023;
Published: 23 October 2023.
Edited by:
Xingsen Guo, University College London, United KingdomReviewed by:
Shaotong Zhang, Ocean University of China, ChinaDefeng Zheng, Liaoning Normal University, China
Copyright © 2023 Wang, Du, Sun, Song, Dong, Zhou and Jiang. This is an open-access article distributed under the terms of the Creative Commons Attribution License (CC BY). The use, distribution or reproduction in other forums is permitted, provided the original author(s) and the copyright owner(s) are credited and that the original publication in this journal is cited, in accordance with accepted academic practice. No use, distribution or reproduction is permitted which does not comply with these terms.
*Correspondence: Yupeng Song, songyupeng@fio.org.cn