Variability of Arctic Sea ice age and its relationship with atmospheric circulation patterns
 Ping Chen
 Xiaoyu Wang2
  Junqiang Shi
 Fangyi Zong
 Lai Wei
- 1Institute of Oceanographic Instrumentation, Qilu University of Technology (Shandong Academy of Sciences), Qingdao, China
- 2Frontiers Science Center for Deep Ocean Multispheres and Earth System, Key Laboratory of Physical Oceanography, Ocean University of China, Qingdao, China
- 3College of Oceanic and Atmospheric Sciences, Ocean University of China, Qingdao, China
- 4Sanya Oceanographic Institution, Ocean University of China, Sanya, China
Since at least the 1990s, global warming has caused the decline of multi-year ice (MYI) in the Arctic, which has made the Arctic Ocean more susceptible to the effects of climate change and weather processes. In this study, an analysis of the variations in Arctic sea ice age was carried out based on the results of an Empirical Orthogonal Function (EOF) analysis. Variations in three time periods were investigated. The first period (1984-1995) is characterized by high sea ice age, with antiphase variation processes in the eastern and western parts of the Arctic Ocean. The second period (1996-2012) represents a rapid reduction in ice age, characterized by a gradual replacement of MYI in the Arctic Ocean with seasonal sea ice, resulting in a decreased extent of MYI. The third period (2013-2022) is characterized by low sea ice age, with ice age being in a significantly negative phase. Furthermore, trend-like changes were weak during this period. During the first period, the spatial distribution and significant variations in ice age were driven by cyclonic wind anomalies associated with the Arctic Oscillation (AO) atmospheric pressure modes. The cyclonic wind fields in winter and anticyclonic wind fields in summer collectively influenced the sea ice. This led to a decrease/increase in ice age in the eastern/western Arctic, and antiphase variations were apparent. During the second study period, winter ice age variations were driven by cyclonic wind anomalies associated with the AO atmospheric pressure modes, leading to ice divergence and a decrease in ice age. In summer, both thermodynamic (Arctic warming) and dynamic (DA) mechanisms play a role in modulating the changes of sea ice age, while Arctic warming is the primary driver. The DA generated anomalous wind patterns, characterized by the Beaufort Gyre and Transpolar Drift, which resulted in the outflow of MYI from the Arctic under the influence of meridional winds. During the third study period, the influence of AO/DA and air temperature on sea ice age changes is greatly weakened.
1 Introduction
With the continuous rise in global temperatures, Arctic sea ice has undergone drastic and rapid variations (Kim et al., 2019), primarily manifested in reduced sea ice extent, decreased ice thickness, and shortened periods of ice freezing (Kwok and Rothrock, 2009; Stroeve et al., 2012). The reduction in Arctic sea ice extent during summer is typically accompanied by a substantial decrease in winter sea ice thickness. However, observations and model results suggest that the trend of Arctic sea ice thinning is even more pronounced than the extent reduction (Stroeve et al., 2014; Kwok, 2018). As sea ice becomes thinner, more solar radiation is absorbed, leading to a positive feedback loop that will potentially lead to a seasonally ice-free region (Kwok, 2018; Bi et al., 2020). This feedback effect further contributes to the warming of the Arctic atmosphere, thereby impacting the global atmospheric circulation system (Tschudi et al., 2016; Hao et al., 2020). However, the available data on existing sea ice thickness are limited in terms of both temporal span and spatial coverage. Long-term/pan-Arctic basin ice thickness data are lacking (Tilling et al., 2016; Markus et al., 2017; Kwok, 2018), which hinders the analysis of large-scale, long-term temporal series. The study by Tschudi et al. (2016) suggests an approximate linear relationship between Arctic sea ice thickness and sea ice age, where sea ice age can serve as an indicator of the variations in sea ice thickness distribution (Sallila et al., 2019).
Research indicates that multi-year ice (MYI) with greater thickness exhibits higher reflectivity, which has an impact on the average albedo of the Arctic region, making it a more significant factor among the influencing factors of climate (Perovich et al., 2002; Overland et al., 2019). Over the past three decades, the extent of MYI in the Arctic Ocean has been declining at a significant rate, approximately 9% to 15% per decade (Comiso, 2012; Polyakov et al., 2012; Kwok, 2018). The MYI extent has reduced from approximately two-thirds of the Arctic basin area to less than one-third, and MYI has currently been confined mainly to the Greenland and the northern regions of the Canadian Arctic Archipelago coast (Fowler et al., 2004; Galley et al., 2016; Kwok, 2018). As its extent decreases, MYI has also exhibited a transition toward thinner and younger ice (Tschudi et al., 2016). Specifically, the proportion of sea ice with a duration of five years or more has been steadily decreasing, declining from 20% to below 5% of the total sea ice extent (Maslanik et al., 2011; Stroeve et al., 2012; Bi et al., 2020).
Regarding dynamics, sea ice transport and convergence/divergence mechanisms play important roles in the variability of MYI extent (Zhang et al., 2012; Kwok and Cunningham, 2015). Atmospheric pressure fields and associated wind forcing have an impact on subsequent sea ice anomalies (Rigor and Wallace, 2004). The ice export and regional exchanges induced by wind forcing have been shown to be the dynamic factors behind the variations in MYI (Watanabe et al., 2006; Bi et al., 2019; Wei et al., 2019). During the late 1980s to the mid-1990s, the Arctic oscillation (AO) exhibited a persistent positive phase, resulting in a cyclonic wind field circulation pattern. Positive AO conditions lead to increased drift along the Siberian coast, resulting in enhanced outward ice advection through the Fram Strait. This process effectively flushes out older ice from the Arctic and reduces the extent of MYI (Rigor et al., 2002; Rigor and Wallace, 2004). Beginning in the mid to late 1990s, the Arctic sea ice and AO entered a “decoupled” phase/stage (Deser et al., 2000; Maslanik et al., 2007). The Arctic Dipole Anomaly (DA), owing to its strong meridional component, is widely considered as the large-scale atmospheric circulation pattern driving variations in sea ice export through the Fram Strait (Watanabe et al., 2006; Wu et al., 2006). During the positive phase of the Arctic DA, anomalous meridional winds blow from the western to the eastern Arctic, facilitating the outflow of MYI through the Transpolar Drift from the Arctic. Since 2000, DA has been widely recognized as a significant impact on the decline of sea ice (Watanabe et al., 2006; Wu et al., 2006; Wang et al., 2009; Bi et al., 2016).
While some understanding has been gained regarding the trends in sea ice age variations and the atmospheric circulation mechanisms underlying these trends, further investigation is required to identify the accompanying interannual and decadal oscillatory characteristics. Additionally, with the rapid variations in Arctic sea ice and significant alterations in atmospheric circulation, sea ice exhibits a greater dynamic response to wind resistance (Rampal et al., 2009). In this study, temporal variations in sea ice age were examined utilizing sea ice age data provided by the U.S. National Snow and Ice Data Center (NSIDC). The focus is on the atmospheric circulation modes (pressure fields and wind fields) that contributed to sea ice age variations during different time periods.
2 Data and methodology
2.1 Sea ice data
The sea ice age data, provided by the NSIDC, are in the form of weekly averaged data with a resolution of 12.5 km × 12.5 km on an equal-area grid. The data cover the time period from 1984 to 2022. In this dataset, sea ice within each grid cell is treated as Lagrangian particles, advected by ice drift, and tracked with a weekly time step (Tschudi et al., 2020). In this study, the region selected for calculating the sea ice age extent corresponds to the areas with potential MYI presence (Figure 1A). The months of March (weeks 9-13) and September (weeks 36-39) were selected to represent the first half-year (Jan-Jun) and the second half-year (Jul-Dec) respectively, for the purpose of analyzing the variations in Arctic sea ice age. The monthly average sea ice thickness data used in this study, covering the period 1984 to 2022, were obtained from the Pan-Arctic Ice Ocean Modeling and Assimilation System (PIOMAS) developed by Zhang and Rothrock (2003).
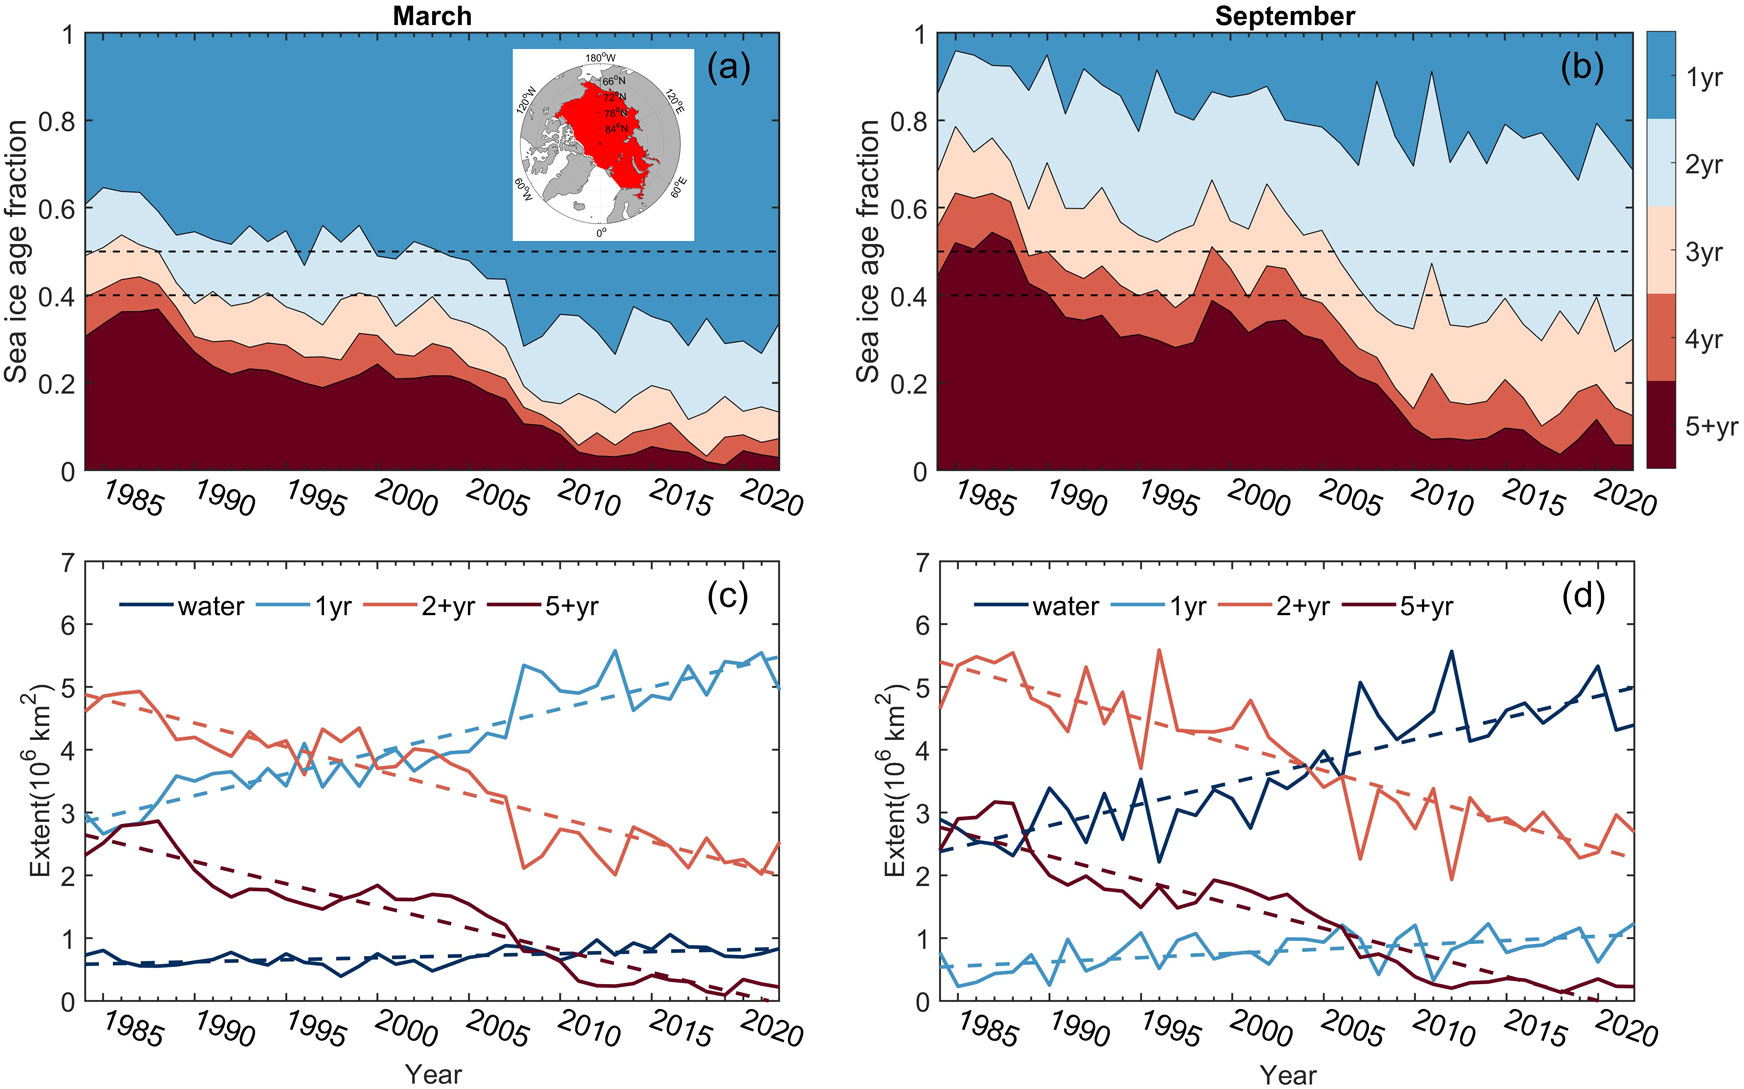
Figure 1 Proportions of different sea ice age categories in Arctic sea ice in March and September from 1984 to 2022 (A, B). The time series of the extent of different sea ice age categories in March and September, with linear trends depicted as dashed lines (C, D). The region of sea ice age values (potential MYI presence) is indicated by the red shaded area in the upper right corner of (A). This region represents the potential MYI presence.
2.2 Atmospheric data
Atmospheric data were utilized to analyze the atmospheric circulation forcing fields that were responsible for ice age variations. The data were obtained from the ERA5, the fifth-generation ECMWF global climate and weather reanalysis product (Hersbach et al., 2019). This dataset, spanning the period from 1984 to 2022, includes sea surface temperature at 2 m height, sea-level pressure, and wind field data at 10 m height, with a spatial resolution of 0.25°×0.25°.
2.3 Empirical orthogonal function analysis
The Empirical Orthogonal Function analysis method, pioneered by Pearson (1901) and later enhanced by Hannachi et al. (2007), allows for the separation of long sequences into their temporal and spatial components. Applied to ice age data, the EOF method reveals significant spatial modes of ice age and their temporal variation characteristics.
A is the anomaly matrix of sea ice age, First, compute the covariance matrix and solve the eigenvalue:
where the columns of C are the eigenvectors (EOFs) and the eigenvalues (EOF variances) are on the leading diagonal of Λ. The time series P can then be computed from the projection of A onto the EOFs:
2.4 Singular value decomposition method
The singular value decomposition (SVD) method, developed by Klema and Laub (1980) and further explored by Mandel (1982) and Stewart (1993), is primarily employed to decompose the spatiotemporal fields of coupled elements and extract their correlated spatial and temporal information. The SVD technique, applied to ice age and wind data, establishes a connection between coupled elements, revealing the primary types of wind fields driving ice age variations. The calculation steps for SVD of sea ice age and wind are as follows:
1. Calculate the anomaly field or standardized variable field of sea ice age data X and wind data Y;
2. Calculate s singular values and eigenvectors of the covariance matrix S12 of the two variable fields;
3. Determine the number of extracted modes based on the cumulative square covariance contribution percentage of the first m (less than s) modes, and obtain the distribution map of the spatial field corresponding to each mode;
4. Calculate the time series of left and right field expansion coefficient variables corresponding to each mode;
5. Find the left and right anisotropic correlation fields and isotropic correlation fields corresponding to each mode.
3 Analysis and results
3.1 Characteristics of spatial and temporal variations in Arctic Sea ice age
Sea ice age changes in winter (Jan-Mar) and spring (Apr-Jun) from 1984 to 2022 are positively correlated in Arctic significantly, with correlation coefficients exceeding 99% confidence test for most sea areas (Figure 2A). Similarly, sea ice age changes in summer (Jul-Sep) and autumn (Oct-Dec) also exhibit highly positive correlations in the Arctic, with correlation coefficients over 0.70 in other sea areas except Barents Sea (Figure 2B). The correlations of sea ice age in the first half-year (Jan-Jun) and the second half-year (Jul-Dec) are poor in the marginal seas (Barents-Laptev Sea and the southern of East Siberian-Beaufort Sea), but the correlation coefficients in other areas are over 0.60 (Figure 2C). Therefore, the sea ice age changes of Arctic in winter and spring are consistent, and the changes in summer and autumn are consistent, but the sea ice age changes of Arctic in the first half-year and second half-year are different in the marginal seas.
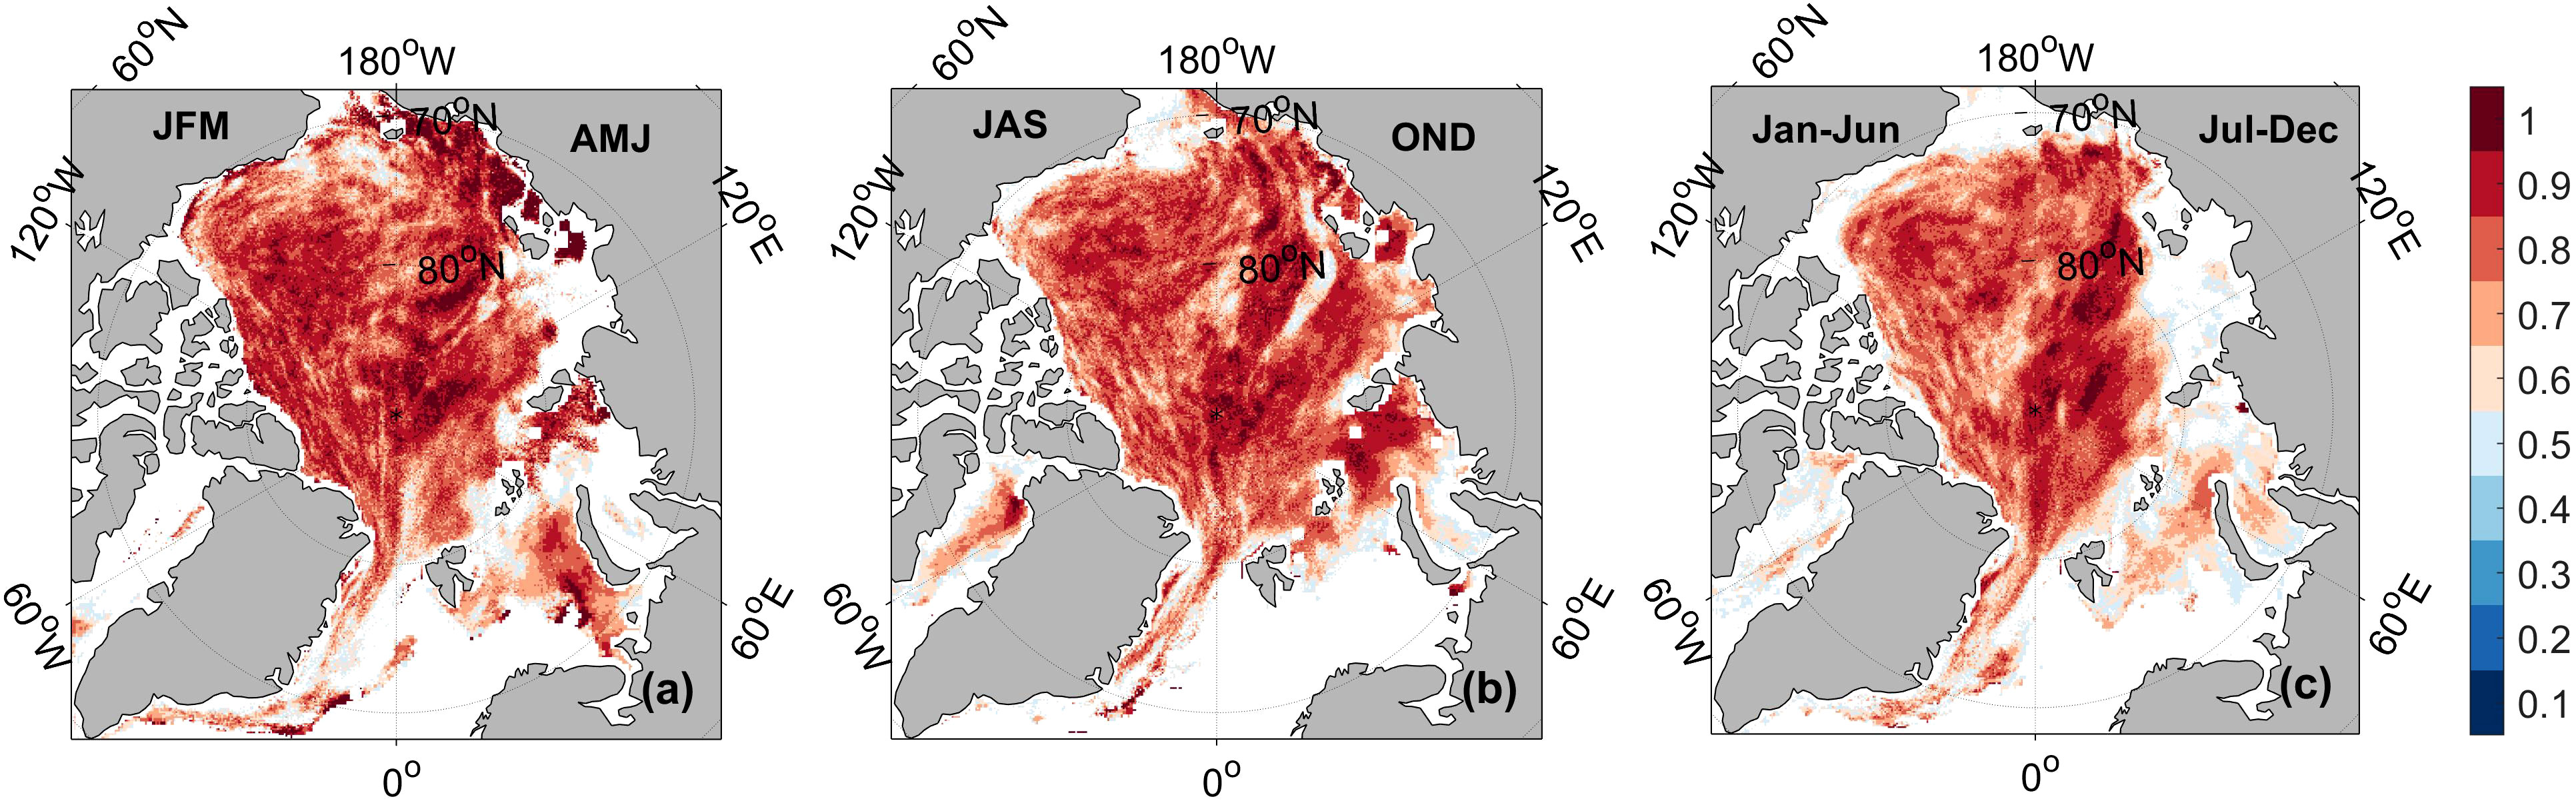
Figure 2 Correlation coefficients of sea ice age between different seasons (the colored regions pass the significance test at the 99% confidence level). (A) Winter and Spring; (B) Summer and Autumn; (C) January-June and July-December.
The determining coefficients (R2, which represents the percentage of the contribution of independent variable to the dependent variable) of sea ice age changes in March to those in the first half-year exceed 99% confidence test in most areas of Arctic, and the average determining coefficient is 74.47% (Figure 3A). The sea ice age changes in March can well explain that in the first half-year. The determination coefficients of sea ice age changes in September to those in the second half-year exceed 99% confidence test in the sea where ice exists, and the average determination coefficient is 73.12% (Figure 3B). The sea ice age changes in September can well explain that in the second half-year. Therefore, in the following analysis, we only analyze the sea ice age changes in March and September to present the changes in the first half-year and second half-year respectively.
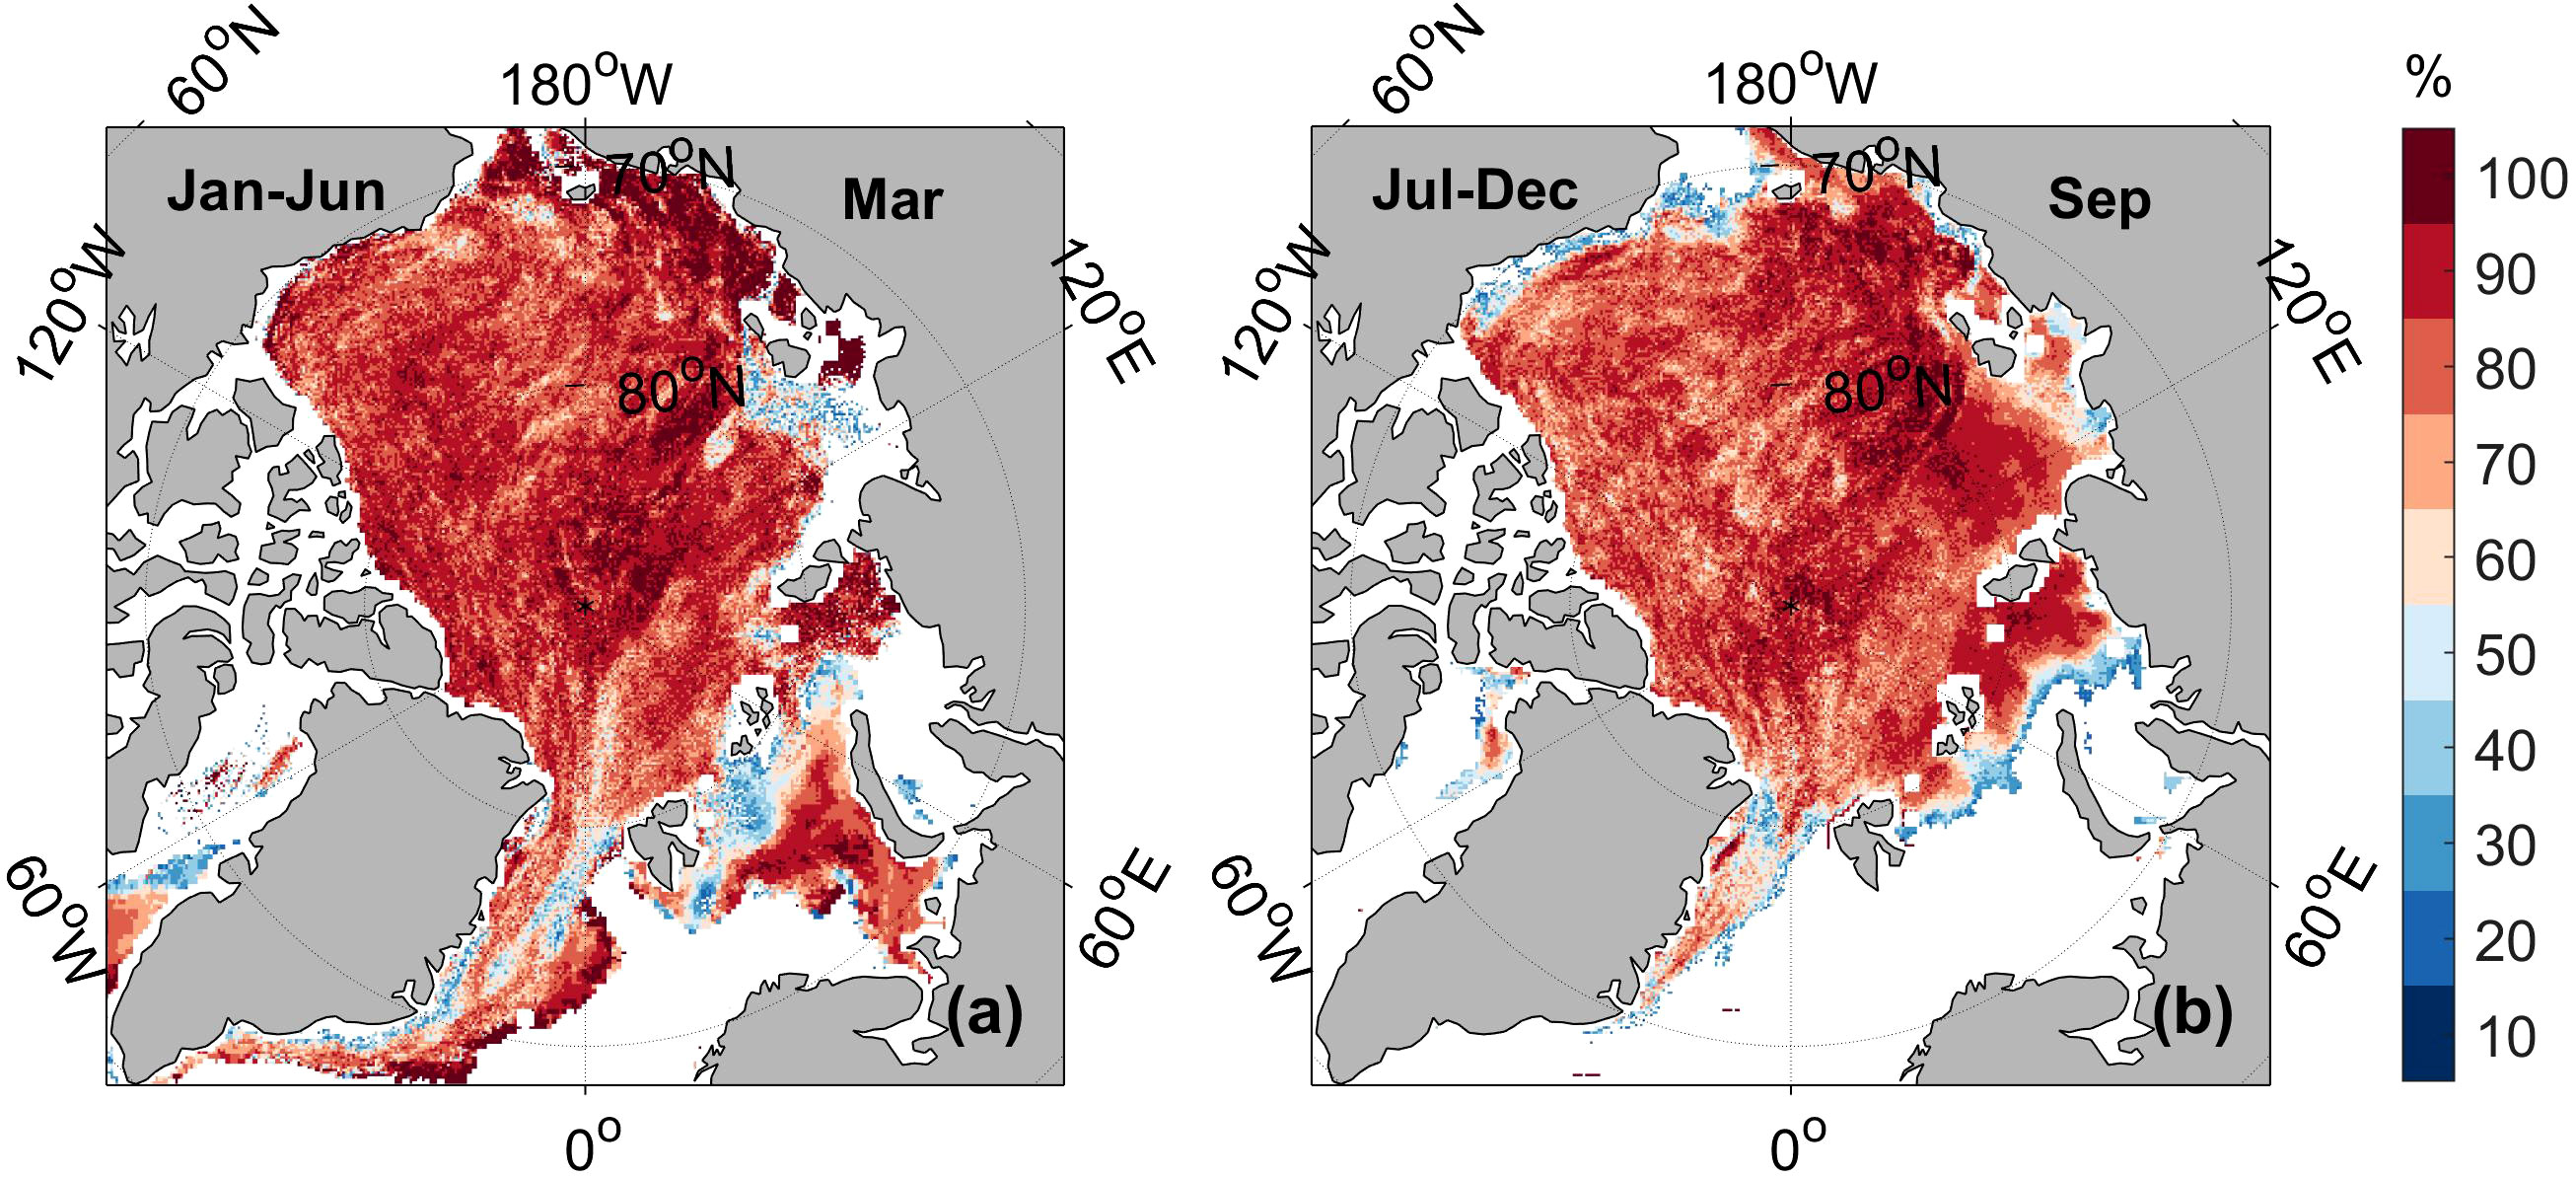
Figure 3 Determination coefficients of sea ice age change in March to that in the first half-year (A). Determination coefficients of sea ice age change in September to that in the second half-year (B). the colored regions pass the significance test at the 99% confidence level.
From 1984 to 2022, the variations in Arctic sea ice during winter months of March primarily manifested as an increase in first-year ice and a decrease in MYI, with a variation rate of 6.9 ×10⁴ km2/yr and -7.6 × 10⁴ km2/yr respectively. Prior to 2000, MYI accounted for over 50% of the total sea ice. However, after 2008, the proportion of MYI in the sea ice has dropped below 40%. The decline in MYI is particularly significant for the “5+yr” ice category. Specifically, in 1984, “5+yr” ice accounted for 30.5% of the total sea ice extent. However, by 2022, it had decreased to a mere 2.9% of the total sea ice extent (Figure 1A). During the study period, the rate of decline for the “5+yr” ice extent was 7.1 × 10⁴ km2/yr, which accounted for 93.3% of the overall MYI decline rate (Figure 1C).
From 1984 to 2022, there was a gradual increase in the proportion of “1-2yr” ice in the Arctic sea ice during September, whereas the proportion of 3+yr sea ice decreased. Specifically, the retreat of 5+yr ice was one of the most significant variations observed in the sea ice. In the mid-to-late 1980s, over 40% of the sea ice consisted of 5+yr ice, whereas by 2022, only 5.75% of the sea ice remained as 5+yr ice (Figure 1B). During the study period, MYI gradually transformed into 1yr ice and open water, with a more significant increase observed in the latter. The retreat rate of 5+yr ice was 7.7 × 10⁴ km2/yr, accounting for 93.1% of the overall MYI retreat rate. This indicates that the retreat of 5+yr ice played a dominant role in the variations observed in MYI (Figure 1D).
To further analyze the spatiotemporal distribution characteristics of sea ice age, we present the first two modes of sea ice age fields obtained through EOF analysis. The cumulative variance contribution rates of the first two modes in March and September are 42.7% and 49.1% respectively, both passing the North significance test (Figure 4).
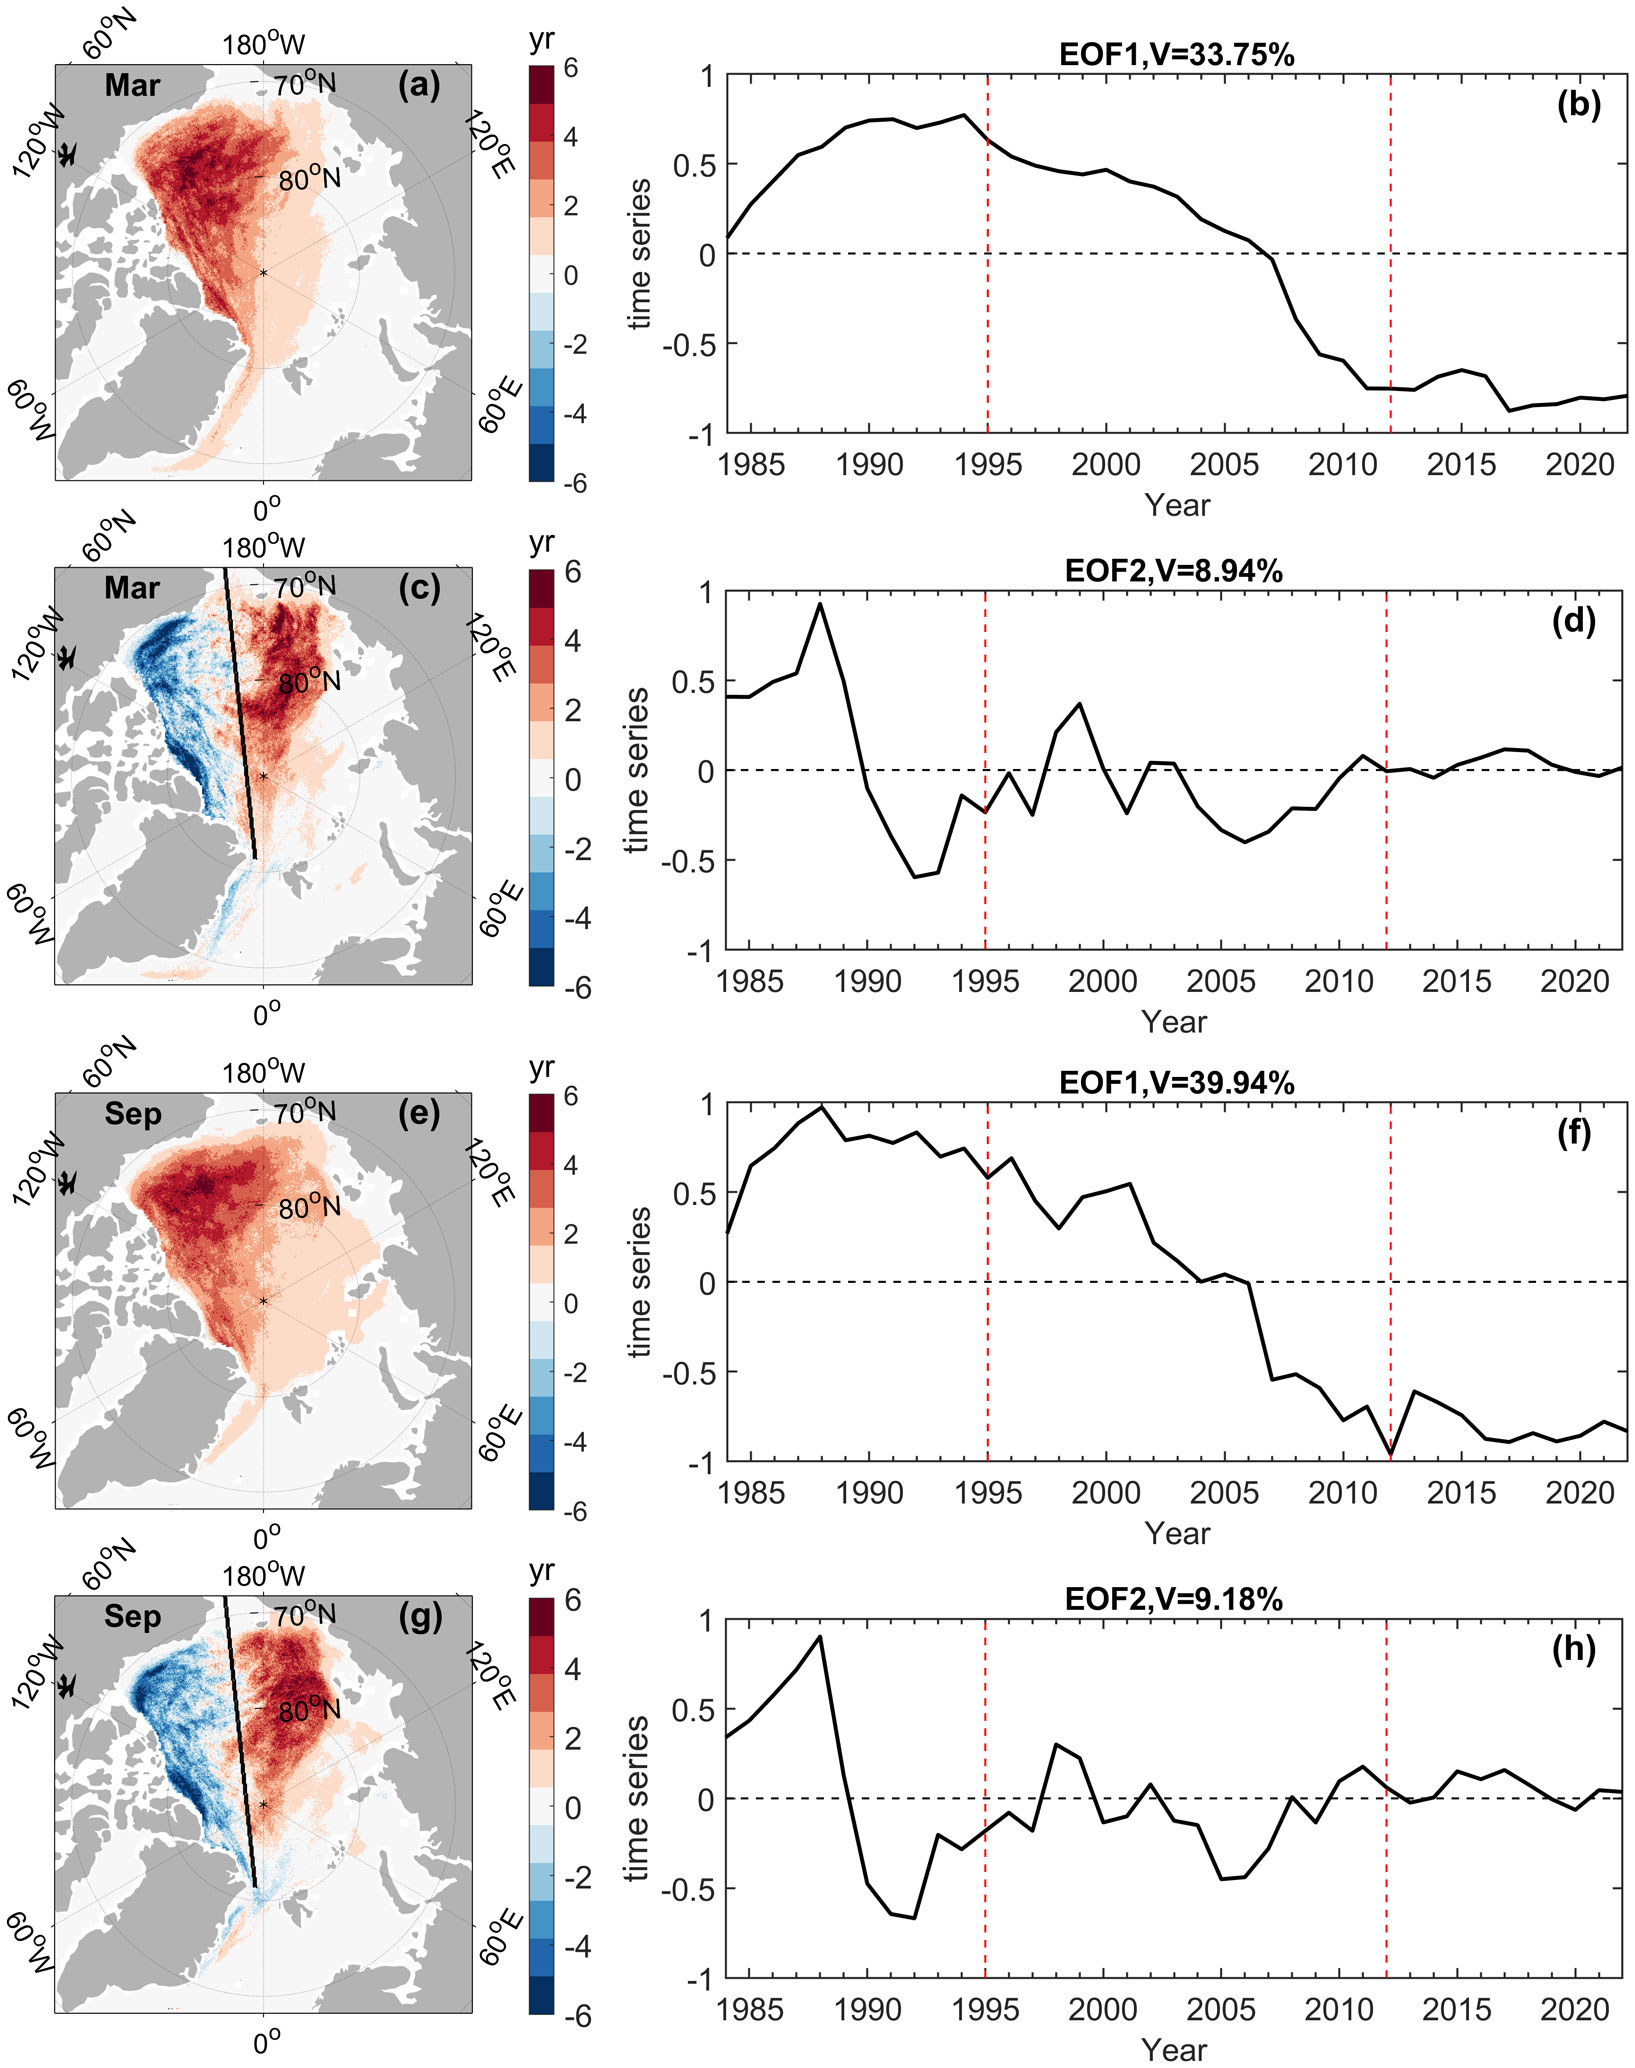
Figure 4 EOF analysis results of Arctic sea ice age in March and September from 1984 to 2022. Spatial distribution of EOF1 (A, E); Time series of PC1 (B, F); Spatial distribution of EOF2 (C, G); Time series of PC2 (D, H).
The EOF analysis results for sea ice age in March and September show consistent patterns, with the first mode contributing 33.8% and 39.9% of the cumulative variance respectively. With respect to spatial modes, the most significant sea ice age variations were observed in the western hemisphere of the Arctic Ocean (Figures 4A, E). PC1 exhibited a rapid decreasing trend overall, with positive/negative phases observed in September before/after 2005 and in March before/after 2006. After 2013, PC1 displayed a smaller magnitude of variation and slowed-down trend-like changes. This mode reflected the rapid reduction in sea ice age in the Arctic Ocean (Figures 4A, B, E, F). The spatial mode of EOF2 is characterized by an antiphase variation pattern of ice age between the eastern and western regions of the Arctic Ocean, delineated by the line connecting the Fram Strait (5.60°W, 81.33°N) to the Bering Strait (169.83°W, 66.08°N). The eastern and western regions exhibit a seesaw-like pattern of variation (Figures 4C, G). PC2 underwent a substantial transition from positive to negative values before 1995, indicating a shift from higher ice age anomalies in the eastern region to higher ice age anomalies in the western region. This pattern overlaid the overall decrease in ice age as represented by EOF1, and it was predominantly observed before 1995, with a smaller magnitude of change after 1996 (Figures 4D, H). This result raises an interesting question: Do these anomalies represent a genuine physical phenomenon or are they an artefact of the calculation method used to derive sea ice age?
Based on the characteristics of the time-series variations of the first two modes derived from EOF analysis, the sea ice age variations were analyzed in three distinct time periods: 1984-1995, 1996-2012, and 2013-2022. The evolution of PC1 during these periods exhibited a pattern of high sea ice age phase followed by a rapid decline and subsequent low ice age phase (Figures 4B, F). In contrast, PC2 displayed a distinct pattern of significant interannual variations followed by smaller variations and eventually transitions to weak interannual variations (Figures 4D, H).
Based on the periodization described above, we calculated the average spatial distribution of sea ice age for the entire study period and the three sub-periods (Figure 5), as well as the linear change slopes of sea ice age distribution (Table 1). From 1984 to 2022, most of the Arctic Ocean was covered by MYI, with the western region (west of the line connecting Fram Strait and Bering Strait) dominated by 5+yr ice. In contrast, the eastern region (east of the line connecting Fram Strait and Bering Strait) predominantly consisted of ice younger than 5 years (Figures 5A, E). The period from 1984 to 2022 witnessed significant trend-like changes in the sea ice age distribution. Each March, the most notable trend-like change was the decrease in MYI extent and the increase in the 1yr ice extent. In September, the trend was characterized by a decrease in the MYI extent and an increase in the extent of open water (Table 1). These trends indicate that with the global temperature rising, the Arctic is experiencing a transition from MYI to seasonal sea ice.
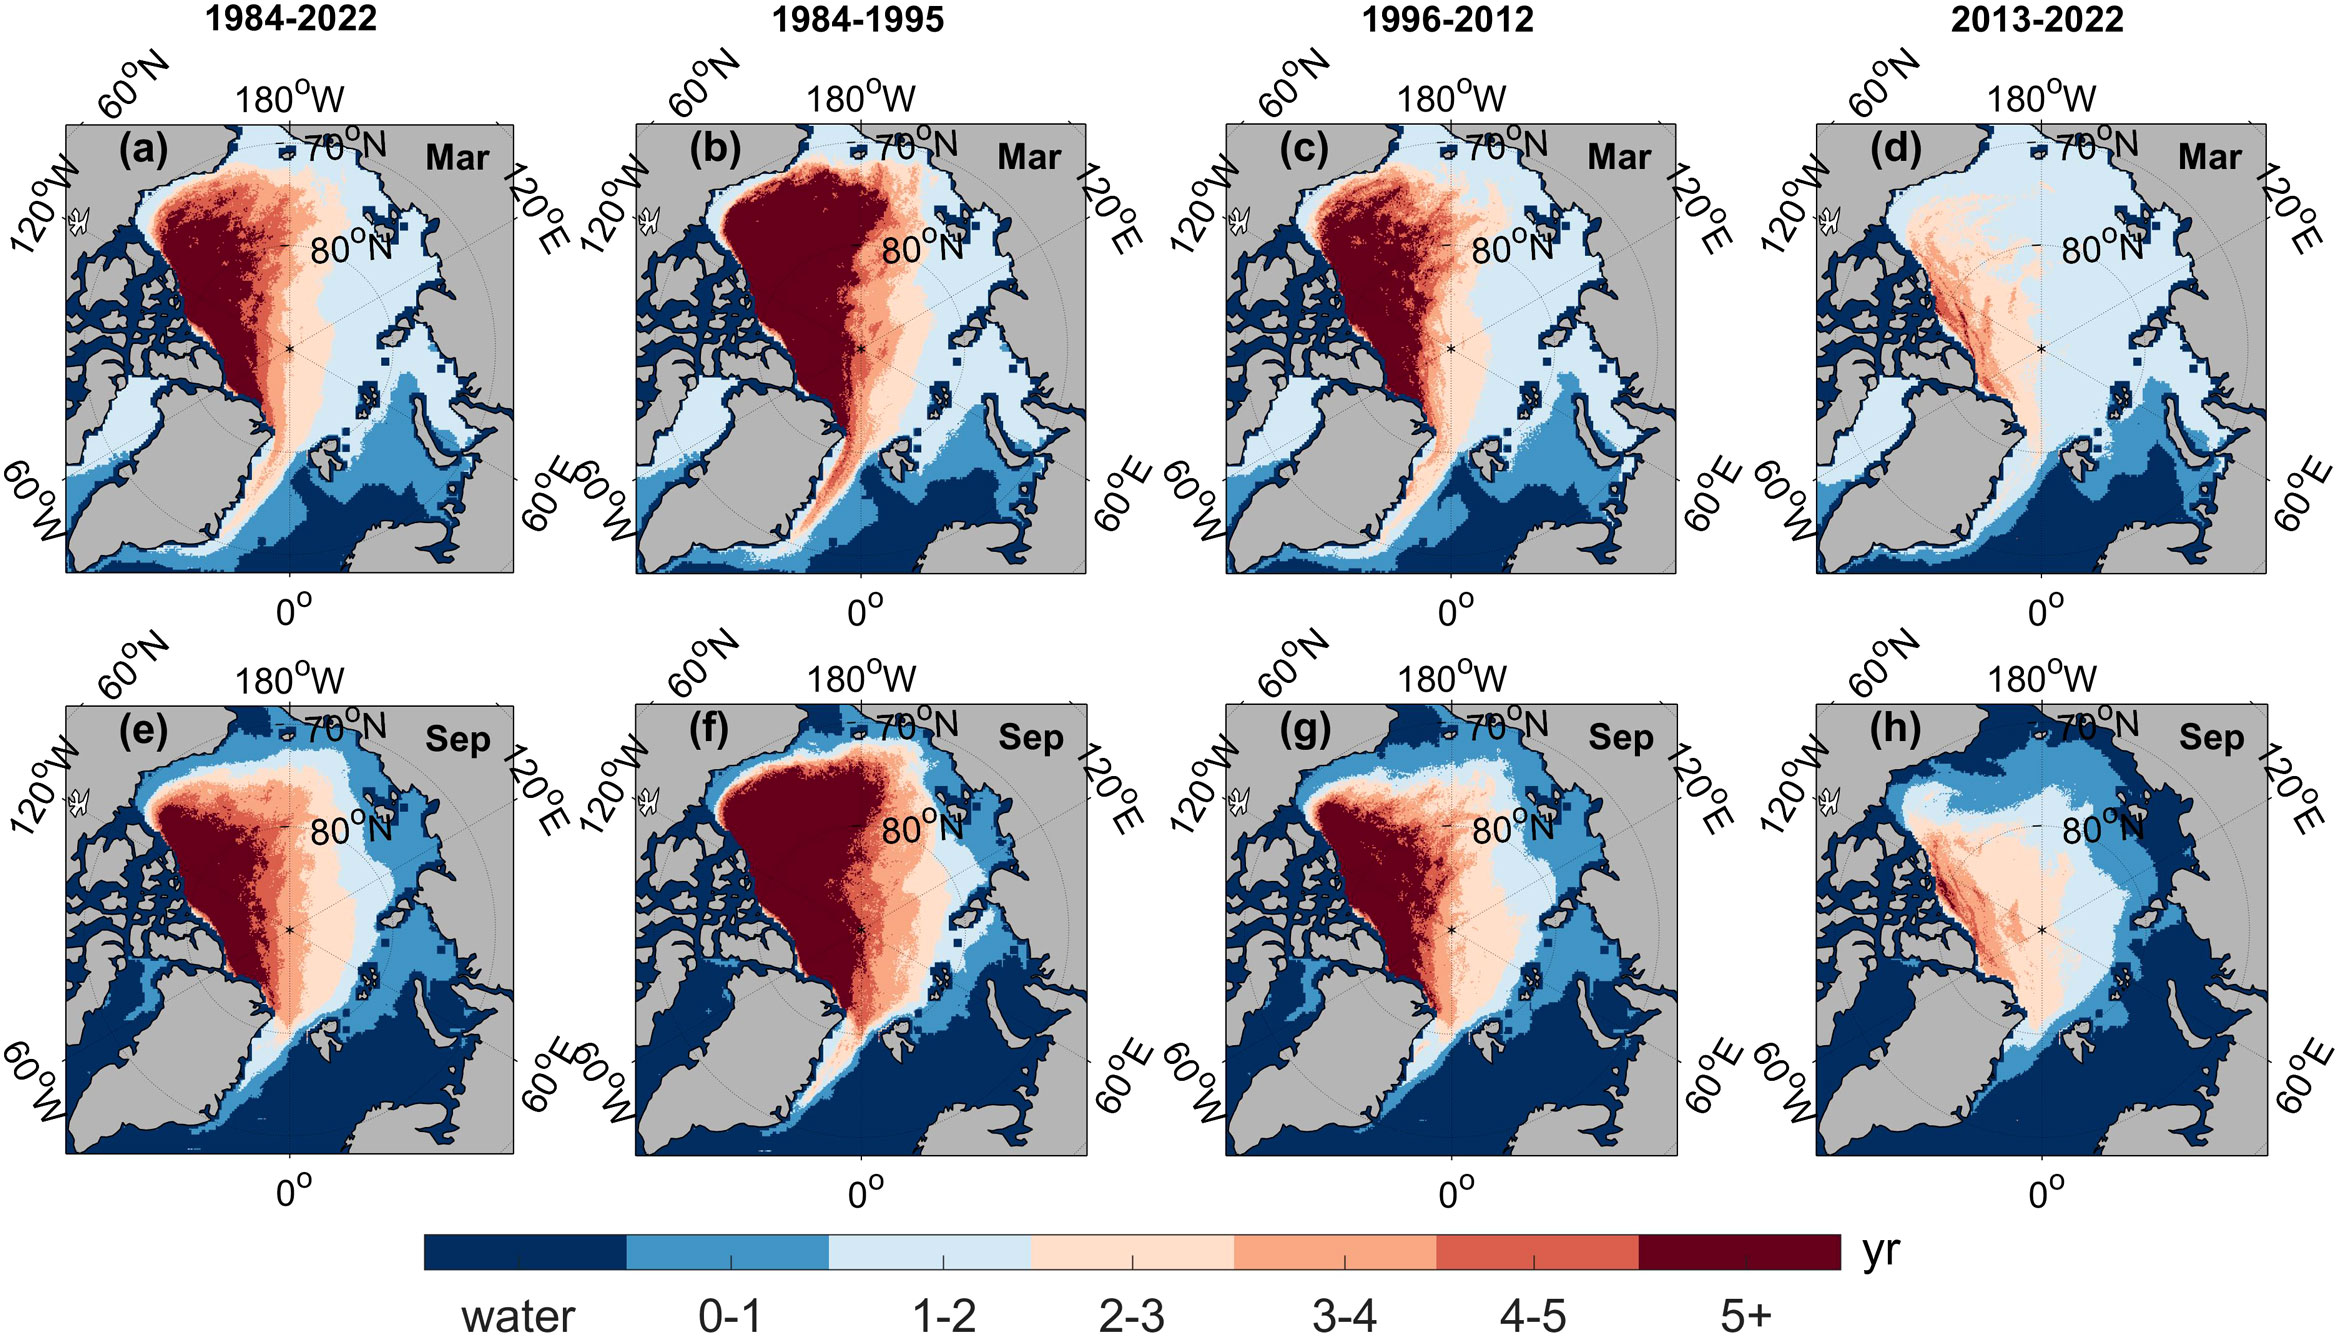
Figure 5 Spatial distribution of average sea ice age in March and September over the entire study period and three sub-periods. 1984-2022 (A, E); 1984-1995 (B, F); 1996-2012 (C, G); 2013-2022 (D, H).
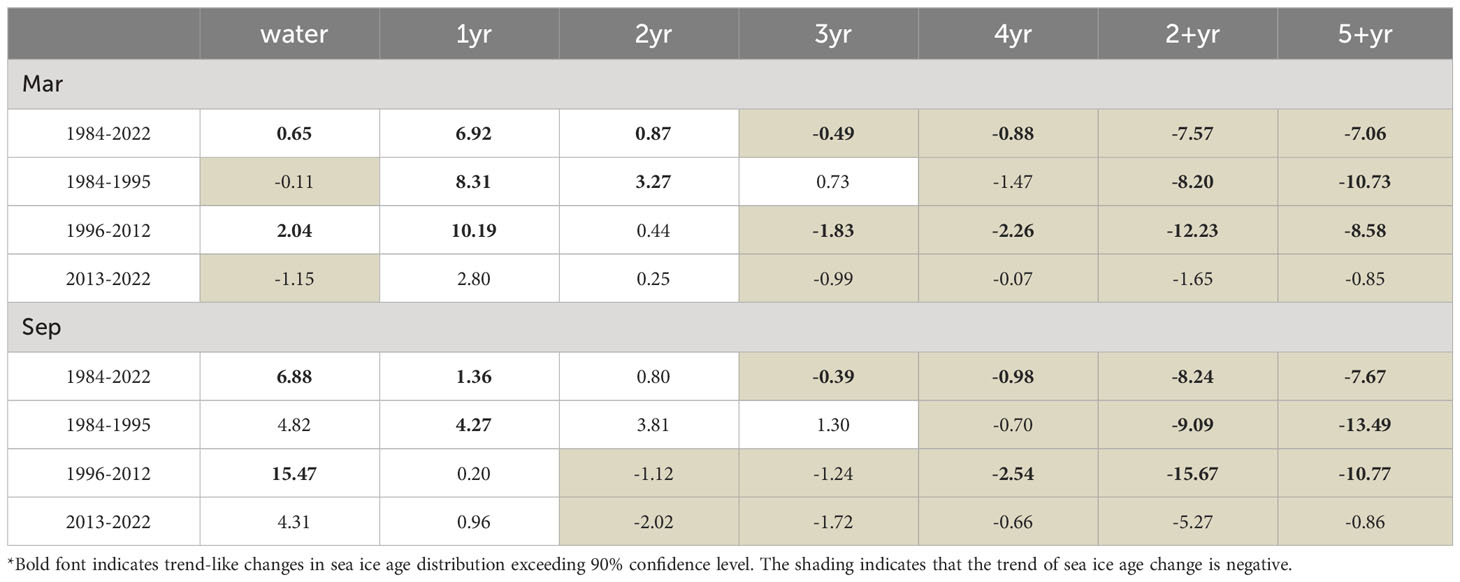
Table 1 Linear change slopes of sea ice age distribution (104km2/yr)*.
During the first period (1984-1995), there was a significant presence of 5+yr ice in the Arctic Ocean, with most regions covered by MYI (Figures 5B, F). The changes in ice age distribution during March are characterized by an increase in the proportion of 1-3yr ice and a decrease in the proportion of 4+yr ice. In September, the pattern was dominated by an increase in the proportion of 0-3yr ice relative to 4+yr ice, with a significant decline observed in the 5+yr ice distribution (Table 1). The sea ice age variations during this period are characterized by a transition from the oldest ice (≥4 years) to the 3-yr ice category (≤3 years). While the extent of MYI was decreasing, the extent of 2-3yr ice was increasing. During the second timeframe (1996-2012), the western regions of the Arctic were predominantly covered by 5+yr ice, while the eastern regions consisted primarily of ice younger than 5 years (Figures 5C, G). This period is characterized by a rapid retreat in MYI, with substantial 1yr ice formation during winter and extensive melting of sea ice during summer, leading to a significant increase in the extent of open water (Table 1). It is evident that this timeframe was a critical period in which MYI was replaced by seasonal sea ice. The third period (2013-2022) is characterized by a low sea ice age; in this period most areas of the Arctic Ocean were covered by 2-yr ice (≤2 years). 5+yr ice was only present in narrow regions, primarily in the northern part of the Canadian Arctic Archipelago (Figures 5D, H). While MYI continued to decrease, the variations in sea ice age distribution for various categories all pass the 90% confidence level test. This indicates that trend-like changes in sea ice age during this period are not uniformly statistically significant.
In Figure 6, we present the spatial distribution of trend-like changes in sea ice age during the three time periods. From 1984 to 1995, trend-like changes in sea ice age were primarily observed in areas where MYI was present. The sea ice age increased in the western region of the Arctic Ocean, whereas the sea ice age decreased in the eastern region (Figures 6A, D). The trends during this period aligned with the spatial distribution pattern of sea ice age as captured by EOF2. The conclusion that ice age increased in the western Arctic Ocean primarily after 1989, as inferred from the combined analysis of Figures 4C, D, F, G, should be interpreted with caution in terms of physical validity. This is because satellite data is available beginning in 1979, whereas ice age data is only available from 1984, with a maximum ice age of merely 5 years during that period. However, the actual ice present might have exceeded 5 years in age. Therefore, the observed increase in ice age during this timeframe could potentially be attributed to computational factors, namely, the calculations have not yet reached equilibrium. However, the spatial distribution of sea ice age anomaly fields, sea ice thickness anomaly fields, and 2-m temperature anomaly fields (Figure 7) are consistent during this timeframe. Specifically, around 1989, the data indicate a transition from high sea ice age/thickness anomalies in the eastern Arctic Ocean to high anomalies in the western region, whereas in September, the high temperature anomaly shifted from the western to the eastern region. This finding provides further support for the observed pattern in this period of initial high sea ice age followed by low sea ice age. Despite the uncertainties regarding the accuracy of the sea ice age data during this timeframe, we can conclude that the antiphase variations between the eastern and western Arctic Ocean are indeed a real phenomenon.
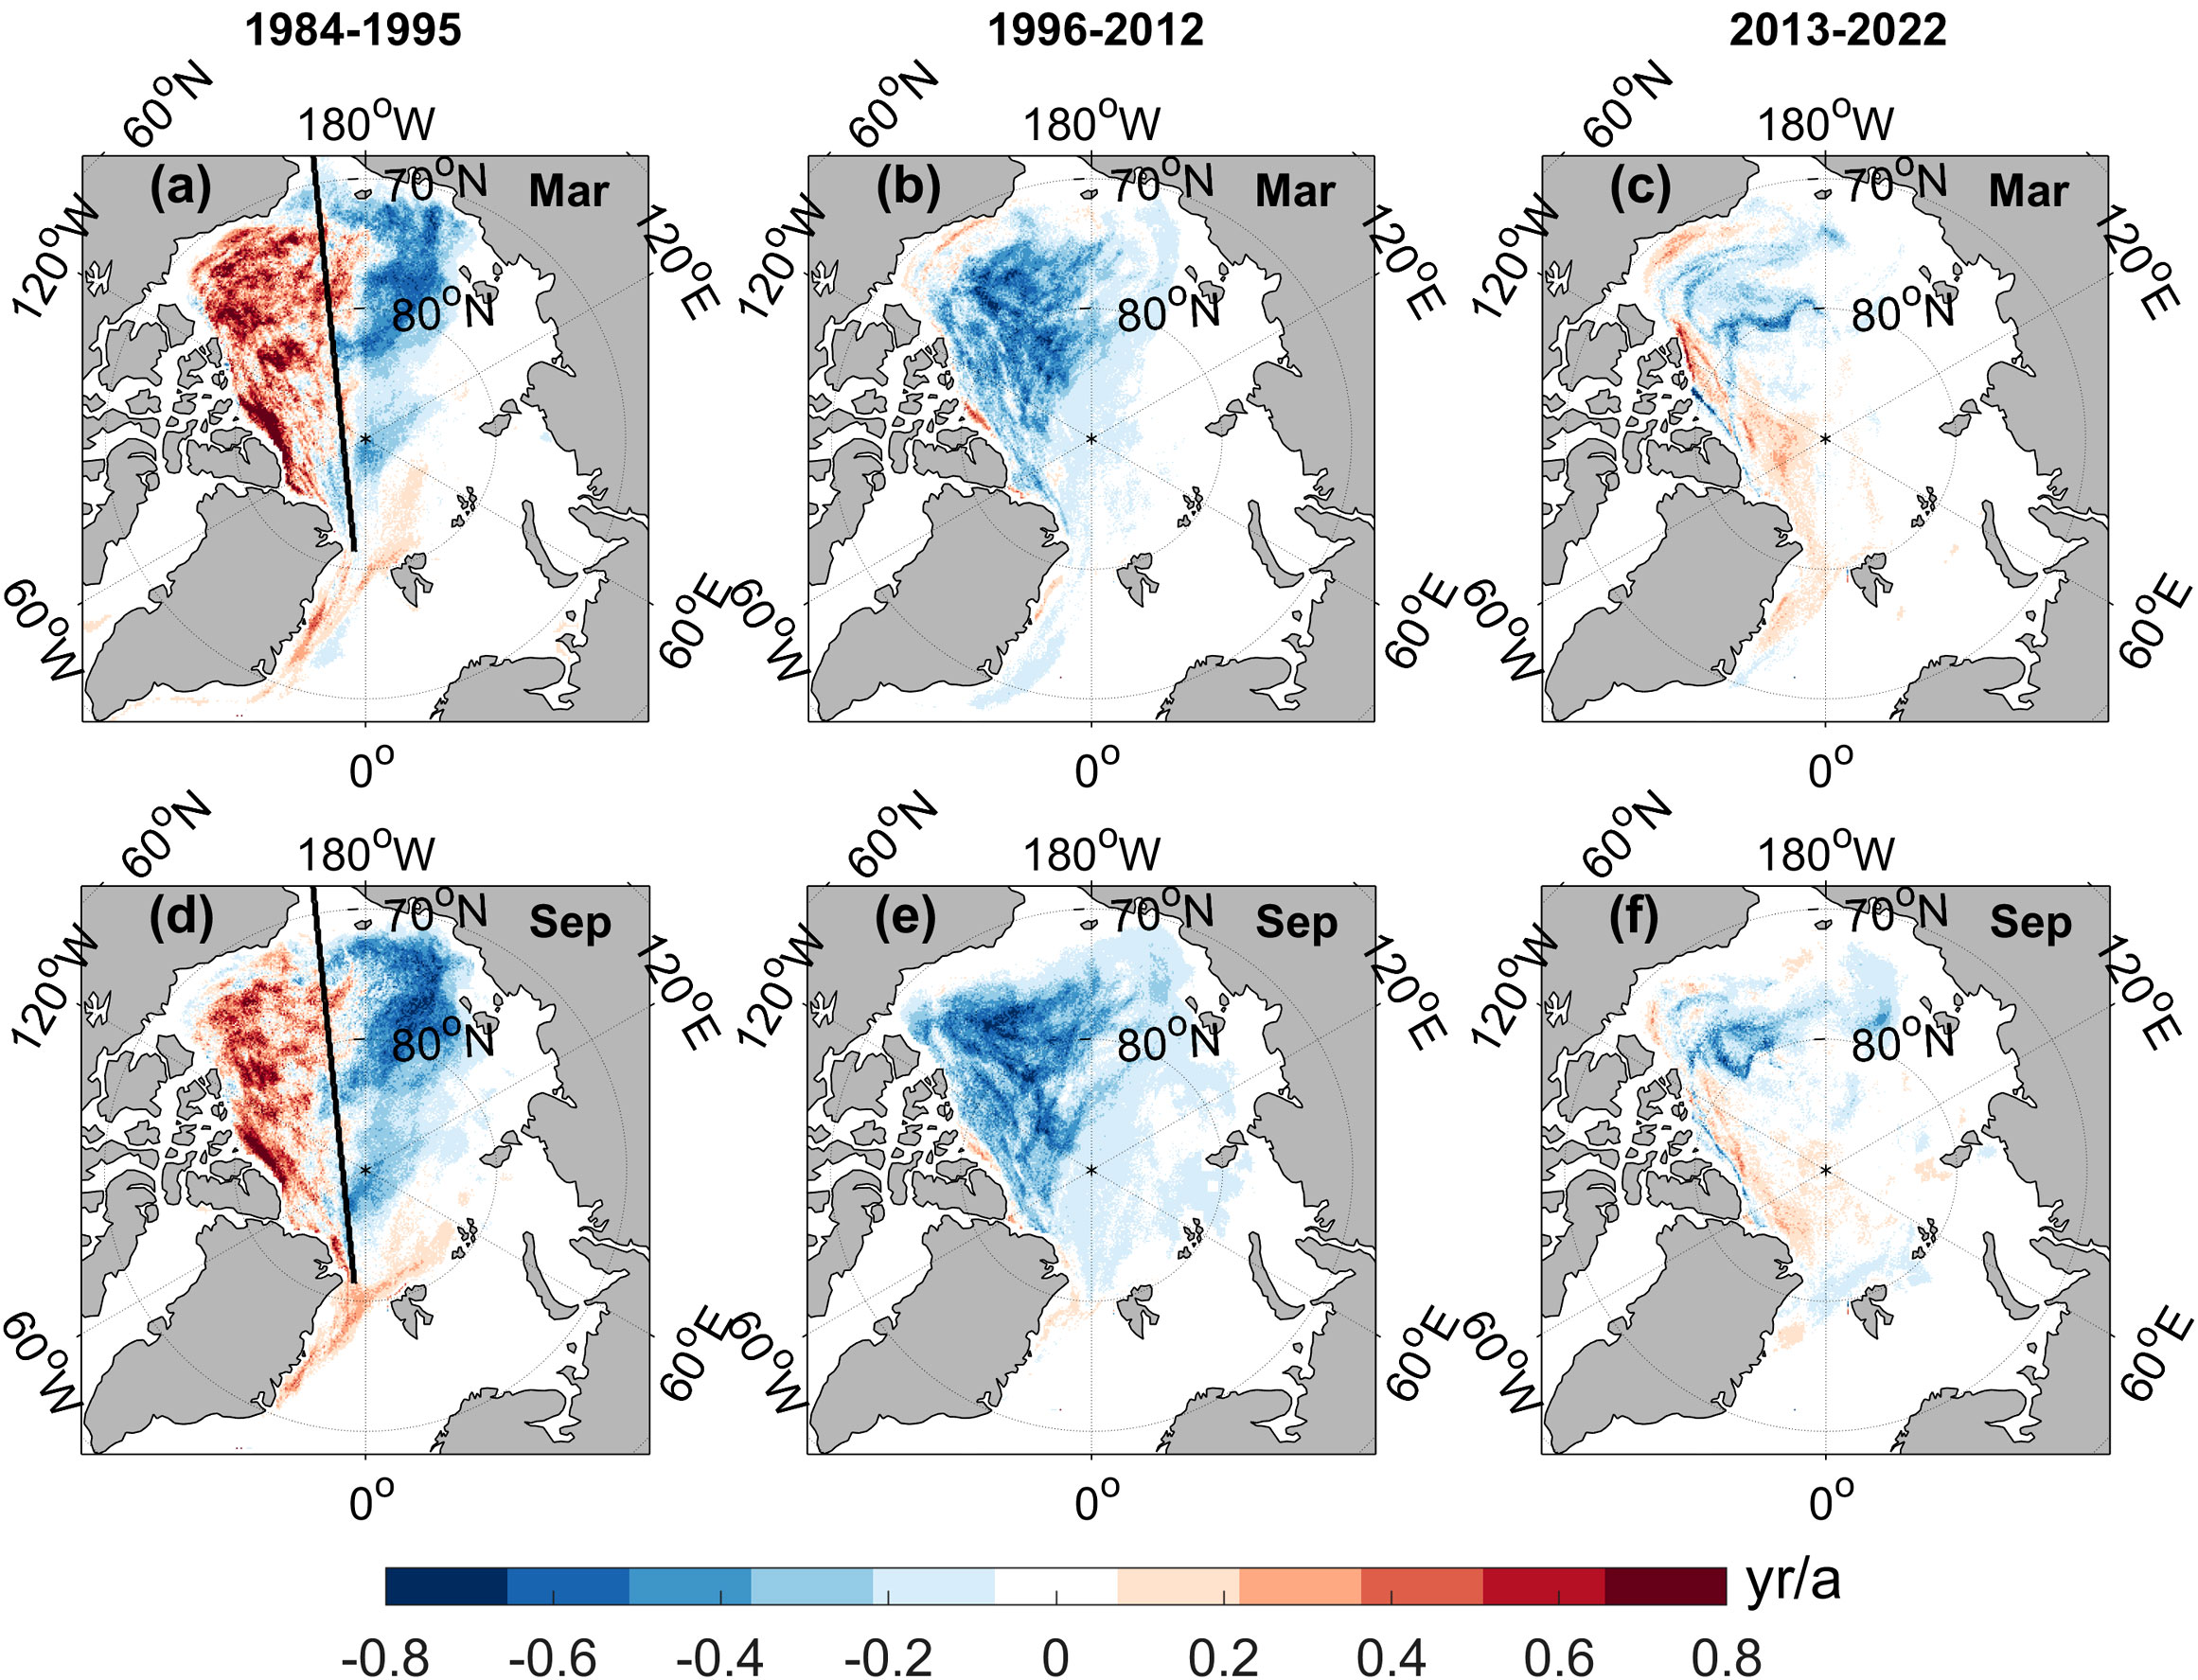
Figure 6 Spatial distribution of trend-like changes in sea ice age during three time periods. 1984-1995 (A, D); 1996-2012 (B, E); 2013-2022 (C, F).
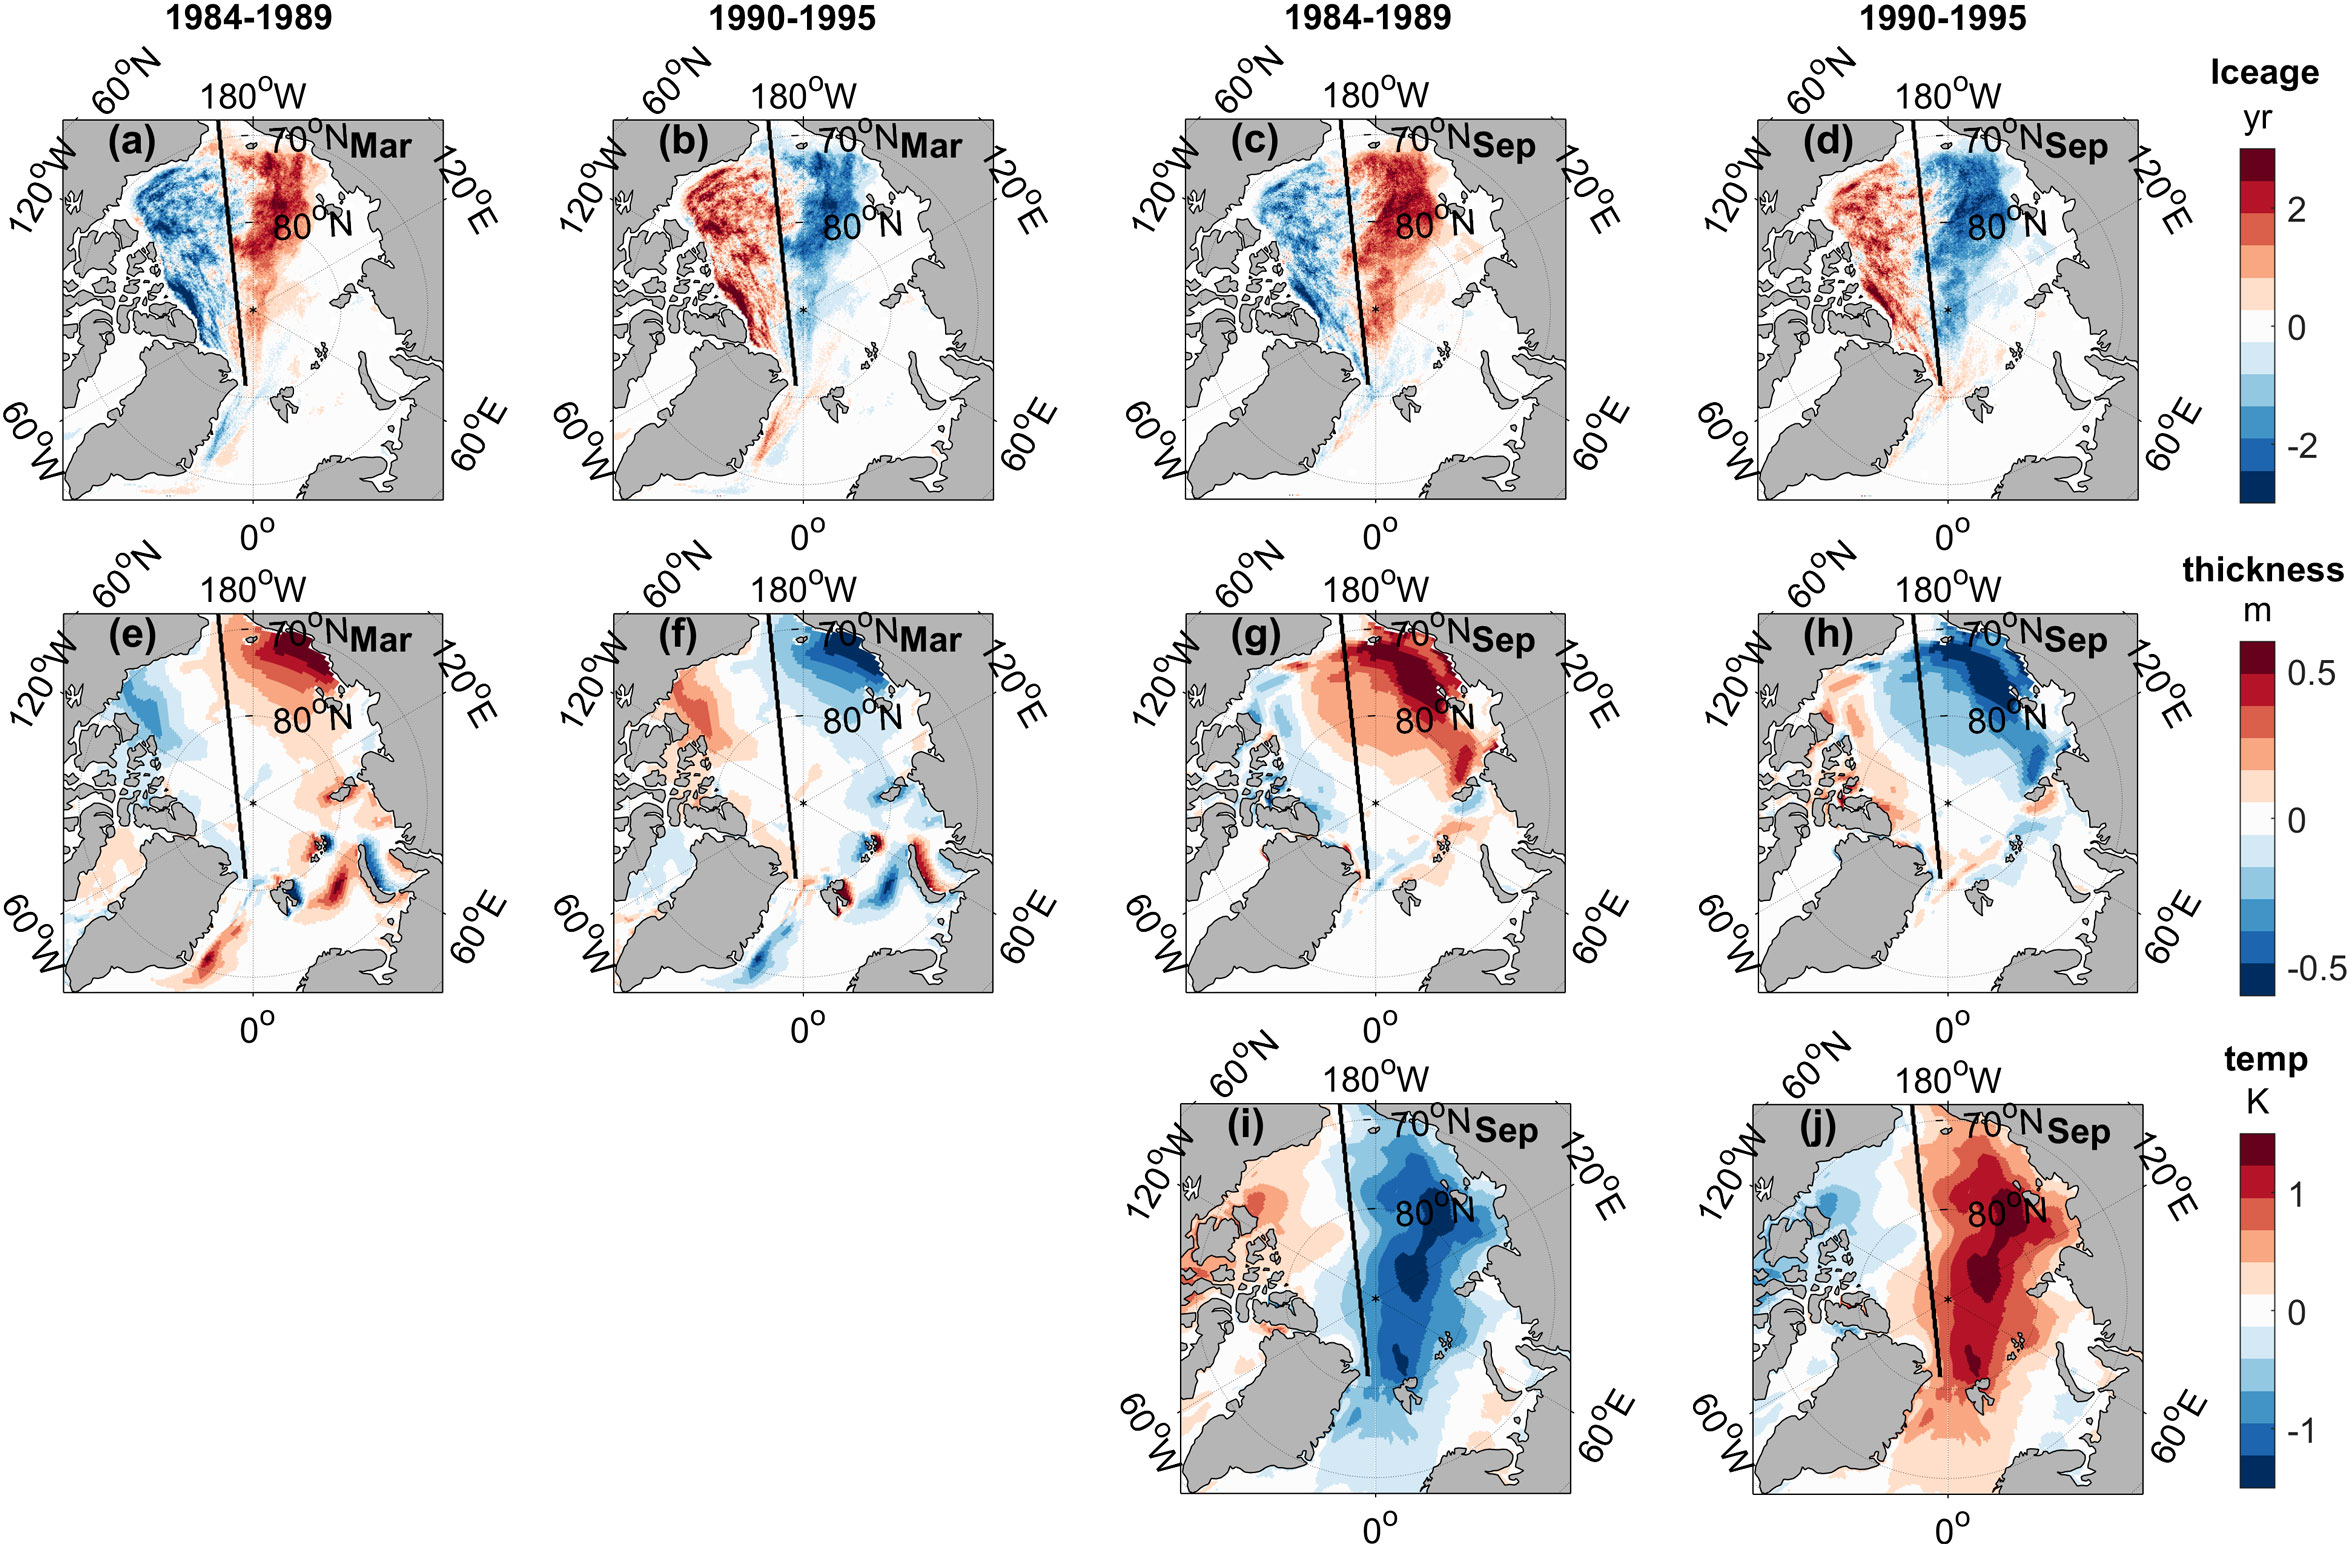
Figure 7 Spatial distribution of sea ice age (A–D), ice thickness (E–H), and 2-m temperature (I, J) anomaly average fields over the periods 1984-1989 and 1990-1995 in the Arctic Ocean.
During the period 1996-2012, the extent of MYI in the Arctic Ocean decreased compared to the previous period. The area of 3+yr ice retreated to the western regions of the Arctic Ocean, but still accounted for 32.6% (in March) and 34.4% (in September) of the total sea ice area. During this period, there was a consistent trend of declining ice age in the Arctic Ocean as a whole, as evidenced by the rapid retreat of the MYI area. Specifically, the extent of 3+yr ice decreased considerably (Figures 6B, E). Since 2013, the MYI extent reached its lowest historical level, and the proportion of seasonal sea ice within the Arctic sea ice extent exceeded 70.8%. During this period, the trend-like changes in sea ice age were relatively mild, indicating a period of low sea ice age, indicating the trend-like changes in ice age were relatively weak.
The above analysis indicates that the spatial variations of ice age in the Arctic Ocean are characterized by a general decrease in ice age throughout the entire region and an antiphase variation between the eastern and western Arctic Ocean. The data indicate that from 1984 to 2022 there was an overall trend of rapid sea ice age reduction, although the specific characteristics of the variations varied across different time periods. Bi et al. (2020) found that in the earlier period, the sea ice age in the Canadian Basin had a slightly older tendency. The period from 1984 to 1995 was characterized by high ice age, with an antiphase variation of sea ice age between the eastern and western Arctic Ocean. The sea ice age gradually transitioned from 4+yr to lower age categories, representing a period of significant variations. The period from 1996 to 2012 marked the peak of sea ice age reduction, characterized by a rapid reduction in MYI extent. Winter months witnessed a substantial presence of 1yr ice, whereas summer months (September) experienced extensive open water areas. This phase represents a transition where MYI is gradually replaced by seasonal sea ice, leading to a reduction in the MYI extent to a lower level. The years from 2013 to 2022 represent a low ice age period, characterized by a significant negative phase of ice age. During this period, the MYI extent was relatively small, with seasonal sea ice dominating. Moreover, trend-like changes in the sea ice age distribution were relatively weak.
3.2 Coupling relationship between winter ice age and atmospheric circulation variations
We employed SVD analysis to examine the impact of winter (January to March) sea surface wind fields on March ice age variations during different timeframes. The following sections will be devoted to the discussion of the first mode identified by the SVD analysis (Figure 8).
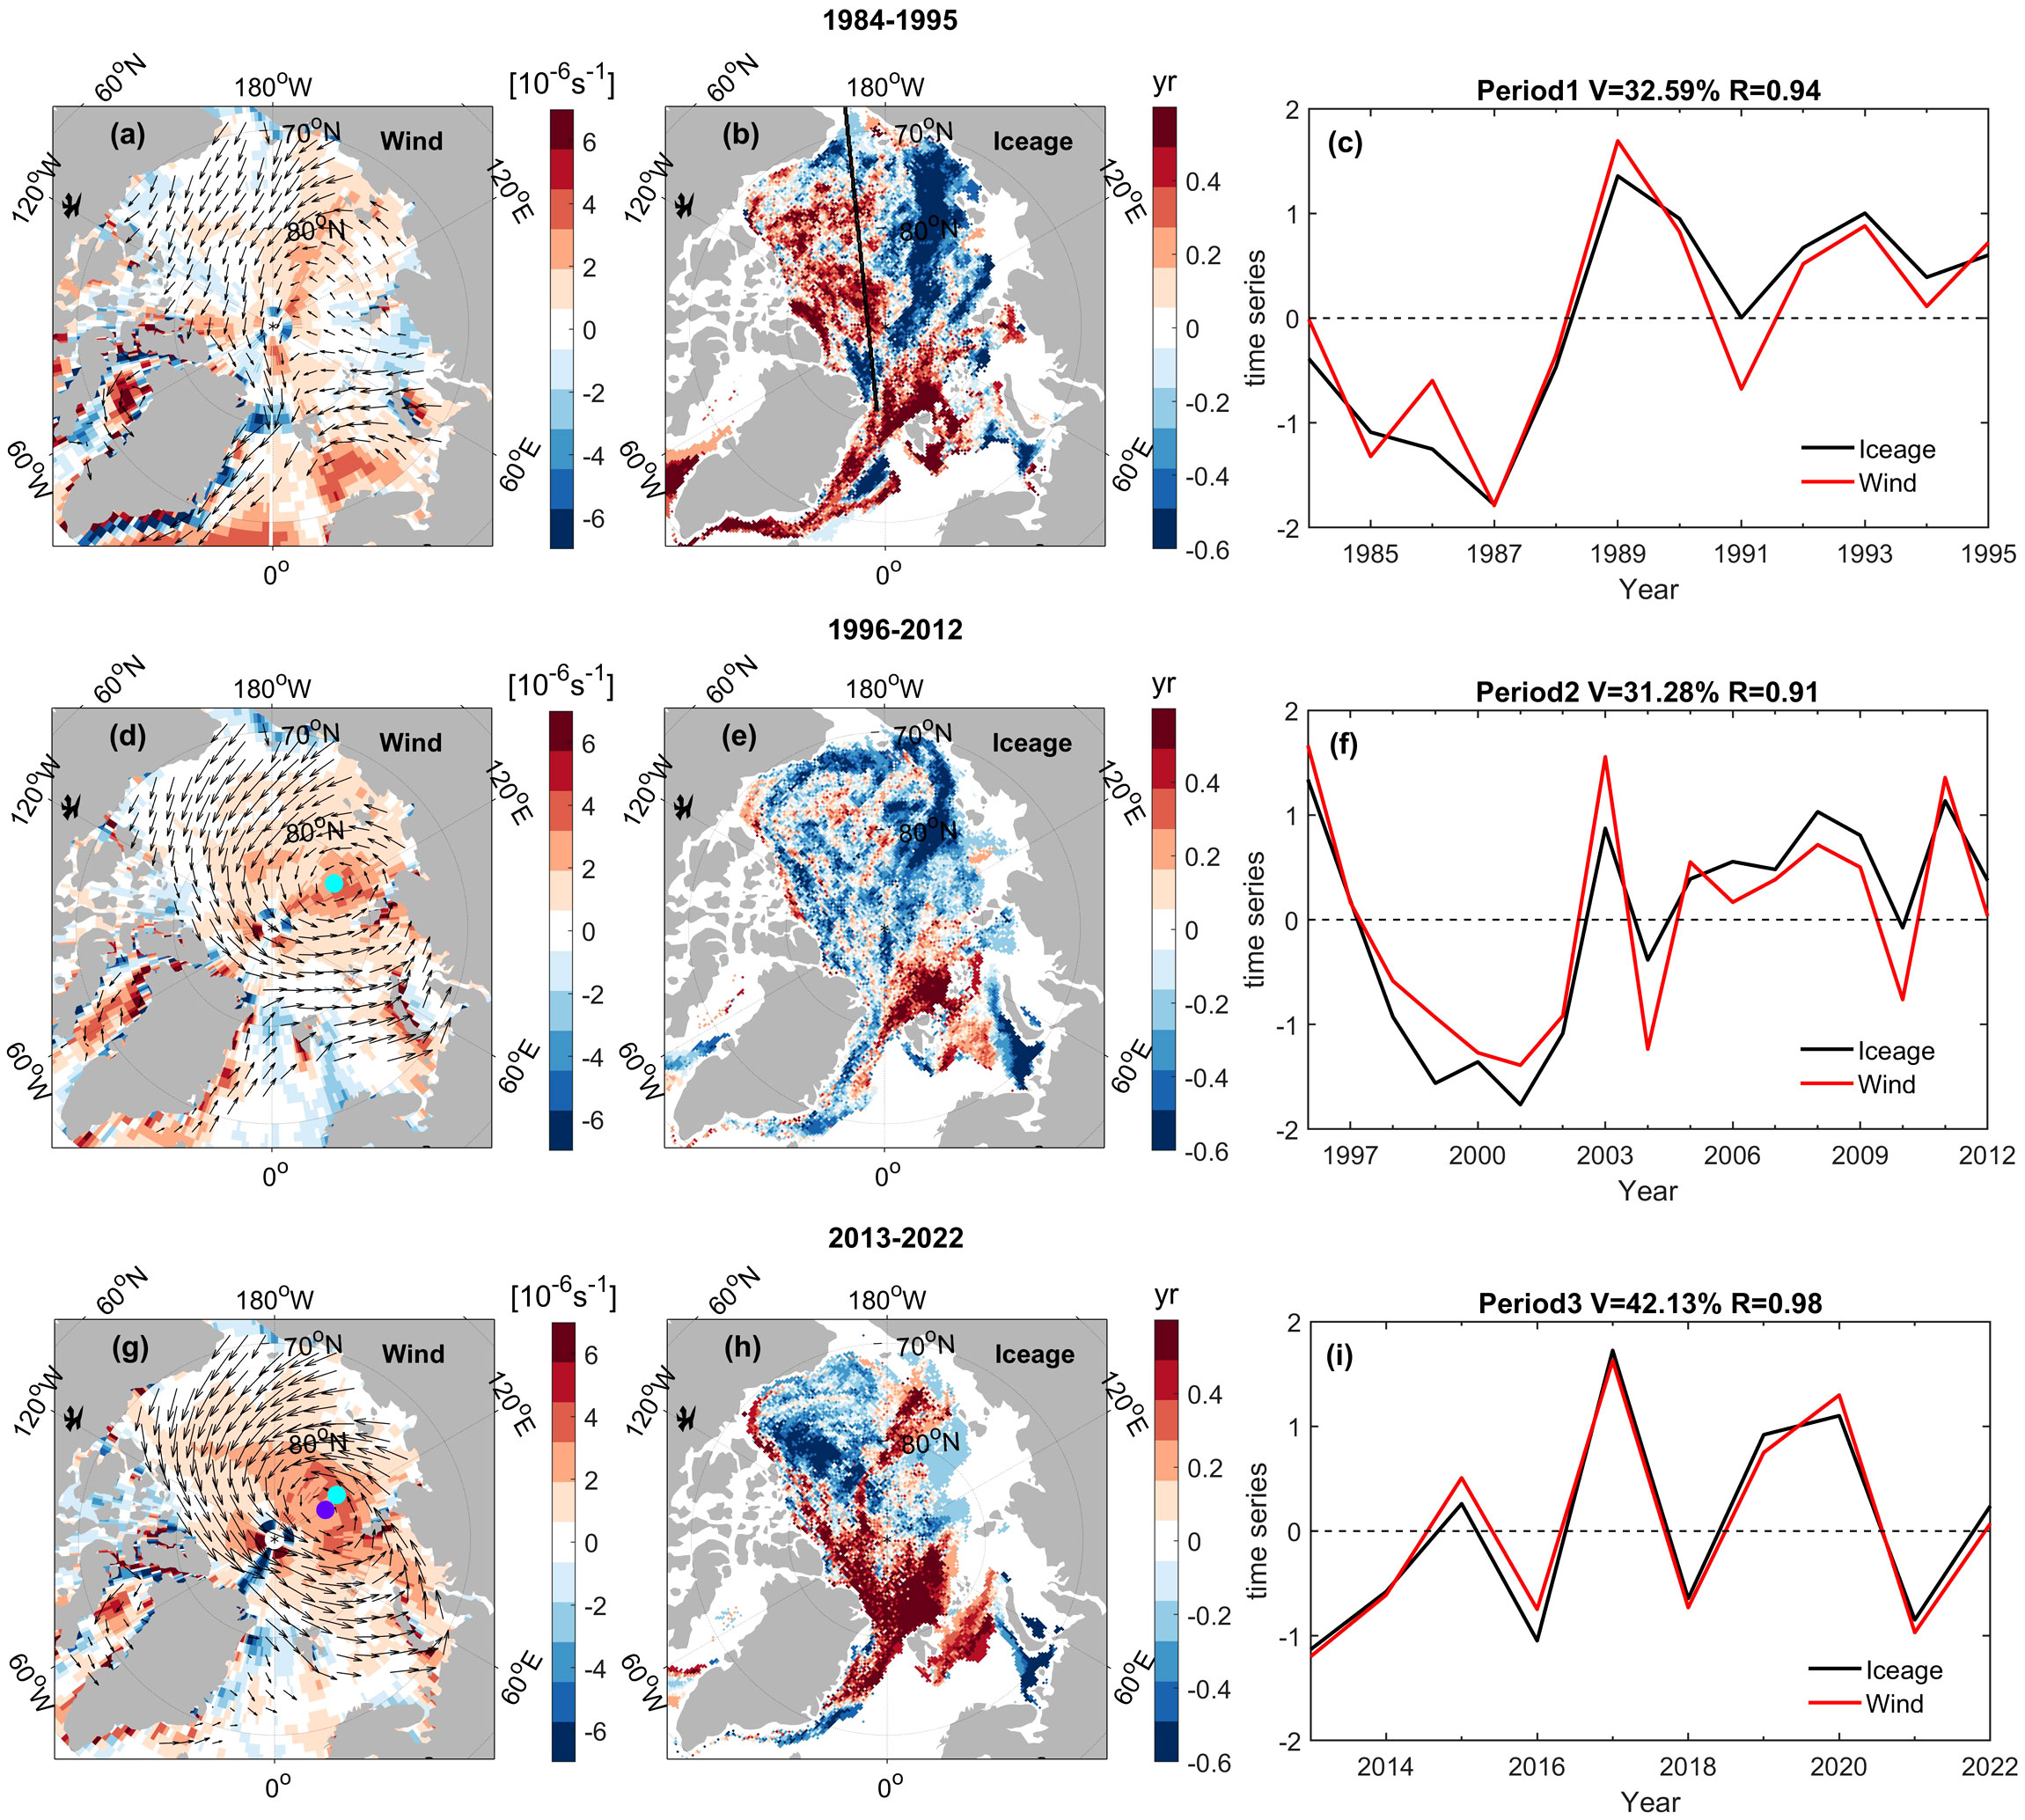
Figure 8 The first mode of SVD analysis between winter (January-March) sea surface wind field and standardized anomaly of sea ice age in March for three periods: 1984-1995, 1996-2012, and 2013-2022. Column 1: spatial mode of sea surface wind field (color bar indicates wind vorticity, with cyan and purple circles representing the cyclonic wind field circulation centers in the second and third periods, respectively) (A, D, G). Column 2: spatial mode of sea ice age (B, E, H). Column 3: time series of wind field and sea ice age (C, F, I).
The SVD analysis of winter sea surface wind fields and sea ice age during the period of 1984-1995 revealed that the first mode accounted for 32.6% of the covariance. A significant transition was observed in 1988, characterized by a shift from a negative to a positive phase. The main characteristic of the wind field is a weak anticyclonic/cyclonic wind field circulation flowing from the western/eastern part of the Arctic Ocean towards the eastern/western part before/after 1988. The variations in wind field circulation resulted in a negative anomaly/positive anomaly of sea ice age in the western/eastern Arctic Ocean before 1988 and a positive anomaly/negative anomaly after 1988 (Figures 8A–C). The variations in sea surface wind field and sea ice age during this timeframe are highly correlated (R=0.94), indicating that the cyclonic wind field circulation, which flows from the eastern to the western Arctic Ocean, plays a dual role. On the one hand, this circulation facilitates the accumulation of thick ice in the western Arctic Ocean; on the other hand, it promotes ice divergence within the Eurasian Basin and outward transport from the Eurasian Basin, leading to the antiphase variations in sea ice age between the eastern and western Arctic Ocean.
During the winter period of 1996-2012, under the positive phase of SVD-PC1 between the sea surface wind field and ice age, the wind field mode exhibited an anomalous cyclonic wind blowing from the East Siberian coast towards the Barents Sea. The cyclonic center was located at 125.5°E, 82.2°N. The wind field’s vorticity is positive, indicating ice divergence. Driven by this wind field circulation, the corresponding sea ice age field reveals a general decrease in the entire Arctic Ocean, aside from the Barents Sea and its northwest region. During this timeframe, the winter season experiences an initial increase followed by a decrease in the extent of MYI (Figure 1C). The temporal coefficients of the wind field and sea ice age also undergo a transition from positive to negative and then back to positive values (Figures 8D–F).
Under the positive phase of the SVD-PC1 for the winter season sea surface wind field and sea ice age during the period of 2013-2022, the wind field mode exhibits an anomalous cyclonic wind pattern blowing from the coastal regions of East Siberia towards the Atlantic sector, with the cyclone center located at coordinates (120.0°E, 84.0°N). Compared with the second timeframe, this pattern has shifted towards the northwest direction and increased in intensity. Under the influence of the cyclonic wind pattern, the sea ice disperses and is transported from the coastal regions of East Siberia towards the Atlantic sector. The wind-driven sea ice age exhibits positive anomalies in the range of -120° to -100°E, while negative anomalies dominate in other areas. The variations in wind field and sea ice age during this period are primarily characterized by interannual variations, with alternating positive and negative anomalies occurring (see Figures 8G–I).
The atmospheric pressure field and its associated wind-driven sea ice export and regional exchange are the dynamic drivers of MYI variations (Watanabe et al., 2006). Based on the results of the wind field and sea ice age SVD analysis, we extracted the time series of the wind field from SVD-PC1 to calculate the composite field of surface atmospheric pressure north of 20°N (the difference between the pressure anomaly fields in the positive and negative phases of SVD-PC1). This allows us to analyze the atmospheric pressure modes that cause variations in sea ice age.
From Figures 8 and 9, it can be seen that the winter AO drives the cyclonic wind circulation, which in turn leads to variations in sea ice age. The correlation coefficients between the AO index and the time series of the wind field in SVD-PC1 for the three periods are 0.90, 0.63, and 0.94 respectively, all exceeding a 99% confidence level. During the winter of 1984-1995, the low-pressure center of atmospheric pressure shifted towards the Atlantic, with a large coverage area spanning the entire Atlantic sector (Figure 9A). This atmospheric pressure pattern generated a weak cyclonic wind circulation, flowing from the eastern to the western Arctic Ocean, driving the antiphase variation in sea ice age between the eastern and western regions. During the winter of 1996-2012, the low-pressure center of atmospheric pressure shifted towards the Eurasian Basin, with a relatively smaller coverage area (Figure 9B). The Arctic Ocean was predominantly covered by low-pressure systems, resulting in a cyclonic wind circulation pattern. This cyclonic wind circulation led to ice divergence, contributing to the reduction of MYI in the region. During the winter of 2013-2022, the low-pressure center of atmospheric pressure remained located in the Eurasian Basin. However, in comparison to the second period, the low-pressure center shifted towards the Atlantic sector, resulting in a larger coverage area (Figure 9C). This atmospheric pressure mode generated a cyclonic wind circulation, with winds blowing from the Laptev Sea-Chukchi Sea towards the Barents Sea-Kara Sea. As a result, the sea ice age increased in the range of -120°to -100°E and decreased in other areas of the Arctic Ocean.
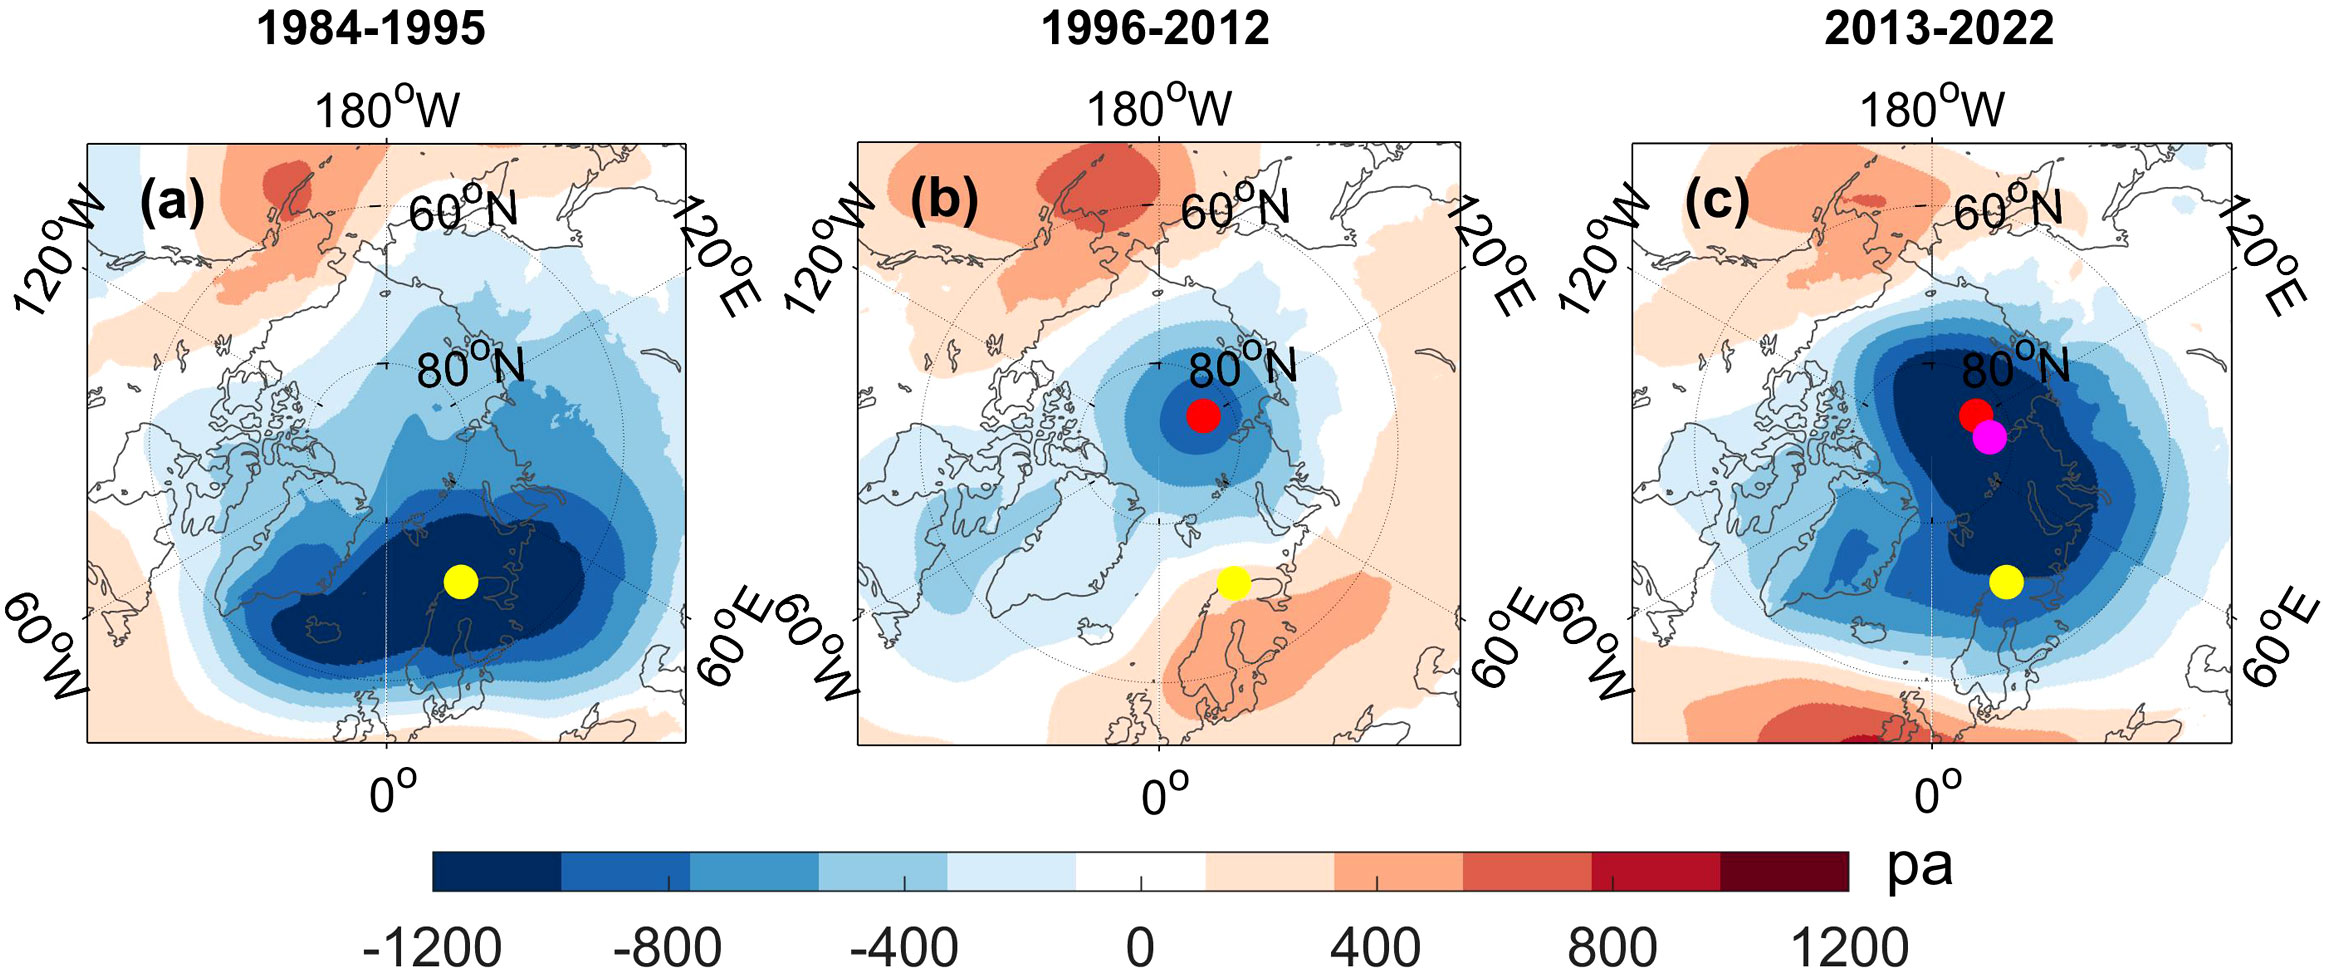
Figure 9 Synthesis analysis results of atmospheric pressure field during three periods (1984-1995 (A), 1996-2012 (B), and 2013-2022 (C)) in January to March. Yellow, red, and pink circles represent the centers of low pressure systems in the respective periods.
3.3 Coupling relationship between summer ice age and atmospheric circulation variations
The wind anomalies in summer (July-September) can influence the subsequent sea ice anomalies in September (Rigor and Wallace, 2004). In the period of 1984-1995, the SVD-PC1 analysis of summer sea surface wind fields and September sea ice age showed a transition in 1988 from a negative phase to a positive phase. The dominant feature of the wind field was a closed cyclonic/anticyclonic circulation before/after 1988, with the cyclonic center located at coordinates (171.9°E, 82.0°N). During the positive phase of SVD-PC1, the winds blow from the eastern to the western part of the Arctic Ocean. The wind-driven sea ice age in the western Arctic Ocean is negative before 1988 and positive after, while in the eastern region, it is predominantly positive before 1988 and negative after (see Figures 10A–C). The correlation coefficient of 0.94 between the time series of the two variable fields indicates that anticyclonic wind patterns lead to enhanced ice drift towards the outer regions of the eastern Arctic Ocean (reduced ice age), resulting in the transport of more MYI to the western regions (increased ice age). This leads to antiphase variations in ice age between the eastern and western parts of the Arctic Ocean in September.
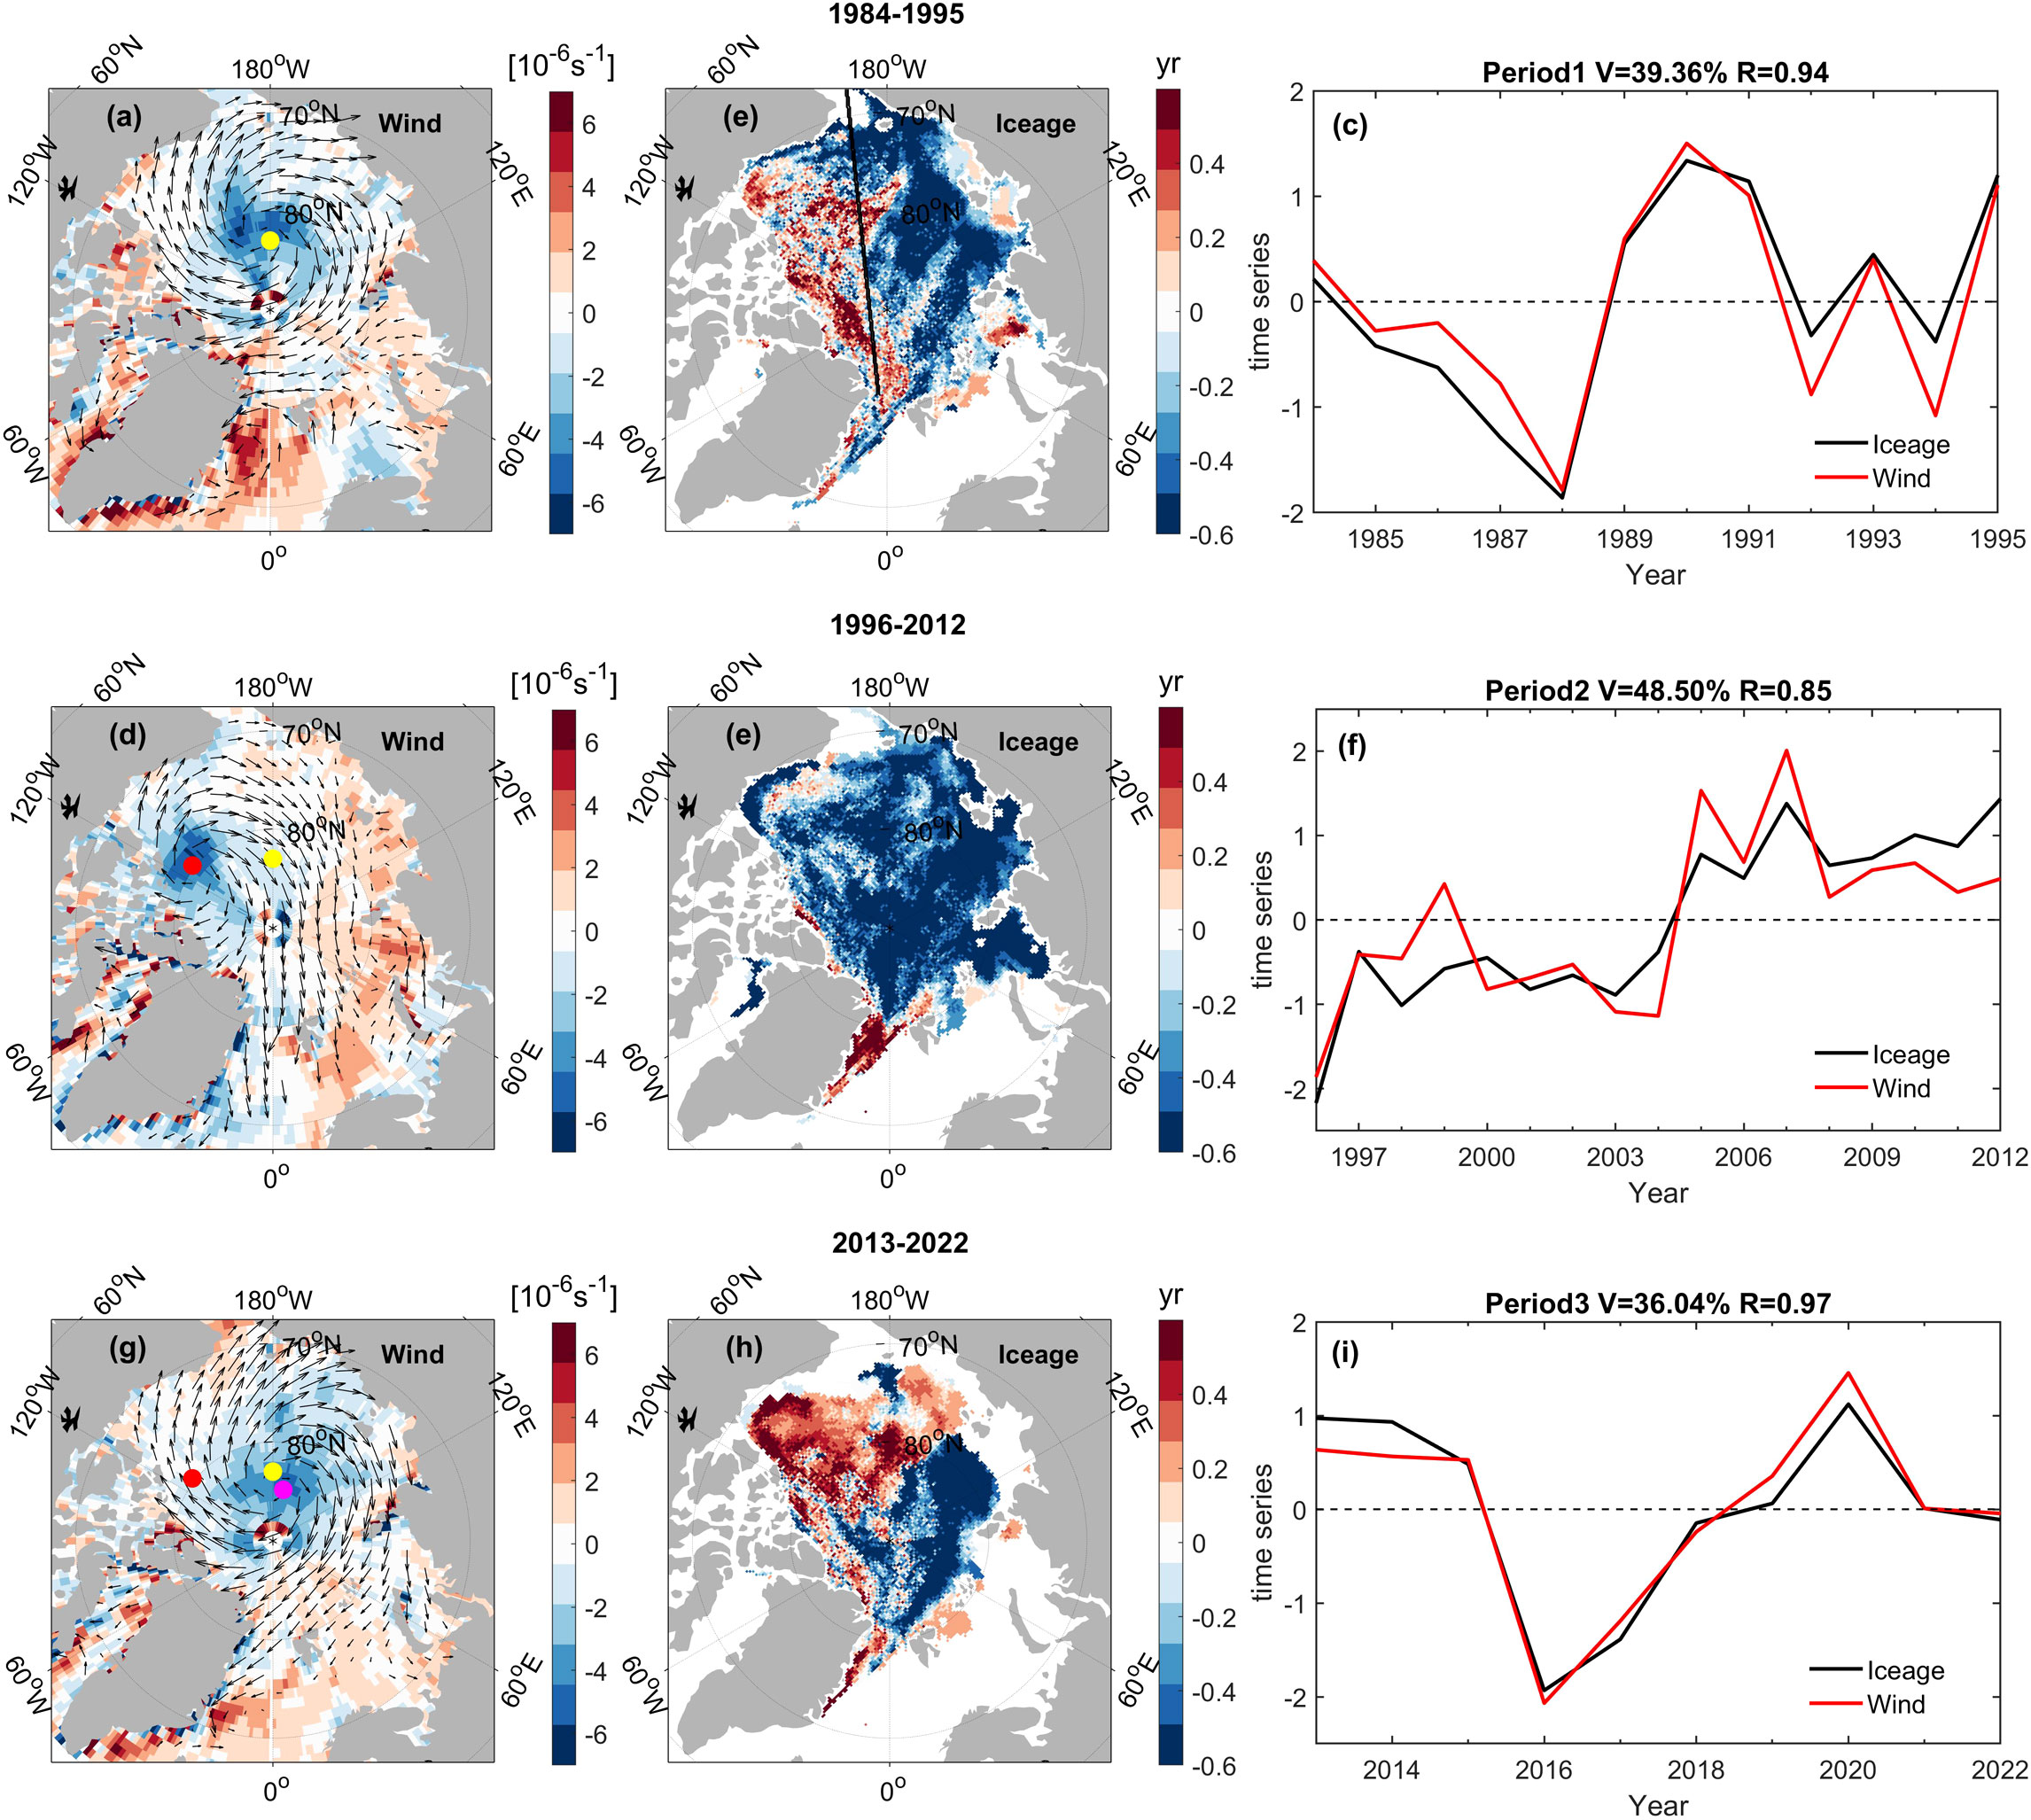
Figure 10 The first mode of SVD analysis between summer (July-September) sea surface wind field and standardized anomaly of sea ice age in September for three periods: 1984-1995, 1996-2012, and 2013-2022. Column 1: spatial mode of sea surface wind field (color bar indicates wind vorticity, with yellow, red, and pink circles representing the anticyclonic wind field circulation centers in the first, second and third periods, respectively) (A, D, G). Column 2: spatial mode of sea ice age (B, E, H). Column 3: time series of wind field and sea ice age (C, F, I).
During the period from 1996 to 2012, the SVD analysis of summer sea surface wind field and September sea ice age reveals that the first mode contributes to 48.5% of the covariance. Under the positive phase of SVD-PC1, the wind field exhibits a pattern characterized by the Beaufort Gyre and Transpolar Drift, which reflected in the trend of Arctic sea ice motion(Bi et al., 2019; Zhang et al., 2022). The Transpolar Flow originates from the Pacific sector and traverses the central Arctic, flowing towards the Atlantic Ocean. The central axis of the Transpolar Flow exhibits a deviation towards the direction of the Prime Meridian. The corresponding sea ice age field shows an overall change across the entire Arctic Ocean, except for the eastern region of Greenland. Specifically, there is a transition from negative to positive phase around the year 2004. The temporal coefficients of the two variable fields show a predominant increasing trend, corresponding to the strengthening of the Beaufort Gyre and Transpolar Drift, as well as the decrease in sea ice age. The correlation coefficient between the two variables is 0.85 (∂<0.01) (See Figures 10D–F). Under the positive phase, thick ice in the Pacific sector flows towards the Atlantic sector driven by meridional winds and exits the Arctic Ocean through the Fram Strait. This dynamic process serves as the driving mechanism for the rapid retreat of MYI during this period. In a study by Wang et al. (2009), it was noted that anomalous meridional winds contribute to the net export of MYI from the Arctic Ocean to the Fram Strait.
Our methodology also addressed the specific timeframes and the relationship between ocean dynamics and sea ice age. In addition, the wind patterns of the Beaufort Gyre and Transpolar Drift contribute to a significant inflow of MYI from the northern regions of the Canadian Arctic Archipelago into the southern Beaufort Sea. It has been observed that the sea ice in this region undergoes intense melting during the summer months (Bi et al., 2019), which is also a contributing factor to the reduction of MYI. However, it is noteworthy that under this pattern, the decrease in sea ice age is not limited to the regions of MYI. The marginal seas where seasonal sea ice exists also exhibit a significant decrease in sea ice age.
During the period from 2013 to 2022, under the positive phase of the summer wind field and September sea ice age SVD-PC1, a closed anticyclonic wind field circulation pattern was observed. Compared with the first period, there is a northwestward shift in the center of the circulation. Furthermore, the wind vorticity in the Pacific sector is negative, leading to ice convergence and an increase in sea ice age. On the other hand, there is an enhancement of wind transport from the Atlantic sector towards the Fram Strait, resulting in increased ice export towards the Atlantic Ocean and a decrease in sea ice age. This clockwise wind circulation pattern contributes to an increase in sea ice age in the Pacific sector and a decrease in sea ice age in the Atlantic sector (refer to Figures 10G–I).
The findings shown in Figures 10 and 11 demonstrate that during the period of 1984-1995, in summer, when the AO was in its negative phase, there was a positive anomaly in sea-level pressure (SLP) over the Arctic Ocean (Figure 11A). This atmospheric pressure pattern resulted in an anomalous anticyclonic wind circulation, with winds blowing from the eastern to the western Arctic Ocean. It appears that these winds drove the transport of MYI from the eastern to the western Arctic Ocean, leading to antiphase variations in the sea ice age distribution between the eastern and western regions (Figures 10A, B). During the period of 1996-2012, the summer composite analysis of atmospheric pressure reveals the presence of the Arctic DA, characterized by positive anomalies in sea-level pressure (SLP) over the western Arctic and negative anomalies over the eastern Arctic (Figure 11B). The wind field associated with the DA exhibits a combination of Beaufort Gyre and Transpolar Drift circulation patterns. Under the influence of these wind patterns, the thick ice in the Pacific sector of the Arctic Ocean is transported meridionally towards the Atlantic sector, eventually exiting the Arctic Ocean through the Fram Strait. This process contributes to a reduction in sea ice age within the region. During the period of 2013-2022, the summer atmospheric conditions were dominated by the AO. Compared to the first period, there was a shift in the atmospheric pressure center towards the Eurasian Basin, accompanied by an expansion of the low-pressure system (Figure 11C). The negative phase of the AO drives an anticyclonic wind field circulation pattern. On the one hand, this pattern leads to ice convergence in the Pacific sector, resulting in an increase in sea ice age. On the other hand, the same process strengthens the wind transport from the Atlantic sector towards the Fram Strait, enhancing the ice export to the Atlantic Ocean and leading to a decrease in sea ice age.
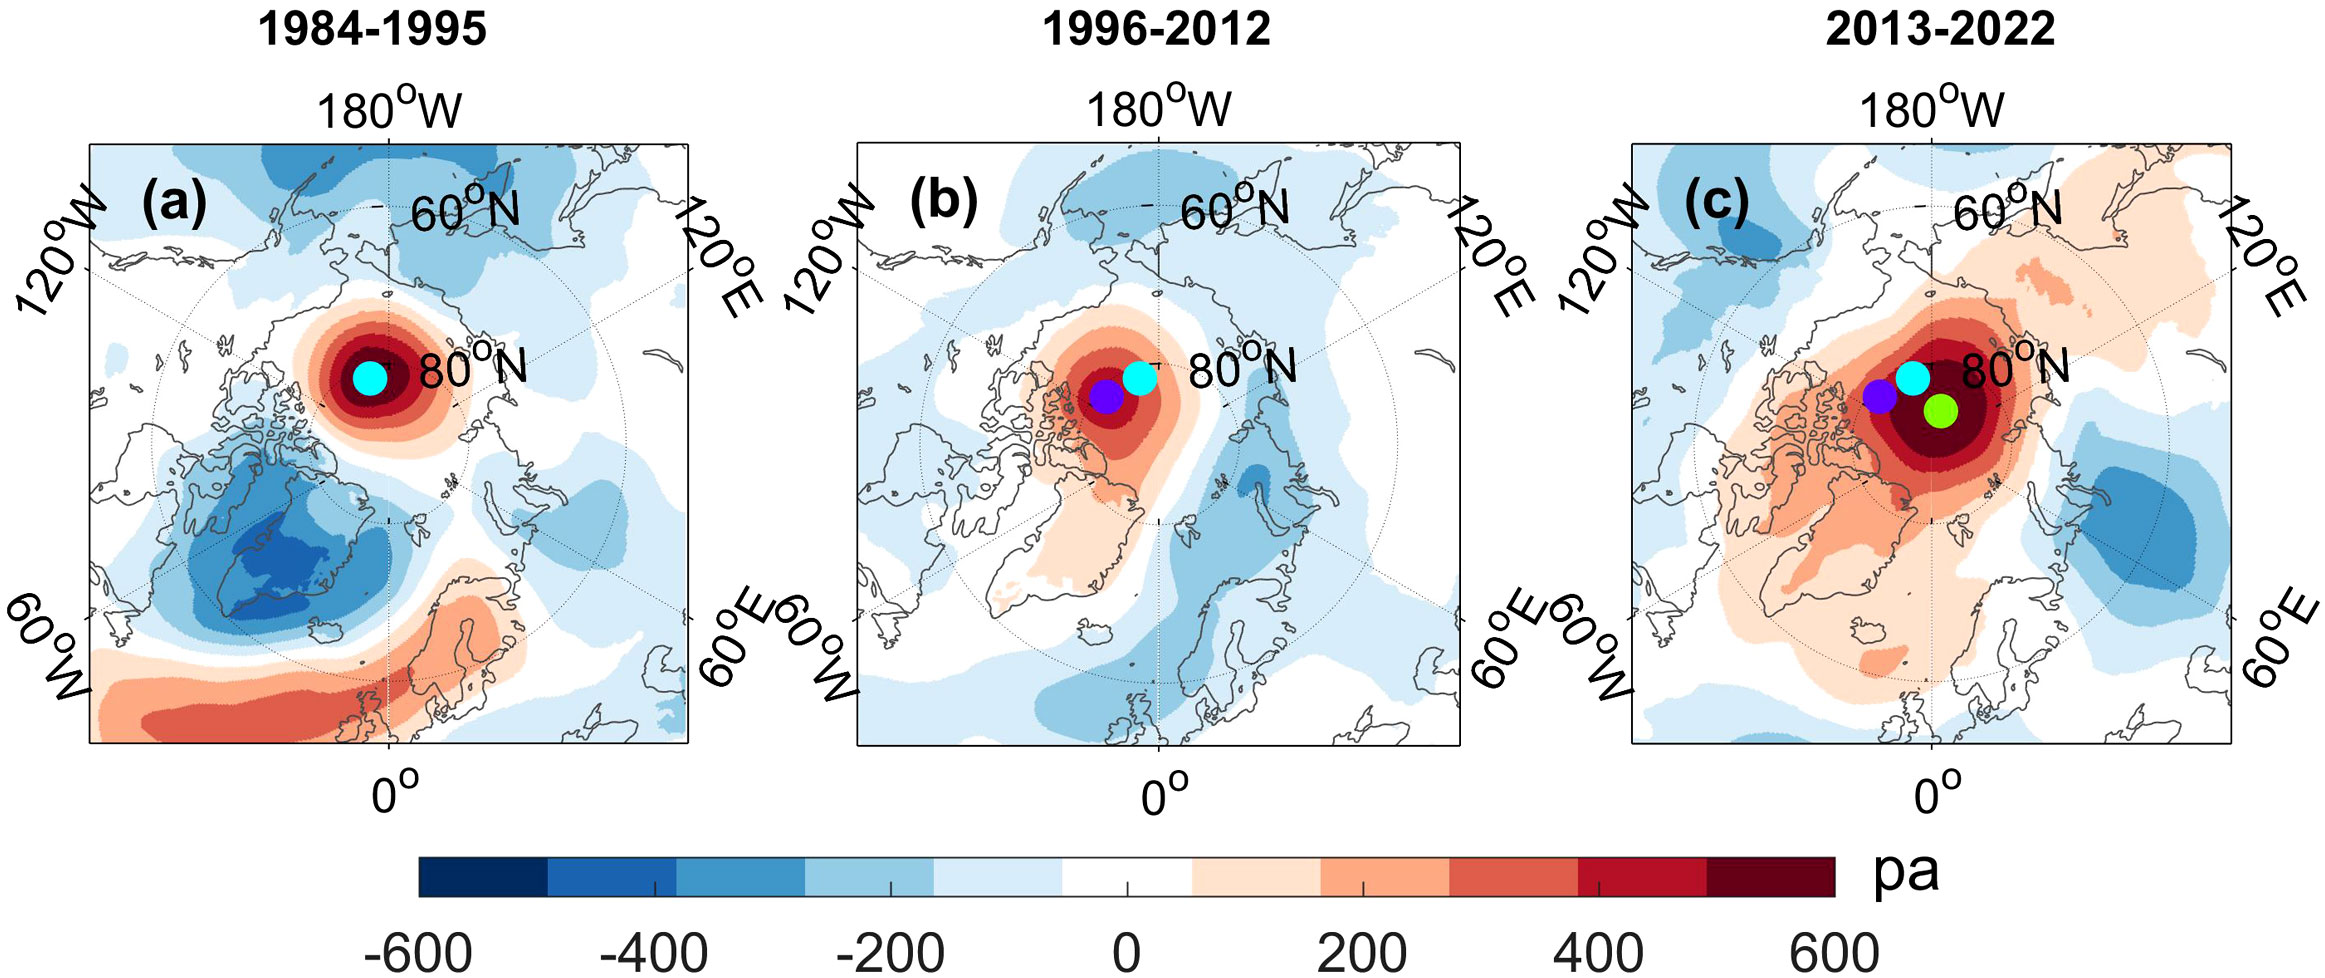
Figure 11 Synthesis analysis results of atmospheric pressure field during three periods (1984-1995 (A), 1996-2012 (B), and 2013-2022 (C)) in July to September. Cyan, purple, and green circles represent the centers of high pressure systems in the respective periods.
The reduction of MYI is accompanied by a thinning of sea ice thickness, which has been observed in the Greenland and the northern regions of the Canadian Arctic Archipelago coast (Kumar et al., 2020). We found that since 2013 the MYI extent was relatively small, with seasonal sea ice dominating. Sea ice thickness represent a low-level period, which was difficult to restore to its previous state. That made the Arctic Ocean more susceptible to the effects of climate change and weather processes. As unveiled from satellite observations, the distinct interannual variability of MYI extent are related to large-scale atmospheric circulations. In mid-1990s AO played a leading role, and since 2000 DA exerted more influences (Rigor et al., 2002; Wu et al., 2006; Bi et al., 2016). Our results indicate that winter sea ice age variations were mainly influenced by AO, while summer sea ice age variations from 1996 to 2012 were mainly influenced by DA. However, thermodynamics also plays an important role in the changes of sea ice age, so we will also discuss the effect of air temperature changes on sea ice age in following research.
3.4 Relationship between ice age variations and Arctic warming
Research has shown that trends and variability in surface air temperature tend to be larger in the Arctic region than those of the Northern Hemisphere or globe as a whole (Serreze and Barry, 2011). Assuming that AO/DA and surface air temperature are linearly superposed to form the variation in sea ice age, the contribution rate of each factor can be estimated via a regression equation (Ye et al., 2015). The regression equations are shown in Table 2.
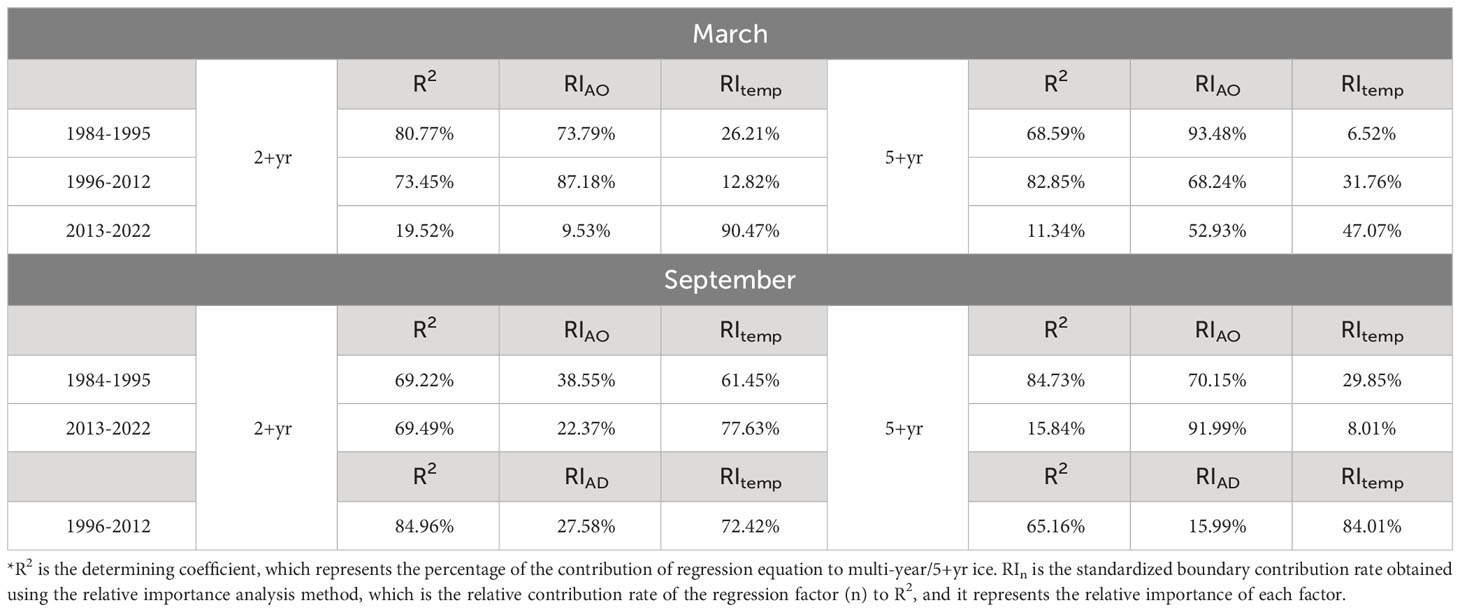
Table 2 Regression analysis of AO/DA and surface air temperature to multi-year/5+yr ice*.
The fitting results are highly consistent with multi-year/5+yr ice before 2012. In March, 80.77%/68.59% and 73.45%/82.85% of multi-year/5+yr ice could be explained by the regression equations during the first/second period respectively. In September, 69.22%/84.73% and 84.96%/65.16% of multi-year/5+yr ice could be explained by the regression equations during the first/second period respectively, indicating that SLP and air temperature are the main factors resulting in the variations of Arctic sea ice age. While during the third period, the fitting results are poorly consistent with Arctic sea ice age (Table 2), indicating that with the decrease of sea ice age, the effects of oceanic inflow, poleward water vapor intrusion and synoptic weather are enhanced (Bi et al., 2020; Kumar et al., 2020).
The influence of AO on ice age was dominant during the period of 1984-1995, while the effect of temperature is significantly enhanced from 1996 to 2012. The effect of the air temperature became more prominent in September, and the standardized boundary contribution rates are 72.42% and 84.01% to multi-year and 5+yr ice respectively, indicating that the Arctic warming is the primary driver of sea ice age changes during the second period (Table 2).
4 Conclusions
In recent years, the Arctic has been undergoing a transition from MYI to seasonal sea ice, with a rapid retreat in the MYI extent. In this study we applied the EOF analysis approach to examine the variations in Arctic sea ice age from 1984 to 2022 and divided the study period into three sub-periods, based on the pre-dominant trends and possible underlying mechanisms. In particular, we analyzed the relationship between sea ice age and atmospheric circulation variations during each of the time periods (Figure 12).
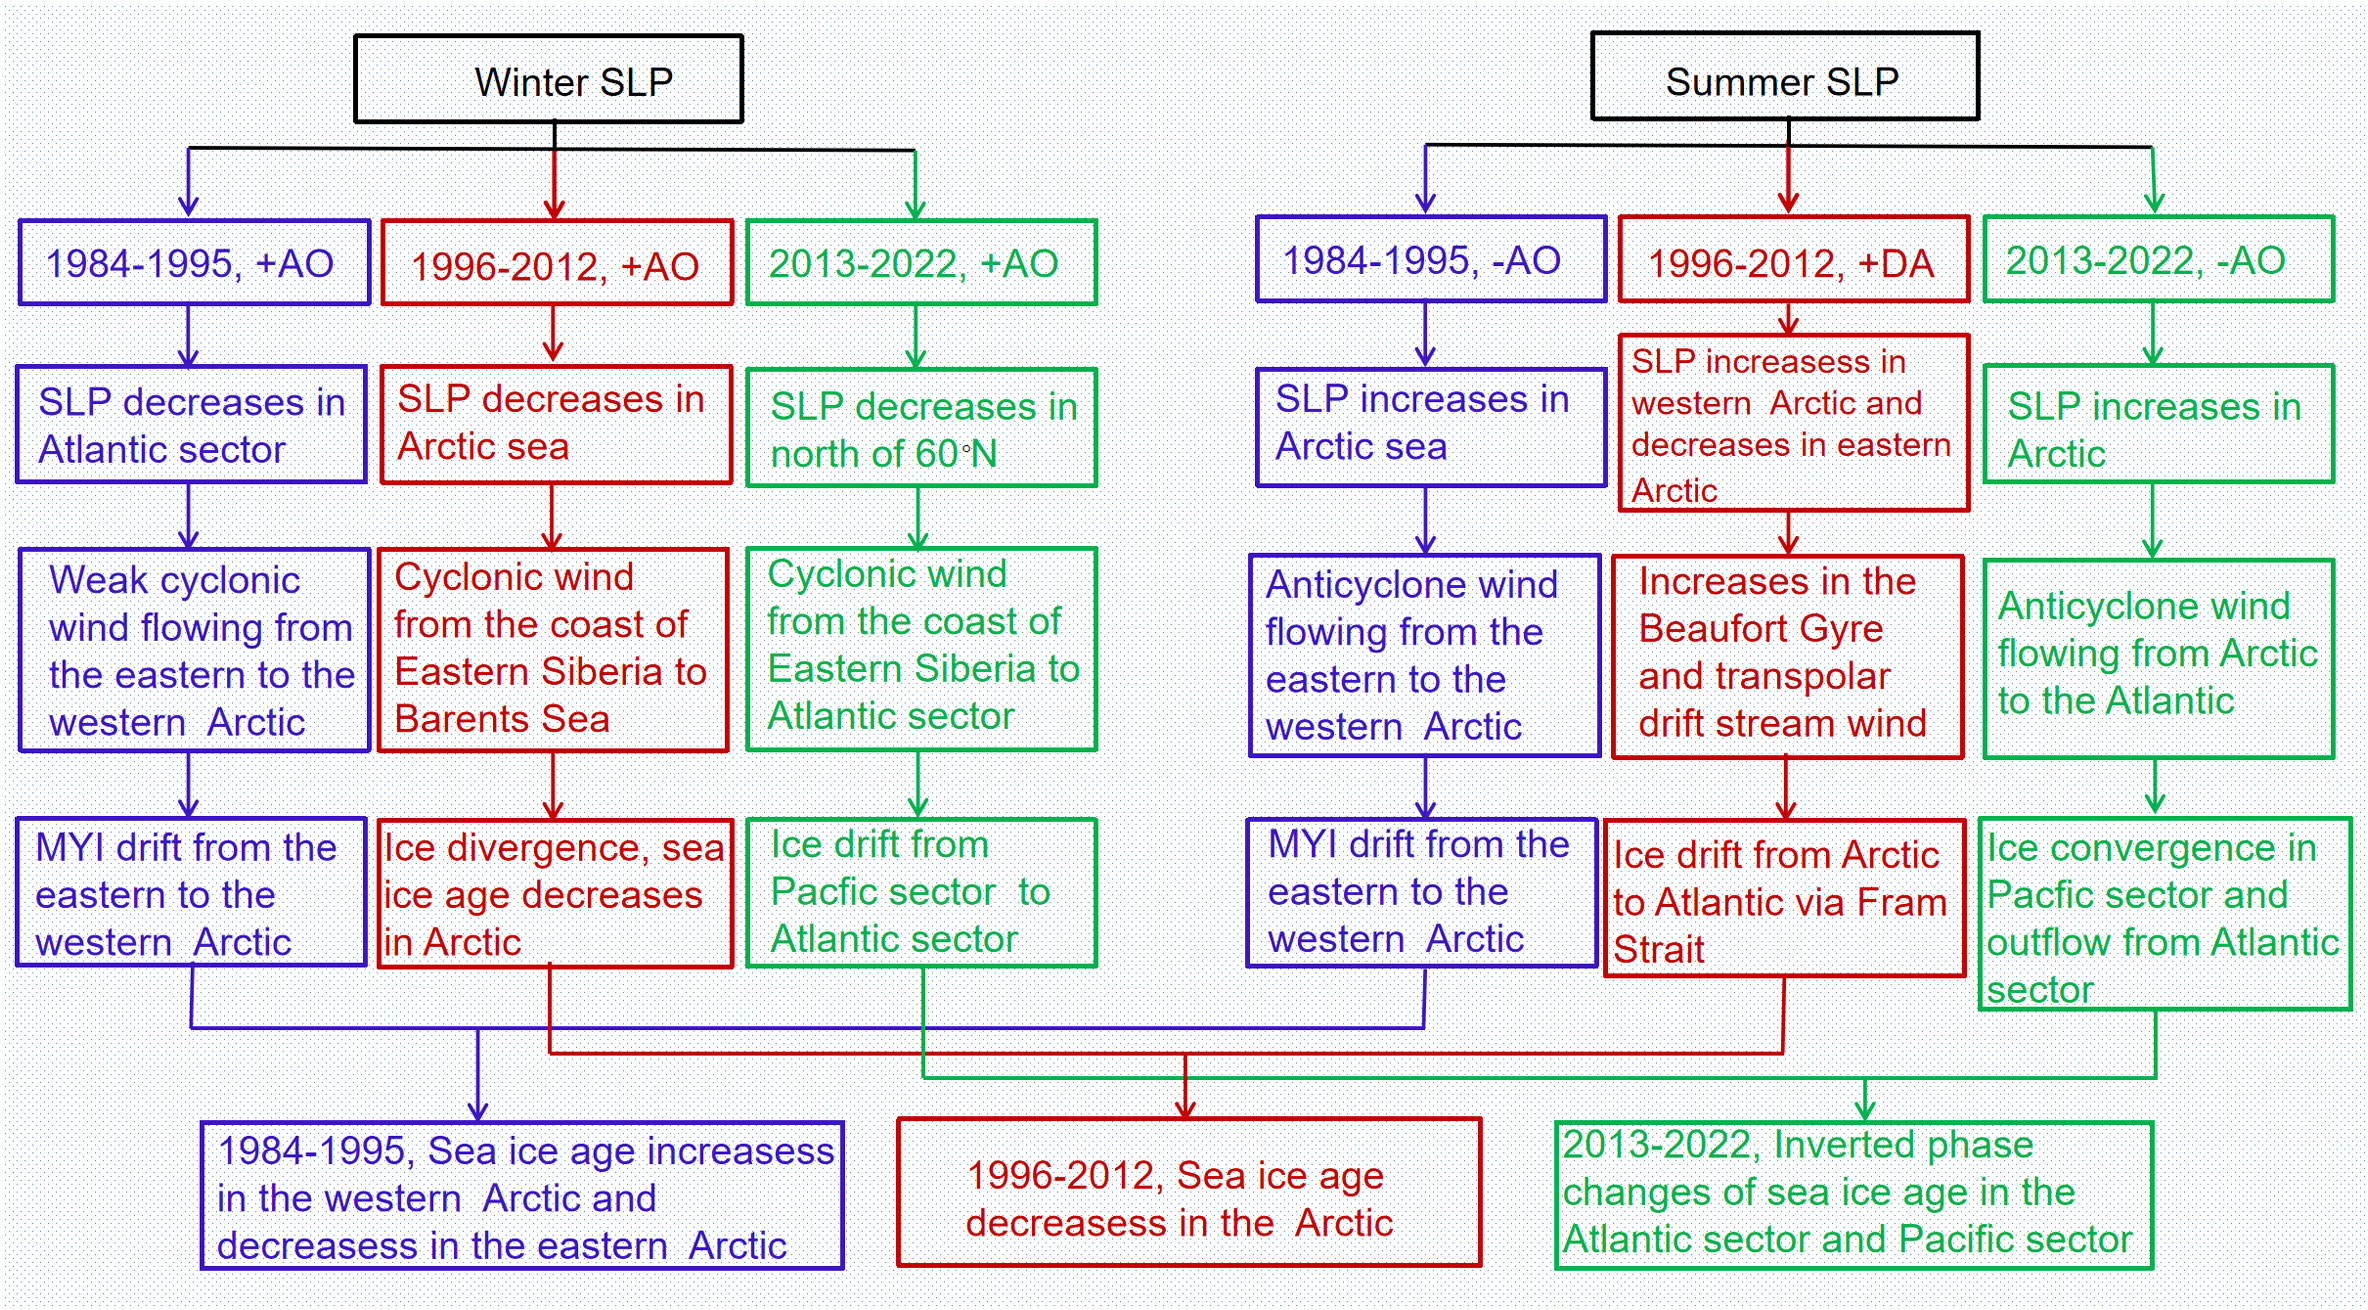
Figure 12 Atmospheric circulation driving mechanisms underlying Arctic sea ice age variations.
(1) The period from 1984 to 1995 is characterized by a high ice age in the Arctic Ocean, with a significant presence of 5+yr ice. During this period, the winter AO, centered around the Atlantic sector, drove a cyclonic wind field circulation (blowing from the eastern to the western Arctic), resulting in the transport of MYI from the eastern Arctic (reducing ice age) toward the western Arctic (increasing ice age). During the summer months, when the AO is in its negative phase, an anticyclonic wind field circulation pattern forms over the Arctic, with winds blowing from the eastern to the western Arctic. This circulation pattern drives the transport of sea ice from the eastern Arctic to the west, resulting in a reduction in sea ice age. Additionally, a significant amount of sea ice enters the western Arctic and converges in the northern region of the Canadian Arctic Archipelago, resulting in an increase in sea ice age. During this period, the variations in the wind field induced by the AO drive antiphase variations in sea ice age between the eastern and western Arctic regions.
(2) The period from 1996 to 2012 marks the peak phase of ice age reduction, characterized by MYI gradually being replaced by seasonal sea ice. During this period, winter ice age variations were primarily influenced by the AO. The positive phase of the AO generated a cyclonic wind field circulation pattern blowing from the East Siberian coast towards the Barents Sea, resulting in sea ice divergence and a reduction in ice age. In summer, Arctic warming facilitated the melting of multi-year ice, which is the primary driver of sea ice age changes during the second period. In dynamics, in the positive phase of DA, positive/negative SLP anomalies were observed in the western/eastern Arctic, giving rise to a wind circulation pattern characterized by the Beaufort Gyre and Transpolar Drift. Under the influence of meridional winds, thick ice in the Pacific sector flowed towards the Atlantic sector and eventually exited the Arctic Ocean through the Fram Strait. This dynamic mechanism is the secondary reason for the rapid MYI retreat during this period.
(3) The period from 2013 to 2022 represents a low ice age phase, characterized by significantly negative phase in ice age. The variations of winter and summer ice age during this period were primarily influenced by the AO. The cyclonic wind field mode generated by the winter AO drove the exchange of sea ice between different regions, whereas the summer wind field mode affected ice convergence/divergence and the transport of sea ice towards the Atlantic. In this third time period, variations of sea ice age were dominated by interannual variations, accompanied by weaker trend-like changes.
Data availability statement
The original contributions presented in the study are included in the article/supplementary materials, further inquiries can be directed to the corresponding author/s.
Author contributions
PC: Formal Analysis, Methodology, Project administration, Writing – original draft, Writing – review & editing. XW: Writing – review & editing. JZ: Writing – review & editing. TL: Conceptualization, Methodology, Writing – review & editing. JS: Conceptualization, Methodology, Writing – review & editing. FZ: Writing – review & editing. LW: Writing – review & editing.
Funding
The author(s) declare financial support was received for the research, authorship, and/or publication of this article. This research was funded by the key project of the Chinese Natural Science Foundation “Research on the Energy Process of Rapid Change of Arctic” (41941012), the Chinese Natural Science Foundation (42076228), the Chinese Natural Science Foundation (42276239), the Natural Science Foundation of Shandong Province Foundation (ZR2022MD076) and Foundation “Variation of Arctic Sea Ice Age and Its Relationship with Atmospheric Circulation Field” (PY112101).
Acknowledgments
We thank Jie Su for her helpful comments. We would also like to thank the reviewers and editors whose comments helped improve our article.
Conflict of interest
The authors declare that the research was conducted in the absence of any commercial or financial relationships that could be construed as a potential conflict of interest.
Publisher’s note
All claims expressed in this article are solely those of the authors and do not necessarily represent those of their affiliated organizations, or those of the publisher, the editors and the reviewers. Any product that may be evaluated in this article, or claim that may be made by its manufacturer, is not guaranteed or endorsed by the publisher.
References
Bi H., Liang Y., Wang Y., Liang X., Zhang Z., Du T., et al. (2020). Arctic multiyear sea ice variability observed from satellites: a review. J. Oceanol Limnol 38 (4), 962–984. doi: 10.1007/s00343-020-0093-7
Bi H., Sun K., Zhou X., Huang H., Xu X. (2016). Arctic Sea ice area export through the Fram Strait estimated from satellite-based data: 1988–2012. IEEE J. Selected Topics Appl. Earth Observations Remote Sens. 9 (7), 3144–3157. doi: 10.1109/JSTARS.2016.2584539
Bi H., Yang Q., Liang X., Zhang L., Wang Y., Liang Y., et al. (2019). Contributions of advection and melting processes to the decline in sea ice in the Pacific sector of the Arctic Ocean. Cryosphere 13 (5), 1423–1439. doi: 10.5194/tc-13-1423-2019
Comiso J. C. (2012). Large decadal decline of the Arctic multiyear ice cover. J. Climate 25 (4), 1176–1193. doi: 10.1175/JCLI-D-11-00113.1
Deser C., Walsh J. E., Timlin M. S. (2000). Arctic sea ice variability in the context of recent atmospheric circulation trends. J. Climate 13 (3), 617–633. doi: 10.1175/1520-0442(2000)013<0617:ASIVIT>2.0.CO;2
Fowler C., Emery W. J., Maslanik J. (2004). Satellite-derived evolution of Arctic sea ice age: October 1978 to March 2003. IEEE Geosci. Remote Sens. Lett. 1 (2), 71–74. doi: 10.1109/LGRS.2004.824741
Galley R. J., Babb D., Ogi M., Else B. G. T., Geilfus N. X., Crabeck O., et al. (2016). Replacement of multiyear sea ice and changes in the open water season duration in the B eaufort S ea since 2004. J. Geophysical Research: Oceans 121 (3), 1806–1823. doi: 10.1002/2015JC011583
Hannachi A., Jolliffe I. T., Stephenson D. B. (2007). Empirical orthogonal functions and related techniques in atmospheric science: A review. Int. J. Climatol: A J. R. Meteorol Soc. 27 (9), 1119–1152. doi: 10.1002/joc.1499
Hao G., Su J., Vihma T., Huang F. (2020). Trends, abrupt shifts and interannual variability of the Arctic Wintertime Seasonal Sea Ice from 1979 to 2019. Ann. Glaciol 61 (83), 441–453. doi: 10.1017/aog.2020.68
Hersbach H., Bell B., Berrisford P., Biavati G., Horányi A., Muñoz Sabater J., et al. (2019). ERA5 monthly averaged data on single levels from 1979 to present. Copernicus Climate Change Service (C3S) Climate Data Store (CDS) 10, 252–266. doi: 10.24381/cds.f17050d7
Kim K. Y., Kim J. Y., Kim J., Yeo S., Na H., Hamlington B. D., et al. (2019). Vertical feedback mechanism of winter Arctic amplification and sea ice loss. Sci. Rep. 9 (1), 1184. doi: 10.1038/s41598-018-38109-x
Klema V., Laub A. (1980). The singular value decomposition: Its computation and some applications. IEEE Trans. automatic control 25 (2), 164–176. doi: 10.1109/TAC.1980.1102314
Kumar A., Yadav J., Mohan R. (2020). Global warming leading to alarming recession of the Arctic sea-ice cover: Insights from remote sensing observations and model reanalysis. Heliyon 6 (7), e04355. doi: 10.1016/j.heliyon.2020.e04355
Kwok R. (2018). Arctic sea ice thickness, volume, and multiyear ice coverage: losses and coupled variability, (1958–2018). Environ. Res. Lett. 13 (10), 105005. doi: 10.1088/1748-9326/aae3ec
Kwok R., Cunningham G. F. (2015). Variability of Arctic sea ice thickness and volume from CryoSat-2. Philos. Trans. R. Soc. A: Mathematical Phys. Eng. Sci. 373 (2045), 20140157. doi: 10.1098/rsta.2014.0157
Kwok R., Rothrock D. A. (2009). Decline in Arctic sea ice thickness from submarine and ICESat records: 1958–2008. Geophysical Res. Lett. 36 (15), L15501. doi: 10.1029/2009GL039035
Mandel J. (1982). Use of the singular value decomposition in regression analysis. Am. Statistician 36 (1), 15–24. doi: 10.1080/00031305.1982.10482771
Markus T., Neumann T., Martino A., Abdalati W., Brunt K., Csatho B., et al. (2017). The Ice, Cloud, and land Elevation Satellite-2 (ICESat-2): science requirements, concept, and implementation. Remote Sens. Environ. 190, 260–273. doi: 10.1016/j.rse.2016.12.029
Maslanik J., Drobot S., Fowler C., Emery W., Barry R. (2007). On the Arctic climate paradox and the continuing role of atmospheric circulation in affecting sea ice conditions. Geophysical Res. Lett. 34 (3), L03711. doi: 10.1029/2006GL028269
Maslanik J., Stroeve J., Fowler C., Emery W. (2011). Distribution and trends in Arctic sea ice age through spring 2011. Geophysical Res. Lett. 38 (13), L13502. doi: 10.1029/2011GL047735
Overland J., Dunlea E., Box J. E., Corell R., Forsius M., Kattsov V., et al. (2019). The urgency of Arctic change. Polar Sci. 21, 6–13. doi: 10.1016/j.polar.2018.11.008
Pearson K. (1901). LIII. On lines and planes of closest fit to systems of points in space. London Edinburgh Dublin Philos. magazine J. Sci. 2 (11), 559–572. doi: 10.1080/14786440109462720
Perovich D. K., Grenfell T. C., Light B., Hobbs P. V. (2002). Seasonal evolution of the albedo of multiyear Arctic sea ice. J. Geophysical Research: Oceans 107 (C10), SHE–S20. doi: 10.1029/2000JC000438
Polyakov I. V., Walsh J. E., Kwok R. (2012). Recent changes of Arctic multiyear sea ice coverage and the likely causes. Bull. Am. Meteorol Soc. 93 (2), 145–151. doi: 10.1175/BAMS-D-11-00070.1
Rampal P., Weiss J., Marsan D. (2009). Positive trend in the mean speed and deformation rate of Arctic sea ice 1979–2007. J. Geophysical Research: Oceans 114 (C5), C05013. doi: 10.1029/2008JC005066
Rigor I. G., Wallace J. M. (2004). Variations in the age of Arctic sea-ice and summer sea-ice extent. Geophysical Res. Lett. 31 (9), L09401. doi: 10.1029/2004GL019492
Rigor I. G., Wallace J. M., Colony R. L. (2002). Response of sea ice to the Arctic Oscillation. J. Climate 15 (18), 2648–2663. doi: 10.1175/1520-0442(2002)015<2648:ROSITT>2.0.CO;2
Sallila H., Farrell S. L., McCurry J., Rinne E. (2019). Assessment of contemporary satellite sea ice thickness products for Arctic sea ice. Cryosphere 13 (4), 1187–1213. doi: 10.5194/tc-13-1187-2019
Serreze M. C., Barry R. G. (2011). Processes and impacts of Arctic amplification: A research synthesis. Global planetary Change 77 (1-2), 85–96. doi: 10.1016/j.gloplacha.2011.03.004
Stewart G. W. (1993). On the early history of the singular value decomposition. SIAM Rev. 35 (4), 551–566. doi: 10.1137/1035134
Stroeve J. C., Markus T., Boisvert L., Miller J., Barrett A. (2014). Changes in Arctic melt season and implications for sea ice loss. Geophysical Res. Lett. 41 (4), 1216–1225. doi: 10.1002/2013GL058951
Stroeve J. C., Serreze M. C., Holland M. M., Kay J. E., Malanik J., Barrett A. P. (2012). The Arctic’s rapidly shrinking sea ice cover: a research synthesis. Climatic Change 110 (3-4), 1005. doi: 10.1007/s10584-011-0101-1
Tilling R. L., Ridout A., Shepherd A. (2016). Near-real-time Arctic sea ice thickness and volume from CryoSat-2. Cryosphere 10 (5), 2003–2012. doi: 10.5194/tc-10-2003-2016
Tschudi M. A., Meier W. N., Stewart J. S. (2020). An enhancement to sea ice motion and age products at the National Snow and Ice Data Center (NSIDC). Cryosphere 14 (5), 1519–1536. doi: 10.5194/tc-14-1519-2020
Tschudi M. A., Stroeve J. C., Stewart J. S. (2016). Relating the age of Arctic sea ice to its thickness, as measured during NASA’s ICESat and IceBridge campaigns. Remote Sens. 8 (6), 457. doi: 10.3390/rs8060457
Wang J., Zhang J., Watanabe E., Ikeda M., Mizobata K., Walsh J. E., et al. (2009). Is the Dipole Anomaly a major driver to record lows in Arctic summer sea ice extent? Geophysical Res. Lett. 36 (5), L05706. doi: 10.1029/2008GL036706
Watanabe E., Wang J., Sumi A., Hasumi H. (2006). Arctic dipole anomaly and its contribution to sea ice export from the Arctic Ocean in the 20th century. Geophysical Res. Lett. 33 (23), L23703. doi: 10.1029/2006GL028112
Wei J., Zhang X., Wang Z. (2019). Impacts of extratropical storm tracks on Arctic sea ice export through Fram Strait. Climate Dynamics 52, 2235–2246. doi: 10.1007/s00382-018-4254-8
Wu B., Wang J., Walsh J. E. (2006). Dipole anomaly in the winter Arctic atmosphere and its association with sea ice motion. J. Climate 19 (2), 210–225. doi: 10.1175/JCLI3619.1
Ye D., Ng Y. K., Lian Y. (2015). Culture and happiness. Soc. Indic. Res. 123, 519–547. doi: 10.1007/s11205-014-0747-y
Zhang F., Pang X., Lei R., Zhai M., Zhao X., Cai Q. (2022). Arctic sea ice motion change and response to atmospheric forcing between 1979 and 2019. Int. J. Criminol 42 (3), 1854–1876. doi: 10.1002/joc.7340
Zhang J., Rothrock D. A. (2003). Modeling global sea ice with a thickness and enthalpy distribution model in generalized curvilinear coordinates. Monthly Weather Rev. 131 (5), 845–861. doi: 10.1175/1520-0493(2003)131<0845:MGSIWA>2.0.CO;2
Keywords: Arctic sea ice age, multi-year ice, atmospheric circulation, Arctic oscillation, Arctic dipole anomaly, Arctic warming
Citation: Chen P, Wang X, Zhao J, Li T, Shi J, Zong F and Wei L (2023) Variability of Arctic Sea ice age and its relationship with atmospheric circulation patterns. Front. Mar. Sci. 10:1274665. doi: 10.3389/fmars.2023.1274665
Received: 08 August 2023; Accepted: 12 October 2023;
Published: 02 November 2023.
Edited by:
Peigen Lin, Shanghai Jiao Tong University, ChinaReviewed by:
Qi Shu, Ministry of Natural Resources, ChinaRichard Arthur Allard, Naval Research Laboratory, United States
Copyright © 2023 Chen, Wang, Zhao, Li, Shi, Zong and Wei. This is an open-access article distributed under the terms of the Creative Commons Attribution License (CC BY). The use, distribution or reproduction in other forums is permitted, provided the original author(s) and the copyright owner(s) are credited and that the original publication in this journal is cited, in accordance with accepted academic practice. No use, distribution or reproduction is permitted which does not comply with these terms.
*Correspondence: Tao Li, litaoocean@ouc.edu.cn; Junqiang Shi, sjunq0@163.com