Microplastics in the Arctic: a transect through the Barents Sea
 H. Emberson-Marl1,2
  R. L. Coppock2*
  M. Cole2
  B. J. Godley1 N. Mimpriss2
  S. E. Nelms1
  P. K. Lindeque2
- 1Centre for Ecology and Conservation, University of Exeter, Cornwall, United Kingdom
- 2Marine Ecology & Biodiversity, Plymouth Marine Laboratory, Plymouth, United Kingdom
Globally, the abundance of microplastics in our oceans is increasing, including within the remote locations of the polar regions. The Barents Sea, which adjoins the Arctic Ocean, is an area of high primary productivity that, owing to the convergence of regional currents, has been mooted as a potential sixth ocean gyre that may coalesce high concentrations of plastic debris. This study aimed to explore data collected from large volume samples of sub-surface water collected from transects through the Barents Sea to quantify and characterise microplastics in this region, with a focus on potential impacts to zooplankton. Overall, the mean microplastic abundance in the Barents Sea was 0.011 microplastics m-3 (range: 0.007 – 0.015 m-3). Microplastics were found in higher abundances nearer land mass at the southern end of the transect and northwards towards the ice edge, recording 0.015 microplastics m-3 during both transect legs. Microplastics were predominantly fibrous (92.1%) and typically blue (79%) or red (17%) in colour. A range of polymers were identified including polyester (3.8%), copolymer blends (2.7%), elastomers (7.1%) and acrylics (10.6%), however semi-synthetic polymers dominated, comprising 74.4% of particles found. Higher microplastic concentrations in the northernmost transect may stem from melting sea-ice, while the higher concentrations in the southernmost transect likely derive from the long-range transport of microplastics via currents from Europe.
1 Introduction
Global abundance of microplastics (0.1 µm-5 mm) within the marine ecosystem is increasing (Thompson et al., 2004; Cole et al., 2011; Lots et al., 2017; Bakaraki Turan et al., 2021). Plastics are versatile materials with widespread use in the medical, industrial, and domestic sectors, and waste mismanagement is resulting in increased pollution in the marine environment (Jambeck et al., 2015; Bakaraki Turan et al., 2021; Mishra et al., 2021). Microplastics are either produced at microscopic sizes (primary microplastics) or derive from fragmentation of larger plastics (secondary microplastics) including packaging, vehicle tyres, antifouling paint and textiles (Andrady, 2011; Pirsaheb et al., 2020). Once in the marine environment, microplastics can be transported by physical factors such as wind, tides and currents. They can also be mediated by biological factors (Bakari Turan et al., 2021; Li et al., 2020) including biofouling (Kooi et al., 2017), the sinking of contaminated faeces (Cole, 2016; Coppock et al., 2019) and mixing of microplastics into coastal sediments by faunal activity (Coppock et al., 2021).
Polar regions are remote, highly sensitive ecosystems of great ecological importance owing to the valuable ecosystem services they provide. Understanding of global microplastic distribution is increasing, however microplastic abundance and risks to biota in polar regions is less well studied (Tošić et al., 2020). With elevated melting of sea ice allowing for increased anthropogenic activity through industries such as shipping, tourism, fisheries and hydrocarbon exploration (Rigor and Colony, 1997; Stephenson and Smith, 2015; Peeken et al., 2018), it is likely these regions will be at greater risk of exposure to pollutants. Further, research has shown that plastic debris within the Arctic has been steadily increasing over the past 15 years (Parga Martinez et al., 2020). It has been recently suggested that a sixth oceanic gyre of high plastic accumulation may be forming in the eastern Barents Sea due to convergence of multiple currents (Van Sebille et al., 2012; Cózar et al., 2017), with predictions of high microplastics concentrations in this region (Tošić et al, 2020).
Microplastic pollution poses a risk to marine life throughout the food web (Kiørboe, 2011; Guzzetti et al., 2018). Microplastics can be a similar size to primary producers and therefore bioavailable to a wide range of species (Cole et al., 2013). Zooplankton, near the base of the marine food web, play a key role within aquatic ecosystems, being an important food source for higher trophic animals, such as commercially important fish, that play a substantive role in carbon transport within the water column (Turner, 2015; Lowery et al., 2020; Botterell et al., 2022). Zooplankton have been shown to readily ingest microplastics, which in turn negatively affect fecundity and growth (Desforges et al., 2015; Botterell et al., 2019; Cole et al., 2019) and alter the sinking velocity of their faeces (Coppock et al., 2019).
The Barents Sea is located south- east of the Svalbard Archipelago and south-west of Novaya Zamlya and borders the Norwegian Sea to the east with coastal, Atlantic, and Arctic waters all linked to the main current systems (Loeng, 1991). The greatest average microplastic abundance within five different ocean regions (beginning at the East-Siberian Sea within the Arctic through the Atlantic to the Antarctic), and within the Arctic, has been recorded in the Barents Sea and is the highest contributor to microplastics in the Siberian Arctic (Pakhomova et al., 2022). However, this, along with most recent research, has focused on the Eastern areas of the Barents Sea and to the West of Svalbard (Tošić et al., 2020; Mishra et al., 2021). This field study aims to explore data collected from large volume samples of sub-surface water from transects through the Western Barents Sea, to determine microplastic abundance and distribution in this region.
2 Materials and methods
2.1 Microplastic sampling
Seawater samples were collected in July 2018 along transects between six different sites in the Barents Sea (Figure 1) during the Changing Arctic Ocean Sediments (ChAOS) cruise on board the RRS James Clark Ross (voyage JR17007; Solan, 2018). Transects were conducted from Tromsø in northern Norway (N71°17.77’ E20°12.78’) to the Ice front north of Svalbard (N82°08.29’ E29°00.66’; see Supplementary materials Table S1 for station list). A filter rig was connected to the starboard side of the ship’s underway system approximately 6 meters below the sea surface and was pre-filtered at 6 mm (Figure 2). During each transect, the filtration system progressively filtered water over three mesh sizes (300 µm, 65 µm then 22 µm). The system had a 2 mm internal filter installed to prevent clogging and a water meter to calculate the volume of water passing through the unit. For each sample taken, flow was regulated at between 3 and 10 L min-1 and coordinates, time and volume of water were noted at the beginning and end of each transect. To minimise the likelihood of external contamination, mesh filters were immediately covered with foil when removed from the filter rig and transferred to a laminar flow cabinet. Each filter was then washed thoroughly using ultrapure water over a corresponding sized nylon mesh, folded and stapled in place. Samples were dried for 8 hours at 50°C in a digital food dehydrator then wrapped in foil and stored at -20°C (see Solan, 2018 for further information).
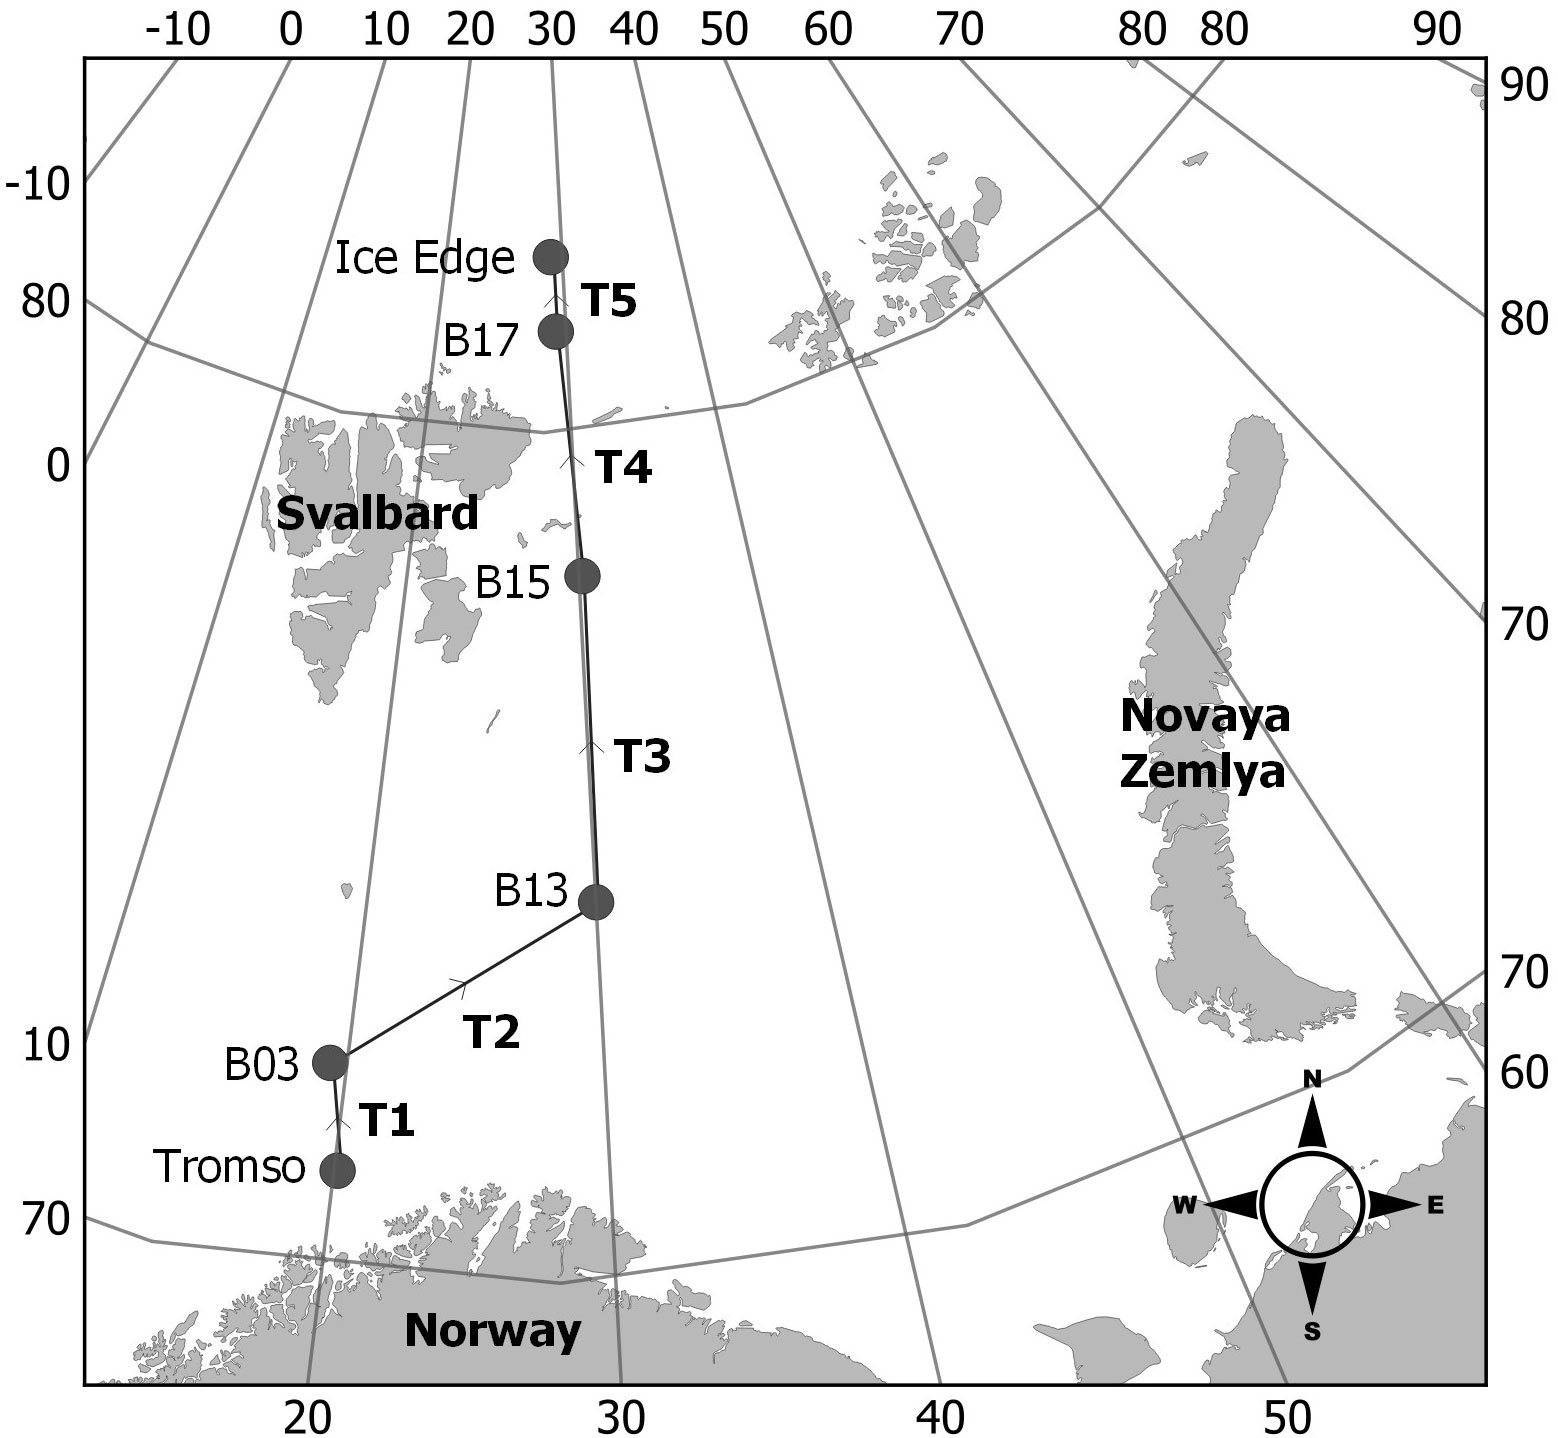
Figure 1 Map of sample collection area in the Barents Sea and Arctic Ocean.
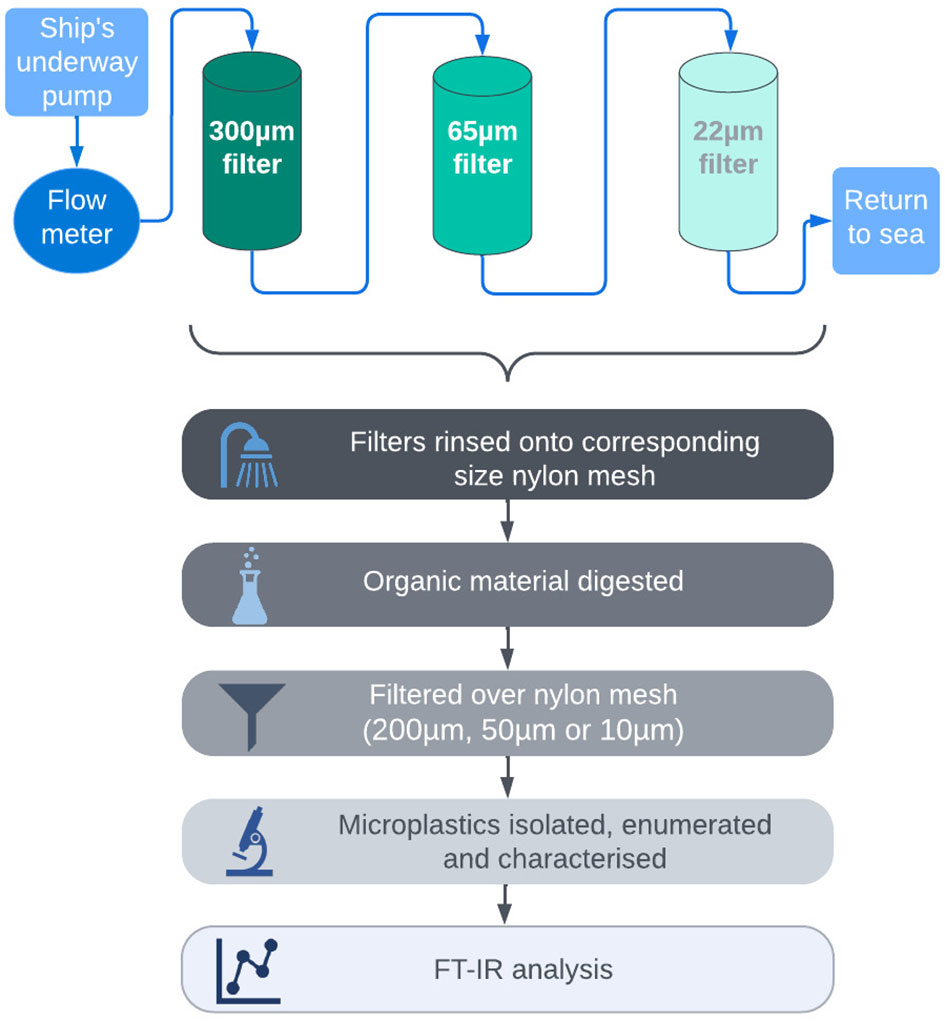
Figure 2 Infograph summarising methods used to collect and process samples for each transect conducted during the research cruise.
2.2 Microplastic analysis
All samples were processed in the ultraclean Microplastic Research Facility at Plymouth Marine Laboratory, UK (Figure 2). To remove organic material occluding the microplastics, each mesh filter was added to a 600 mL Erlenmeyer flask filled with 200 mL of 10% Potassium hydroxide (KOH) and incubated in an orbital incubator (Sanyo) at 50°C and 120 rpm for 72h. Digested samples were subsequently vacuum filtered onto a nylon mesh filter corresponding to the size of the sample filter (300 µm filtered over 200 µm, 65 µm filtered over 50 µm, 22 µm filtered over 10 µm), and flushed with ultrapure water to remove KOH residue. Mesh filters were placed in a new, sterile Petri dish, sealed and stored at room temperature for further analysis.
Filters were visualised using an Olympus (SZX16) microscope (x25 magnification). Microplastics were identified with reference to Hartmann et al., 2019. Putative plastic particles were classified as fragment (irregular particle shape with similar width and length), fibre (significantly longer in length than width), film (smaller in one dimension than the other two), or bead (spherical). The length and width of putative microplastics was measured using CellSens® (Olympus) software, and their colour noted.
For polymeric analysis, putative microplastics were transferred via forceps onto pre-scored indents on glass slides wrapped with aluminium foil. Particles were identified using Fourier Transform Infrared Spectroscopy (FTIR; PerkinElmer Spotlight 400). Scans were conducted at a resolution of 4 cm-1 between wavelengths of 4000 – 750 cm-1 at 10 scans per spectrum. Analyses were initially conducted in Reflectance mode, carrying out subsequent analysis using µATR if resultant spectra were of poor quality. Spectra were compared with spectral libraries (PerkinElmer), and matches exceeding a level of 65% confidence were visually verified and accepted; matches between 60% to 65% prompted further consideration before accepting; matches below a 60% threshold or particles lost during analysis, were recorded as unknown and excluded from final microplastic counts.
Anthropogenic cellulosic fibres return the same spectra as cellulose, cellophane and chipboard using FT-IR reference libraries. This could also be attributed to the build-up of natural material through the digestion process or the size of the particle being too small. Particles identified as cellulose, cellophane and chipboard were characterized as either natural or semi-synthetic following Cole et al. (2023) guidance (e.g. if particles were an unnatural colour, such as bright red or blue, they were characterized as semi-synthetic).
2.3 Contamination control
2.3.1 On board sample processing
A cotton lab coat was worn at all times. All equipment was rinsed thoroughly with Milli-Q water (0.22µm). Processing of filters was carried out within a laminar flow hood that had been wiped down with Milli-Q water and blue roll, with a damp control filter paper open to the air in a sterilized Petri dish. Nylon meshes (300µm, 65µm, 20µm) were inspected under a light microscope (CETI, x20 magnification) to identify any external contamination prior to washing down the filters. For each transect, a procedural control was taken, following all steps used to take samples, but instead using MilliQ water.
2.3.2 Laboratory sample processing
All samples were prepared and analysed in an ultra-clean facility at Plymouth Marine Laboratory, with a positive pressure system with 5 µm high-efficiency particulate air (HEPA) filters, key card entry for limited access and tac mats to remove any contamination from shoes. All samples were prepared under a laminar flow hood. All surfaces throughout the preparation and analysis of samples were thoroughly cleaned using ethanol (70%) before use. All consumables were used directly from sterile packaging and all equipment used was washed thoroughly with Milli-Q water before use. To avoid contact with synthetic fibres, natural fibre clothing was worn under a 100% cotton lab coat.
A damp filter paper in a Petri dish was left exposed to the air whilst sample filters were being analysed, to control for background laboratory contamination. Microplastics isolated on the tin foil covered slide were covered with a lid, to reduce chance of external contamination or loss of the particle. All isolated microplastic particles were also stored under a lid to prevent external contamination.
2.4 Statistical analysis
All data were analysed using statistical software R (version 4. 2. 1, R Development Core Team, 2022). Correction factors were applied to data from contamination controls and calculated by taking the mean of anthropogenic particles found in procedural controls for each size class. There was no air contamination from the air control filters, therefore only procedural blank corrections were applied. FTIR corrections were then calculated and applied once all particles had been assigned an identification number, whereby the percentage of anthropogenic particles in each transect for each size class (excluding unknown or natural characterized particles) was noted. To apply the correction factors considering contamination of procedural controls and FTIR percentage, this equation was used for all different filter sizes at each transect:
Once correction factors were applied, total abundance of microplastics at each transect was calculated for each different mesh size (300µm, 65µm then 22µm) and microplastic abundances were standardised to m-3. A general linear model was used to test whether the average length of microplastics differed among sites. To do so, the data were checked for normality using Shapiro-Wilk test and a Box – Cox transformation was applied to amend the non-normal data (Box and Cox, 1964; See Supplementary Materials, Table S2 for list of R packages used).
3 Results
3.1 Microplastic abundance
All samples contained microplastics. Accounting for microplastics in contamination controls (SI, Table S3), microplastic concentrations in the Barents Sea samples ranged 0.007 – 0.015 microplastics m-3, with an average of 0.011 m-3 (Figure 3). Abundances include particles identified as semi-synthetic polymers.
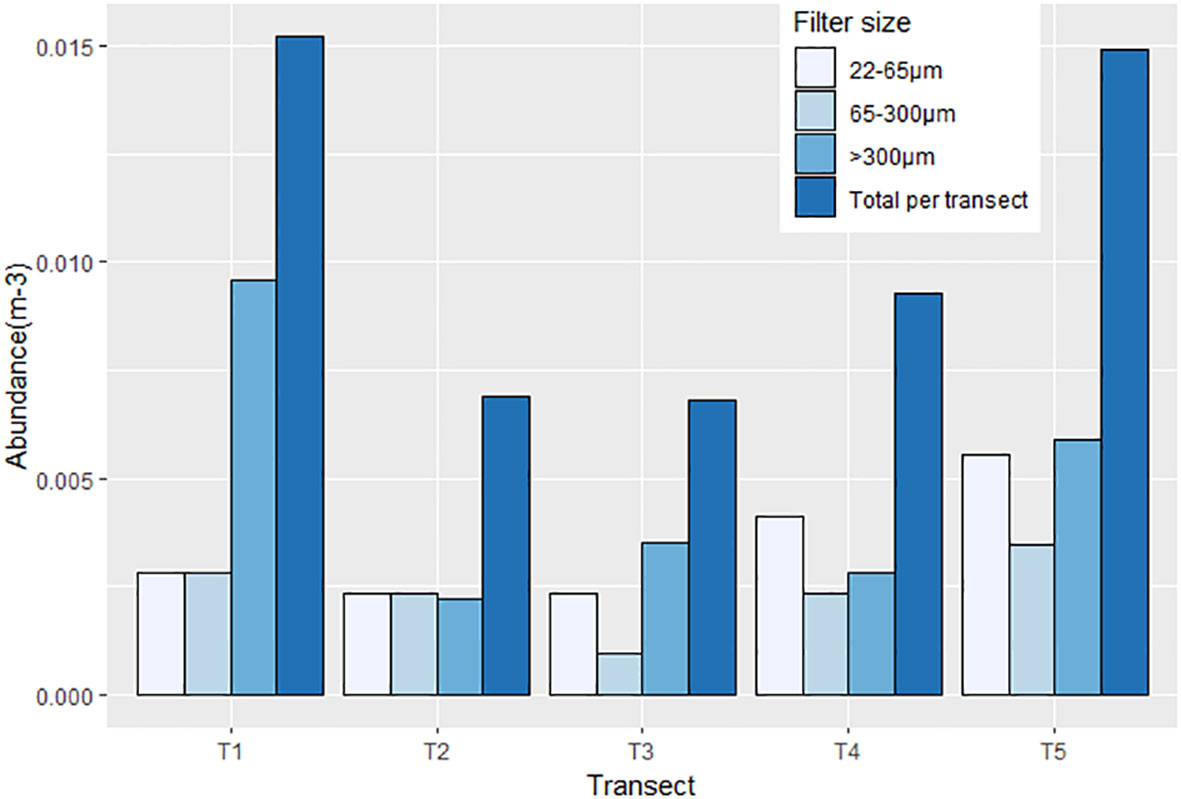
Figure 3 Abundance (m-3) of microplastics across all transects for all filter sizes (300µm, 65µm, 22µm and total per transect). X-axis represents transects, travelling from Tromsø (T1) to the ice-edge (T5), Y-axis represents abundance of microplastics per m-3.
Transects T1 (South) and T5 (North) exhibited the highest microplastic abundances (both 0.015m-3 respectively). The lowest microplastic abundances were associated with transects T2 and T3 (central Barents Sea), with concentrations both at 0.007 microplastics m-3.
3.2 Microplastic characteristics
All microplastics identified were either fibres or fragments, however at T1 and T2, 100% of microplastics were fibres. Site T3 comprised 3.8% fragments, which continued to increase northward to 10.8% at T4 and 25% at T5. Over all sites, 92.1% of microplastics were fibres and 7.9% were fragments (Figure 4A). Microplastics were predominantly classified as semi-synthetic (74.4%), however other identified microplastics included polyester (3.8%), various copolymers (such as ethylene/vinyl acetate, acrylonitrile styrene acrylate; 2.7%), elastomer (7.1%), polyamide (1%), acrylic group (10.6%) and polytetrafluoroethylene (0.4%). T5 exhibited the greatest diversity of polymers with 58.3% semi-synthetic microplastics, 19.4% belonging to the Acrylic group, 13.9% were Polyester, 5.6% were copolymers and 2.8% were elastomer (Figure 4B). Overall, microplastic lengths were predominantly< 1000µm (60%, Figure 5B) and in total ranging 41.6—14855 µm. Whilst microplastic lengths did not vary significantly between sites, T1 microplastics lengths were significantly longer on average than every other site (P< 0.05, T-value = 28.159). Characterized microplastics were predominantly blue (79%) and red (17%), with clear (2%) and clear/light yellow (2%) microplastics also being found (Figure 5A). There was no significant difference of colours throughout all five transects (see Supplementary Materials, Figure S1).
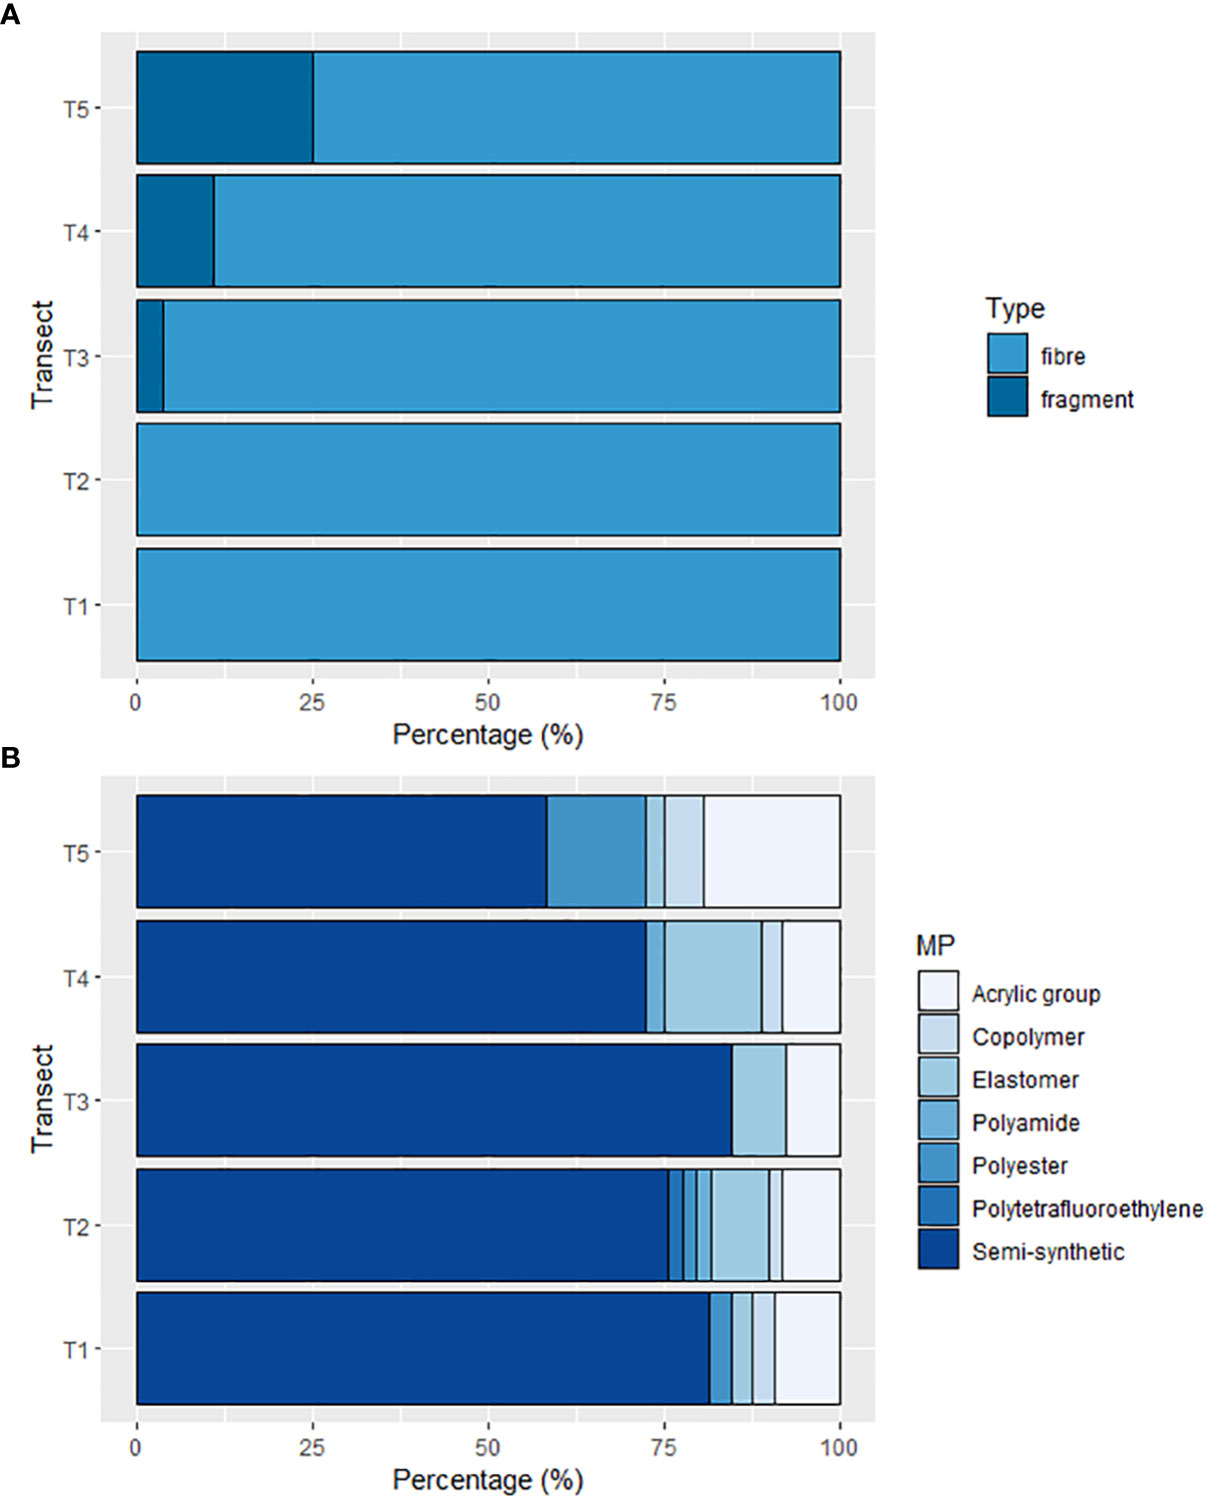
Figure 4 Percentage of (A) fibres and fragments at each site, and (B) different microplastic polymers at each site. X-axis represents percentage. Y-axis represents Transects travelling from Tromsø (T1) to the ice-edge (T5).
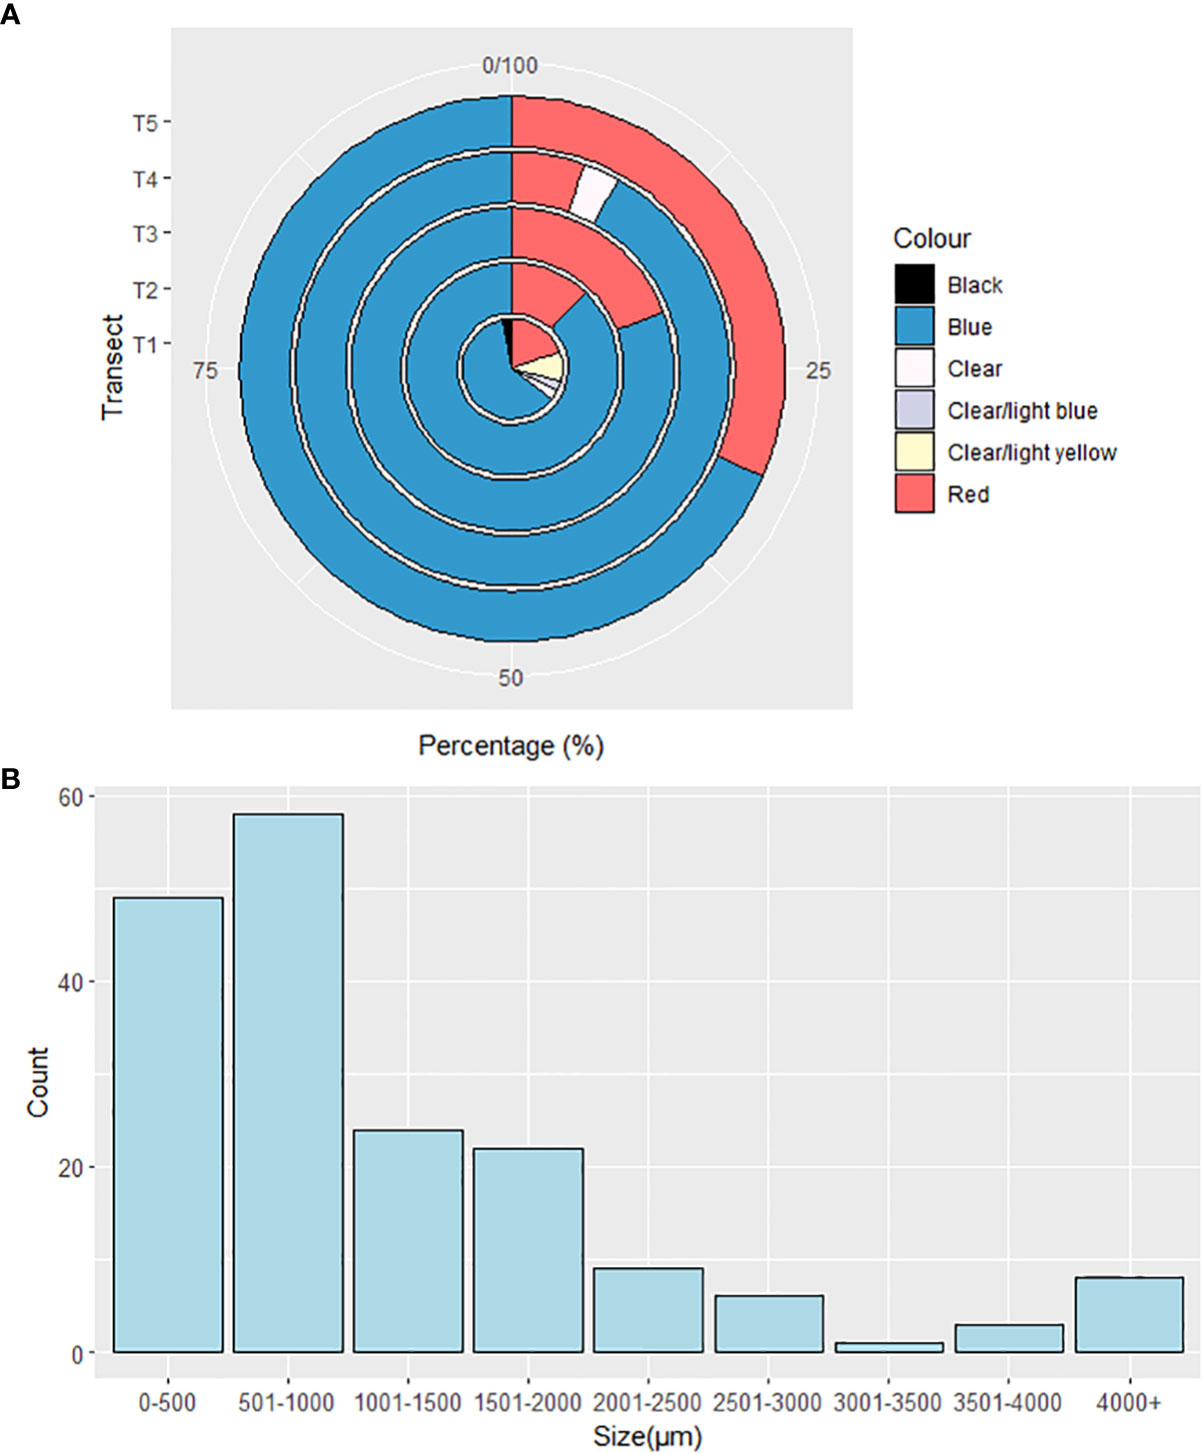
Figure 5 Percentage of (A) different colours at each transect, and (B) frequency of microplastic lengths.
4 Discussion
Microplastics were found throughout the eastern Barents Sea with a suggestion that the highest abundances present were close to mainland Norway (T1) and approaching the ice edge in the Arctic Ocean (T5). A high proportion (60%) of microplastics were 0-1000 µm in size, making them bioavailable to a wide range of biota due to the size overlap with their prey.
4.1 Microplastic abundance
Microplastic abundances observed in this study (0.007 - 0.015 microplastics m-3) are comparable to that of Yakushev et al., 2021, who identified 0.004 microplastics m-3 using underway pump sampling in the Eurasian Arctic, from the Southwestern Barents Sea to the Eastern Barents Sea then through the East-Siberian Sea. However, these concentrations are substantially lower than observed elsewhere in the region where Manta trawls were used for sampling. For example, manta net trawls revealed median microplastic abundances of 0.31—0.92 m-3 in the Kara Sea, 0.19—1 m-3 in the White Sea and 0.97—6.42 m-3 in the eastern Barents Sea (Tošić et al., 2020). In comparing microplastic concentrations ascertained via low-volume surface samples, Yakushev et al., 2021 found concentrations of 0.8 microplastics m-3, 200x greater than sampled with the underway pump. Interestingly, Lusher et al. (2015) found the opposite trend to the south of Svalbard, observing 0.34 microplastics m-3 in surface manta trawls but 2.68 microplastics m-3 in sub-surface water, highlighting differences between sampling methods, volumes and water depths sampled.
Despite the dominance of fibres found in the samples (91%), only 1% of these were recorded as polyamide/nylon. Previous research has found that a KOH digestion method, when coupled with temperatures above 50°C, can compromise nylon fibres when present in samples and degrade the FT-IR signal (Munno et al., 2018; Pfeiffer and Fischer, 2020; Corami et al, 2021). Consequently, our reported abundances may be underrepresented as a result.
As is common to this type of study, it was only possible to sample one survey transect between each of the locations, making it difficult to estimate the variation of microplastic abundance due to lack of replication. This study will act as a reference point for further research. Additionally, sampling methods between studies of microplastics within the Arctic vary. For example, a recent study by Bakaraki Turan et al. (2021) highlighted that out of 74 studies, 56 used nets to sample for microplastics, whilst the remaining studies used pumping systems, sampling devices for the surface microlayer and discrete sampling devices (Bakaraki Turan et al., 2021). The differing units of measure used in previous research, make it difficult to draw comparisons; therefore, future studies should strive for a standardized sampling protocol to allow for direct comparisons and more robust conclusions (Yakushev et al., 2021).
4.2 Microplastic transport to the region
The presence of microplastics at each transect was to be expected as this has been the case in most other regional investigations, whether it be from local sources or long-range atmospheric input (Peeken et al., 2018; Halsband and Herzke, 2019; Carlsson et al., 2021; Pakhomova et al., 2022). The Canadian Archipelago, the Barents Sea and the Fram Strait located in the Arctic connect the Atlantic to the North Pacific (Bakaraki Turan et al., 2021). The mixture of warm water from the north Atlantic and cold, less saline water from the Southern Arctic within the Barents Sea has led to increased microplastic abundance as pollution from more inhabited areas will accumulate in the Barents Sea (Smedsrud et al., 2013; Mishra et al., 2021). Previous entry routes have been directly related to human activity such as dumping, wastewater and equipment losses (PAME, 2019; Carlsson et al., 2021). The Barents Sea and neighbouring Kara Sea known as the Barents-Kara region, are highly economically developed and experience high levels of industrial fishing. Additionally, the recent rapid development of the oil industry has resulted in increased pressure from marine traffic (Tošić et al., 2020; Pakhomova et al., 2022). Both factors can be expected to contribute to a higher input of microplastics into the Barents Sea.
High microplastic abundance in the southern reaches of the Barents Sea may be associated with plastic pollution being transported from the Northeastern Atlantic (Huserbråten et al., 2022), which in turn may result in the Barents Sea becoming a high-accumulation zone of microplastics (Cózar et al., 2017). Meanwhile, higher microplastic abundance in the northern reaches of the Barents Sea may be associated with anthropogenic activity on nearby Svalbard, and the release of microplastic from melting polar ice. Tourism on Svalbard, located to the northwest of the Barents Sea, is increasing yearly, which consequently will result in higher plastic usage. The waste handling facilities currently in place may not have the infrastructure to be able to prevent contamination (PAME, 2019). Marine litter witnessed on Svalbard local beaches is already dominated by fishing gear and packaging materials, which will only continue to rise (Granberg et al., 2019; PAME, 2019; Tekman et al., 2022). Svalbard’s towns are situated on the west coast, local pollution could be transported via the west Spitzbergen current towards the sea ice. These local sources provide a potential explanation for the higher abundance of microplastics found at T1 and T5. Sea ice has been shown to hold microplastics and has been suggested to contribute toward the flux of microplastics within the Arctic regions (Obbard et al., 2014; Kanhai et al., 2020; Carlsson et al., 2021; Bao et al., 2022). Recent research highlighted that microplastics were present within ice cores obtained from the Arctic Ocean acting as a temporary sink (Lusher et al., 2015; Zhang et al., 2022). Due to sea temperature rise, large ocean heat transport has resulted in decreased ice formation within the Barents Sea (Yamagami et al., 2022). In 2013 sea ice formation loss within the Barents Sea contributed highly to overall Arctic Sea ice, by 2050 a predicted 4°C temperature will result in previously ice-covered areas being ice free throughout most of the year (Smedsrud et al., 2013). Sea ice decline and ice sheet retreat will result in release of trapped microplastics into the ocean, causing environmental risks to local biota and ocean processes (Nelms et al., 2018; Botterell et al., 2022). Trends within this study highlighted that microplastic abundance increased near the ice edge (T5), which is commensurate with the potential for melting sea-ice to result in higher microplastic abundance within the surrounding water (Smedsrud et al., 2013). Within this study, microplastic fragments were not identified in the southern Barents Sea samples but were found in higher numbers as transects approach the sea ice. Previously, Arctic Sea ice has exhibited higher abundance of microplastic than in sub-tropical gyres, suggesting that the Arctic sea-ice is a source of fragments being released into the water column (Lusher et al., 2015). Overall, microplastics found throughout this study were dominated by particles smaller than 1000 µm (Figure 4A) which corresponds with the observation that microplastic abundance increases with decreasing size (Lindeque et al., 2020). Microplastics can be consumed by a wide range of zooplankton, including dominant Arctic species such as the cold-water copepods Calanus finmarchicus (Cole et al., 2019), Calanus glacialis, and Calanus hyperboreus (Rodriguez-Torres et al., 2020), and Amphipod species such as Themisto spp. found within Arctic surface waters (Botterell et al., 2022). Given that the Barents Sea is an area of high primary productivity resulting from relatively high nutrient levels (Powell and Berry, 1990; Leys and Eerkes-Medrano, 2006; Andrady, 2011; Mishra et al., 2021), we consider it likely that zooplankton within this region will be consuming microplastics, facilitating the entry of these anthropogenic particles into polar food webs.
5 Conclusion
This study concludes that the western fringes of the Barents Sea are polluted with microplastics. While it is not possible to determine the source of the plastic, highest concentrations were found closest to sources of anthropogenic pollution and ice melt, which are known repositories of marine microplastic. The possibility of local input is also likely; as tourism in Svalbard continues to increase, the lack of adequate waste infrastructure will result in increased leakage into the surrounding waters. Increased tourism, paired with other local sources including wastewater input, shipping activities, and fishing, could explain the higher levels of microplastic abundance towards the coastline compared to further offshore. Given the biological productivity of the region and the size of microplastics overlapping with optimal prey size of zooplankton, the likelihood of accidental consumption by zooplankton is high. It is apparent that microplastic data from the Arctic is limited and that further research and synchronization of methods is a necessity to fully understand the ecological and toxicological effects on marine biota.
Data availability statement
The raw data supporting the conclusions of this article will be made available by the authors, without undue reservation.
Author contributions
RC and PL conceived and planned the research. RC conducted all sampling. RC, NM and HE-M processed samples. All authors were involved in data interpretation. HE-M analysed the data. HE-M prepared the first draft of the manuscript. All authors contributed to the article and approved the submitted version.
Funding
HE-M conducted analyses during MSc studies at University of Exeter and Plymouth Marine Laboratory. RC acknowledges support through Natural Environment Research Council GW4+ internship (2018), Natural Environment Research Council Changing Arctic Ocean Sediments grant (NE/P006434/1) for sample collection and The University of Exeter and Plymouth Marine Laboratory Collaboration Fund. SN and BG acknowledge funding from NERC (NE/V009354/1 and NE/V005448/1)
Acknowledgments
Our thanks go to the crew of RRS James Clark Ross during voyage JR17007.
Conflict of interest
The authors declare that the research was conducted in the absence of any commercial or financial relationships that could be construed as a potential conflict of interest.
Publisher’s note
All claims expressed in this article are solely those of the authors and do not necessarily represent those of their affiliated organizations, or those of the publisher, the editors and the reviewers. Any product that may be evaluated in this article, or claim that may be made by its manufacturer, is not guaranteed or endorsed by the publisher.
Supplementary material
The Supplementary Material for this article can be found online at: https://www.frontiersin.org/articles/10.3389/fmars.2023.1241829/full#supplementary-material
References
Andrady A. (2011). Microplastics in the marine environment. Mar. pollut. Bull. 62 (8), 1596–1605. doi: 10.1016/j.marpolbul.2011.05.030
Bakaraki Turan N., Sari Erkan H., Onkal Engin G. (2021). Current status of studies on microplastics in the world’s marine environments. J. Cleaner Production 327, 129394. doi: 10.1016/j.jclepro.2021.129394
Bao M., Huang Q., Lu Z., Collard F., Cai M., Huang P., et al. (2022). Investigation of microplastic pollution in Arctic fjord water: a case study of Rijpfjorden, Northern Svalbard. Environ. Sci. pollut. Res. 29 (37), 56525–56534. doi: 10.1007/s11356-022-19826-3
Botterell Z., Beaumont N., Dorrington T., Steinke M., Thompson R., Lindeque P. (2019). Bioavailability and effects of microplastics on marine zooplankton: A review. Environ. pollut. 245, 98–110. doi: 10.1016/j.envpol.2018.10.065
Botterell Z., Bergmann M., Hildebrandt N., Krumpen T., Steinke M., Thompson R., et al. (2022). Microplastic ingestion in zooplankton from the Fram Strait in the Arctic. Sci. Total Environ. 831, 154886. doi: 10.1016/j.scitotenv.2022.154886
Box G. E., Cox D. R. (1994). An analysis of transformations. J. Royal Stat. Soc. Series B: Stat. Methodol. 26 (2), 211–243.
Carlsson P., Singdahl-Larsen C., Lusher A. (2021). Understanding the occurrence and fate of microplastics in coastal Arctic ecosystems: The case of surface waters, sediments and walrus (Odobenus rosmarus). Sci. Total Environ. 792, 148308. doi: 10.1016/j.scitotenv.2021.148308
Cole M. (2016). A novel method for preparing microplastic fibers. Sci. Rep. 6 (1), 34519. doi: 10.1038/srep34519
Cole M., Artioli Y., Coppock R., Galli G., Saad R., Torres R., et al. (2023). Mussel power: Scoping a nature-based solution to microplastic debris. J. Hazardous Materials 453, 131392. doi: 10.1016/j.jhazmat.2023.131392
Cole M., Coppock R., Lindeque P., Altin D., Reed S., Pond D., et al. (2019). Effects of nylon microplastic on feeding, lipid accumulation, and moulting in a coldwater copepod. Environ. Sci. Technol. 53 (12), 7075–7082. doi: 10.1021/acs.est.9b01853
Cole M., Lindeque P., Fileman E., Halsband C., Goodhead R., Moger J., et al. (2013). Microplastic ingestion by zooplankton. Environ. Sci. Technol. 47, 12, 6646–6655. doi: 10.1021/es400663f
Cole M., Lindeque P., Halsband C., Galloway T. (2011). Microplastics as contaminants in the marine environment: A review. Mar. Pollut. Bull. 62 (12), 2588–2597. doi: 10.1016/j.marpolbul.2011.09.025
Coppock R., Galloway T., Cole M., Fileman E., Queirós A., Lindeque P. (2019). Microplastics alter feeding selectivity and faecal density in the copepod, Calanus helgolandicus. Sci. Total Environ. 687, 780–789. doi: 10.1016/j.scitotenv.2019.06.009
Corami F., Rosso B., Morabito E., Rensi V., Gambaro A., Barbante C. (2021). Small microplastics (< 100 μm), plasticizers and additives in seawater and sediments: Oleo-extraction, purification, quantification, and polymer characterization using Micro-FTIR. Sci. Total Environ. 797, 148937. doi: 10.1016/j.scitotenv.2021.148937
Core Team R. (2022). “R: A language and environment for statistical computing,” in R Foundation for Statistical Computing(Vienna, Austria). Available at: https://www.R-project.org/.
Cózar A., Martí E., Duarte C., García-de-Lomas J., van Sebille E., Ballatore T., et al. (2017). The Arctic Ocean as a dead end for floating plastics in the North Atlantic branch of the Thermohaline Circulation. Sci. Adv. 3 (4). doi: 10.1126/sciadv.1600582
Desforges J., Galbraith M., Ross P. (2015). Ingestion of microplastics by zooplankton in the northeast pacific ocean. Arch. Environ. Contamination Toxicol. 69 (3), 320–330. doi: 10.1007/s00244-015-0172-5
Granberg M., Winberg von Friesen L., Collard F., Bach L. (2019) Anthropogenic microlitter in wastewater and marine samples from Ny-Ålesund, Barentsburg and Signehamna, Svalbard (Swedish Environmental Research Institute). Available at: https://www.ivl.se/download/18.694ca0617a1de98f472ba3/1628414191773/FULLTEXT01.pdf (Accessed 21 August 2022).
Guzzetti E., Sureda A., Tejada S., Faggio C. (2018). Microplastic in marine organism: Environmental and toxicological effects. Environ. Toxicol. Pharmacol. 64, 164–171. doi: 10.1016/j.etap.2018.10.009
Halsband C., Herzke D. (2019). Plastic litter in the European Arctic: What do we know? Emerging Contaminants 5, 308–318. doi: 10.1016/j.emcon.2019.11.001
Hartmann N., Hüffer T., Thompson R., Hassellöv M., Verschoor A., Daugaard A., et al. (2019). Are we speaking the same language? Recommendations for a definition and categorization framework for plastic debris. Environ. Sci. Technol. 53 (3), 1039–1047. doi: 10.1021/acs.est.8b05297
Huserbråten M. B., Hattermann T., Broms C., Albretsen J. (2022). Trans-polar drift-pathways of riverine European microplastic. Sci. Rep. 12 (1), 1–10. doi: 10.1038/s41598-022-07080-z
Jambeck J., Geyer R., Wilcox C., Siegler T., Perryman M., Andrady A., et al. (2015). Plastic waste inputs from land into the ocean. Science 347 (6223), 768–771. doi: 10.1126/science.1260352
Kanhai L., Gardfeldt K., Krumpen T., Thompson R., O’Connor I. (2020). Microplastics in sea ice and seawater beneath ice floes from the Arctic Ocean. Sci. Rep. 10 (1). doi: 10.1038/s41598-020-61948-6
Kiørboe T. (2011). How zooplankton feed: mechanisms, traits and trade-offs. Biol. Rev. 86 (2), 311–339. doi: 10.1111/j.1469-185X.2010.00148.x
Kooi M., Nes E. H. V., Scheffer M., Koelmans A. A. (2017). Ups and downs in the ocean: effects of biofouling on vertical transport of microplastics. Environ. Sci. Technol. 51 (14), 7963–7971. doi: 10.1021/acs.est.6b04702
Leys S., Eerkes-Medrano D. (2006). Feeding in a calcareous sponge: particle uptake by pseudopodia. Biol. Bull. 211 (2), 157–171. doi: 10.2307/4134590
Li Y., Zhang H., Tang C. (2020). A review of possible pathways of marine microplastics transport in the ocean. Anthropocene Coasts 3 (1), 6–13. doi: 10.1139/anc-2018-0030
Lindeque P., Cole M., Coppock R., Lewis C., Miller R., Watts A., et al. (2020). Are we underestimating microplastic abundance in the marine environment? A comparison of microplastic capture with nets of different mesh-size. Environ. pollut. 265, 114721. doi: 10.1016/j.envpol.2020.114721
Loeng H. (1991). Features of the physical oceanographic conditions of the Barents Sea. Polar Res. 10 (1), 5–18. doi: 10.3402/polar.v10i1.6723
Lots F. A., Behrens P., Vijver M. G., Horton A. A., Bosker T. (2017). A large-scale investigation of microplastic contamination: Abundance and characteristics of microplastics in European beach sediment. Mar. pollut. Bull. 123 (1-2), 219–226. doi: 10.1016/j.marpolbul.2017.08.057
Lowery C., Bown P., Fraass A., Hull P. (2020). Ecological response of plankton to environmental change: thresholds for extinction. Annu. Rev. Earth Planetary Sci. 48 (1), 403–429. doi: 10.1146/annurev-earth-081619-052818
Lusher A., Tirelli V., O’Connor I., Officer R. (2015). Microplastics in Arctic polar waters: the first reported values of particles in surface and sub-surface samples. Sci. Rep. 5 (1). doi: 10.1038/srep14947
Mishra A., Singh J., Mishra P. (2021). Microplastics in polar regions: An early warning to the world’s pristine ecosystem. Sci. Total Environ. 784, 147149. doi: 10.1016/j.scitotenv.2021.147149
Munno K., Helm P. A., Jackson D. A., Rochman C., Sims A. (2018). Impacts of temperature and selected chemical digestion methods on microplastic particles. Environ. Toxicol. Chem. 37 (1), 91–98. doi: 10.1002/etc.3935
Nelms S., Galloway T., Godley B., Jarvis D., Lindeque P. (2018). Investigating microplastic trophic transfer in marine top predators. Environ. pollut. 238, 999–1007. doi: 10.1016/j.envpol.2018.02.016
Obbard R., Sadri S., Wong Y., Khitun A., Baker I., Thompson R. (2014). Global warming releases microplastic legacy frozen in Arctic Sea ice. Earth’s Future 2 (6), 315–320. doi: 10.1002/2014EF000240
Pakhomova S., Berezina A., Lusher A., Zhdanov I., Silvestrova K., Zavialov P., et al. (2022). Microplastic variability in subsurface water from the Arctic to Antarctica. Environ. pollut. 298, 118808. doi: 10.1016/j.envpol.2022.118808
PAME (2019) Desktop Study on Marine Litter including Microplastics in the Arctic. Available at: https://oaarchive.arctic-council.org/bitstream/handle/11374/2389/Desktop%20Study%20on%20marine%20litter.pdf?sequence=1&isAllowed=y (Accessed 21 August 2022).
Parga Martinez K., Tekman M., Bergmann M. (2020). Temporal trends in marine litter at three stations of the HAUSGARTEN observatory in the arctic deep sea. Front. Mar. Sci. 7. doi: 10.3389/fmars.2020.00321
Peeken I., Primpke S., Beyer B., Gütermann J., Katlein C., Krumpen T., et al. (2018). Arctic sea ice is an important temporal sink and means of transport for microplastic. Nat. Commun. 9 (1). doi: 10.1038/s41467-018-03825-5
Pfeiffer F., Fischer E. K. (2020). Various digestion protocols within microplastic sample processing—evaluating the resistance of different synthetic polymers and the efficiency of biogenic organic matter destruction. Front. Environ. Sci. 8, 572424. doi: 10.3389/fenvs.2020.572424
Pirsaheb M., Hossini H., Makhdoumi P. (2020). Review of microplastic occurrence and toxicological effects in marine environment: Experimental evidence of inflammation. Process Saf. Environ. Prot. 142, 1–14. doi: 10.1016/j.psep.2020.05.050
Powell M., Berry A. (1990). Ingestion and regurgitation of living and inert materials by the estuarine copepod Eurytemora affinis (Poppe) and the influence of salinity. Estuarine Coast. Shelf Sci. 31 (6), 763–773. doi: 10.1016/0272-7714(90)90081-2
Rigor I., Colony R. (1997). Sea-ice production and transport of pollutants in the Laptev Sea 1979-1993. Sci. Total. Environ. 202, 89–110. doi: 10.1016/S0048-9697(97)00107-1
Rodríguez-Torres R., Almeda R., Kristiansen M., Rist S., Winding M. S., Nielsen T. G. (2020). Ingestion and impact of microplastics on Arctic Calanus Copepods. Aquat. Toxicol. 228, 105631. doi: 10.1016/j.aquatox.2020.105631
Smedsrud L., Esau I., Ingvaldsen R., Eldevik T., Haugan P. (2013). The role of the Barents Sea in the Arctic climate system. Rev. Geophysics 51. doi: 10.1002/rog.20017
Solan M. (2018) The changing arctic ocean: cruise report. Available at: https://www.bodc.ac.uk/resources/inventories/cruise_inventory/reports/jr17007.pdf (Accessed 1 September 2022).
Stephenson S. R., Smith L. C. (2015). Influence of climate model variability on projected Arctic shipping futures. Earth’s Future 3, 331–343. doi: 10.1002/2015EF000317
Tekman M. B., Gutow L., Bergmann M. (2022). Marine debris floating in Arctic and temperate northeast Atlantic Waters. Front. Mar. Sci. 9. doi: 10.3389/fmars.2022.933768
Thompson R. C., Olsen Y., Mitchell R. P., Davis A., Rowland S. J., Anthony W. G. J., et al. (2004). Lost at sea: Where is all the plastic? Science 304 (5672), 838–838. doi: 10.1126/science.1094559
Tošić T., Vruggink M., Vesman A. (2020). Microplastics quantification in surface waters of the Barents, Kara and White Seas. Mar. pollut. Bull. 161, 111745. doi: 10.1016/j.marpolbul.2020.111745
Turner J. T. (2015). Zooplankton fecal pellets, marine snow, phytodetritus and the ocean’s biological pump. Prog. Oceanography 130 pp, 205–248. doi: 10.1016/j.pocean.2014.08.005
Van Sebille E., England M., Froyland G. (2012). Origin, dynamics and evolution of ocean garbage patches from observed surface drifters. Environ. Res. Lett. 7 (4), 044040. doi: 10.1088/1748-9326/7/4/044040
Yakushev E., Gebruk A., Osadchiev A., Pakhomova S., Lusher A., Berezina A., et al. (2021). Microplastics distribution in the Eurasian Arctic is affected by Atlantic Waters and siberian rivers. Commun. Earth Environ. 2 (1). doi: 10.1038/s43247-021-00091-0
Yamagami Y., Watanabe M., Mori M., Ono J. (2022). Barents-Kara sea-ice decline attributed to surface warming in the Gulf Stream. Nat. Commun. 13 (1). doi: 10.1038/s41467-022-31117-6
Keywords: marine, pollution, polar, zooplankton, sixth ocean gyre, underway pump
Citation: Emberson-Marl H, Coppock RL, Cole M, Godley BJ, Mimpriss N, Nelms SE and Lindeque PK (2023) Microplastics in the Arctic: a transect through the Barents Sea. Front. Mar. Sci. 10:1241829. doi: 10.3389/fmars.2023.1241829
Received: 17 June 2023; Accepted: 25 July 2023;
Published: 14 August 2023.
Edited by:
Valentina Iannilli, Italian National Agency for New Technologies, Energy and Sustainable Economic Development (ENEA), ItalyReviewed by:
Andrea Augusto Sfriso, University of Ferrara, ItalyChristina Zeri, Hellenic Centre for Marine Research (HCMR), Greece
Copyright © 2023 Emberson-Marl, Coppock, Cole, Godley, Mimpriss, Nelms and Lindeque. This is an open-access article distributed under the terms of the Creative Commons Attribution License (CC BY). The use, distribution or reproduction in other forums is permitted, provided the original author(s) and the copyright owner(s) are credited and that the original publication in this journal is cited, in accordance with accepted academic practice. No use, distribution or reproduction is permitted which does not comply with these terms.
*Correspondence: R. L. Coppock, rac@pml.ac.uk