First estimates of population size and home range of Caribbean reef and nurse sharks using photo-identification and BRUVS
 Johanna Kohler
 Mauvis Gore
 Rupert Ormond
 Timothy Austin
- 1Department of the Environment, Cayman Islands Government, George Town, Cayman Islands
- 2Centre for Marine Biodiversity and Biotechnology, Heriot-Watt University, Edinburgh, Scotland, United Kingdom
- 3Marine Conservation International, Edinburgh, Scotland, United Kingdom
The assessment of parameters population size and individual home range is important for effective conservation management of sharks. This study uses the novel application of photo identification (photo-ID) to BRUVS footage as a non-invasive alternative to tagging in order to generate individual capture histories. These were used in mark-recapture models to estimate effective population sizes and to determine home ranges. In the Cayman Islands a total of 499 shark sightings of six coastal shark species were recorded on BRUVS from 2015 - 2018, but re-sighting rates were only sufficient for the determination of population parameters for two species - Caribbean reef shark (Carcharhinus perezi) and nurse shark (Ginglymostoma cirratum). The calculated super-population sizes for Caribbean reef shark (180 ± 37 SE) and nurse shark (336 ± 61 SE) were greater than the estimates for each species based on a closed-population model (Caribbean reef shark: 128 ± 40 SE, nurse shark: 249 ± 48 SE), though both measures indicated that there were about twice as many nurse sharks (1.3 - 1.8 sharks/km2) as Caribbean reef sharks (0.7 – 1 shark/km2) within the study area. The demographic compositions included numerous immature individuals, indicating that breeding of both species takes place within the study area of 188 km2. Most recognizable individuals of both species showed linear home ranges of <20 km, but a few individuals were observed to have moved longer distances (Caribbean reef shark: 125.37 km, nurse shark: 156.07 km). The data indicate that the home ranges and long-distance movements of individual sharks observed within the islands’ marine protected areas (MPAs) often extend to areas beyond the MPA’s boundary, potentially exposing them to fishing activities. This study provides the first estimates of population size for Caribbean reef and nurse sharks in the Cayman Islands and the first estimate of a Caribbean reef shark population globally.
1 Introduction
Understanding the ecology of populations is critical for their effective conservation and management. Over the past decade shark conservation has become a global priority (Ormond et al., 2017; Daly et al., 2018; Birkmanis et al., 2020) due to the substantial decline in some shark populations (Graham et al., 2010; Worm et al., 2013; Dulvy et al., 2014; Roff et al., 2018; Pacoureau et al., 2021), including specifically in the Atlantic Ocean and Caribbean Sea (Ward-Paige et al., 2010; Dwyer et al., 2020; MacNeil et al., 2020) as the result of intense overexploitation and other human activities, such as habitat degradation (Baum et al., 2003; Pikitch et al., 2006; Jennings et al., 2008; Heupel et al., 2009; Guzman et al., 2020). In response many nations have implemented measures such as fishing bans, quotas and Marine Protected Areas (MPAs) in order to reduce the impact of fishing on local reef shark populations (Gallagher et al., 2017; Ward-Paige, 2017; Guzman et al., 2020). The benefits of these measures has however been highly variable and depended on population parameters such as population size and home range (Ormond and Gore, 2005; Speed et al., 2010; Bond et al., 2012; Dwyer et al., 2020). These assessments remain challenging and are limited by declining shark population numbers, the complexity of their habitat and their highly mobile nature.
Mark-recapture methods are a standard tool to investigate population parameters (Seber, 1986; Cliff et al., 1996; Kohler and Turner, 2001). This approach requires the identification of individuals in a population so that they can be recognized at a subsequent sampling occasion. Generally, this is done by capturing the study animal and attaching or inserting a unique tag for individual identification (Kohler and Turner, 2001). In the case of sharks, tagging can be difficult logistically, as it is sometimes impossible to restrain individuals [e.g. whale sharks (Rhincodon typus) (Meekan et al., 2006), basking sharks (Cetorhinus maximus) (Gore et al., 2016)] and in many countries there are legal restrictions that require permits to catch and handle study animals. Population models can be powerful, but these rely on a number of assumptions including equal survival and capture probability of marked and unmarked animals (Seber, 1986). The success of mark-recapture studies greatly depends on the chance of survival of marked animals, which can be limited by the potential impacts of physical capture and tagging [e.g. post-release mortality or reduced reproduction (Skomal, 2007; Gallagher et al., 2014; Barnes et al., 2016; Ellis et al., 2017)], and by the longevity of the tags or markings [e.g. failure due to the loss of tags (Graham and Roberts, 2007; Rowat et al., 2009)].
Photo-identification (photo-ID) offers a non-invasive alternative to physical mark-recapture techniques (Gubili et al., 2009; Marshall and Pierce, 2012; González-Ramos et al., 2017), using photographs to ‘capture’ (sighting) and ‘recapture’ (re-sighting) study animals. Since this method relies on distinctive markings for individual identification (Dudgeon et al., 2008), it may only be practical for species that have noticeable patterns or markings. In sharks, underwater photographs of patterns and dorsal fins have been used to study various species including basking sharks (Sims et al., 2000; Gore et al., 2016), white sharks (Carcharodon carcharias) [e.g. (Domeier and Nasby-Lucas, 2007; Towner et al., 2013; Schilds et al., 2019)], nurse sharks (Ginglymostoma cirratum) (Castro and Rosa, 2005), whale sharks [e.g. (Bradshaw et al., 2007; Graham and Roberts, 2007; Ramírez-Macías et al., 2012; Andrzejaczek et al., 2016)], and zebra sharks (Stegostoma fasciatum) (Dudgeon et al., 2008).
Since population models rely on individual capture histories and sufficient numbers of re-sightings (Cooch and White, 2009; Schwarz and Arnason, 2009), the precision of population estimates increases with sample size (Cooch and White, 2009). However, sharks are typically elusive and difficult to capture (or sight) because individuals often tend to avoid areas where there are boats, or snorkelers and SCUBA divers in the water (Smith et al., 2010; Cubero-Pardo et al., 2011; Bradley et al., 2017c). To achieve large sample sizes, previous studies have surveyed natural aggregation events [e.g. whale sharks (Andrzejaczek et al., 2016) or basking sharks (Gore et al., 2016)] or used bait to attract animals [e.g. white shark (Towner et al., 2013)].
Given the predatory nature of reef sharks, baited remote underwater video systems (BRUVS) are now a common tool for studying aspects of shark populations (Brooks et al., 2011; Clarke et al., 2012; Ormond et al., 2017; Osgood et al., 2019; Bruns and Henderson, 2020; MacNeil et al., 2020) and are considered advantageous for species that tend to avoid human presence and so are not well recorded using Underwater Visual Census (UVC) techniques reviewed in Harvey et al., 2013. Individual sharks on BRUVS are often seen from multiple angles. The recent improvement of the resolution in affordable action cameras (e.g. GoPros) has enabled the application of photo-ID techniques to BRUVS recording permitting researchers to improve the estimates of relative abundances of rays (Sherman et al., 2018) and reef sharks (Gore et al., 2020). While Koivuniemi et al. (2019) used camera traps, photo-ID, and mark-recapture techniques to estimate the population size and the home range of Saimaa ringed seals (Phocahispida saimensis), this approach has not until now been used to assess shark populations. The use of BRUVS in combination with photo-ID appears to be especially advantageous for populations that are small or endangered and therefore inherently difficult to survey.
Reef sharks play a key role in maintaining healthy reef ecosystems (Cortes, 1999; Bascompte et al., 2005; Ferretti et al., 2010; Heupel et al., 2014). A recent study found that reef shark populations in the Caribbean are much less abundant than those in the Pacific and Indian Ocean (MacNeil et al., 2020). Further, reef sharks in remote locations, such as the Cayman Islands, are considered ecologically vulnerable to local extinction, since like remote island populations they are less likely to be repopulated from other regions (Karl et al., 2012; Bernard et al., 2017). Nurse sharks and Caribbean reef sharks (Carcharhinus perezi) are the two most abundant reef shark species in most Caribbean regions (Castro, 2000; Chapman et al., 2005; Bond et al., 2012; Pickard et al., 2016; Bakker et al., 2017; Fanovich et al., 2017; Bruns and Henderson, 2020; Casselberry et al., 2020), including the Cayman Islands (Ormond et al., 2017), both being reported to have relatively small home ranges (10 - 20 km) (Chapman et al., 2005; Bond et al., 2012; Pickard et al., 2016; Garla et al., 2017; Dwyer et al., 2020). To date, however, information on local population size is only available from nurse sharks in the Atol das Rocas Marine Reserve, Brazil (Castro and Rosa, 2005), and there are still no estimates reported from other species such as the endemic Caribbean reef shark.
In the Cayman Islands, shark research commenced in 2009 (Ormond et al., 2017) and results showed that abundances of sharks are moderately low compared to some other locations (Gore et al., 2020), with the distributions of species influenced by habitat and human disturbance (Kohler, 2022). Since it is recognized that even small recreational fisheries, such as that in Cayman, can impact reef sharks (Lewin et al., 2006; McCoy et al., 2009; Meier et al., 2011; Mohan et al., 2020), precautionary measures can provide some degree of protection for local populations. Marine Protected Areas (MPAs) were established in 1986, covering 45% and 50% of the coastal shelf on Grand Cayman and Little Cayman, respectively (NCA, 2013). Additionally, a nation-wide ‘shark sanctuary’ prohibiting the catch and landing of any shark species within Cayman waters has been in effect since 2015 (NCA, 2013). To date, precise estimates of population sizes and home ranges of reef sharks in Cayman have not been available. Despite proactive conservation efforts, a lack of information on the status of local shark populations is of concern, since this undermines effective conservation planning (Bond et al., 2012).
To address this knowledge gap the present study investigated the following hypotheses: 1) that the novel application of photo-ID can be used to recognize individual sharks and, based on the frequency or re-sightings, be applied to mark-recapture models to estimate population size and demographic composition, and 2) that the use of photo-ID to recognize individual sharks can also be used to assess the movements and home-ranges of individuals. Assuming sharks were recorded on BRUVS, it was expected that prolonged soak times would allow the recording of all individuals that were available for ‘capture’ (i.e. present within the proximity of the BRUVS unit). Presuming that sufficient numbers of individual re-sightings could be recorded, it was anticipated that both closed and open mark-recapture models could be applied to the data, the latter assuming significant movement of individuals into and out (immigration and emigration) of the population being modelled. Provided individual sharks were sighted at more than one location, linear home ranges of species were expected to be estimated as relatively small (<20 km). The results provide information for effective conservation and enforcement locally and contribute towards the knowledge of the status and behavior of reef shark populations in the wider Caribbean.
2 Materials and methods
2.1 Study area
Grand Cayman (19.3222° N, 81.2409° W) and Little Cayman (19.6897° N, 80.0367° W) are two of the three Cayman Islands located in the western Caribbean Sea (Figure 1), approximately 110 km apart and totalling 264 km2 in land area. Each island has a narrow sublittoral shelf (maximum width: 1.5 km) with two distinct reef terraces (shallow reef: 5 - 15 m, deep reef: 16 - 25 m) and below this almost vertical slopes reaching to more than 2000 m (Roberts, 1994). Different portions of the coast are fringed by shallow lagoons, seagrass beds, mangroves and coral reefs, of which some areas have been protected to varying degree, jointly referred to as Marine Protected Areas (MPAs), since 1986 (NCA, 2013). During the time of this study, MPAs covered a total of 45% the costal shelf on Grand Cayman and 50% on Little Cayman. No take zones covered 15% and 11% of the coastal shelf on Grand Cayman and on Little Cayman, respectively (NCA, 2013). The boundaries of MPAs have recently been enhanced to cover 55% of Cayman’s total coastal shelf (NCA, 2013). The detailed description and regulations of each zone can be reviewed at https://doe.ky/marine/marine-parks/. The reef environment is dominated by soft and hard coral, and sponges, with areas of reef rock and sandy bottom, whereas the lagoons consist mostly of sandy substrate, single coral heads, and seagrass beds, both environments providing habitat for a diversity of tropical reef fish (Burgess et al., 1994; Logan, 1994).
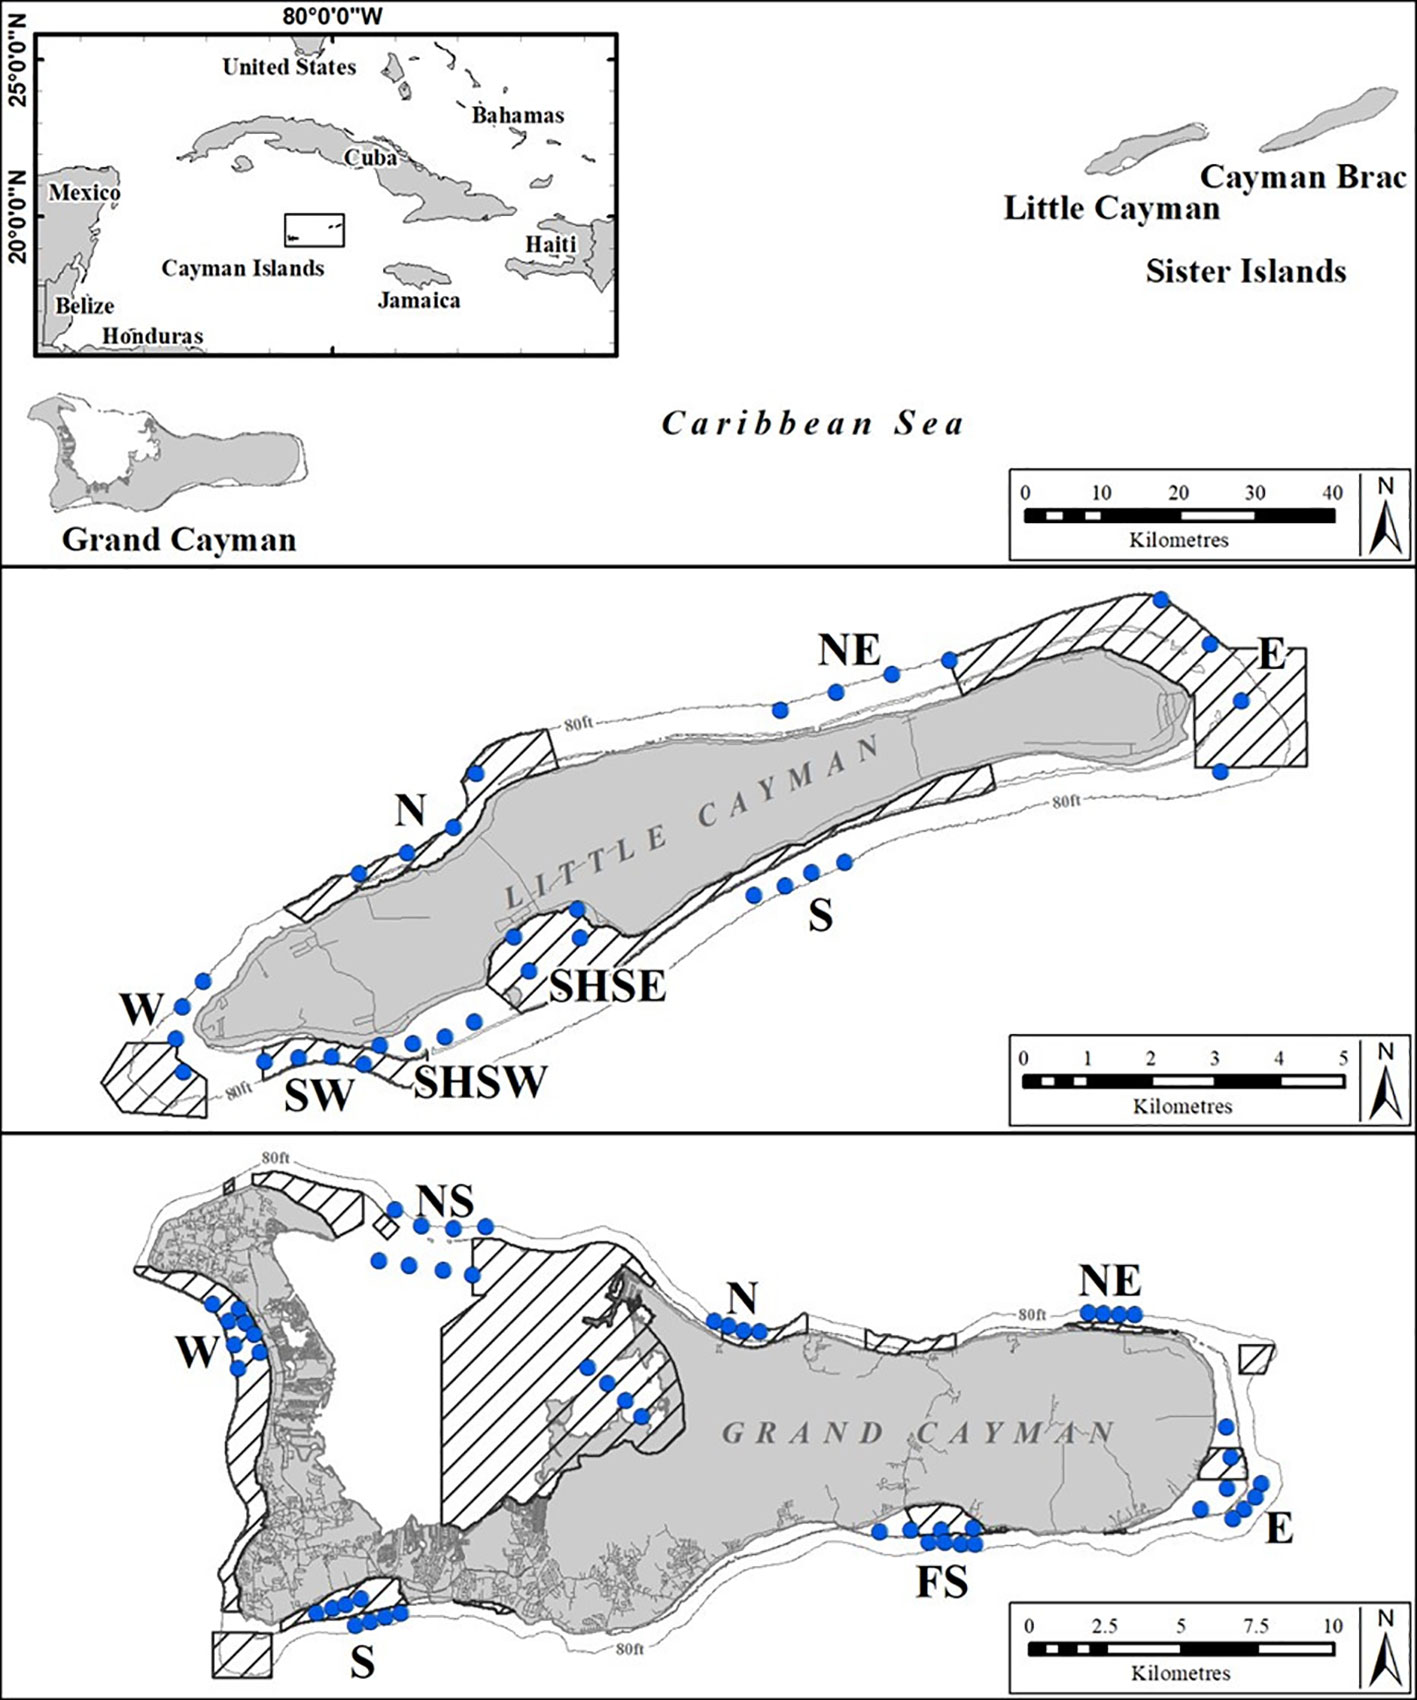
Figure 1 Standardized sampling areas (letters) and individual BRUVS deployment sites (rows of four blue dots indicating four replicate BRUVS deployments) on Grand Cayman (13 areas) and on Little Cayman (8 areas) used repeatedly throughout the study period (2015 - 2018). Shaded areas indicate the extent of MPAs.
2.2 Data collection
The data were collected using baited remote underwater video systems (BRUVS) deployed on seven seasonal sampling occasions over a four-year period (October 2015 - November 2018) (see Table 1). On each sample occasion the same 13 areas on Grand Cayman and 8 areas on Little Cayman were surveyed (Figure 1). In each area, on each sampling occasion, a set of four BRUVS was deployed with 500 - 1000 m between individual units. Mono-BRUVS (one horizontally facing camera, Figure 2) were deployed on the seabed inside MPA boundaries (MPA = 10) and outside (non-MPA n= 11), at the fore-reef between 10 - 25 m (n = 14) and in the lagoon between 0.5 - 6 m depth (n = 7). Stereo BRUVS were not used as the extra cost and time needed for analyses were not justified in terms of additional data. BRUVS were baited with approximately 300 g of sliced Atlantic mackerel (Scomber scombrus) contained within a mesh bag attached to the end of a 1.5 m bait arm. Cameras (GoPro camera Hero 3 or 4) were expected to record for at least 90 min or until battery failure or exhaustion of available space on the memory card (mean recording time 123.2 ± 19.1 min, range = 69.7 - 202.9 min). All videos (n = 278) were viewed using VLC, Windows media, or Apple Quick Time player, depending on software availability on laptops or desktop computers.
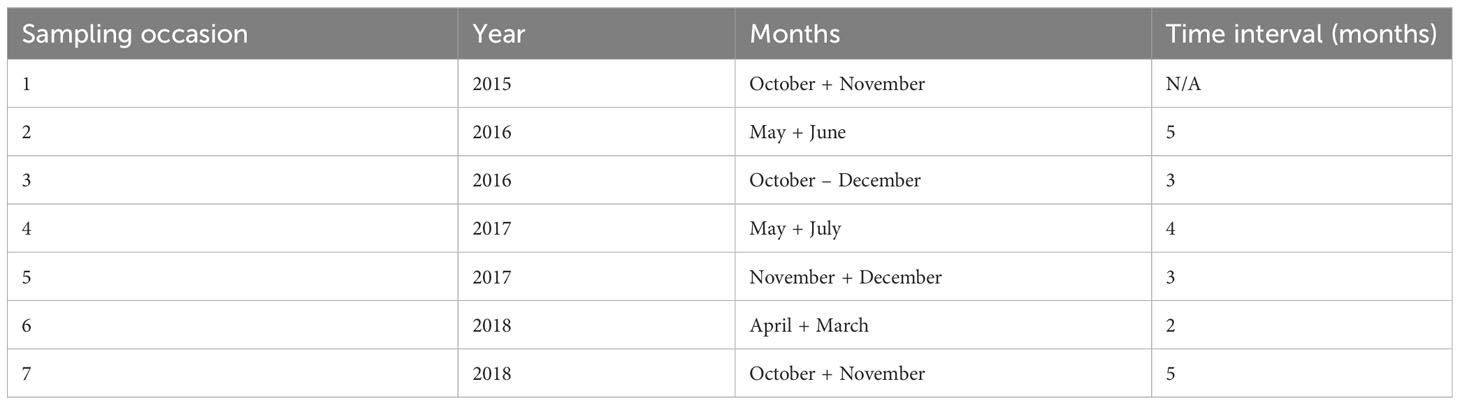
Table 1 Summary of sampling occasions and time intervals (number of months) between sampling occasions of collecting underwater photos of sharks from BRUVS in the Cayman Islands (2015 - 2018).
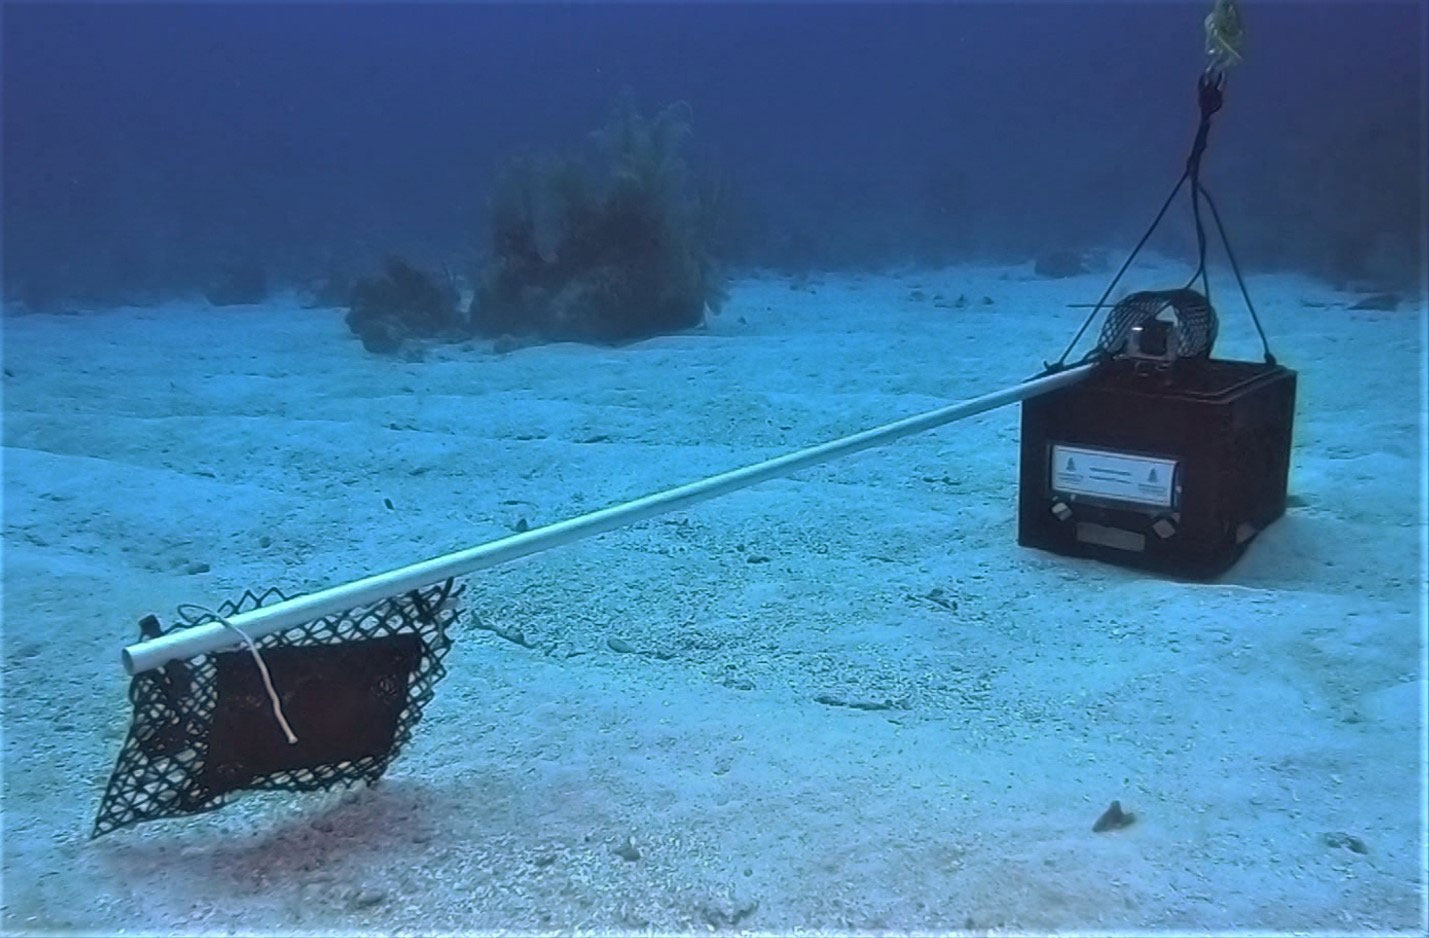
Figure 2 Design of mono-BRUVS deployed in the Cayman Islands.
2.2.1 Standardized photo-identification
Photographic identification (photo-ID) of individual sharks was made using distinctive features such as the presence of natural markings (e.g. skin discoloration, shape of dorsal fins), signs of former injuries (e.g. wounds, scars, fin damage and fishing hooks), and in some cases the presence of tags following separate conventional tagging [See Figure 3 for examples of distinguishing features, as also used by others (Castro and Rosa, 2005; Meekan et al., 2006; Domeier and Nasby-Lucas, 2007; Dudgeon et al., 2008; Marshall and Pierce, 2012; Gore et al., 2016)]. Markings were assumed to be unique, and not to fade completely or heal completely over the study period (Anderson and Goldman, 1996; Gore et al., 2016).
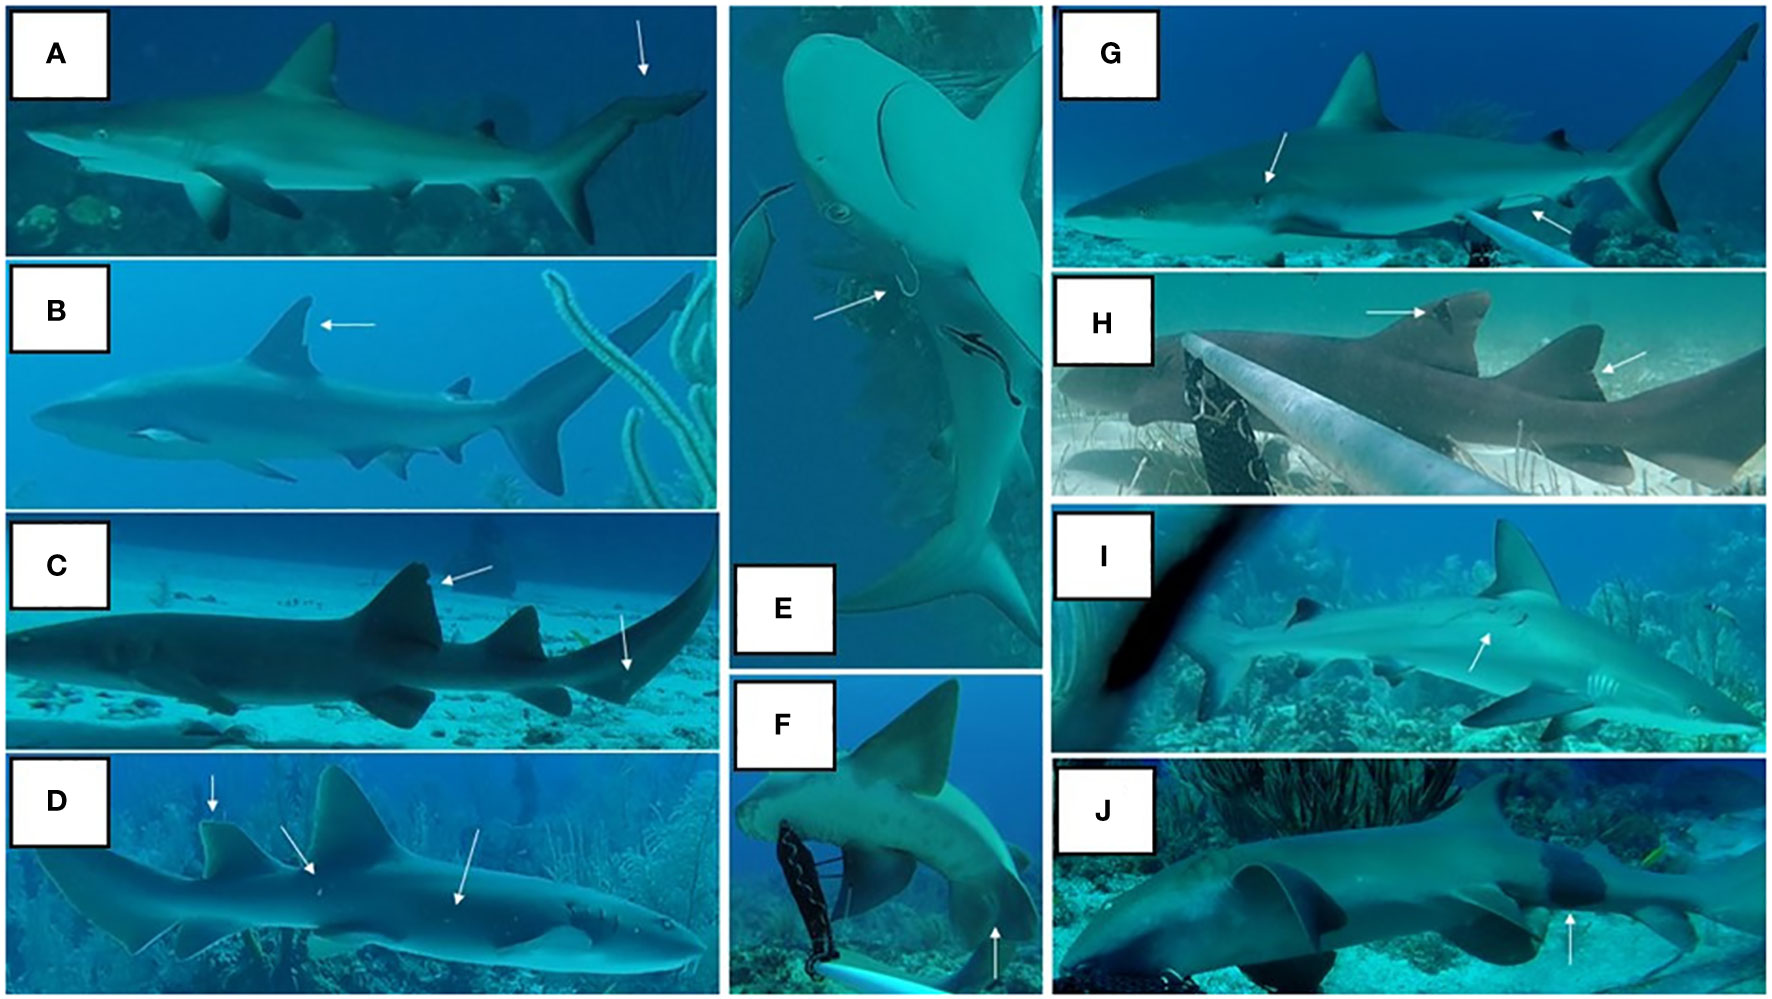
Figure 3 Examples of features used to distinguish individual sharks, including fin shape (A–D), skin discoloration (F, J), injuries, scars (G, I), dorsal fin tag (H), fishing hook (E), and sex (F, G).
Individual sharks were classified as either immature or mature, based on estimated total length (TL), and the sex of each individual recorded. The length estimates were not considered to be exact measurements because size estimates are difficult to make accurately from mono-BRUVS (Harvey et al., 2002; Cappo et al., 2004; Harvey et al., 2009). To reduce the variability in length estimates of the shark, estimates were made in relation to the size of the bait bag and to reference images of a pole. The first individual length estimate was derived in relation to the bait bag (25 cm side facing camera, 1.5 m away) and the second was made in relation to reference images of a PVC pole (total length 160 cm marked in 10 cm increments) taken at 1 - 10 m distance from the camera. For each shark, an estimate of TL (from the tip of the snout to the tip of the caudal fin) was made to the nearest 5 cm and the maturity determined (Table 2). The two estimates per shark were compared and when they differed in relation to their maturity, the TL and maturity were re-estimated. Sharks that swam further than 10 m from the camera, that did not entirely come into the field of view at any one time during the video, or that swam far above the BRUVS unit, were not sized and were removed from this part of the analysis.
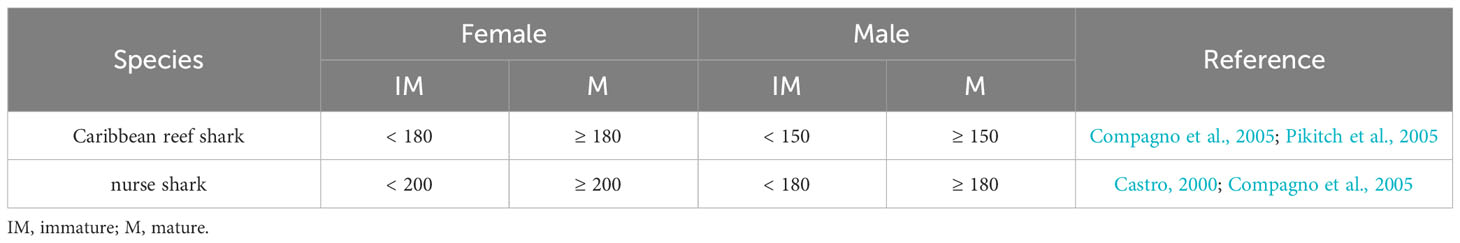
Table 2 Total length (cm) criteria for classifying maturity of sharks recorded on BRUVS in the Cayman Islands (2015 - 2018).
The sex of sharks was identified by the presence (= male) or absence (= female) of claspers. Immature sharks were only sexed if the anogenital area was visible at any time during the video, so allowing the observer to examine the pelvic region for the presence or absence of claspers. If the ventrum was not clearly visible, and no claspers were observed, then the sharks were designated as ‘no visible claspers’ (NVC).
Conventional dorsal fin tags [Rototag livestock tag (DuFlex, Destron Fearing) or breeding pair ovine Allflex tag (Ritchie EID)] were fitted on Caribbean reef sharks and on small numbers of nurse sharks during an acoustic tagging study undertaken between 2010 – 2018 (Kohler, 2022). Video analysis of BRUVS revealed that only a small number of nurse sharks with tags were recorded and that those tags were heavily overgrown with turf algae, making the tag number unreadable. Therefore, instead of the number on the tag, only the presence of the tag was considered an identifying feature.
For each shark, the distinguishing features were entered into a software database [see Gore et al. (2016)] supported by still images captured from BRUVS videos in order to facilitate matching of re-sighted individuals. Still images were taken using the screenshot function available in Windows/Mac or within the media player (VLC, Windows media or Apple Quick Time). For each shark, so far as possible, at least one image was taken of (1) the entire body (LHS, RHS1), (2) the 1st and 2nd dorsal fin on both left and right-hand sides (LHS, RHS), (3) the head (LHS, RHS), (4) the underside of the pelvic fins, and (5) of any additional distinctive features (e.g. dorsal fin tag, scar, skin discoloration, hook, injury). For some sharks no distinguishing features could be recorded because of the lack of any visible distinguishing features, either because the shark did not come close enough to the camera or because it moved through the frame too quickly. In this case the shark sighting was marked as ‘no ID possible’ and rejected for use in any data analysis (Castro and Rosa, 2005; Meekan et al., 2006) so as to meet the underlying assumptions of mark-recapture models (Jolly, 1965; Seber, 1965; Seber, 1982).
2.2.2 Sightings and individual live-encounter histories
For the purpose of mark-recapture analysis a shark sighting was defined as the presence of an individual at a BRUVS unit at any time during a single deployment, whether it entered the frame just once or made multiple entries. In contrast, a re-sighting was recorded when the same individual was sighted again on a different unit either on the same day or on a subsequent day. Potential re-sightings based on characteristics recorded in the database were confirmed (or rejected) by direct comparison of ID-photographs by a trained observer (Figure 4). Additionally, each re-sighting was confirmed (or rejected) by a second experienced observer in order to reduce visual bias and the chance of a false positive, as previously implemented (Andrzejaczek et al., 2016; Gore et al., 2016; Araujo et al., 2017). The data were processed to generate individual live-encounter histories (Supplementary Material) where 1 = the sighting (i.e. capture or re-capture in terms of mark-recapture models) of a particular shark and 0 = the absence of that individual, on a particular sampling occasion (White and Burnham, 1999).
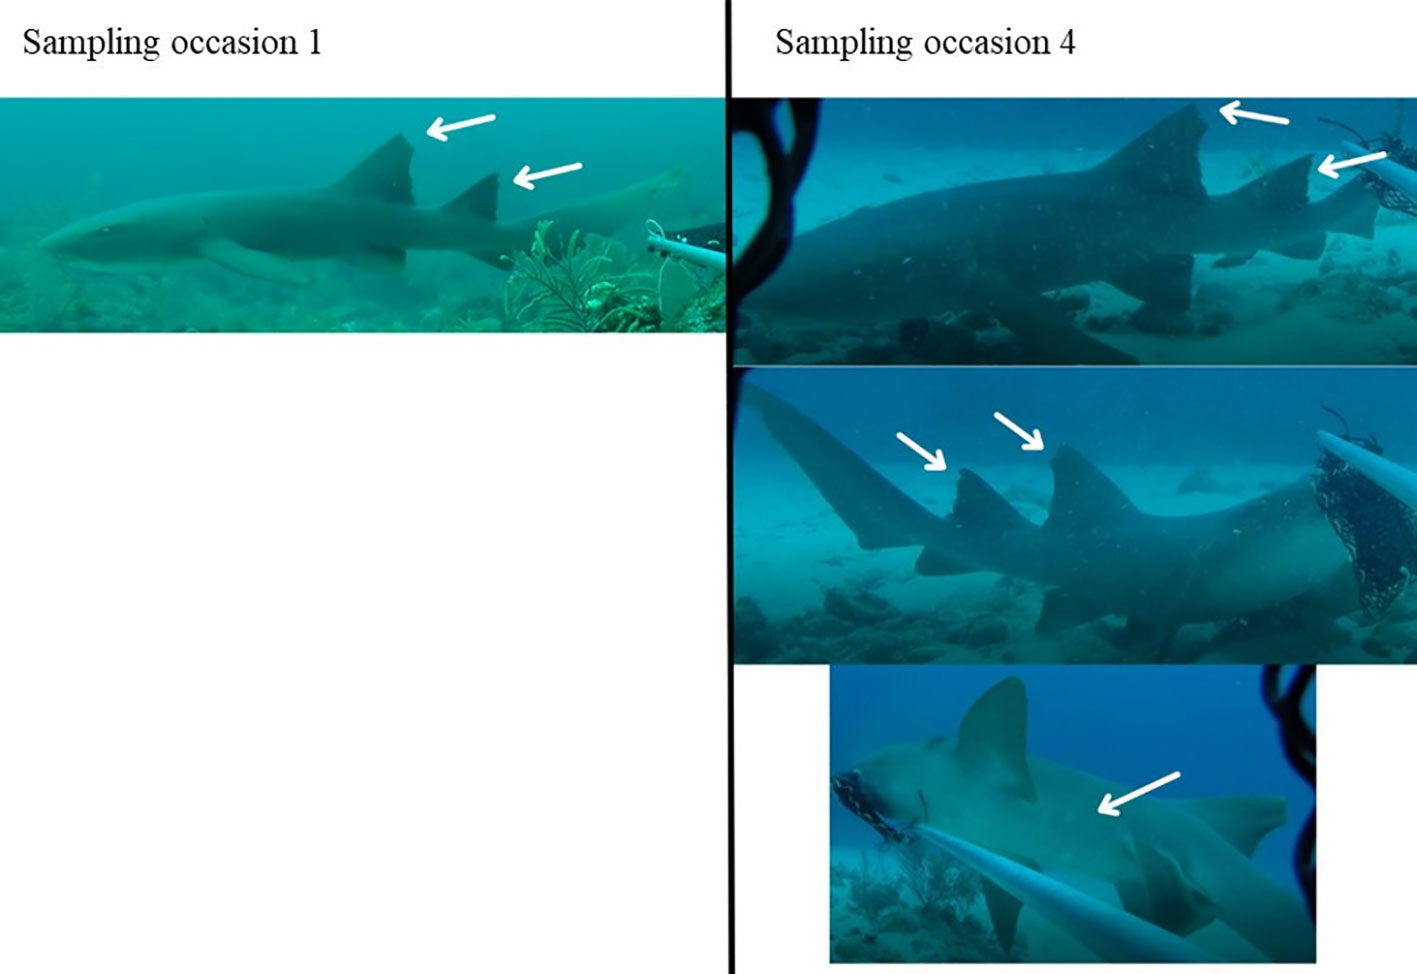
Figure 4 Example of ID-photographs of the same individual shark recorded on two sampling occasions in the Cayman Islands (2015 - 2018).
2.3 Data analysis
2.3.1 Estimating population size
For each species, the population size was estimated using two standard mark-recapture models, the first assuming demographic and geographic closure (no immigration or births and no emigration or deaths: closed population) and the second not assuming any closure (allowing for the potential occurrence of immigration, births, emigration, and deaths: open population) within the study period.
2.3.1.1 Closed population model
The closed-population estimates of population size () were obtained using the Chapman derivative of the basic Lincoln-Peterson estimator (Seber, 1982; Cliff et al., 1996) which is more robust for small sample sizes (Chapman, 1951). For each ‘re-capture’ occasion t, the population size (Nt) was calculated (Equation 1) where nt = the number of sharks sighted on sampling occasion t, rt = the number of marked sharks re-sighted in sample nt, and mt = the number of marked sharks at the beginning of sampling occasion t.
Assuming that k1 number of sharks were initially ‘marked’ (i.e. individually identified) at sampling occasion 1 and that k2 = n2 – r2 number of unmarked sharks were sighted, were marked and released at the end of a sampling occasion 2, then mt number of effectively marked sharks at the next sampling occasion t equals . For each Nt the variance (Equation 2)
and 95% Confidence Interval (Equation 3)
were determined and the total population size () was estimated as the mean (Equation 4) across sampling occasions s (Cliff et al., 1996; Castro and Rosa, 2005).
2.3.1.2 Open population model
The open-population estimates were obtained using a Jolly-Seber model (Jolly, 1965; Seber, 1965) that estimated super population size (), which is the number of animals that would hypothetically ever be present in the population concerned during the study period. This was achieved using the POPAN function in the mark-recapture software program MARK (RRID : SCR_019281) (Arnason and Schwarz, 1995; White and Burnham, 1999). The model assumes that all individuals (both unmarked and marked) in the population have the same probability of capture (i.e. being sighted or re-sighted) and of apparent survival. Based on likelihood for t sampling occasions, the model generates t – 1 estimates of Φ (‘phi’ = apparent survival probability), t estimates of p (capture probability), t –1 estimates of β (‘pent’ = probability of entry into the population), and . Specific assumptions concerning the fit of the model (Schwarz and Arnason, 2009) to the data were tested on the fully time-dependent model using the RELEASE GOF function in MARK (Burnham et al., 1987).
Models were fitted using the logit link function for Φ and p, the log link function for , and the multinomial logit (Mlogit) link function, so as to limit the sum of β to ≤ 1 (White and Burnham, 1999; Schwarz and Arnason, 2009). The time-dependency of model parameters was adjusted so that every possible combination of Φ, p and β (n = 8) was modelled. For all models the number of sampling occasions was set to 7 and the time intervals were adjusted to present the number of months between the last month of the previous sampling occasion and the first month of the following sampling occasion (Table 1). Akaike’s Information Criterion (AICc) was used to compare the fit of the different models (Burnham and Anderson, 2002), and the estimate of the best fit model [that is the model with the lowest AICc (Burnham and Anderson, 2002)] was reported. Estimates of Φ, p and β were not the central aim of the study and so are not reported.
2.3.2 Sex and maturity
For each species, the proportions of males to females and of mature to immature individuals were calculated after pooling data for all individuals across the study period. Only sharks that were sexed or for which the maturity could be determined, respectively, were used in this analysis. Statistical significance of any deviation from a 1:1 ratio was determined using a Chi-squared goodness of fit test (α = 0.05). All statistic test results were considered significant at the 0.05 level and, unless p< 0.001, the exact p-value was reported.
2.3.3 Estimating home range size
The size of linear home ranges was examined by defining the minimum linear displacement (MLD) following the protocol described in Kohler (2022). In short, the individual MLD was defined as the linear distance between the two furthest BRUVS units at which a particular shark was recorded. The GPS coordinates of these two sites were converted into distance, using the great-circle distance formula (https://www.movable-type.co.uk/scripts/latlong.html), and reported in kilometers (km). For individual sharks that were sighted only once or only at one location, no MLD was calculated. Prior to hypothesis testing, data were tested for homogeneity of variances using a Levene’s test (α = 0.05) and for normality using a Shapiro test (α = 0.05) (Supplementary Material). To test the null hypothesis that home range sizes were not significantly different between species, a non-parametric, two-way Mann-Whitney U test (α = 0.05) was used.
3 Results
From 2015 - 2018, a total of 557 BRUVSs recorded 499 shark sightings of six shark species (Table 3). Sharks were identified as individuals by photo-identification using the underwater video footage on 69.67% of all sightings (Table 3). Caribbean reef and nurse shark were the most frequently recorded species with a re-sighting rate of known individuals of 36.17% and 26.09%, respectively (Table 3). Due to the low numbers of sightings of the remaining species (Table 3), the following analyses were only feasible for Caribbean reef and nurse shark. Individual live-encounter histories for each species are reported in Supplementary Material.
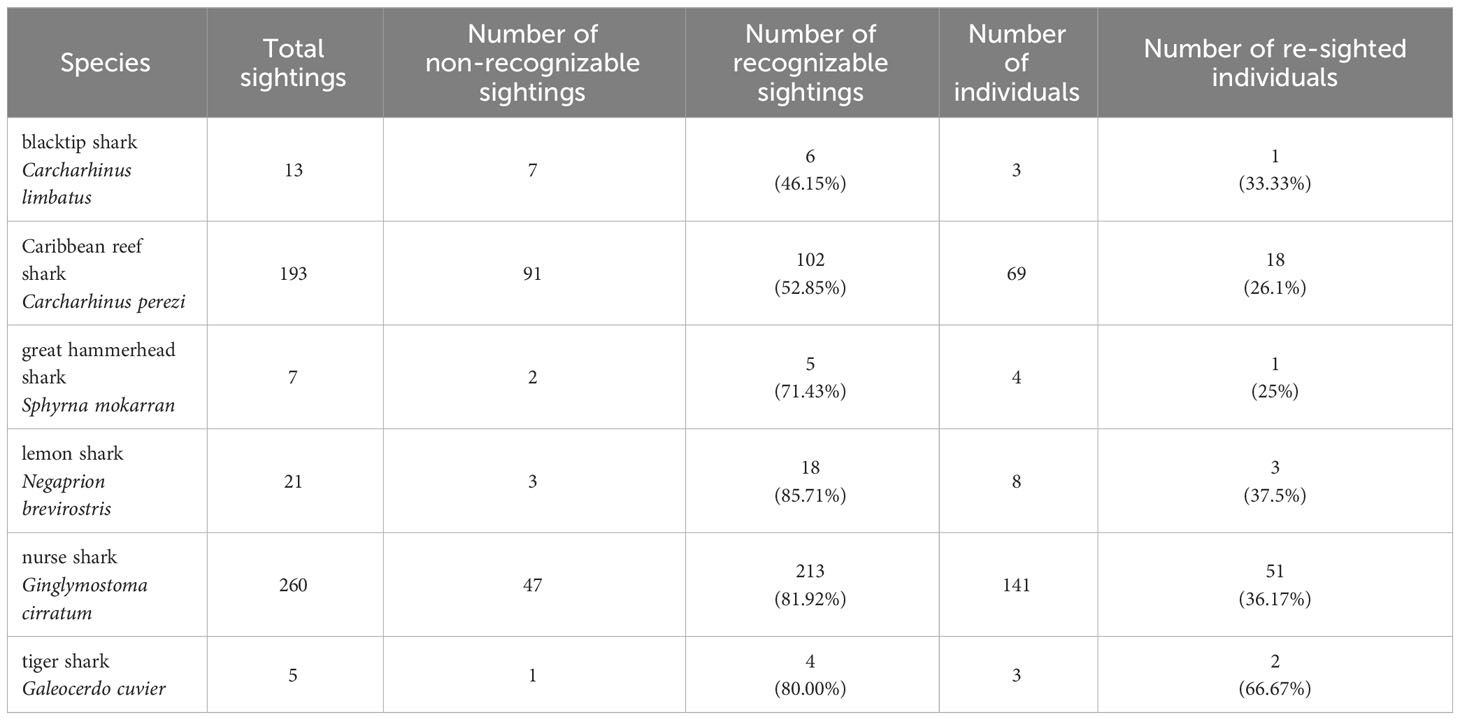
Table 3 Summary of sightings and individual sharks on ID-photographs obtained from BRUVS in the Cayman Islands (2015 - 2018).
3.1 Estimating population size
3.1.1 Closed population model
The Lincoln-Peterson estimates for each sampling occasion varied from 27 - 314 individuals for Caribbean reef sharks (Figure 5) and from 71 - 414 individuals for nurse sharks (Figure 6). The mean population size () of Caribbean reef sharks was 128 ± 40 (SE) and that of nurse sharks was 249 ± 48 (SE).
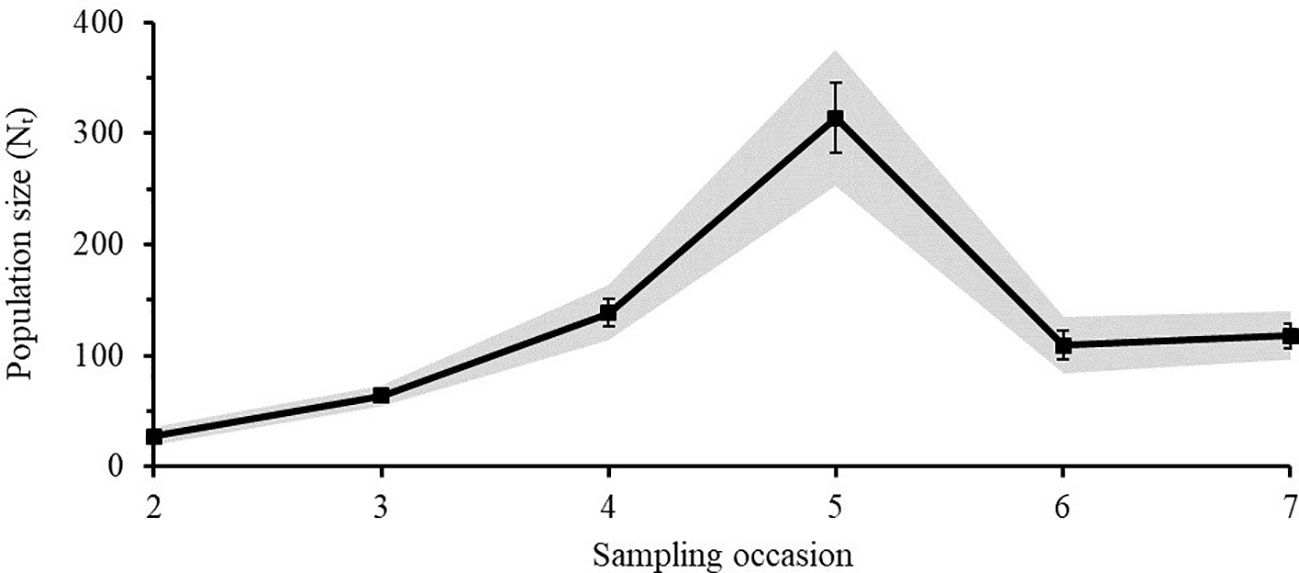
Figure 5 Lincoln-Peterson estimates (Nt) ± SE of Caribbean reef sharks for each sampling occasion (t) in the Cayman Islands (2015 - 2018). Grey area represents the 95% Confidence Interval.
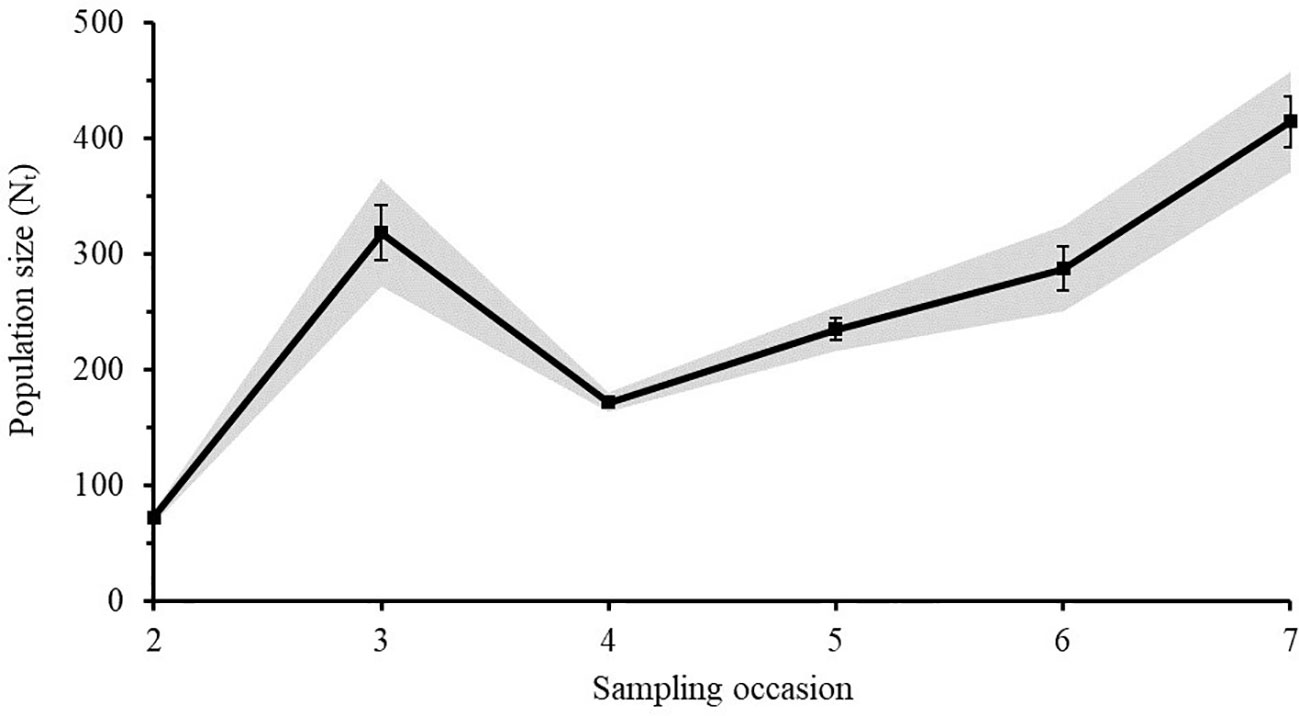
Figure 6 Lincoln-Peterson estimates (Nt) ± SE of nurse sharks for each sampling occasion (t) in the Cayman Islands (2015 - 2018). Grey area represents the 95% Confidence Interval.
3.1.2 Open population model
For Caribbean reef and nurse sharks the test results of the program RELEASE GOF (Table 4) showed no violation of the underlying assumptions for open population mark-recapture models, indicating equal probabilities of apparent survival, capture and entry of photographically identified individuals. For both species, a variance inflation factor of ĉ = 1 was applied because ĉ-values indicated slight under-dispersion of the data (Cooch and White, 2009).
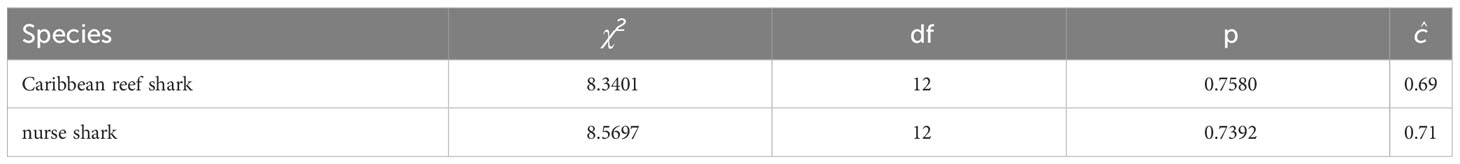
Table 4 RELEASE goodness-of-fit results (TEST 2 + TEST 3) and ĉ for the fully time-dependent Jolly-Seber model tested in the mark-recapture analysis of individual encounter histories of Caribbean reef and nurse sharks in the Cayman Islands (2015 - 2018), using the POPAN function in the program MARK.
For both species, eight Jolly-Seber models were tested; the model choice criteria and the respective super-population estimates are summarized in Table 5. Comparing the AICc scores and weights, model {Φt p. βt} (time-dependent survival, constant probability of capture and constant probability of entry) was the most parsimonious for Caribbean reef sharks and had approximately 2.3-times more support than the next best model {Φt pt βt} (Table 5). This best fit model estimated the size of the super-population for Caribbean reef sharks at 180 individuals (95% Confidence Interval = 127 - 281).
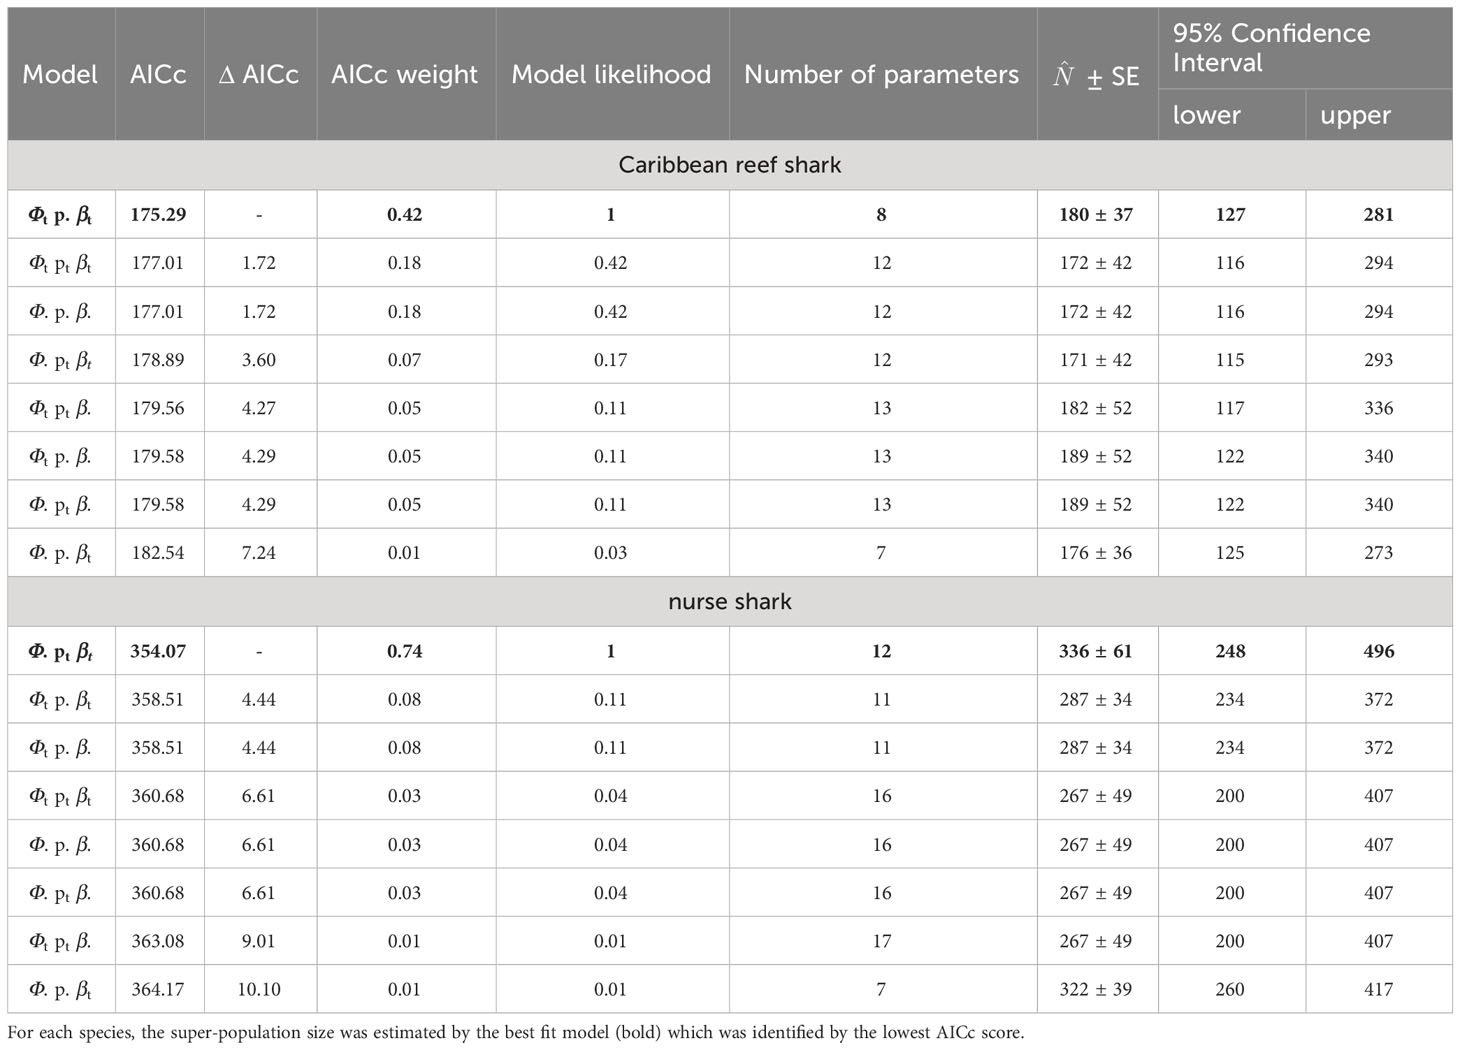
Table 5 Model choice criteria and abundance estimates () of eight Jolly-Seber models tested in a mark-recapture analysis for individual encounter histories of Caribbean reef and nurse sharks in the Cayman Islands (2015 - 2018), using the POPAN function in the program MARK.
For nurse sharks, the best fit model {Φ. pt βt} (constant survival, time-dependent probability of capture and entry) was approximately 9.25-times more supported than the next best model {Φt p. βt} and estimated the size of the super-population at 336 individuals (95% Confidence Interval = 248 - 496, Table 5).
3.2 Sex and maturity
The maturity of all 69 individual Caribbean reef sharks and 141 individual nurse sharks was determined among which 64 and 117 individuals of each species respectively could be sexed (Table 6). For Caribbean reef sharks, the sex ratio did not differ significantly from unity (Chi-squared test: χ2 = 3.7812, df = 2, p = 0.151), but immature sharks were found to be significantly more common (Chi-squared test: χ2 = 56.116, df = 2, p< 0.001) than mature individuals (Table 6). For nurse sharks, males (Chi-squared test: χ2 = 6.838, df = 2, p = 0.033) and immature sharks (Chi-squared test: χ2 = 150.5, df = 2, p< 0.001) were significantly more common than females and mature individuals, respectively (Table 6).
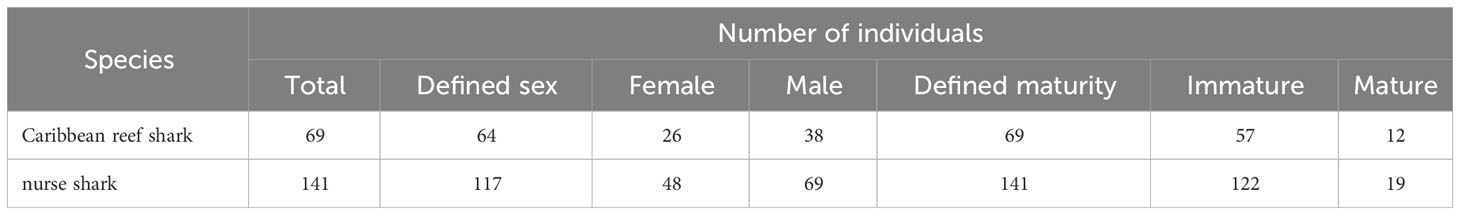
Table 6 Summary of demographics for Caribbean reef sharks and for nurse sharks. Individual sharks were identified through the application of photo-ID to BRUVS videos from the Cayman Islands (2015 - 2018).
3.3 Estimating home range size
For both species mean home range sizes were relatively small (< 22 km, Table 7) and did not differ significantly between species (Mann-Whitney U test: W = 441, p = 0.162). Individual Minimum Linear Displacements (MLDs), the number of sightings, and the number of BRUVS units on which the individual was recorded are reported in the Supplementary Material. The maximum MLD was 156.07 km for nurse sharks and 125.37 km for Caribbean reef sharks, with MLDs greater than 100 km recorded for four and two individuals of each species respectively (Supplementary Material).
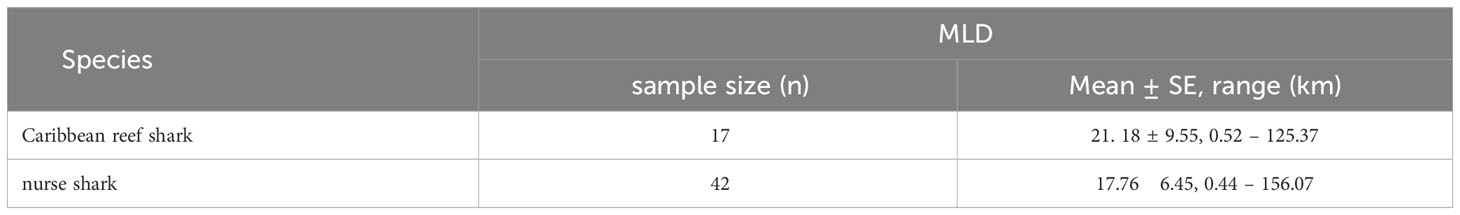
Table 7 Mean (± SE) and range of minimum linear displacement (MLD) of Caribbean reef and nurse sharks identified through the application of photo-ID to BRUVS videos from the Cayman Islands (2015 - 2018).
4 Discussion
The present study demonstrated that the novel application of photo-identification and mark-recapture models to BRUVS footage can be a useful, non-invasive tool for estimating population sizes of reef shark species. This study provided the first estimate of population sizes of Caribbean reef and nurse sharks in the Cayman Islands (Grand Cayman and Little Cayman, totalling 188 km2 coastal shelf), and the first estimate of the size of a distinct Caribbean reef shark population in any region. Such assessments of population numbers are critical for the effective conservation and management of sharks (Bond et al., 2012), since it is important to be able to determine whether a population is stable, or increasing or in decline. This is especially important in remote locations, such as the Cayman Islands, since these populations could be subdivided from those in other regions as a result of geographic separation by deep water (Karl et al., 2012; Bernard et al., 2017).
Using encounter histories of individuals generated by photo-identification both open- and closed- population estimates indicate that there were about twice as many nurse sharks (1.3 - 1.8 sharks/km2) as Caribbean reef sharks (0.7 - 1 shark/km2) present in the study area. Population density assessments for reef sharks are limited and, to this date, none are available for Caribbean reef sharks [e.g. see IUCN Red List report of the Caribbean reef shark (Carlson a et al., 2021)]. Mark-recapture studies in the Caribbean have focused predominantly on whale sharks (Graham and Roberts, 2007; Ramírez-Macías et al., 2012; McKinney et al., 2017), calculations estimating the presence of 521 to 809 individuals in Mexico and 2,167 individuals throughout the entire Western Central Atlantic Ocean region. However, since these studies assessed feeding aggregations of a highly migratory species, these numbers are not directly comparable to the population numbers of reef sharks estimated in this present study.
The estimated nurse shark density in the present study is approximately 24 times less than of that estimated for the Atol das Rocas Marine Reserve, Brazil [44 sharks/km2 (Castro and Rosa, 2005)], a study that also used photo-identification and mark-recapture methods. Compared to estimates of reef shark numbers from Palmyra Atoll [grey reef shark (Carcharhinus amblyrhynchos) population size = 8,344 sharks, population density = 21.3 sharks/km2 (Bradley et al., 2017a)] and French Polynesia [blacktip reef shark (Carcharhinus melanopterus) population size = 250 sharks, density = 5.1 sharks/km2 (Vignaud et al., 2014)] population numbers of both Caribbean reef and nurse sharks in this present study appear to be relatively low. The shark populations at Palmyra Atoll have been monitored for over a decade and are likely at or near their site-specific carrying capacity (Bradley et al., 2017b; Dillon et al., 2020), which is presumed to have an upper limit that depends on habitat extent and prey availability (Stevens, 2012; Storch and Okie, 2019), degree of isolation or connectivity described in Vignaud et al. (2014); Bernard et al. (2017), and region-specific life history traits reviewed in Mourier et al. (2013). The large numbers of grey reef sharks in Palmyra Atoll may have aggregated to feed on fish schools attracted to feed on spawn at localized upwelling sites, but nevertheless small islands surrounded by deep waters, such as the Cayman Islands, likely support lower numbers of sharks than more extended networks of semi-connected reefs.
The demographic compositions observed, including numerous immature individuals, indicate that there are breeding populations of both Caribbean reef and nurse sharks within the area, supporting the evidence that both species are substantially resident through their range (Carrier and Pratt, 1998). Since shallow lagoons provide nursery grounds for sharks elsewhere, including insular populations (Feldheim et al., 2002; Garla et al., 2006b; Papastamatiou et al., 2009; Papastamatiou et al., 2015; Bond et al., 2017), it would be useful to undertake visual surveys for juveniles across suitable mangrove and reef flat areas; however preliminary searches of these areas did not detect any concentrations of juveniles, such as are known for lemon shark nursery areas in the Bahamas (Feldheim et al., 2002, 2014). The occasional sighting of small juveniles both on BRUVS and while SCUBA diving suggests that Caribbean reef sharks may in contrast use structurally complex reef slope areas for pupping and to provide shelter for juveniles.
Mark-recapture methods are a standard approach to estimate population sizes (Krebs, 1999) and can provide robust estimates as long as the underlying assumptions of the models are met (Sosa-Nishizaki et al., 2012). While ecological studies inherently have some degree of variation, in the present study bias due to imperfect detection [reviewed in (Marshall and Pierce, 2012; Hagihara et al., 2018)] was considered limited due to almost constantly clear visibility and the use of two trained observers to confirm the identity of individual sharks recorded on BRUVS video.
As in most mark-recapture studies, the assumption of equal catch probability was probably violated to some degree [reviewed in (Latour, 2004)]. The standardized effort using BRUVS rather than physical capture of the sharks or sightings by SCUBA divers permitted the recording of all individuals within the camera’s field of view, regardless of markings, sex, or maturity. This was advantageous because other capture methods are selective (e.g. size selective) to some degree (Rudstam et al., 1984; Chopin and Arimoto, 1995). Similarly, sharks might actively avoid SCUBA divers (Bradley et al., 2017c), which could bias catch probability [reviewed in (Latour, 2004)]. In this present study there was no evidence that the scent plume from the bait favored the attraction of any particular species or sex (Kohler, 2022). While studies in other locations have shown that the presence of sharks and the threat of predation modifies the behavior of large mesopredatory teleosts around BRUVS [e.g. (Lester et al., 2021)], the presence of (large) sharks near the bait bag and level of activity around the BRUVS might have influenced the likelihood of smaller shark species and individuals approaching the field of view of the cameras. However, in this present study smaller (younger) sharks tend to arrive earlier in the recording (Kohler, 2022), indicating strong attraction to the bait, and did not leave the unit even when larger sharks arrived later in the recording. Therefore, the equal catch probability of age groups was considered to be valid still due to the use of battery backpacks allowing for prolonged deployments times (up to 202.9 min). This ensured sufficient time to record (larger) individuals that might have arrived later in the recording period (Gore et al., 2020), after the elapse of commonly used recording times [e.g. 60 min (Dwyer et al., 2020; Clementi et al., 2021), 90 min (Bond et al., 2012)].
The non-invasive approach employed in this study is particularly beneficial when assessing species that are at relatively low abundances, such as reef sharks in this study, since this would make re-capture less likely. In addition, capture methods that require physical capture can also increase the risk of unintentional death during capture or post release (Brooks et al., 2012; Bouyoucos et al., 2019; Matias Braccini and Waltrick, 2019; Raoult et al., 2019). However, it is of note that despite these efforts to limit bias in this study, the heterogeneity of survival and capture probabilities is likely to exist to some degree, as in most mark-recapture studies (Pollock et al., 1990). For example, young sharks are very vulnerable in their early life stages and therefore equal survival probability might be violated when pooling encounter histories of individuals with various life stages (Sosa-Nishizaki et al., 2012). In this study, it was not feasible to account for different demographics in the closed- and open-population model because of the small numbers of re-sighting (Caribbean reef shark: 2 - 4, nurse shark: 3 - 17) at each sample occasion. However, since a variety of habitat was sampled and the period between sampling occasions was adequate for the dispersion of ‘marked’ individuals (Seber, 1986), it is reasonable to assume that this study provided a reliable estimate of reef shark populations.
Since photo-ID relies on the presence and longevity of distinctive markings (Marshall and Pierce, 2012; Sosa-Nishizaki et al., 2012), the use of multiple markings on the entire body together with conventional tags in this present study achieved ‘double tagging’ [reviewed in (Marshall and Pierce, 2012)]; thus, increasing the certainty of individual identification. Additionally, any changes of individual markings (e.g. additional markings, modification of current markings) over time were documented throughout the study period. The use of natural marks was found to be beneficial for individual identification and re-sighting rates, consistent with other studies (Castro and Rosa, 2005; Meekan et al., 2006; Domeier and Nasby-Lucas, 2007; Dudgeon et al., 2008; Marshall and Pierce, 2012; Gore et al., 2016). During their visit to a BRUVS individuals are usually recorded by cameras from many different angles, providing high-quality imagery of individual markings allowing for individual identification, in particular of individuals or species that naturally have multiple markings.
Although the longevity of markings was not systematically assessed in this study, individual Caribbean reef and nurse sharks recorded on BRUVS were re-sighted up to 29 months (2 years and 5 months) and 45 months (3 years and 9 month), respectively, from the point of initial identification respectively. This indicates that markings were relatively stable and it was concluded that the marks did not disappear over the four-year period, consistent with previous reports showing that scars and skin pattern of individual sharks were visible across multiple years and even decades (Anderson and Goldman, 1996; Meekan et al., 2006; Bansemer and Bennett, 2008; Gore et al., 2016). In this study, the proportion of nurse sharks with distinctive marks (82%) was higher than the 55% reported in Brazil (Castro and Rosa, 2005) and the re-sighting rates in this study (26% for Caribbean reef and 36% for nurse sharks) were comparable with those of whale sharks [22 - 44% (Meekan et al., 2006; Rowat et al., 2009; McKinney et al., 2017)] and spotted raggedtooth shark (Carcharias taurus) [44% (Van Tienhoven et al., 2007)] but much higher than that of basking sharks [0.06% (Gore et al., 2016)]. The successful identification of a large proportion of all individuals that were recorded on BRUVS in this present study was likely due to the high-quality of the photographs and the meticulous documentation of multiple markings on the entire body.
The super-population sizes for Caribbean reef shark (180 ± 37 SE) and nurse shark (336 ± 61 SE) are the numbers of individuals that might enter each population over the study period and each value was greater than the estimate for each species based on the closed-population model. This seems reasonable considering the different underlying assumptions of each population model. The closed population model assumes that any immigration or emigration is negligible between two consecutive sampling occasions. Although the duration of each sampling occasion and the time intervals between sampling occasion were relatively short compared to the reported lifespan of Caribbean reef [15 years (Tavares, 2009)] and nurse sharks [35 years (Carrier and Luer, 1990)]; and sampling was conducted in spring and autumn, excluding the summer months when sharks are more mobile and pupping occurs (Kohler, 2022), demographic and geographic closure was most likely violated in closed-population models in this study. Therefore abundance estimates should be treated with caution (Meekan et al., 2006; Gore et al., 2016), as the violation of any assumptions may affect the accuracy resulting in an over- or underestimation of the populations size by the model (Krebs, 1999).
Small numbers of re-sighting (<10) can lower the power of closed-population models compared to that with larger sample sizes. To account for the relatively small numbers of re-sighting per sampling occasion in this study, the Chapman derivative (1951) was used. Previous studies have demonstrated a) the robustness of this approach (Eberhardt, 1990; Cliff et al., 1996; White and Shenk, 2001; Castro and Rosa, 2005; Chao et al., 2008) and b) the mean across sampling occasions is a reliable estimate of population sizes for a particular study period (Cliff et al., 1996). The use of Seber’s estimate of variance (Seber, 1982) in this study accounts for small sample sizes providing a suitable measure for the degree to which each estimate differs from the mean. The resulting 95% CI suggests that the true population size of each species is within a relatively small range, indicating a reasonable accuracy of the Chapman estimator.
The assumption of demographic and geographic closure is relaxed in open-population models, such as the Jolly-Seber (JS) model, which allows for multiple sampling occasions with the possibility of an increase (through recruitment or immigration) or decrease (through mortality or emigration) in population numbers (Schwarz and Seber, 1999). This model is powerful as long as the sample area and effort is constant, and the time of each sampling occasion is relatively short in relation to the intervals between sampling occasions (Jolly, 1965; Seber, 1965; Arnason and Schwarz, 1995) as is in this study. The POPAN function in the program MARK is a widely used tool for estimates of open populations (Meekan et al., 2006; Davies et al., 2012; Gore et al., 2016; McCoy et al., 2018) and was used in this study because it allows for any numbers of sampling occasions that can extend over many years and variable (rather than constant) time intervals between sampling occasions (Schwarz and Arnason, 2009).
Testing the fit of the data via the program RELEASE prior to the selection of the model with the ‘best fit’ (i.e. lowest AICc) is a standard approach (Schwarz and Arnason, 2009). While TEST 2 (equal capture probability) and TEST 3 (equal survival probability) suggest that model assumptions were met by the data, there was a slight under dispersion ( = 0.83) most likely due to the low numbers of individuals and re-sightings of each species (Cooch and White, 2009). To account for this, the value of the variance inflation factor (ĉ) was set to 1 (Cooch and White, 2009). It is also worth noting that the logit link was used instead of the default sin link, to avoid convergence as the logit link performs better than the sin link, when the design matrix is modified to account for differences in time intervals between sampling occasions as in this study.
The final model was selected via the Akaike's Information Criterion (AICc) rather than Likelihood Ratio Test (LRT) as this is a straight forward, standard approach (Meekan et al., 2006; Cooch and White, 2009; Gore et al., 2016). While the ‘best fit’ model is always the model with the most parameters because it has the lowest deviance, the trade-off is that the uncertainty of the model increases with the number of parameters. The AICc quantifies this trade-off between precision and fit of the model to the data. The AICc decreases as the model likelihood (fit of the model) increases for constant numbers of parameters or stays constant while number of parameters decreases. For Caribbean reef shark and nurse sharks the Φ tp. βt model and Φ. pt βt model were selected, respectively, because these had the lowest AICc indicating that each best explains the variation in the data (best fit) while using fewest parameters (least amount of uncertainty).
It is encouraging that the values of the lower 95% CI (Caribbean reef shark = 127; nurse shark = 248) from the open-population model were consistent with the respective population sizes of each species from the closed-population model. As the assumption of demographic and geographic closure was likely violated in this study, it seems intuitive to consider the open-population model as more accurate than the closed-population model. However, considering the estimates from both population models, the results indicate that between 128 and 180 Caribbean reef sharks and between 249 and 336 nurse sharks used the coastal shelf of Grand Cayman and Little Cayman at some point during the four-year study period.
The relatively small home ranges (< 20 km) of Caribbean reef and nurse shark observed in this study is consistent with previous reports of both species from other regions (Bond et al., 2012; Dwyer et al., 2020). Home range sizes of reef sharks can vary from species to species but are typically relatively small, with an MLD between 5 and 20 km (Murchie et al., 2010; Whitney et al., 2012; Espinoza et al., 2014; Carlisle et al., 2019; Bouyoucos et al., 2020). The size of home ranges can be influenced by different energy requirements governed by swimming behavior [active versus sedentary; (Carlson et al., 2004)], and site-fidelity in relation to productive foraging areas (Garla et al., 2006a)]. In this present study, some individuals were seen in the same area across multiple sampling occasions, indicating that a degree of fidelity to certain areas exists. Site-fidelity and home ranging behavior rather than moving throughout a coral reef habitat is well documented in Caribbean reef and nurse sharks elsewhere (Garla et al., 2006b; Bond et al., 2012; Garla et al., 2017; Dwyer et al., 2020).
Comparisons of home ranges are difficult because the literature on linear home ranges of Caribbean reef and nurse sharks are rare. Compared to the activity space of both species, the observed linear home ranges of Caribbean reef shark (21.18 km) and of nurse sharks (17.76 km) seem to be larger than that of Caribbean reef sharks in the US Virgin Islands (USVI) [5.5 km2 (Pickard et al., 2016)] and that of nurse sharks in Brazil [1.84 km2 (Garla et al., 2017)]. The differences in home range size might be due to the study design using different metrics (activity space in km2 and linear home range in km), different sampling methods, and study periods.
The larger home ranges observed in this study compared to those reported from USVI and Brazil, could be a result from pooling the data across demographics. The sample sizes of both of these studies were relatively small (USVI: n = 6; Brazil: n = 10) and numbers of immature and mature sharks were not reported. Acoustic telemetry showed that larger individuals move greater distances than smaller Caribbean reef sharks in Cayman (Kohler, 2022). Ontogenetic expansion of home range size has also been reported in Caribbean reef sharks from Belize which is thought to be due to the higher energy requirements of larger sharks compared to that of smaller individuals (Papastamatiou et al., 2009; Grubbs, 2010; Speed et al., 2010). The larger home ranges in this study might be likely due to a combination of competition, resource availability and sampling.
Some individuals of both species were recorded at locations that are more than 100 km apart, indicating that both species move along larger sections of the coastal shelf than their typical home range (Supplementary Material). Some of these long-distance movements required swimming across deep (>2,000 m), open water between Grand Cayman and Little Cayman, consistent with previous reports of reef shark behavior from Belize [Caribbean reef shark: maximum distance recorded 50 km across open ocean (Chapman et al., 2005)], from the Dutch Caribbean/USVI [e.g. nurse shark: 160 km across open ocean (Winter and de Graaf, 2019)], and Florida [nurse shark: maximum distance recorded: 541 km (Kohler and Turner, 2001)].
Although nurse sharks are thought to be rather sedentary and non-dispersive (Carrier, 1991; Kohler et al., 1998), a recent study also found that the wide-ranging behavior of nurse sharks to be more frequent than that of Caribbean reef sharks (Dwyer et al., 2020). More nurse sharks in the present study were observed to move longer distances (n = 4, maximum distance: 156.07 km) than Caribbean reef sharks (n = 2, maximum distance: 125.7 km). Further, it is possible that this trend was influenced by the different number of clear markings present between species. While a larger proportion of recorded nurse sharks showed numerous clearly distinguishable markings, it was more difficult to distinguish individual Caribbean reef sharks which had fewer of these markings. As the presence of markings affects the re-sighting probability, the use of natural markings for photo-ID might be only feasible for the study of some reef shark species such as nurse sharks and might be less suitable for others such as Caribbean reef sharks.
As matching re-sightings can be time intensive, analysis time might be reduced by using computer-assisted software for the photographic mark-recapture (Bolger et al., 2012; González-Ramos et al., 2017; Keeping et al., 2020) and more sophisticated, automated face-recognition software [e.g. BearID (Clapham et al., 2020)]. The use of 360-degree cameras might aid the detection of individuals in locations with very high shark abundances as well as the ability to include factors such as sex and size as these cameras can have much higher rates of sightings of sharks than the limited field of view of GoPros (Kilfoil et al., 2017). Such camera equipment and software are costly, but the use of these tools for future surveys should be carefully considered.
Nevertheless, the wide-ranging nature of Caribbean reef and nurse sharks revealed in this study indicates that these species occasionally move far beyond their typical home range. Although sharks are protected and receive additional protection from the extensive network of MPAs in the Cayman Islands, this study indicates that home ranges and long-distance movements of individual sharks extend to areas outside the protected zones and may be exposed to impacts of fishing activities. Wider ranging species such as nurse sharks might require larger MPAs, as was recently also suggested by Dwyer et al. (2020). This emphasises the benefit of using multiple conservation measures, as is the case in the Cayman Islands, to achieve effective protection for local shark species [as also recommended by others (Espinoza et al., 2015; Garla et al., 2017)].
Data availability statement
The original contributions presented in the study are included in the article/Supplementary Material. Further inquiries can be directed to the corresponding author.
Ethics statement
The animal study was approved by the National Conservation Council of the Cayman Islands. The study was conducted in accordance with the local legislation and institutional requirements.
Author contributions
JK, MG, RO and TA conceived the study. JK and MG performed fieldwork/data collection. JK and MG analyzed the data. JK interpreted the data and led the writing of the manuscript. All authors contributed to the article and approved the submitted version.
Funding
This work was supported by a grant from the Department of Environment Food and Rural Affairs (DEFRA) of the UK Government under its Darwin Plus Program (Grant no. DPLUS036). This study also received funding from Cayman Islands Brewery Ltd. as part of their conservation beer initiative, a small proportion of the income from the sale of their “Whitetip” beer being donated to the Cayman Islands Department of the Environment’s shark research. The funders were not involved in the study design, collection, analysis, interpretation of data, the writing of this article or the decision to submit it for publication.
Acknowledgments
We especially thank Gina Ebanks-Petrie, DoE Director for her support of this study, Jeremy Olynik for assistance with ArcGIS maps, and Vaughn Bodden for advice with mark-recapture analysis. We also thank Catriona Millar, Pete Davis, Helena Delgado Nordmann, Kat Mason, Carrie Duchak, Marique Cloete, Graham Ryan, Steff Mcdermot, and April Miller for assistance in the field with BRUVS deployments as well as Megan Ehman and Anne Veeder for assistance with video analyses. We thank the Cayman Islands Brewery Ltd. for their continued long-standing support of our shark research and conservation efforts in the Cayman Islands.
Conflict of interest
The authors declare that the research was conducted in the absence of any commercial or financial relationships that could be construed as a potential conflict of interest.
Publisher’s note
All claims expressed in this article are solely those of the authors and do not necessarily represent those of their affiliated organizations, or those of the publisher, the editors and the reviewers. Any product that may be evaluated in this article, or claim that may be made by its manufacturer, is not guaranteed or endorsed by the publisher.
Supplementary material
The Supplementary Material for this article can be found online at: https://www.frontiersin.org/articles/10.3389/fmars.2023.1230896/full#supplementary-material
Footnotes
- ^ LHS, left-hand side; RHS, right-hand side.
References
Anderson S. D., Goldman K. J. (1996). Photographic evidence of white shark movements in California waters. Calif. Fish Game 82, 182–186.
Andrzejaczek S., Meeuwig J., Rowat D., Pierce S., Davies T., Fisher R., et al. (2016). The ecological connectivity of whale shark aggregations in the Indian Ocean: a photo-identification approach. R. Soc Open Sci. 3, 160455. doi: 10.1098/rsos.160455
Araujo G., Snow S., So C. L., Labaja J., Murray R., Colucci A., et al. (2017). Population structure, residency patterns and movements of whale sharks in Southern Leyte, Philippines: results from dedicated photo-ID and citizen science. Aquat. Conserv. Mar. Freshw. Ecosyst. 27, 237–252. doi: 10.1002/aqc.2636
Arnason A. N., Schwarz C. J. (1995). POPAN-4: Enhancements to a system for the analysis of mark—recapture data from open populations. J. Appl. Stat. 22, 785–800. doi: 10.1080/02664769524621
Bakker J., Wangensteen O. S., Chapman D. D., Boussarie G., Buddo D., Guttridge T. L., et al. (2017). Environmental DNA reveals tropical shark diversity in contrasting levels of anthropogenic impact. Sci. Rep. 7, 16886. doi: 10.1038/s41598-017-17150-2
Bansemer C. S., Bennett M. B. (2008). Multi-year validation of photographic identification of grey nurse sharks, Carcharias taurus, and applications for non-invasive conservation research. Mar. Freshw. Res. 59, 322–331. doi: 10.1071/MF07184
Barnes C. J., Butcher P. A., Macbeth W. G., Mandelman J. W., Smith S. D. A., Peddemors V. M. (2016). Movements and mortality of two commercially exploited carcharhinid sharks following longline capture and release off eastern Australia. Endanger. Species Res. 30, 193–208. doi: 10.3354/esr00730
Bascompte J., Melian C. J., Sala E. (2005). Interaction strength combinations and the overfishing of a marine food web. Proc. Natl. Acad. Sci. U. S. A. 102, 5443–5447. doi: 10.1073/pnas.0501562102
Baum J. K., Myers R. A., Kehler D. G., Worm B., Harley S. J., Doherty P. A. (2003). Collapse and conservation of shark populations in the Northwest Atlantic. Science 299, 389–392. doi: 10.1126/science.1079777
Bernard A. M., Horn R. L., Chapman D. D., Feldheim K. A., Garla R. C., Brooks E. J., et al. (2017). Genetic connectivity of a coral reef ecosystem predator: the population genetic structure and evolutionary history of the Caribbean reef shark (Carcharhinus perezi). J. Biogeogr. 44, 2488–2500. doi: 10.1111/jbi.13062
Birkmanis C. A., Partridge J. C., Simmons L. W., Heupel M. R., Sequeira A. M. M. (2020). Shark conservation hindered by lack of habitat protection. Glob. Ecol. Conserv. 21, e00862. doi: 10.1016/j.gecco.2019.e00862
Bolger D. T., Morrison T. A., Vance B., Lee D., Farid H. (2012). A computer-assisted system for photographic mark-recapture analysis. Methods Ecol. Evol. 3, 813–822. doi: 10.1111/j.2041-210X.2012.00212.x
Bond M. E., Babcock E. A., Pikitch E. K., Abercrombie D. L., Lamb N. F., Chapman D. D., et al. (2012). Reef sharks exhibit site-fidelity and higher relative abundance in marine reserves on the Mesoamerican Barrier Reef. PloS One 7, e32983. doi: 10.1371/journal.pone.0032983
Bond M. E., Valentin-Albanese J., Babcock E. A., Abercrombie D., Lamb N. F., Miranda A., et al. (2017). Abundance and size structure of a reef shark population within a marine reserve has remained stable for more than a decade. Mar. Ecol. Prog. Ser. 576, 1–10. doi: 10.3354/meps12241
Bouyoucos I. A., Romain M., Azoulai L., Eustache K., Mourier J., Rummer J. L., et al. (2020). Home range of newborn blacktip reef sharks (Carcharhinus melanopterus), as estimated using mark-recapture and acoustic telemetry. Coral Reefs 39, 1209–1214. doi: 10.1007/s00338-020-01965-z
Bouyoucos I. A., Simpfendorfer C. A., Rummer J. L. (2019). Estimating oxygen uptake rates to understand stress in sharks and rays. Rev. Fish Biol. Fish. 29, 297–311. doi: 10.1007/s11160-019-09553-3
Bradley D., Conklin E., Papastamatiou Y. P., McCauley D. J., Pollock K., Kendall B. E., et al. (2017a). Growth and life history variability of the grey reef shark (Carcharhinus amblyrhynchos) across its range. PloS One 12, e0172370. doi: 10.1371/journal.pone.0172370
Bradley D., Conklin E., Papastamatiou Y. P., McCauley D. J., Pollock K., Pollock A., et al. (2017b). Resetting predator baselines in coral reef ecosystems. Sci. Rep. 7, 43131. doi: 10.1038/srep43131
Bradley D., Papastamatiou Y. P., Caselle J. E. (2017c). No persistent behavioural effects of SCUBA diving on reef sharks. Mar. Ecol. Prog. Ser. 567, 173–184. doi: 10.3354/meps12053
Bradshaw C. J. A., Mollet H. F., Meekan M. G. (2007). Inferring population trends for the world’s largest fish from mark-recapture estimates of survival. J. Anim. Ecol. 76, 480–489. doi: 10.1111/j.1365-2656.2006.01201.x
Brooks E. J., Mandelman J. W., Sloman K. A., Liss S., Danylchuk A. J., Cooke S. J., et al. (2012). The physiological response of the Caribbean reef shark (Carcharhinus perezi) to longline capture. Comp. Biochem. Physiol. - A Mol. Integr. Physiol. 162, 94–100. doi: 10.1016/j.cbpa.2011.04.012
Brooks E. J., Sloman K. A., Sims D. W., Danylchuk A. J. (2011). Validating the use of baited remote underwater video surveys for assessing the diversity, distribution and abundance of sharks in the Bahamas. Endanger. Species Res. 13, 231–243. doi: 10.3354/esr00331
Bruns S., Henderson A. C. (2020). A baited remote underwater video system (BRUVS) assessment of elasmobranch diversity and abundance on the eastern Caicos Bank (Turks and Caicos Islands); an environment in transition. Environ. Biol. Fishes. 103, 1001–1012. doi: 10.1007/s10641-020-01004-4
Burgess G. H., Smith S. H., Lane E. D. (1994). “Fishes of the Cayman Islands,” in The Cayman Islands: Natural History and Biogeography. Eds. Brunt M. A., Davies J. E. (Netherlands: Kluwer Academic Publishers), 199–228.
Burnham K., Anderson D. (2002). Model selection and multimodal inference: a practical information-theoretic approach (New York: Springer-Verlag).
Burnham K., Anderson D., White G., Brownie C., Pollock K. (1987). “Design and analysis methods for fish survival experiments based on release-capture,” in American Fisheries Society Monograph 5. (Bethesda, MD, United States: American Fisheries Society).
Cappo M., Speare P., De’Ath G. (2004). Comparison of baited remote underwater video stations (BRUVS) and prawn (shrimp) trawls for assessments of fish biodiversity in inter-reefal areas of the Great Barrier Reef Marine Park. J. Exp. Mar. Bio. Ecol. 302, 123–152. doi: 10.1016/j.jembe.2003.10.006
Carlisle A. B., Tickler D., Dale J. J., Ferretti F., Curnick D. J., Chapple T. K., et al. (2019). Estimating space use of mobile fishes in a large marine protected area with methodological considerations in acoustic array design. Front. Mar. Sci. 6. doi: 10.3389/fmars.2019.00256
Carlson J. K., Goldman K. J., Lowe C. G. (2004). “‘Metabolism, energetic demand, and endothermy’,” in Biology of Sharks and Their Relatives. Eds. Carrier J. C., Musick J., Heithaus M. R. (Boca Raton, FL, United States: CRC Press), 203–224.
Carlson a J., Charvet P., Blanco-Parra M., Briones Bell-lloch A., Cardenosa D., Derrick D., et al. (2021). Carcharhinus perezi. IUCN Red List Threat Species 2021, e.T60217A3093780. doi: 10.2305/IUCN.UK.2021-1.RLTS.T60217A3093780.en
Carrier J. C. (1991). “Age and growth: life history studies of the nurse shark,” in Discovering Sharks. Ed. Gruber S. H. (New Jersey: American Littoral Society), 68–70.
Carrier J. C., Luer C. A. (1990). Growth rates in the nurse shark, ginglymostoma cirratum. Copeia 1990, 686–692. doi: 10.2307/1446435
Carrier J. C., Pratt H. L. (1998). Habitat management and closure of a nurse shark breeding and nursery ground. Fish. Res. 39, 209–213. doi: 10.1016/S0165-7836(98)00184-2
Casselberry G. A., Danylchuk A. J., Finn J. T., DeAngelis B. M., Jordaan A., Pollock C. G., et al. (2020). Network analysis reveals multispecies spatial associations in the shark community of a Caribbean marine protected area. Mar. Ecol. Prog. Ser. 633, 105–126. doi: 10.3354/meps13158
Castro A. L. F., Rosa R. S. (2005). Use of natural marks on population estimates of the nurse shark, Ginglymostoma cirratum, at Atol das Rocas Biological Reserve, Brazil. Environ. Biol. Fishes 72, 213–221. doi: 10.1007/s10641-004-1479-7
Castro J. I. (2000). The biology of the nurse shark, Ginglymostoma cirratum, off the Florida East Coast and the Bahama Islands. Environ. Biol. Fishes 58, 1–22. doi: 10.1023/A:1007698017645
Chao A., Pan H. Y., Chiang S. C. (2008). The Petersen - Lincoln estimator and its extension to estimate the size of a shared population. Biometrical J. 50, 957–970. doi: 10.1002/bimj.200810482
Chapman D. G. (1951). Some Properties of the Hypergeometric Distribution With Applications to Zoological Censuses (Berkeley: University of California Press).
Chapman D. D., Pikitch E. K., Babcock E., Shivji M. S. (2005). Marine reserve design and evaluation using automated acoustic telemetry: A case-study involving coral reef-associated sharks in the Mesoamerican Caribbean. Mar. Technol. Soc J. 39, 42–55. doi: 10.4031/002533205787521640
Chopin F. S., Arimoto T. (1995). The condition of fish escaping from fishing gears-a review. Fish. Res. 21, 315–327. doi: 10.1016/0165-7836(94)00301-C
Clapham M., Miller E., Nguyen M., Darimont C. T. (2020). Automated facial recognition for wildlife that lack unique markings: A deep learning approach for brown bears. Ecol. Evol. 10, 12883–12892. doi: 10.1002/ece3.6840
Clarke C., Lea J., Ormond R. (2012). “Comparative abundance of reef sharks in the Western Indian Ocean,” in Proceedings of the 12th International Coral Reef Symposium, Cairns, Australia, 9–13. Available at: http://www.icrs2012.com/proceedings/manuscripts/ICRS2012_13D_1.pdf.
Clementi G. M., Babcock E. A., Valentin-albanese J., Bond M. E., Flowers K. I., Heithaus M. R., et al. (2021). Anthropogenic pressures on reef-associated sharks in jurisdictions with and without directed shark fishing. Mar. Ecol. Prog. Ser. 661, 175–186. doi: 10.3354/meps13607
Cliff G., van der Elst R. P., Govender A., Witthuhn T. K., Bullen E. M. (1996). “First estimates of mortality and population size of white sharks on the South African coast,” in Great White Sharks: The Biology of Carcharodon carcharias. Eds. Klimley A. P., Ainley D. G. (San Diego: Academic Press), 393–400. doi: 10.1017/CBO9781107415324.004
Compagno L., Dando M., Fowler S. (2005). Sharks of the World. 1st ed (Princeton, NJ, United States: Princeton University Press).
Cooch E., White G. (2009) Program MARK: a gentle introduction. Available at: http://www.phidot.org/software/mark/docs/book.
Cortes E. (1999). Standardized diet compositions and trophic levels of sharks. ICES J. Mar. Sci. 56, 707–717. doi: 10.1006/jmsc.1999.0489
Cubero-Pardo P., Herrón P., González-Pérez F. (2011). Shark reactions to scuba divers in two marine protected areas of the Eastern Tropical Pacific. Aquat. Conserv. Mar. Freshw. Ecosyst. 21, 239–246. doi: 10.1002/aqc.1189
Daly R., Smale M. J., Singh S., Anders D., Shivji M., Daly C. A. K., et al. (2018). Refuges and risks: Evaluating the benefits of an expanded MPA network for mobile apex predators. Divers. Distrib. 24, 1217–1230. doi: 10.1111/ddi.12758
Davies T. K., Stevens G., Meekan M. G., Struve J., Rowcliffe J. M. (2012). Can citizen science monitor whale-shark aggregations? Investigating bias in mark-recapture modelling using identification photographs sourced from the public. Wildl. Res. 39, 696–704. doi: 10.1071/WR12092
Dillon E. M., Lafferty K. D., McCauley D. J., Bradley D., Norris R. D., Caselle J. E., et al. (2020). Dermal denticle assemblages in coral reef sediments correlate with conventional shark surveys. Methods Ecol Evol. 11, 362–375. doi: 10.1111/2041-210X.13346
Domeier M. L., Nasby-Lucas N. (2007). Annual re-sightings of photographically identified white sharks (Carcharodon carcharias) at an eastern Pacific aggregation site (Guadalupe Island, Mexico). Mar. Biol. 150, 977–984. doi: 10.1007/s00227-006-0380-7
Dudgeon C. L., Noad M. J., Lanyon J. M. (2008). Abundance and demography of a seasonal aggregation of zebra sharks Stegostoma fasciatum. Mar. Ecol. Prog. Ser. 368, 269–281. doi: 10.3354/meps07581
Dulvy N. K., Fowler S. L., Musick J. A., Cavanagh R. D., Kyne P. M., Harrison L. R., et al. (2014). Extinction risk and conservation of the world’s sharks and rays. Elife 3, 1–35. doi: 10.7554/elife.00590
Dwyer R. G., Krueck N. C., Udyawer V., Heupel M. R., Chapman D., Pratt H. L. J., et al. (2020). Individual and population benefits of marine reserves for reef sharks. Curr. Biol. 30, 480–489.e5. doi: 10.1016/j.cub.2019.12.005
Eberhardt L. (1990). Using radio-telemetry for mark-recapture studies with edge effects. J. Appl. Ecol. 27, 259–271. doi: 10.2307/2403583
Ellis J. R., McCully Phillips S. R., Poisson F. (2017). A review of capture and post-release mortality of elasmobranchs. J. Fish Biol. 90, 653–722. doi: 10.1111/jfb.13197
Espinoza M., Heupel M. R., Tobin A. J., Simpfendorfer C. A. (2014). Residency patterns and movements of grey reef sharks (Carcharhinus amblyrhynchos) in semi-isolated coral reef habitats. Mar. Biol. 162, 343–358. doi: 10.1007/s00227-014-2572-x
Espinoza M., Heupel M. R., Tobin A. J., Simpfendorfer C. A. (2015). Movement patterns of silvertip sharks (Carcharhinus albimarginatus) on coral reefs. Coral Reefs 34, 807–821. doi: 10.1007/s00338-015-1312-0
Fanovich L., Cook N. D., Mohammed R. S., Wothke A. (2017). Citizen-based observations on shark and mobulid species in tobago, West Indies. Living World J. Trinidad Tobago F. Nat. Club 2017, 26–31.
Feldheim K. A., Gruber S. H., Ashley M. V. (2002). The breeding biology of lemon sharks at a tropical nursery lagoon. Proc. R. Soc B Biol. Sci. 269, 1655–1661. doi: 10.1098/rspb.2002.2051
Feldheim K. A., Gruber S. H., Dibattista J. D., Babcock E. A., Kessel S. T., Hendry A. P., et al. (2014). Two decades of genetic profiling yields first evidence of natal philopatry and long-term fidelity to parturition sites in sharks. Mol. Ecol. 23, 110–117. doi: 10.1111/mec.12583
Ferretti F., Worm B., Britten G. L., Heithaus M. R., Lotze H. K. (2010). Patterns and ecosystem consequences of shark declines in the ocean. Ecol. Lett. 13, 1055–1071. doi: 10.1111/j.1461-0248.2010.01489.x
Gallagher A. J., Hammerschlag N., Danylchuk A. J., Cooke S. J. (2017). Shark recreational fisheries: Status, challenges, and research needs. Ambio 46, 385–398. doi: 10.1007/s13280-016-0856-8
Gallagher A. J., Serafy J. E., Cooke S. J., Hammerschlag N. (2014). Physiological stress response, reflex impairment, and survival of five sympatric shark species following experimental capture and release. Mar. Ecol. Prog. Ser. 496, 207–218. doi: 10.3354/meps10490
Garla R. C., Chapman D. D., Shivji M. S., Wetherbee B. M., Amorim A. F. (2006a). Habitat of juvenile Caribbean reef sharks, Carcharhinus perezi, at two oceanic insular marine protected areas in the southwestern Atlantic Ocean: Fernando de Noronha Archipelago and Atol das Rocas, Brazil. Fish. Res. 81, 236–241. doi: 10.1016/j.fishres.2006.07.003
Garla R. C., Chapman D. D., Wetherbee B. M., Shivji M. (2006b). Movement patterns of young Caribbean reef sharks, Carcharhinus perezi, at Fernando de Noronha Archipelago, Brazil: the potential of marine protected areas for conservation of a nursery ground. Mar. Biol. 149, 189–199. doi: 10.1007/s00227-005-0201-4
Garla R. C., Gadig O. B. F., Garrone-Neto D. (2017). Movement and activity patterns of the nurse shark, Ginglymostoma cirratum, in an oceanic Marine Protected Area of the South-western Atlantic. J. Mar. Biol. Assoc. United Kingdom 97, 1565–1572. doi: 10.1017/S0025315416001028
González-Ramos M. S., Santos-Moreno A., Rosas-Alquicira E. F., Fuentes-Mascorro G. (2017). Validation of photo-identification as a mark–recapture method in the spotted eagle ray Aetobatus narinari. J. Fish Biol. 90, 1021–1030. doi: 10.1111/jfb.13215
Gore M. A., Frey P. H., Ormond R. F., Allan H., Gilkes G. (2016). Use of photo-identification and mark-recapture methodology to assess basking shark (Cetorhinus maximus) populations. PloS One 11, e0150160. doi: 10.1371/journal.pone.0150160
Gore M., Ormond R., Clarke C., Kohler J., Millar C., Brooks E. (2020). Application of photo-identification and lengthened deployment periods to Baited Remote Underwater Video Stations (BRUVS) abundance estimates of coral reef sharks. Oceans 1, 274–299. doi: 10.3390/oceans1040019
Graham R. T., Roberts C. M. (2007). Assessing the size, growth rate and structure of a seasonal population of whale sharks (Rhincodon typus Smith 1828) using conventional tagging and photo identification. Fish. Res. 84, 71–80. doi: 10.1016/j.fishres.2006.11.026
Graham N. A. J., Spalding M. D., Sheppard C. R. C. (2010). Reef shark declines in remote atolls highlight the need for multi-faceted conservation action. Aquat. Conserv. Mar. Freshw. Ecosyst. 20, 543–548. doi: 10.1002/aqc.1116
Grubbs R. D. (2010). “Ontogenetic shifts in movements and habitat use,” in their relatives II: Biodiversity, adaptive physiology, and conservation. Eds. Carrier J., Musick J., Heithaus M. (Boca Raton, FL: CRC Press), 319–350. doi: 10.1201/9781420080483-c7
Gubili C., Johnson R., Gennari E., Oosthuizen W. H., Kotze D., Meÿer M., et al. (2009). Concordance of genetic and fin photo identification in the great white shark, Carcharodon carcharias, off Mossel Bay, South Africa. Mar. Biol. 156, 2199–2207. doi: 10.1007/s00227-009-1233-y
Guzman H. M., Cipriani R., Vega A. J., Morales-Saldaña J. M. (2020). Fisheries and conservation assessment of sharks in Pacific Panama. Aquat. Conserv. Mar. Freshw. Ecosyst. 30, 315–330. doi: 10.1002/aqc.3245
Hagihara R., Jones R. E., Sobtzick S., Cleguer C., Garrigue C., Marsh H. (2018). Compensating for geographic variation in detection probability with water depth improves abundance estimates of coastal marine megafauna. PloS One 13, e0191476. doi: 10.1371/journal.pone.0191476
Harvey E., Fletcher D., Shortis M. (2002). Estimation of reef fish length by divers and by stereo-video A first comparison of the accuracy and precision in the field on living fish under operational conditions. Fish. Res. 57, 255–265. doi: 10.1016/s0165-7836(01)00356-3
Harvey E. S. E., Mclean D. L., Frusher S. D., Haywood M. D. E., Newman S. J. S., Williams A. (2013). The use of BRUVs as a tool for assessing marine fisheries and ecosystems: a review of the hurdles and potential. Univ. West. Aust. FRDC Rep. Proj. No. 2010/002. 42, 1–44.
Harvey E., Shortis M., Stadler M., Cappo M. (2009). A comparison of the accuracy and precision of measurements from single and stereo-video systems. Mar. Technol. Soc J. 36, 38–49. doi: 10.4031/002533202787914106
Heupel M. R., Knip D. M., Simpfendorfer C. A., Dulvy N. K. (2014). Sizing up the ecological role of sharks as predators. Mar. Ecol. Prog. Ser. 495, 291–298. doi: 10.3354/meps10597
Heupel M. R., Williams A. J., Welch D. J., Ballagh A., Mapstone B. D., Carlos G., et al. (2009). Effects of fishing on tropical reef associated shark populations on the Great Barrier Reef. Fish. Res. 95, 350–361. doi: 10.1016/j.fishres.2008.10.005
Jennings D. E., Gruber S. H., Franks B. R., Kessel S. T., Robertson A. L. (2008). Effects of large-scale anthropogenic development on juvenile lemon shark (Negaprion brevirostris) populations of Bimini, Bahamas. Environ. Biol. Fishes 83, 369–377. doi: 10.1007/s10641-008-9357-3
Jolly G. (1965). Explicit estimates from capture-recapture data with both death and immigration-stochastic model. Biometrika Trust 52, 225–247. doi: 10.1093/biomet/52.1-2.225
Karl S. A., Castro A. L. F., Garla R. C. (2012). Population genetics of the nurse shark (Ginglymostoma cirratum) in the western Atlantic. Mar. Biol. 159, 489–498. doi: 10.1007/s00227-011-1828-y
Keeping J. A., Reeve-Arnold K. E., Burns N. M., Catarina N., Bailey D. M., McNeill D. C. (2020). Computer-aided photo-identification of a rare stingray, Megatrygon microps. J. Fish Biol. 96, 815–819. doi: 10.1111/jfb.14242
Kilfoil J. P., Wirsing A. J., Campbell M. D., Kiszka J. J., Gastrich K. R., Heithaus M. R., et al. (2017). Baited Remote Underwater Video surveys undercount sharks at high densities: insights from full-spherical camera technologies. Mar. Ecol. Prog. Ser. 585, 113–121. doi: 10.3354/meps12395
Kohler J. (2022). The comparative abundance and behaviour of sharks in the Cayman Islands (BWI) (Edinburgh, Scotland: Heriot-Watt University). Available at: http://hdl.handle.net/10399/4769. PhD Thesis.
Kohler N. E., Casey J. G., Turner P. A. (1998). NMFS cooperative sharkTagging program 1962-93: an atlas of shark tag and recapture data. Mar. Fish. Rev. 60, 1–87.
Kohler N. E., Turner P. A. (2001). Shark tagging: A review of conventional methods and studies. Environ. Biol. Fishes 60, 191–223. doi: 10.1023/A:1007679303082
Koivuniemi M., Kurkilahti M., Niemi M., Auttila M., Kunnasranta M. (2019). A mark – recapture approach for estimating population size of the endangered ringed seal (Phoca hispida saimensis). PloS One 14, e0214269. doi: 10.1371/journal.pone.0214269
Latour R. J. (2004). “Tagging methods and associated data analysis,” in Elasmobranch Fisheries Management Techniques. Eds. Musick J. A., Bonfil R. (Singapore: Asia-Pacific Economic Cooperation (APEC), International Union for the Protection of Nature (IUCN), and the Virginia Institute of Marine Science (VIMS)), 45–61.
Lester E. K., Langlois T. J., Simpson S. D., McCormick M. I., Meekan M. G. (2021). Reef-wide evidence that the presence of sharks modifies behaviors of teleost mesopredators. Ecosphere 12 (2), e03301. doi: 10.1002/ecs2.3301
Lewin W.-C., Arlinghaus R., Mehner T. (2006). Documented and potential biological impacts of recreational fishing: insights for management and conservation. Rev. Fish. Sci. 14, 305–367. doi: 10.1080/10641260600886455
Logan A. (1994). “Reefs and lagoons of Cayman Brac and Little Cayman,” in The Cayman Islands: Natural History and Biogeography. Eds. Brunt M. A., Davies J. E. (Netherlands: Kluwer Academic Publishers), 105–124.
MacNeil M. A., Chapman D. D., Heupel M., Simpfendorfer C. A., Heithaus M., Meekan M., et al. (2020). Global status and conservation potential of reef sharks. Nature 583, 801–806. doi: 10.1038/s41586-020-2519-y
Marshall A. D., Pierce S. J. (2012). The use and abuse of photographic identification in sharks and rays. J. Fish Biol. 80, 1361–1379. doi: 10.1111/j.1095-8649.2012.03244.x
Matias Braccini J., Waltrick D. (2019). Species-specific at-vessel mortality of sharks and rays captured by demersal longlines. Mar. Policy 99, 94–98. doi: 10.1016/j.marpol.2018.10.033
McCoy E., Burce R., David D., Aca E. Q., Hardy J., Labaja J., et al. (2018). Long-term photo-identification reveals the population dynamics and strong site fidelity of adult whale sharks to the coastal waters of Donsol, Philippines. Front. Mar. Sci. 5, 00271. doi: 10.3389/fmars.2018.00271
McCoy C., Dromard C. R., Turner J. R. (2009). An evaluation of grand cayman MPA performance: A comparative study of coral reef fish communities. Proc. 62nd Gulf Caribbean Fisheries Institute 62, 337–345.
McKinney J. A., Hoffmayer E. R., Holmberg J., Graham R. T., Driggers W. B., de la Parra-Venegas R., et al. (2017). Long-term assessment of whale shark population demography and connectivity using photo-identification in the Western Atlantic Ocean. PloS One 12, 1–18. doi: 10.1371/journal.pone.0180495
Meekan M. G., Bradshaw C. J. A., Press M., McLean C., Richards A., Quasnichka S., et al. (2006). Population size and structure of whale sharks Rhincodon typus at Ningaloo Reef, Western Australia. Mar. Ecol. Prog. Ser. 319, 275–285. doi: 10.3354/meps319275
Meier R. E., McCoy C., Richardson L., Turner J. R. (2011). “Quantifying the impact of recreational and artisanal fisheries in the Cayman Islands, through the use of socio-economic questionnaires,” in Darwin Initiative Interim Report (Bangor, Wales: Ocean Sciences, Bangor University), 104.
Mohan J. A., Jones E. R., Hendon J. M., Falterman B., Boswell K. M., Hoffmayer E. R., et al. (2020). Capture stress and post-release mortality of blacktip sharks in recreational charter fisheries of the Gulf of Mexico. Conserv. Physiol. 8, coaa041. doi: 10.1093/conphys/coaa041
Mourier J., Mills S. C., Planes S. (2013). Population structure, spatial distribution and life-history traits of blacktip reef sharks Carcharhinus melanopterus. J. Fish Biol. 82, 979–993. doi: 10.1111/jfb.12039
Murchie K. J., Schwager E., Cooke S. J., Danylchuk A. J., Danylchuk S. E., Goldberg T. L., et al. (2010). Spatial ecology of juvenile lemon sharks (Negaprion brevirostris) in tidal creeks and coastal waters of Eleuthera, The Bahamas. Environ. Biol. Fishes 89, 95–104. doi: 10.1007/s10641-010-9693-y
Ormond R. F. G., Gore M. A. (2005). No-take zones: does ehaviour matter? In: Spedicato M. T., Lembo G., Marmulla G. (eds.). Aquatic telemetry: advances and applications. Proceedings of the Fifth Conference on Fish Telemetry held in Europe. Ustica, Italy, 9-13 June 2003. FAO/COISPA, Rome. pp. 1–89.
Ormond R., Gore M., Bladon A., Dubock O., Kohler J., Millar C. (2017). Protecting Cayman Island sharks: monitoring, movement and motive. Proc. 69th Gulf Caribbean Fisheries Institute (Grand Cayman Cayman Islands) 69, 14–27.
Osgood G. J., McCord M. E., Baum J. K. (2019). Using baited remote underwater videos (BRUVs) to characterize chondrichthyan communities in a global biodiversity hotspot. PloS One 14, e0225859. doi: 10.1371/journal.pone.0225859
Pacoureau N., Rigby C. L., Kyne P. M., Sherley R. B., Winker H., Carlson J. K., et al. (2021). Half a century of global decline in oceanic sharks and rays. Nature 589, 567–571. doi: 10.1038/s41586-020-03173-9
Papastamatiou Y. P., Grubbs R. D., Imhoff J. L., Gulak S. J. B., Carlson J. K., Burgess G. H. (2015). A subtropical embayment serves as essential habitat for sub-adults and adults of the critically endangered smalltooth sawfish. Glob. Ecol. Conserv. 3, 764–775. doi: 10.1016/j.gecco.2015.03.003
Papastamatiou Y. P., Lowe C. G., Caselle J. E., Friedlander A. M. (2009). Scale-dependent effects of habitat on movements and path structure of reef sharks at a predator-dominated atoll. Ecology 90, 996–1008. doi: 10.1890/08-0491.1
Pickard A. E., Vaudo J. J., Wetherbee B. M., Nemeth R. S., Blondeau J. B., Kadison E. A., et al. (2016). Comparative use of a caribbean mesophotic coral ecosystem and association with fish spawning aggregations by three species of shark. PloS One 11, e0151221. doi: 10.1371/journal.pone.0151221
Pikitch E. K., Chapman D. D., Babcock E. A., Shivji M. S. (2005). Habitat use and demographic population structure of elasmobranchs at a Caribbean atoll (Glover’s Reef, Belize). Mar. Ecol. Prog. Ser. 302, 187–197. doi: 10.3354/meps302187
Pikitch E. K., Milner-Gulland E. J., McAllister M. K., Clarke S. C., Kirkwood G. P., Agnew D. J., et al. (2006). Global estimates of shark catches using trade records from commercial markets. Ecol. Lett. 9, 1115–1126. doi: 10.1111/j.1461-0248.2006.00968.x
Pollock K., Nichols J., Brownie C., Hines J. (1990). Statistical inference for capture-recapture experiments. Wildl. Monogr. 107, 97.
Ramírez-Macías D., Meekan M., de la Parra-Venegas R., Remolina-Suárez F., Trigo-Mendoza M., Vázquez-Juárez R. (2012). Patterns in composition, abundance and scarring of whale sharks Rhincodon typus near Holbox Island, Mexico. J. Fish Biol. 80, 1401–1416. doi: 10.1111/j.1095-8649.2012.03258.x
Raoult V., Williamson J. E., Smith T. M., Gaston T. F. (2019). Effects of on-deck holding conditions and air exposure on post-release behaviours of sharks revealed by a remote operated vehicle. J. Exp. Mar. Bio. Ecol. 511, 10–18. doi: 10.1016/j.jembe.2018.11.003
Roberts H. H. (1994). “Reefs and lagoons of Grand Cayman,” in The Cayman Islands: Natural History and Biogeography. Eds. Brunt M. A., Davies J. E. (Netherlands: Kluwer Academic Publishers), 75–104.
Roff G., Brown C. J., Priest M. A., Mumby P. J. (2018). Decline of coastal apex shark populations over the past half century. Commun. Biol. 1, 223. doi: 10.1038/s42003-018-0233-1
Rowat D., Speed C. W., Meekan M. G., Gore M. A., Bradshaw C. J. A. (2009). Population abundance and apparent survival of the Vulnerable whale shark Rhincodon typus in the Seychelles aggregation. Oryx 43, 591–598. doi: 10.1017/S0030605309990408
Rudstam L. G., Magnuson J. J., Tonn W. M. (1984). Size selectivity of passive fishing gear: A correction for encounter probability applied to gill nets. Can. J. Fish. Aquat. Sci. 41, 1252–1255. doi: 10.1139/f84-151
Schilds A., Mourier J., Huveneers C., Nazimi L., Fox A., Leu S. T. (2019). Evidence for non-random co-occurrences in a white shark aggregation. Behav. Ecol. Sociobiol. 73, 138. doi: 10.1007/s00265-019-2745-1
Schwarz C., Arnason A. (2009). “Jolly-Seber models in MARK,” in Program MARK: A Gentle Introduction. Eds. Cooch E., White G. Available at: http://www.phidot.org/software/mark/docs/book.
Schwarz C. J., Seber G. A. F. (1999). Estimating animal abundance: Review III. Stat. Sci. 14, 427–456. doi: 10.1214/ss/1009212521
Seber G. A. F. (1965). A note on the multiple-recapture census. Biometrika Trust 52, 249–259. doi: 10.1093/biomet/52.1-2.249
Seber G. A. F. (1982). The estimation of animal abundance and related parameters. 2nd editio (London, United Kingdom: Griffin).
Seber G. A. F. (1986). A review of estimating animal abundance. Biometrics 42, 267–292. doi: 10.2307/2531049
Sherman C. S., Chin A., Heupel M. R., Simpfendorfer C. A. (2018). Are we underestimating elasmobranch abundances on baited remote underwater video systems (BRUVS) using traditional metrics? J. Exp. Mar. Bio. Ecol. 503, 80–85. doi: 10.1016/j.jembe.2018.03.002
Sims D. W., Speedie C. D., Fox A. M. (2000). Movements and growth of a female basking shark re-sighted after a three year period. J. Mar. Biol. Assoc. United Kingdom 80, 1141–1142. doi: 10.1017/S0025315400003283
Skomal G. B. (2007). Evaluating the physiological and physical consequences of capture on post-release survivorship in large pelagic fishes. Fish. Manage. Ecol. 14, 81–89. doi: 10.1111/j.1365-2400.2007.00528.x
Smith K., Scarr M., Scarpaci C. (2010). Grey nurse shark (Carcharias taurus) diving tourism: Tourist compliance and shark behaviour at fish rock, Australia. Environ. Manage. 46, 699–710. doi: 10.1007/s00267-010-9561-8
Sosa-Nishizaki O. (2012). “Chapter 26 Problems with Photo Identification as a Method of Estimating Abundance of White Sharks , Carcharodon carcharias. An Example from Guadalupe Island, Mexico.” in Global Perspectives on the Biology and Life History of the White Shark. Ed. Domeier M. L. (Boca Raton, FL, United States: CRC Press), 393–404. doi: 10.1201/b11532-30
Speed C. W., Field I. C., Meekan M. G., Bradshaw C. J. A. (2010). Complexities of coastal shark movements and their implications for management. Mar. Ecol. Prog. Ser. 408, 275–293. doi: 10.3354/meps08581
Storch D., Okie J. G. (2019). The carrying capacity for species richness. Glob. Ecol. Biogeogr. 28, 1519–1532. doi: 10.1111/geb.12987
Tavares R. (2009). Fishery biology of the Caribbean reef sharks, Carcharhinus perezi (poey 1876), in a Caribbean insular platform: Los Roques Archipelago national park, Venezuela. Panam. J. Aquat. Sci. 4, 500–512.
Towner A. V., Wcisel M. A., Reisinger R. R., Edwards D., Jewell O. J. D. (2013). Gauging the threat: the first population estimate for white sharks in South Africa using photo identification and automated software. PloS One 8, e66035. doi: 10.1371/journal.pone.0066035
The National Conservation Law, 2013 (2014). Law 24 of 2013. supplement No.1, Extraordinary Gazette No. 9 dated 5th February, 2014. (George Town, Grand Cayman, Cayman Islands).
Van Tienhoven A. M., Den Hartog J. E., Reijns R. A., Peddemors V. M. (2007). A computer-aided program for pattern-matching of natural marks on the spotted raggedtooth shark Carcharias taurus. J. Appl. Ecol. 44, 273–280. doi: 10.1111/j.1365-2664.2006.01273.x
Vignaud T. M., Mourier J., Maynard J. A., Leblois R., Spaet J. L. Y., Clua E., et al. (2014). Blacktip reef sharks, Carcharhinus melanopterus, have high genetic structure and varying demographic histories in their Indo-Pacific range. Mol. Ecol. 23, 5193–5207. doi: 10.1111/mec.12936
Ward-Paige C. A. (2017). A global overview of shark sanctuary regulations and their impact on shark fisheries. Mar. Policy 82, 87–97. doi: 10.1016/j.marpol.2017.05.004
Ward-Paige C. A., Mora C., Lotze H. K., Pattengill-Semmens C., McClenachan L., Arias-Castro E., et al. (2010). Large-scale absence of sharks on reefs in the greater-caribbean: A footprint of human pressures. PloS One 5, e11968. doi: 10.1371/journal.pone.0011968
White G. C., Burnham K. P. (1999). Program MARK: survival estimation from populations of marked animals. Bird Study 46, S120–S139. doi: 10.1080/00063659909477239
White G. C., Shenk T. M. (2001). “Population estimation with radio-marked animals,” in Radio Tracking and Animal Populations, vol. 474 . Eds. Millspaugh J., Marzluff J. (Cambridge, MA, United States: Academic Press). doi: 10.1016/b978-012497781-5/50014-1
Whitney N. M., Pyle R. L., Holland K. N., Barcz J. T. (2012). Movements, reproductive seasonality, and fisheries interactions in the whitetip reef shark (Triaenodon obesus) from community-contributed photographs. Environ. Biol. Fishes 93, 121–136. doi: 10.1007/s10641-011-9897-9
Winter H. V., de Graaf M. (2019). Diversity, abundance, distribution and habitat use of reef-associated sharks in the Dutch Caribbean. Wageningen Mar. Research report C105/18, 1–31. doi: 10.18174/466593
Keywords: mark-recapture models, Caribbean Sea, MARK software, Cayman Islands, conservation, non-invasive, natural marks, marine protected areas
Citation: Kohler J, Gore M, Ormond R and Austin T (2023) First estimates of population size and home range of Caribbean reef and nurse sharks using photo-identification and BRUVS. Front. Mar. Sci. 10:1230896. doi: 10.3389/fmars.2023.1230896
Received: 29 May 2023; Accepted: 18 September 2023;
Published: 09 October 2023.
Edited by:
David M. P. Jacoby, Lancaster University, United KingdomReviewed by:
Neville Scott Barrett, University of Tasmania, AustraliaMark Meekan, University of Western Australia, Australia
Copyright © 2023 Kohler, Gore, Ormond and Austin. This is an open-access article distributed under the terms of the Creative Commons Attribution License (CC BY). The use, distribution or reproduction in other forums is permitted, provided the original author(s) and the copyright owner(s) are credited and that the original publication in this journal is cited, in accordance with accepted academic practice. No use, distribution or reproduction is permitted which does not comply with these terms.
*Correspondence: Johanna Kohler, johanna.k.kohler@gmail.com