Assessing the activity of mud volcanism using boron isotope ratios in pore water from surface sediments of mud volcanoes off Tanegashima (SW Japan)
 Yuki Mitsutome1
  Tomohiro Toki
 Ryuichi Shinjo
 Akira Ijiri
- 1Department of Chemistry Biology and Marine Science, Graduate School of Engineering and Science, University of the Ryukyus, Nishihara, Japan
- 2Department of Chemistry, Biology and Marine Science, Faculty of Science, University of the Ryukyus, Nishihara, Japan
- 3Research Institute for Humanity and Nature (RIHN), Kyoto, Japan
- 4Graduate School of Science and Engineering, University of the Ryukyus, Nishihara, Japan
- 5Department of Physics and Earth Sciences, Faculty of Science, University of the Ryukyus, Nishihara, Japan
- 6Graduate School of Maritime Sciences, Kobe University, Kobe, Japan
- 7Kochi Institute for Core Sample Research, Institute for Extra-Cutting-Edge Science and Technology Avant-Garde Research (X-Star), Japan Agency for Marine-Earth Science and Technology (JAMSTEC), Nankoku, Kochi, Japan
Mud volcanoes can cause various geohazards, so it is very important to know their activity level and their distribution. Surface sediments were collected from four submarine mud volcanoes (MVs) off Tanegashima (SW Japan), namely, MV1, MV2, MV3, and MV14. We extracted pore water from the surface sediments and investigated its chemical and isotopic compositions. The sodium (Na) and chloride (Cl-) concentrations decreased and the boron (B) and lithium (Li) concentrations increased with increasing depth, suggesting that some fluids with lower Na and Cl- concentrations and higher B and Li concentrations than seawater were supplied upward from the deep sub-seafloor. The fluid advection velocities estimated from the pore-water profiles differed for each MV, and those of MV3 were the fastest (14 cm/yr) in this study. The estimated equilibrium temperature with clay minerals using Na and Li concentrations were 93-134°C, corresponding to the temperature of environments around 3.7 to 5.3 km below the seafloor. This indicates that these components originated from these depths and that the origin depth did not reach the plate boundary in this area. The B isotope ratio in the pore water was extremely high up to +57 ‰, suggesting that it was strongly affected by adsorption onto the surface of the sediments. A higher B isotope ratio (+57 ‰) was detected in MV3, which was considered to be more active, indicating that more B was adsorbed onto clay minerals supplied from deeper depths.
1 Introduction
Mud volcanoes (MVs) are structures formed by the eruption of mud breccia from below the surface to the surface owing to increased pressure and buoyancy (Mazzini and Etiope, 2017). The number of MVs on land is probably approximately 103 (Etiope and Milkov, 2004); conversely, that on the seafloor was estimated to be 103-105 as the sedimentation rate is high (Milkov, 2000). The ejected materials comprise gas, mainly CH4 and CO2, mud, rock fragments, and water (Kopf, 2002), which are thought to be related to natural gases, petroleum, and/or gas hydrates (Etiope et al., 2009; Tinivella and Giustiniani, 2012). Some studies have indicated that earthquakes trigger MV activities (e.g., Tsunogai et al., 2012), but not all earthquakes are associated with MVs (Manga et al., 2009; Tingay et al., 2018; Wang and Manga, 2021). To investigate causal relationships, it is essential to monitor MV activity. On land, detailed topographical changes can be monitored using satellites (Kopanina and Shvidskaya, 2021). However, seafloor monitoring is difficult. Feseker et al. (2014) installed a submarine observation station at the Håkon Mosby MV off the coast of Norway, monitored it for 431 days, recorded four major events, and observed a rapid sediment uplift of 1 m (Feseker et al., 2014). Topographical changes on the seafloor can cause submarine landslides, which can lead to accidents involving the disconnection of communication cables (Carter et al., 2012; Carter et al., 2014; Gavey et al., 2017). Therefore, understanding the activities and distribution of submarine MVs and identifying the factors that determine the effects of earthquakes and subducting seamounts on MVs are vital (Kioka, 2020).
The indexes of the activity of submarine MVs can be estimated from the CH4 flux directly in surface water (Tsunogai et al., 2012), sedimentary activity analysis using microfossil age (biostratigraphy) and 14C age (Ujiié, 2000), and determination of the depth of origin using various geothermometers (Hensen et al., 2004; Nishio et al., 2015; Lalk et al., 2022; Mitsutome et al., 2023). The greater the depth of origin, the greater was the amount of energy that migrated through the material, suggesting the existence of large-scale mud volcanic activity. Hensen et al. (2004) estimated the temperature at which water reaches equilibrium with clay from water isotope ratios. Nishio et al. (2015) estimated the temperature at which lithium equilibrates with clay using lithium isotope ratios. Lalk et al. (2022) used clamp isotopes of methane to estimate the temperature of methane formation. Mitsutome et al. (2023) used the solubilities of Ar, Kr, and Xe to estimate the depths at which those heavy noble gases were present immediately before. Boron isotope ratio also has the potential to be used as a geothermometer (Palmer, 1991; James et al., 1999; Williams et al., 2001; You and Gieskes, 2001).
Boron (B) has two isotopes with mass numbers of 10 and 11. The B isotope ratio, which is the abundance ratio, indicates that B in fluids released at equilibrium from silicates undergoes smaller isotope fractionation at higher temperatures (Deyhle and Kopf, 2005). In contrast, MVs represent the progression of clay mineral alteration (Kopf and Deyhle, 2002). Deyhle and Kopf (2005) investigated B isotope fractionation in fluid and solid phases in nature and found that the B isotope ratio in the fluid was influenced by multiple factors, such as the weight ratio of the fluid to solid phases in the reaction field, B isotope ratio in the solid phase, reaction temperature, and pH in the reaction field. Chao et al. (2011) investigated the B isotope ratios in the pore water of MVs in Taiwan and found that after high-temperature release from the solid phase at depth, B re-adsorption during the ascent of the fluid resulted in an extremely high B isotope ratio. However, they did not specify on its usefulness as a geothermometer (Chao et al., 2011).
In this study, to verify the method of evaluating the activity of each MV using the B isotope ratio, we did the following. First, we collected pore water from the surface sediments of the MVs off Tanegashima Island and investigated their chemical and isotopic compositions. Next, we estimated the advection velocity using the vertical distribution of the chloride (Cl-) concentration. Subsequently, we estimated the depth of origin from the equilibrium temperature with clay minerals using sodium (Na) and lithium (Li) concentrations. Finally, we discussed the relationship between the origin temperature and isotopic fractionation of the B isotope ratios in the pore water and sediments.
2 Geological setting
Tanegashima is located in southwest Japan (Figure 1A) in the plate convergence zone where the Philippine Sea plate subducts below the Eurasian plate at a rate of 4.6 cm per year (Seno and Maruyama, 1984). The plate boundary off Tanegashima is at the northern end of the Ryukyu Trench, which is roughly classified as an erosion type, and the Nankai Trough, which extends eastward from the Ryukyu Trench into the accretion type (Clift and Vannucchi, 2004). A wedge of approximately 8 km was observed in the forearc region of the plate boundary off Tanegashima (Ujiié, 2000). The basement around Tanegashima comprises the Eocene Kumage Group, corresponding to the Shimanto Belt and exhibiting thrust faults and folds associated with subduction (Okada and Whitaker, 1979). Although the Kumage Group is not always distributed under the seafloor in the MV area, a layer of the same age as the Kumage Group was distributed below because Eocene foraminifera were obtained from the surface layer of the MV (Ujiié, 2000). The side-scan sonar survey conducted in 1990 covered an area with a width and depth of 20-30 km and 1,200-3,500 m, respectively, from the northern tip of the Ryukyu Trench slope to the southern tip of the central Ryukyu Trench slope. More than 30 mud diapirs were found on the northern trench slope (Ujiié, 2000). Currently, the presence of MV1–MV15 off Tanegashima have been confirmed (Figure 1B). Additionally, Nakayama et al. (2010), who investigated the pore water in MV1, suggested that water originating from the dehydration of clay minerals was supplied from the deep subseafloor (Nakayama et al., 2010). Furthermore, water masses containing high concentrations of methane (CH4) and characteristic microbial plumes in the surface sediments were observed several tens of meters above the summits of MV1 and MV14, indicating that these MVs were still active (Hoshino et al., 2017). Moreover, Mitsutome et al. (2023) investigated the noble gases in the surface sediments of MV1 and MV14, and used their solubility at 80 to 230°C to estimate that their depth of origin was 3-9 km below the seafloor (Mitsutome et al., 2023).
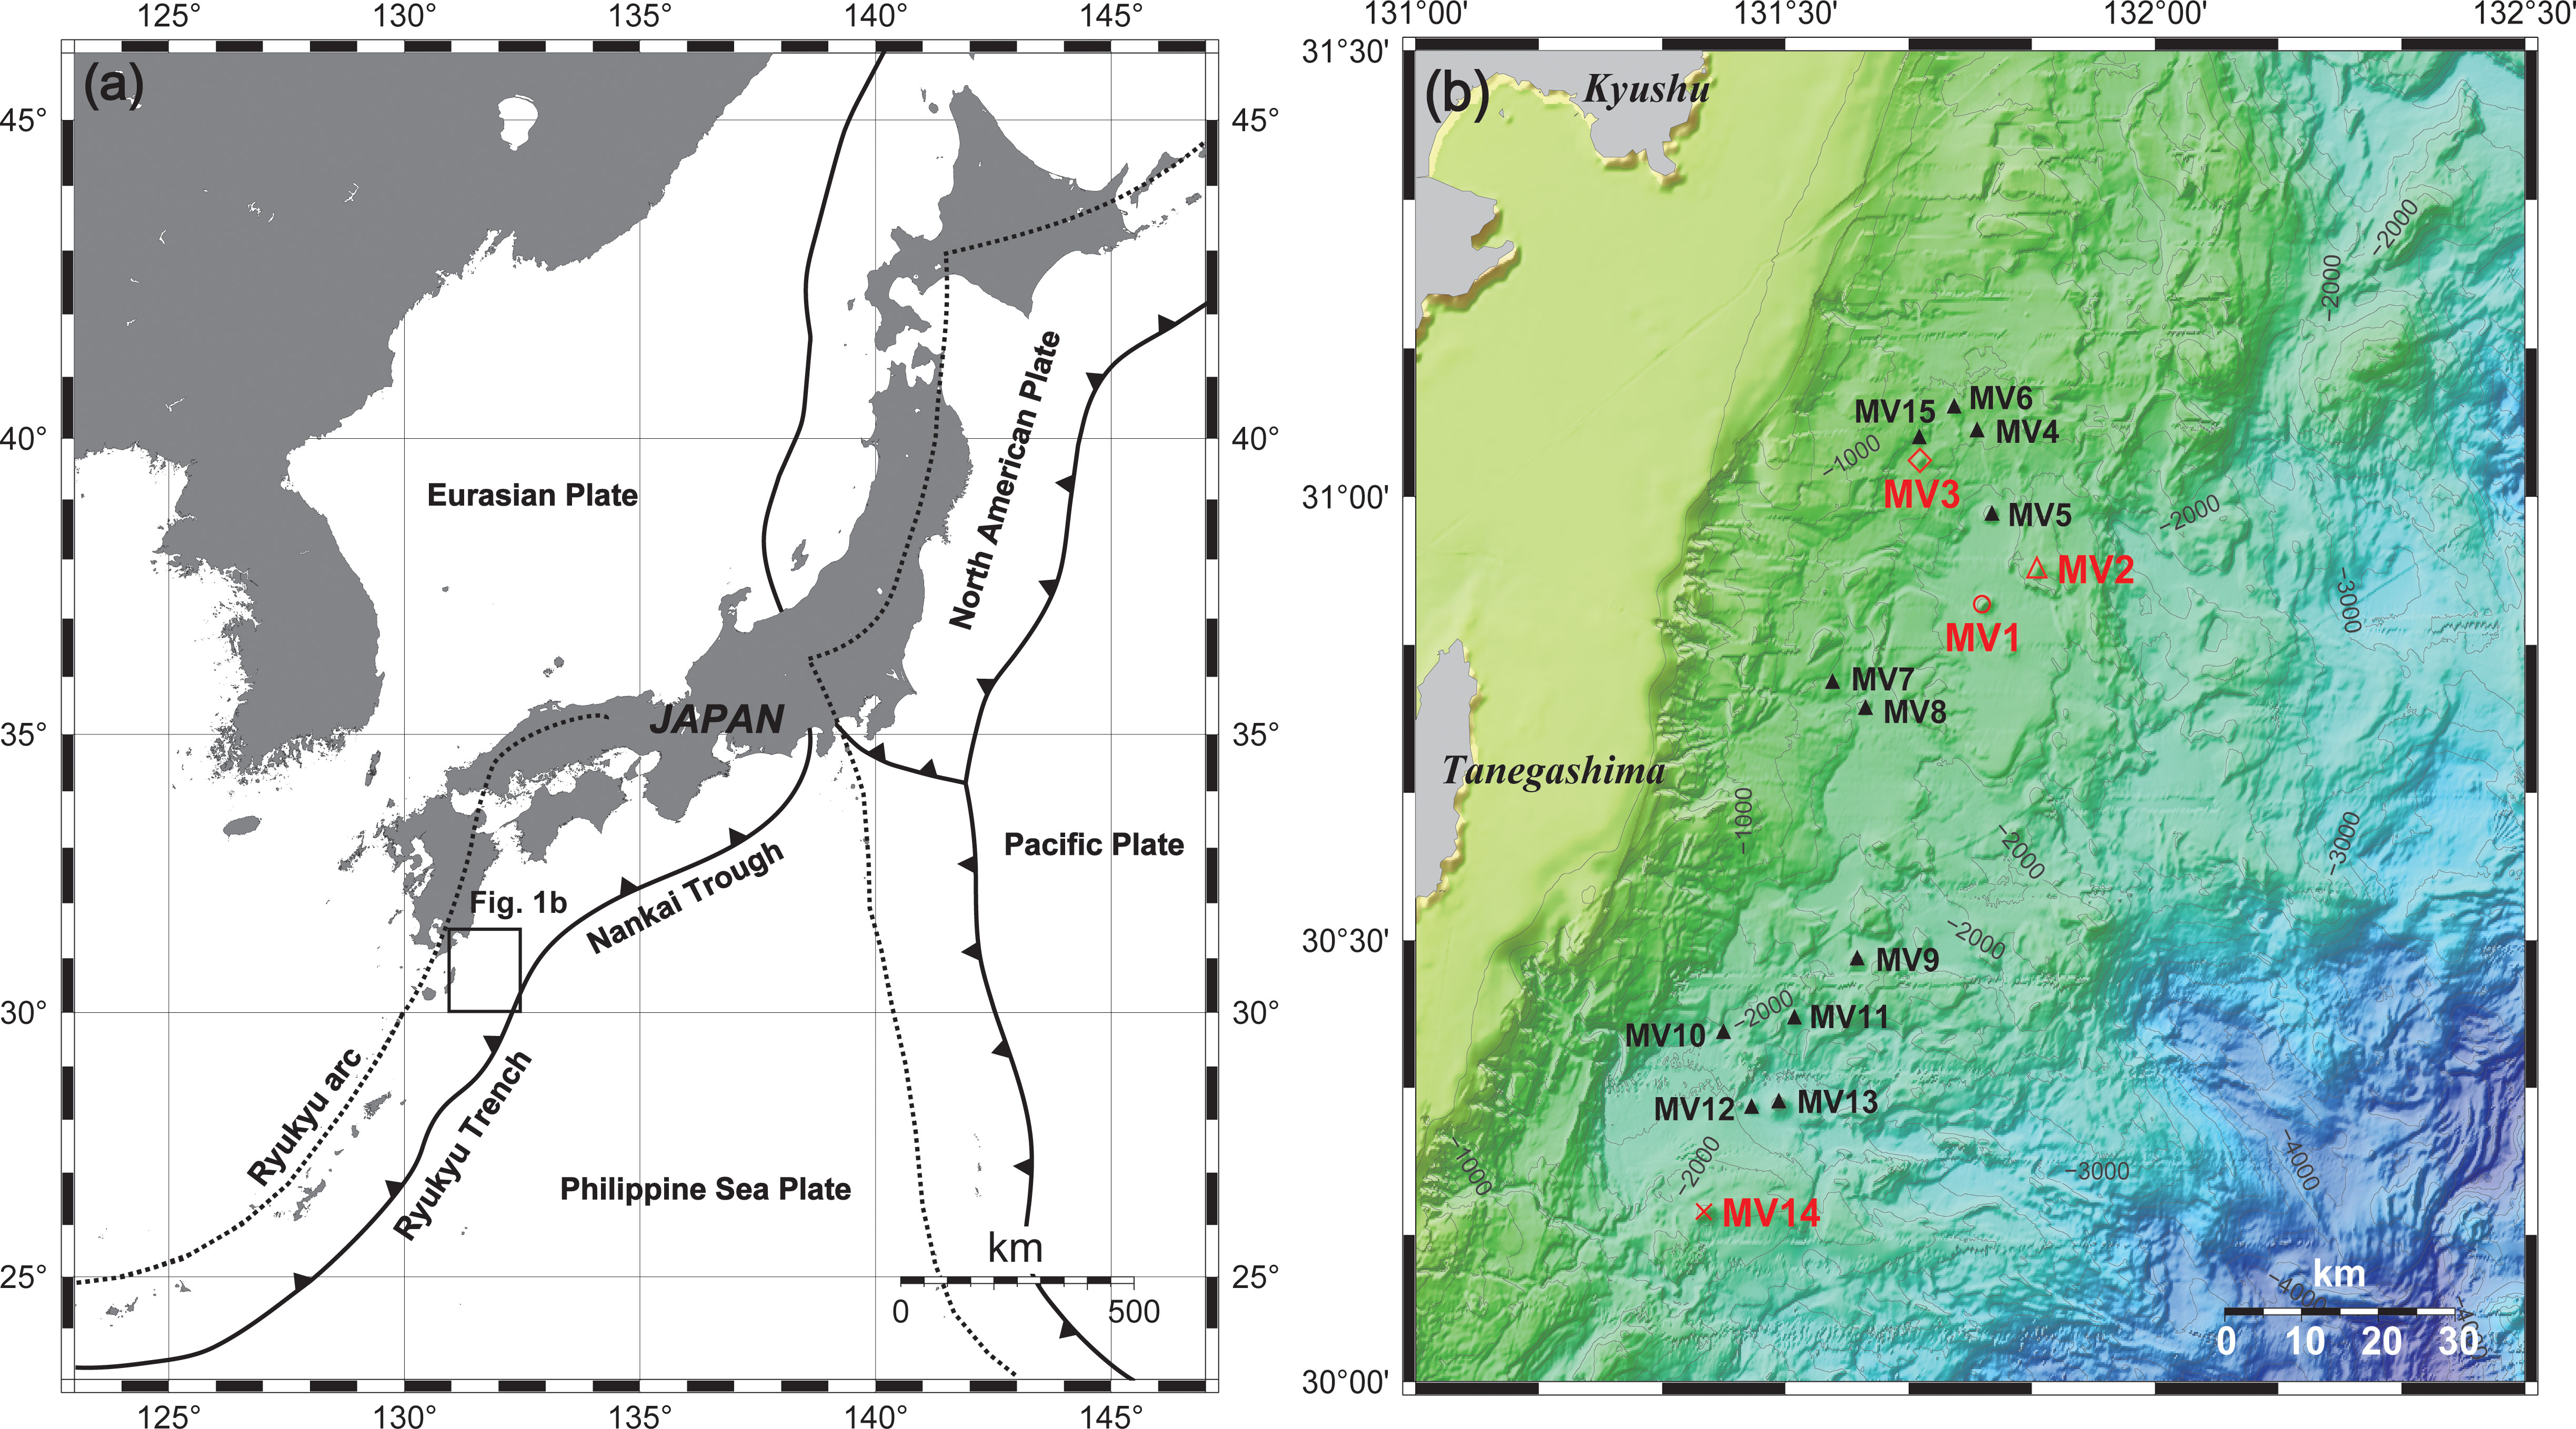
Figure 1 (A) Plate tectonics around Japan. The area surrounded by the square indicates the range of (B). The red triangle marks represent the numbered MVs, namely, MV1 to MV15. Contour lines are present at intervals of 200 m.
3 Sampling and analytical method
Pore water was extracted from the surface sediments collected during the KH-15-2 cruise from August 19 to September 1, 2015, and the KH-19-5 cruise from August 9 to August 18, 2019 (Table 1). For surface sediment sampling, we used the Navigable Sampling System (NSS; Ashi and Tokuyama, 2005) with a piston corer (length: 4-6 m) and a multiple corer (length: 60 cm) mounted on the R/V Hakuho-Maru, and randomly selected the following MVs: MV1, MV2, MV3, and MV14 (Supplementary Figures 1A–D). The lengths of the surface deposits obtained ranged from 3.11 to 5.21 m where piston corers were used and from 0.2 to 0.27 m where multiple corers were used (Table 1). The lithofacies of all the MVs mainly comprise 2-3-cmΦ breccia with a maximum size of approximately 5 cmΦ and are covered by semi-pelagic sediments. Mud was sub-sampled from the sediment on board at approximately 25-cm intervals for samples by a piston corer (Type PC in Table 2) and 5-cm intervals for samples by a multiple corer (Type MC in Table 2).
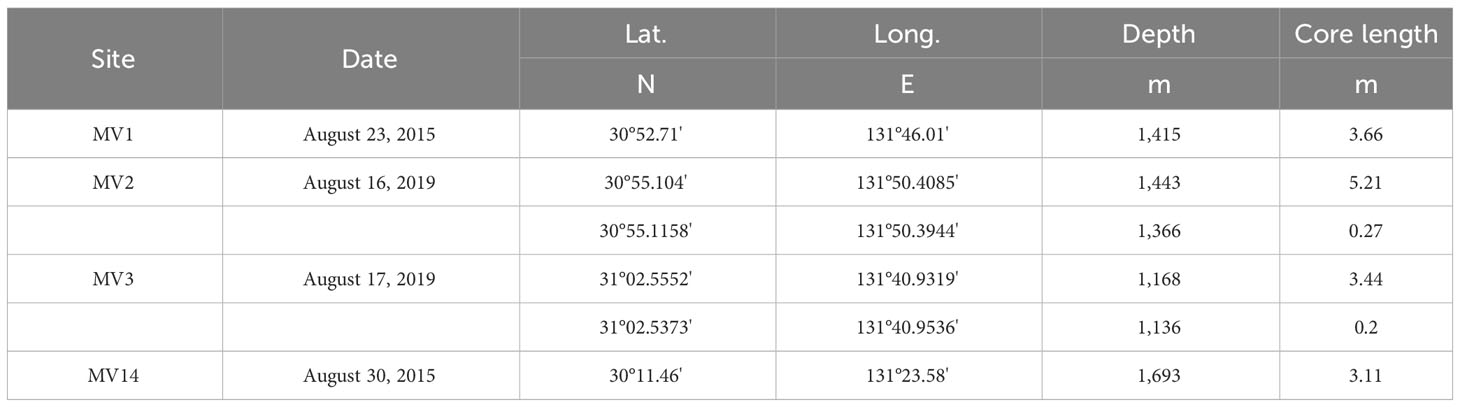
Table 1 The location and date of collection of the samples used in this study, and the length of the collected sediments.
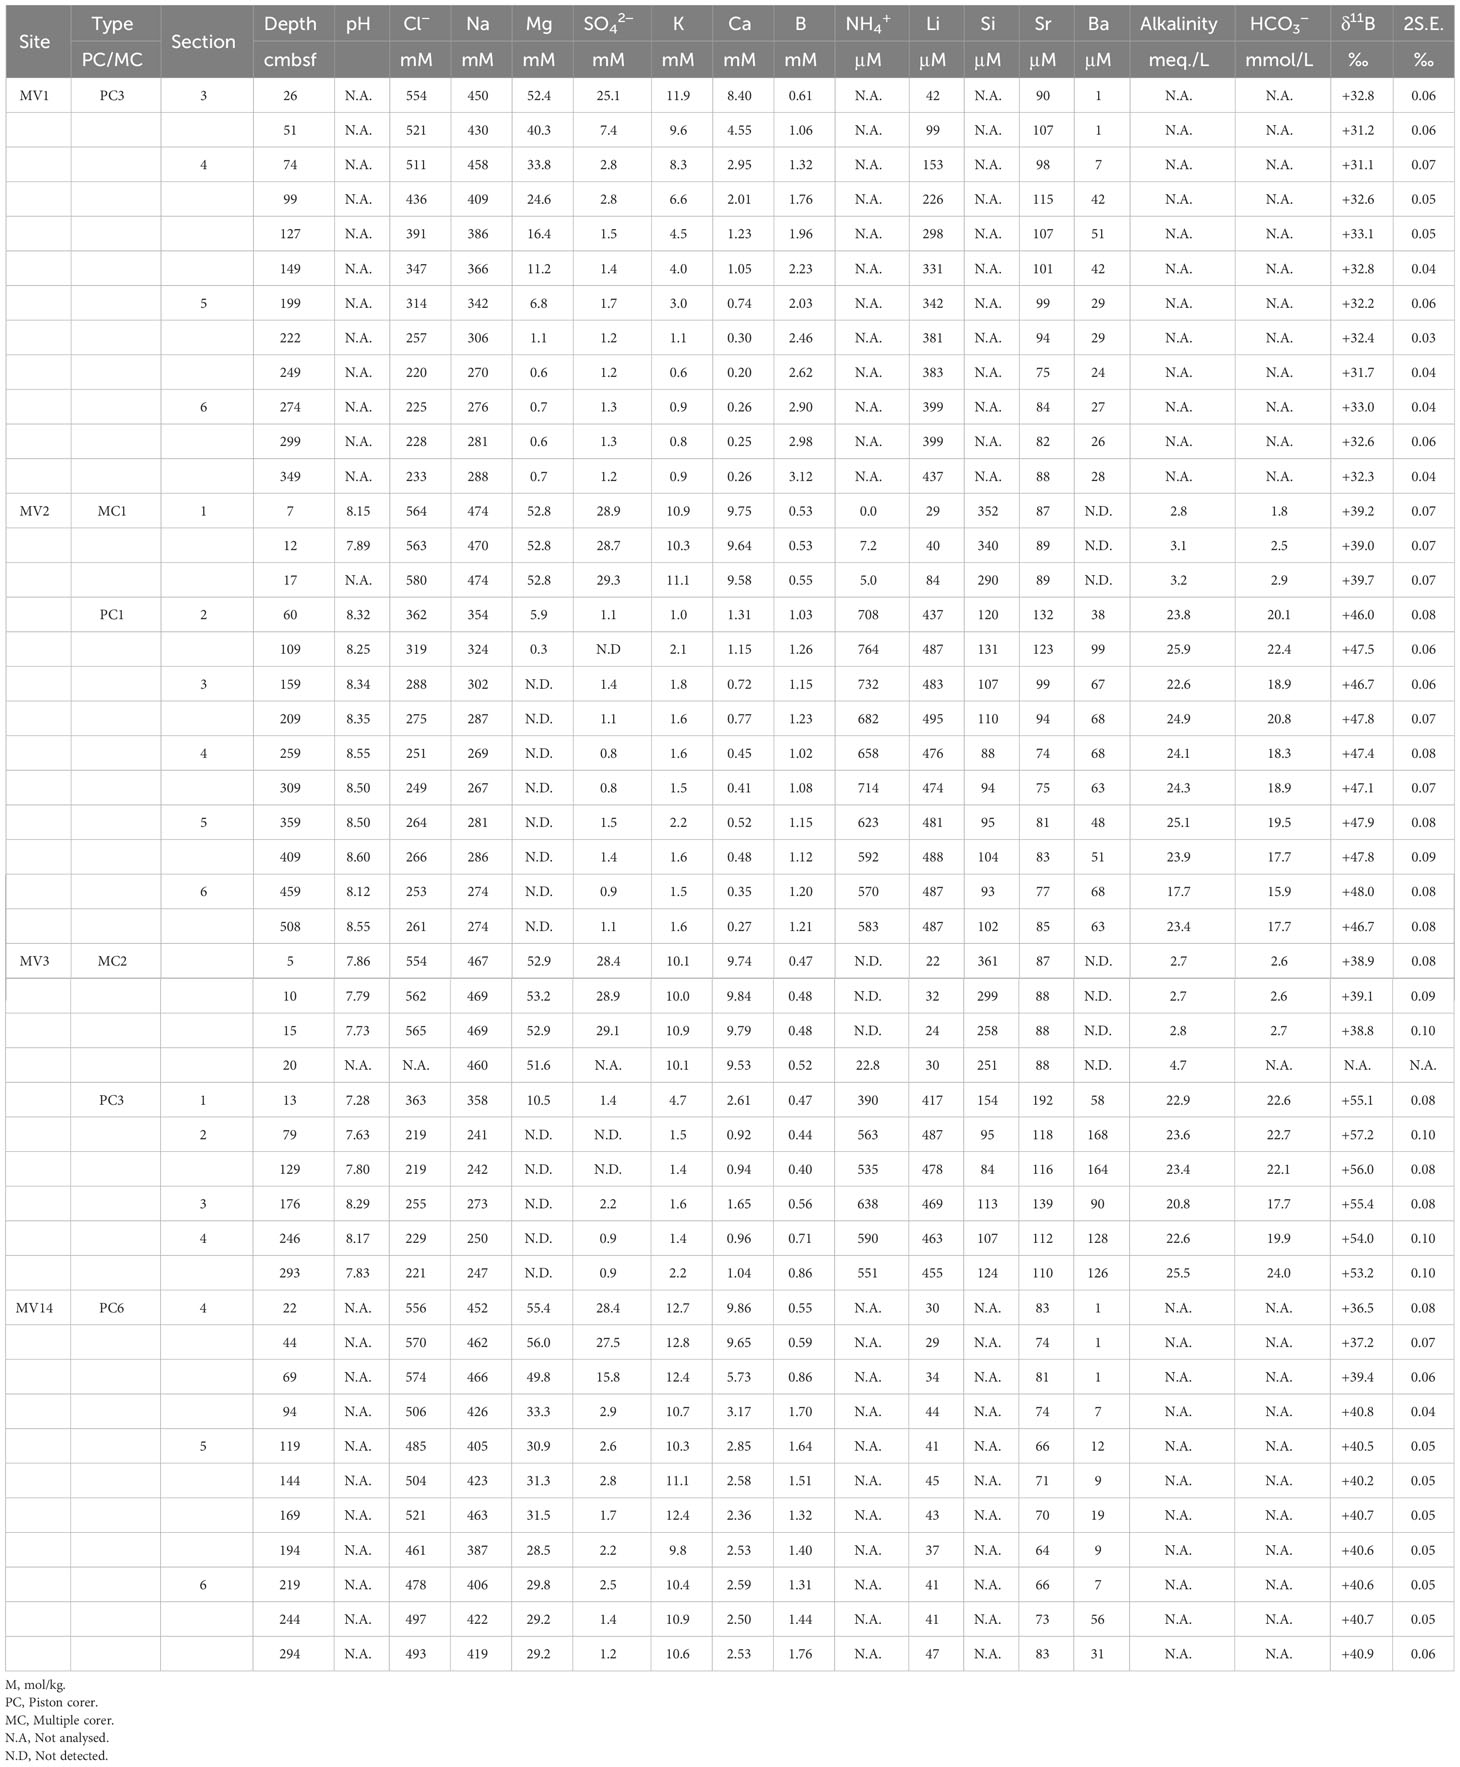
Table 2 Chemical composition analysis results of pore water samples collected in this study.
In the case of sediments collected by the piston corer, the mud in contact with the inner tube was removed because it may have been contaminated with seawater. The collected mud was placed in a squeezer set with a mesh and filter paper (Advantec; Filter paper No. 1), and pressure was applied with a hydraulic press to extract pore water into a 50-mL syringe (Manheim, 1966). The pore water extracted into the syringe was passed through a disc filter (Advantec; disposable syringe filter unit, 0.45 μm) and divided to analyze the: 1) anion concentration, ammonium ion concentration (NH4+), pH, and alkalinity; and 2) cation concentration. It was placed in a high-density polyethylene narrow mouth bottle (Nalgene; HDPE Bottle) and stored in a refrigerator at 4 °C. After pore water extraction, the residual sediments were frozen and transported to a land-based laboratory. In the case of sediments taken with the multiple corer, pore water was extracted with a Rhizon sampler (Seeberg-Elverfeldt et al., 2005; Dickens et al., 2007), distributed, stored, and brought back to the land-based laboratory in the same manner as pore water extracted from sediments taken with a piston corer.
The pore water samples were analyzed by ion chromatography for anions, inductively coupled plasma-atomic emission spectroscopy (ICP-AES) for cations, titration with hydrochloric acid for alkalinity, and the phenol blue colorimetric method for ammonium ions. The accuracies were less than 0.2, 3, 5, and 1%, respectively. The HCO3- concentration was calculated from the pH and alkalinity, assuming equilibrium for carbonic acid. The dissociation constants used in the calculation were K1 = 10-5.847, K2 = 10-8.966, and Kw = 10-13.127, and the water temperature was 2°C.
B in the pore water was separated using a 5-cm3 PFA conical vial by the micro-sublimation method (Wang et al., 2010) and final solution was adjusted to 50 ppb B concentration in 0.3 N nitrate matrix. Measurements were conducted using a multicollector inductively coupled plasma mass spectrometer (MC-ICP-MS; Neptune Plus) manufactured by Thermo Fisher Scientific, and standard samples of NBS SRM 951 (11B/10B = 4.0056 ± 0.5) were used. The accuracy of analysis was +39.39 ± 0.33‰ for five measurements of standard seawater NASS-5. Analytical errors (2 S.E.) for individual data are presented in Table 2.
A portion of the sediment sample was dried at 60°C immediately before use, and a portion of the dried sample was ground to a powder using a mortar and pestle. Approximately 0.6 g of the powdered sample was weighed out and place into a vinyl chloride ring (Rigaku; PVC ring for powder samples, RS100-10) on the WC die pellet (Rigaku; WC die pellet, RS2550). Then WC die pellet was placed on top and pressurized at 50 MPa for 5 min using an electric pump (RIKEN; SMP-3012SK) and a press (RIKEN; CDM-10M). The pellets were stored in a desiccator until further analysis. The mortar, pestle, PVC ring, spatula, and WC die pellets were washed with acetone before and after use. The B concentration and isotope ratio analyses were conducted using MC-ICP-MS (the same machine as described above), with the laser ablation system (ESI NWR-Femto, United States). Data processing was conducted using IOLITE ver. 3.7 software (e.g., Woodhead et al., 2005; Hellstrom et al., 2008; Paton et al., 2011). GSD, supplied by the U.S. Geological Survey, was used as the standard material, and all B isotope ratios were denoted by δ as the deviation (‰) from the international standard material NIST SRM951 (Table 3). Additionally, for the analysis, a laser was applied to three different locations on the same sample to calculate the average; the standard deviations (2 S.D.) were calculated and are presented with each data point (Table 3).
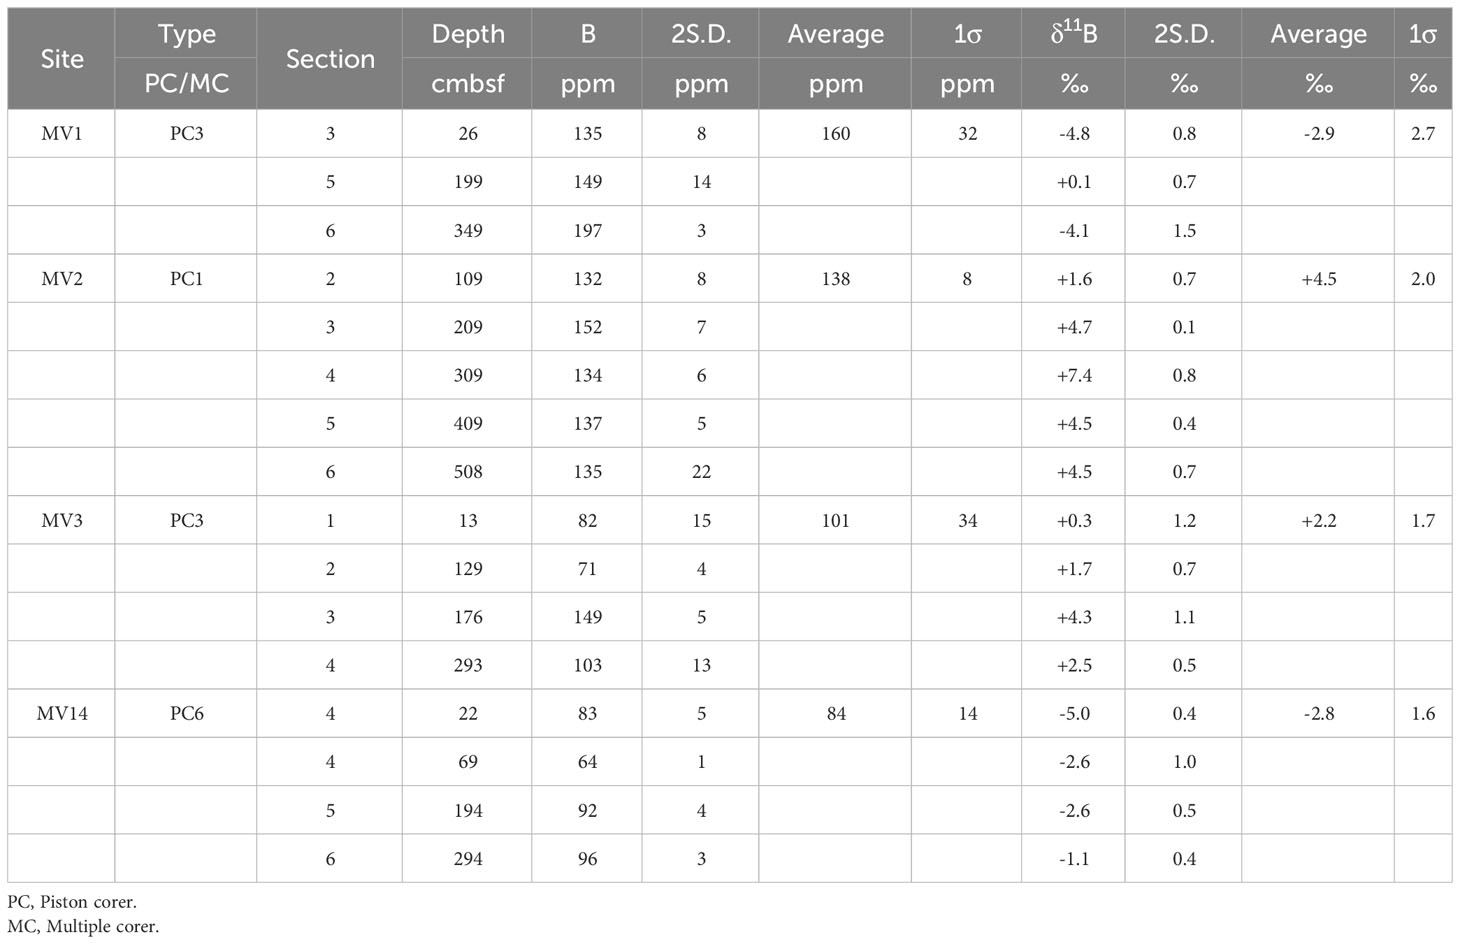
Table 3 List of boron concentrations and isotope ratios of sediment samples collected in this study.
4 Results
Table 2 summarizes the chemical and isotopic compositions of the pore water and Table 3 presents the B concentrations and isotopic ratios of the sediments. Figure 2 shows the vertical distributions of Cl-, Na, Li, magnesium (Mg), calcium (Ca), and B concentrations and isotope ratios (δ11B) in the pore water, and B concentrations and isotope ratios in the sediments. The concentrations of Cl-, Na, Mg, and Ca in all the MVs were similar to those in the seawater immediately below the seafloor and decreased with depth (Figures 2A–E). The B and Li concentrations increased with depth just below the seafloor (Figures 2C, I). At MV14, the change in the concentration was not large; however, at MV3, it was remarkable. The magnitude of the change in concentration was greatest at MV3, followed by MV2, MV1, and MV14, which gradually decreased (Figure 2).
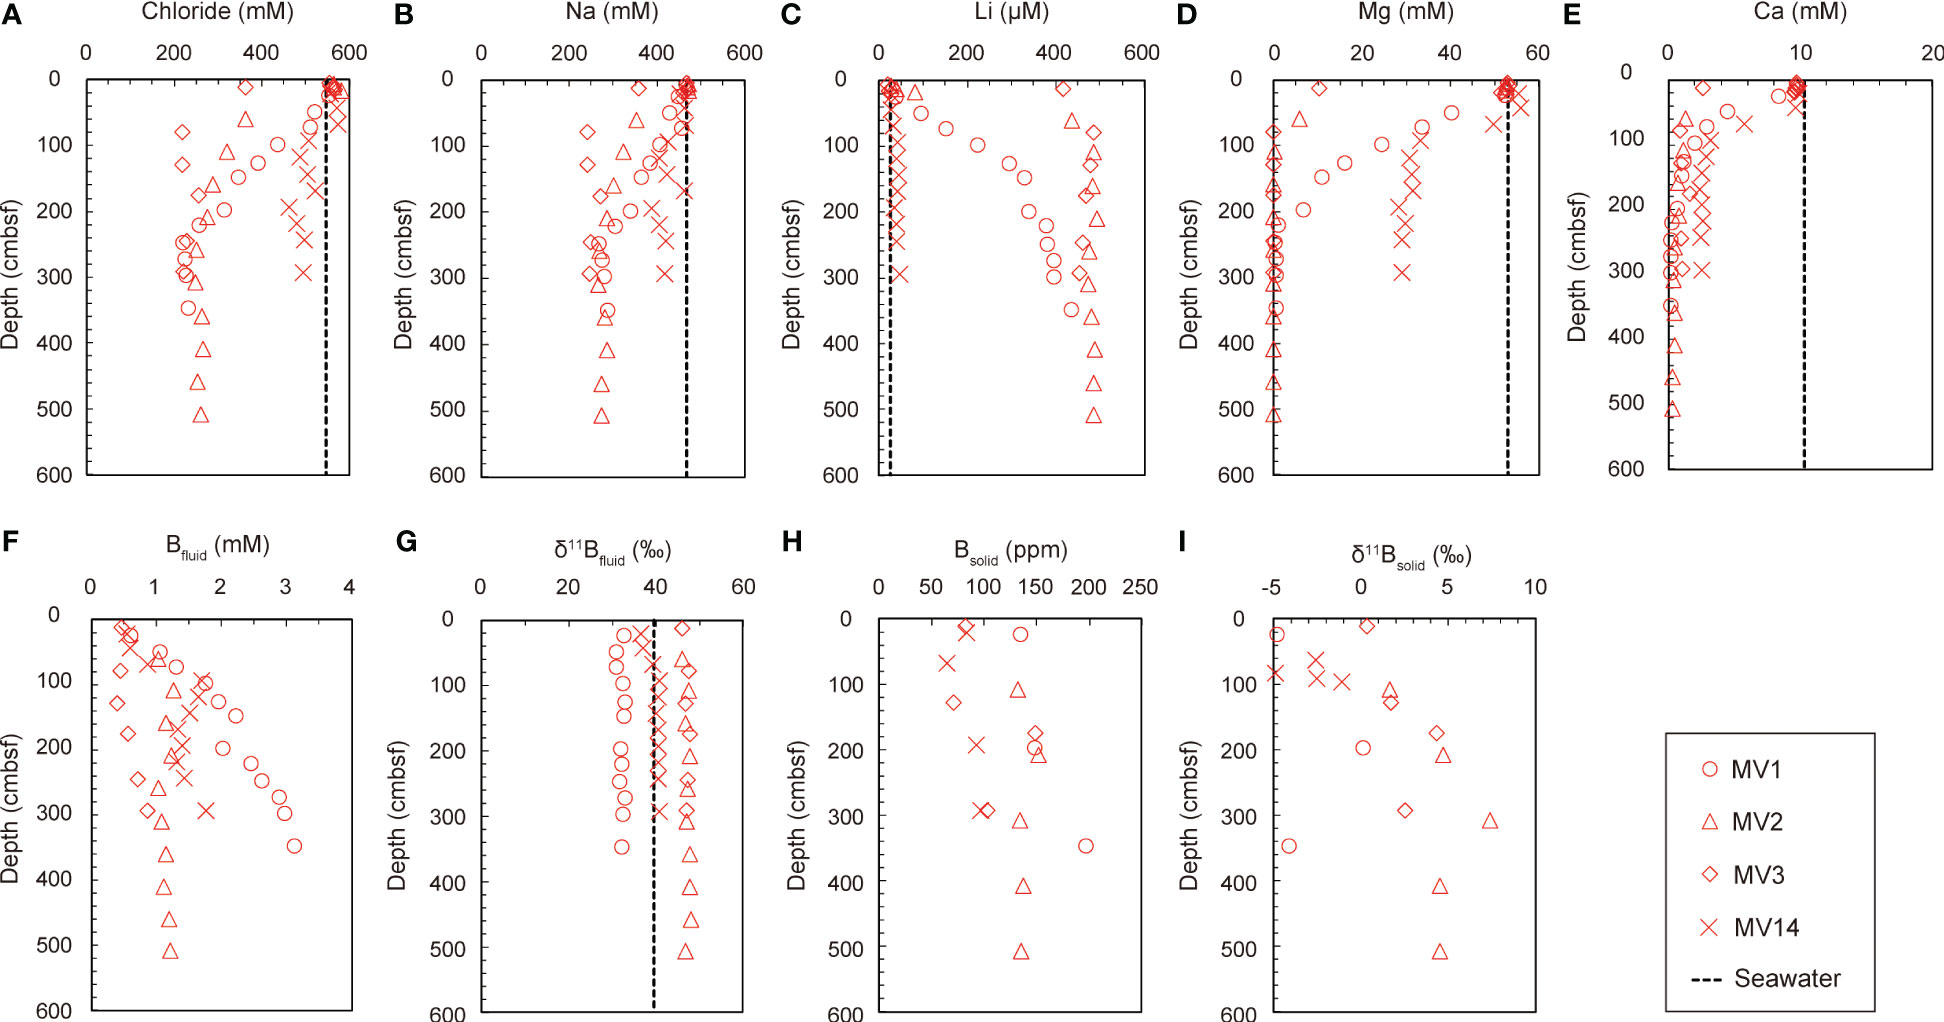
Figure 2 (A–G) The distribution of dissolved components in the pore water with depth. Concentration of (A) Cl-, (B) Na, (C) Li, (D) Mg, (E) Ca, and (F) B; (G) B isotope ratio. (H, I) Solid phase information, showing the vertical distribution of the (H) B content in the sediment and the (I) B isotope ratio of the sediment with depth.
The B concentration in the sediment was almost 100 ppm, and the concentration seemed to increase with depth (Figure 2H). There was almost no difference in concentration between the mud volcanoes; however, the concentrations of MV14 (84 ± 14 ppm) and MV3 (101 ± 34 ppm) were slightly lower. The isotope ratio tended to increase with depth; however, it slightly varied between mountains (Figure 2I). The comparison between each MV showed that MV2 had the highest δ11B value (+4.5 ± 2.0‰), and MV1 (–2.9 ± 2.7‰) and MV14 (–2.8 ± 1.6‰) had low δ11B values (Table 3). Our data (B concentration: 84–160 ppm, B isotope ratio: –2.9 to +4.5 ‰; Table 3) are similar to those (B = 80 to 160 ppm; δ11B = –6.6 to +4.8‰) of Ishikawa and Nakamura (1993).
5 Discussion
5.1 Estimation of advection velocity using Cl− concentration
Figure 3A shows the depth distribution of Cl− concentration in each MV. Cl− is chemically extremely stable, hardly produces precipitates, and hardly participates during microorganism metabolism. Nevertheless, the Cl− concentration in the pore water tended to decrease with depth for all the MVs (Figure 3A). The Cl− concentration at the seafloor surface, which is considered to be the seawater itself, is distributed in a convex downward arc toward the depth below the seafloor (Figure 3A). If the water were circulating, as in the hydrothermal circulation, the distribution of Cl− concentration would be uniform regardless of depth, but this is not the case. This is because fluid with lower Cl− concentrations than seawater is distributed in the deep subseafloor, and this fluid rises above. The shape of the vertical distribution of the Cl− concentration differs for each MV. It gradually decreased to 349 cm below the seafloor (cmbsf) and showed a relatively constant value from there up to 349 cmbsf. However, MV2 and MV3 showed relatively low Cl− values, even just below the seafloor. There was a clear difference in the distribution of concentrations with depth for each volcanic edifice (Figure 3A), which can be explained by the difference in the advection velocity of the fluid. Therefore, the advective diffusion equation (Eq. 1) was used for quantitative analysis.
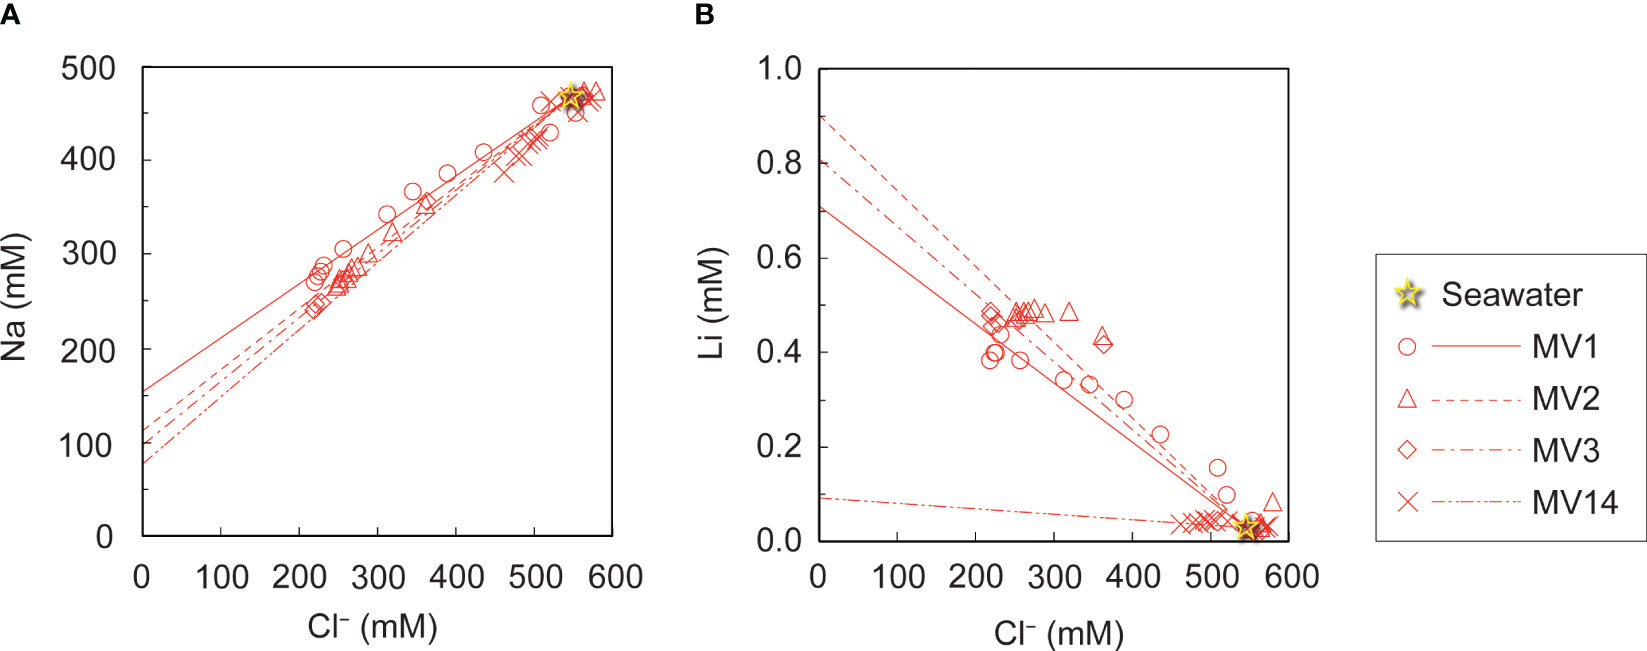
Figure 3 Relationship of (A) Na and (B) Li concentrations with the Cl- concentration in pore water. Approximate straight lines are drawn for each MV for comparison with seawater values.
The above equation represents the temporal change in the concentration of a chemical in the pore water at any depth in terms of diffusion, advection, and reaction (Hensen et al., 2007). t is the time (y), x is the distance from the seafloor (cm), and [C] is the Cl− concentration (mM). Dsed is the diffusion coefficient of Cl− in the sediment (cm2 yr−1); is the porosity; v is the downward fluid velocity (cm yr−1); and R is the reaction rate. Notably, R = 0 because Cl− does not participate to the reaction. We also assumed that the change in porosity with depth was negligible. Assuming a steady state, the left sides of Eq. 1 can be expressed as zero, and the following special solution (Eq. 2) can be derived.
where is the converging concentration; C0 is the initial concentration; Dsed is the diffusion coefficient of Cl− in the sediment (cm2 yr−1); and v is the velocity of the fluid (cm yr−1), wherein the downward direction is positive. x is the distance (cm) from the seafloor. The average diffusion rates were determined by fitting the data to each graph. The estimated advection velocities are listed in Table 4. As the downward direction is positive, the outflow rate is negative. Although sedimentation should be treated as a downward advection phenomenon, Ujiié (2000) estimates that the average sedimentation rate on the slope of the North Ryukyu Trench is 10−13 cm over 1,000 years. This value is equivalent to 0.01 cm yr−1 for the downward advection velocity; thus, it is negligible in this case (Table 4). The advection velocities of each MV were different, and the results were in the order of MV3 > MV2 > MV1 > MV14 in the upward direction.
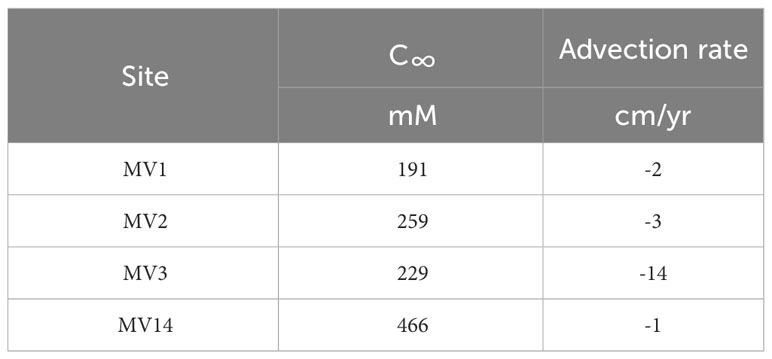
Table 4 Convergence values of advective velocity and chloride ion concentration derived by applying the advection-diffusion model assuming a steady state to the vertical distribution of chloride ions.
5.2 Estimation of equilibrium temperature with clay minerals using Na and Li concentrations
In general, fluids with low Cl− concentration on the seafloor are thought to include dissolution water occurring during gas hydrate recovery, inflow of groundwater, and water originating from dehydration reactions of clay minerals (Kastner et al., 1991). In the submarine MVs off Tanegashima, studies have found that water originating from the dehydration of clay minerals is supplied to the seafloor surface based on δ18O and δD data of pore water in the seafloor surface layer (Nakayama et al., 2010). The dehydration reaction of clay minerals is known to occur at 60−150°C, suggesting that the fluid is derived from a high-temperature environment. To estimate the original temperature, geothermometers were applied to the Na and Li concentrations in the pore water of each MV (Fouillac and Michard, 1981). Figures 3A, B show the relationship between the Na and Cl− concentrations in the pore water, and the Li concentration against the Cl− concentration, respectively. To determine the concentrations of the freshwater components mixed with seawater, we recorded the y-intercept values when a straight line was drawn through the data and seawater values for each MV. The resulting end-members are summarized in Table 5 as Na* and Li*, respectively. The following equation (Eq. 3) was applied to the obtained end-members to obtain the equilibrium temperature t (°C) when Na and Li were considered to be in equilibrium with the clay minerals.
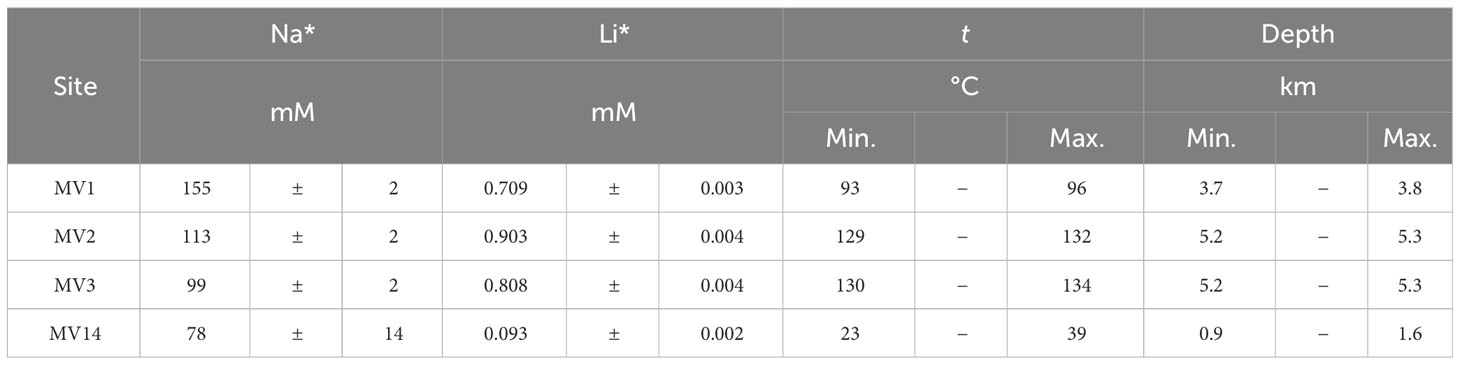
Table 5 Assuming that there is a source with a chloride concentration of 0 mM, the estimated Na and Li end-member concentrations, the equilibrium temperatures with clay minerals estimated from their ratio, and the depth at which Na and Li have reached equilibrium with clay minerals, estimated from their temperatures.
Fouillac and Michard (1981) proposed a total of two different equations for Cl− concentrations higher and lower than 300 mM, respectively. As we consider a freshwater source when the Cl− concentration is 0, we use this equation, which is expressed under the condition of a Cl− concentration of< 300 mM, from the two equations given by Fouillac and Michard (1981). According to the obtained temperatures, the equilibrium temperature estimated from the Tanegashima MV varied from approximately 23 to 134°C, with the highest temperature being observed at MV3, followed by MV2 and MV1, and the lowest temperature at MV14 (Table 5). The temperature estimated for MV14 was below the reaction temperature range for the dehydration of clay minerals, and the actual Li concentration was almost the same as that of seawater. It is possible that the fluid derived from clay mineral dehydration was not supplied in the first place. The other temperatures (93−134°C; Table 5) fit very well with the range of reaction temperatures originating from the dehydration of clay minerals. Thus, we suggest that MV1 to MV3 are undoubtedly supported by fluids originating from the dehydration of clay minerals. On the other hand, MV14 may not be supplied by fluids derived from dehydration of clay minerals.
When calculated with the reported geothermal gradient of 25°C/km in this region (Ohde et al., 2018), MV3 has the deepest source depth of ~5 km and that of MV14 the shallowest of only around 1−2 km (Table 5). In any case, the plate boundary, which is supposed to be around 18 km, has not been reached (Nishizawa et al., 2017). This is consistent with the results of Mitsutome et al. (2023), who used the concentration of noble gases in the surface sediments of mud volcanoes in this area and showed that the depth of origin of noble gases in the surface sediments of mud volcanoes off Tanegashima is about 3 to 9 km.
5.3 Isotope fractionation of B isotope ratio between the solid and liquid phases
The vertical distribution of B concentration in the pore water suggests that fluid with a higher B concentration than seawater was supplied from the deep subseafloor (Figure 2F). The B isotope ratios in the pore water showed different values for each MV, suggesting that B was supplied from different sources for each MV (Figure 2G). Here, given that we are collecting pore water from the seafloor, if boron in pore water can be explained by the mixing of fluids of multiple origins, it would be reasonable to consider seawater as a candidate as one of the origins (Figure 2F). The isotope ratio of the source was obtained by recording the y-intercept of the isotope ratio of the element against the reciprocal of its concentration (Keeling, 1958). However, in the case of pore water of the deep seafloor, if gas hydrates are present in the sediment and dissolve to release fresh water during recovery, the B concentration will also decrease accordingly. Therefore, this effect was offset by considering the concentration ratio of Cl− and B (Cl−/B ratio) (Figure 4). Furthermore, a straight line was drawn through the background seawater to obtain the y-intercept of each MV (Figure 4). The obtained y-intercept values are listed in Table 6. Both values differed from the B isotope ratio of seawater (+39.5‰; Spivack and Edmond, 1987), and showed different values for each MV (Table 6). MV3 showed much higher values, followed by MV2 and MV14 with similar values, and MV1 had the lowest value (Table 6). Moreover, the isotope ratio of B in the sediment cannot be determined for end-members; thus, the difference from the average value for each MV (Table 3), namely, the isotope fractionation of B between the solid and liquid phases (Δsolid-fluid), was determined (Table 6). According to the results, the isotope fractionation values of MV3 were the largest, whereas those of MV2 and MV14 were almost the same (Table 6).
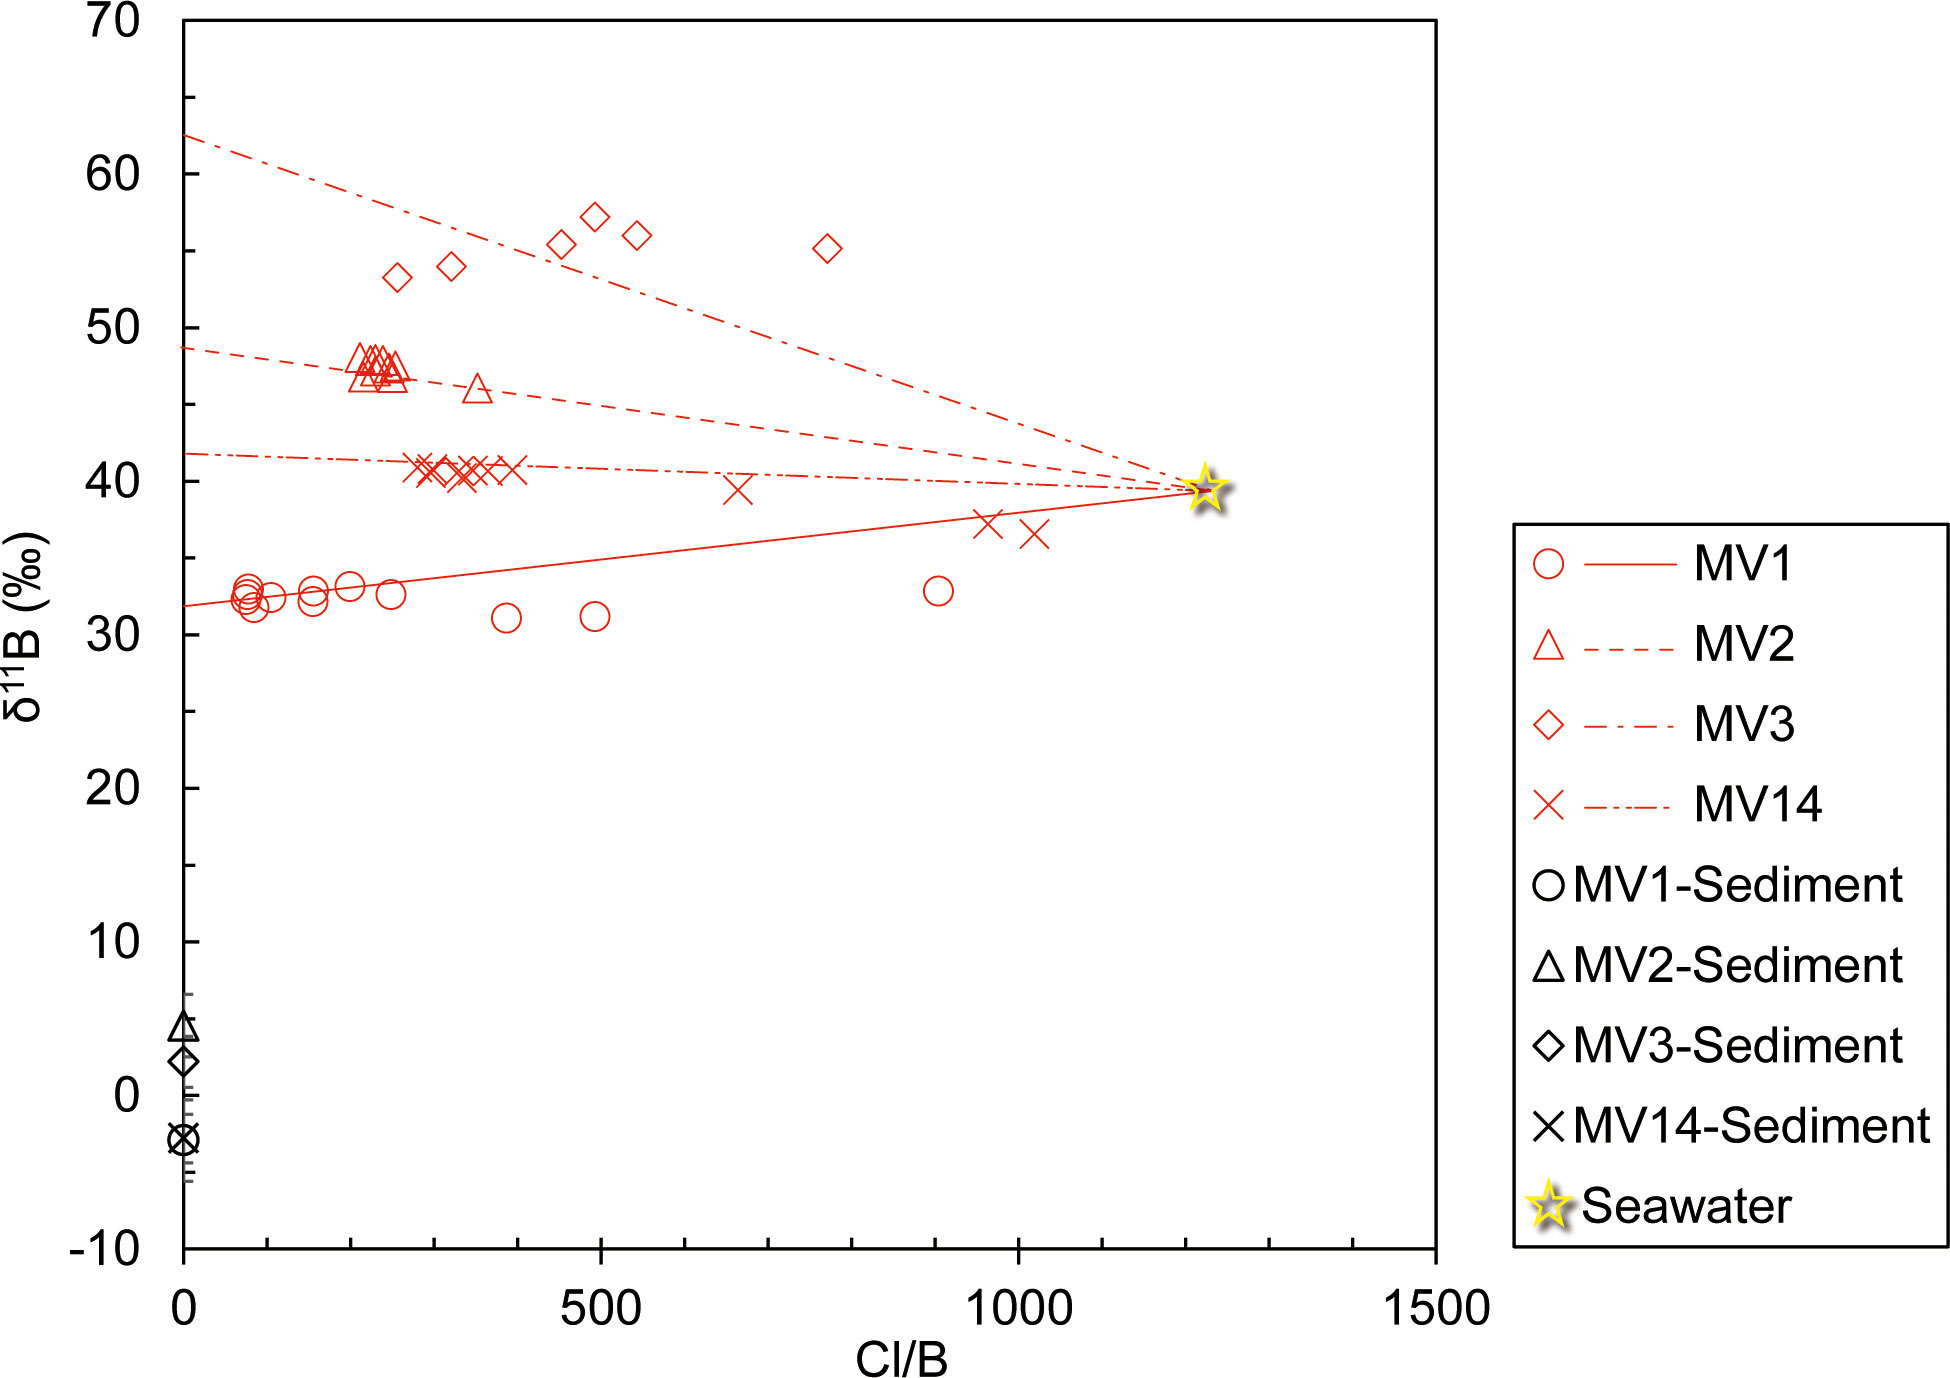
Figure 4 Relationship between the B isotope ratio and the ratio of Cl- to B concentrations in pore water and the B isotope ratio in sediments of each MV.
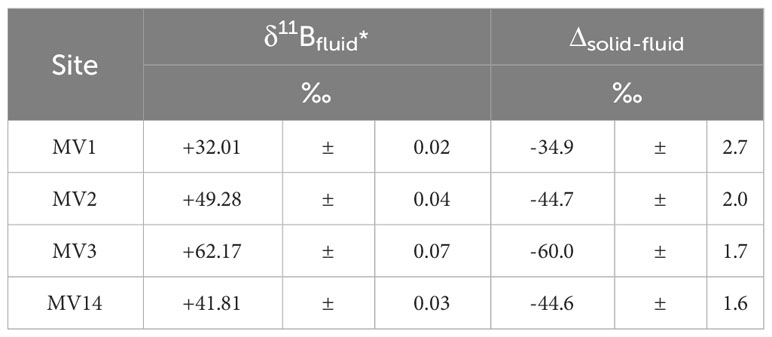
Table 6 End members of boron isotope ratios in pore water and the mean values of boron isotope ratios in sediments, and their differences (isotopic fractionation).
To verify the potential of the B isotope ratio as a geothermometer, the horizontal axis represents the equilibrium temperature of the clay minerals obtained from the Na and Li concentrations determined in this study (Table 5). A graph was created with 1000/T (K−1) and Δsolid-fluid (Table 6) on the vertical axis (Figure 5). The geothermometer trend (black dashed line in Figure 5) proposed by Williams et al. (2001), and the trend of B isotope fractionation (brown dashed line in Figure 5), which indicates the degree of alteration of clay minerals observed in global MVs reported by Kopf and Deyhle (2002), are shown in Figure 5. According to this graph, the B isotope fractionation trend obtained in this study is different from any other trends and corresponds to the observations of normal pore water levels (blue area in Figure 5; Brumsack et al., 1992; You et al., 1995; Deyhle et al., 2004). The only deviation in this area was the value observed at MV3, which was plotted on the lower side of the trend (Figure 5). This was because the B isotope ratio was extremely high in the pore water at MV3 (Figure 4; Table 6).
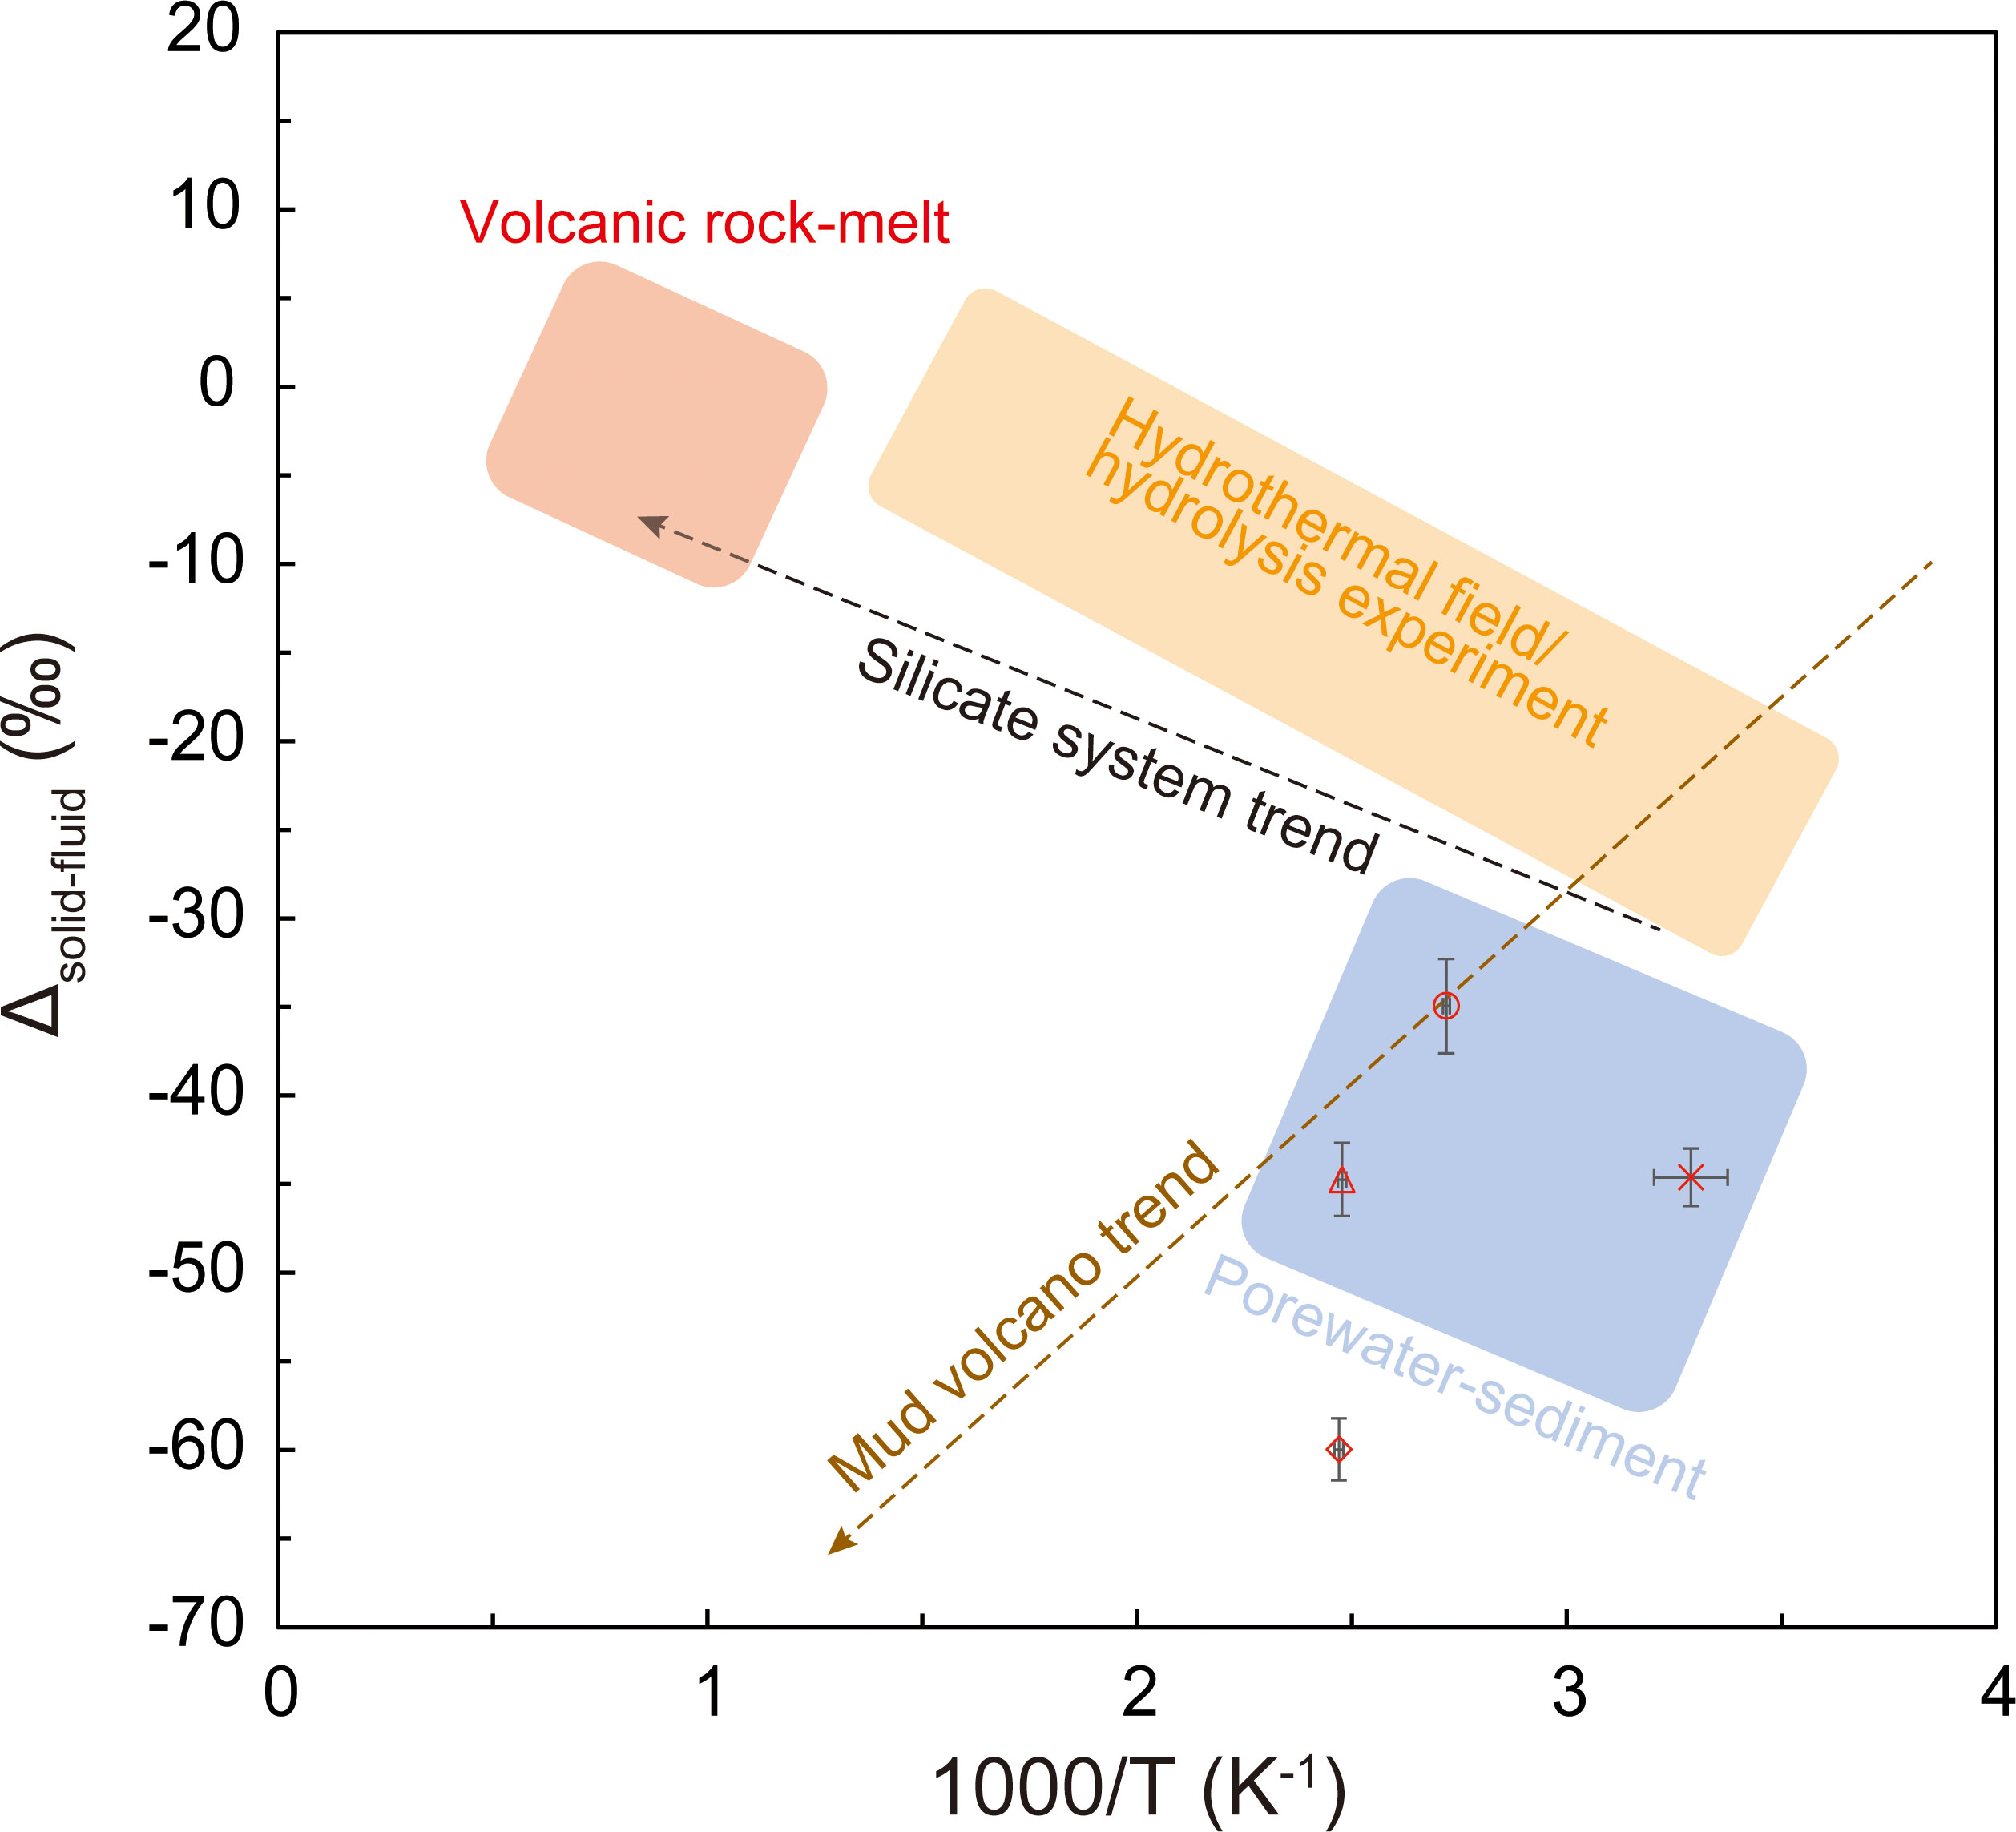
Figure 5 Relationship between the equilibrium temperature with clay minerals estimated from the Na and Li concentrations and the isotope fractionation of B isotope ratios in the sediment and pore water.
5.4 Origin of B in the pore water from MVs off Tanegashima
The reported B isotope ratios that were higher than those in seawater are limited to specific environments (Palmer and Swihart, 1996; Kopf and Deyhle, 2002; Marschall, 2018). This phenomenon is usually observed in brines formed by the evaporation of seawater: +59‰ in Australian lakes (Vengosh et al., 1991a) and +56‰ in the Dead Sea (Vengosh et al., 1991b). Laboratory experiments have confirmed this trend: when seawater evaporates, the B isotope ratio in the deposited salt ranges from +10 to +30‰, and that in the residual brine ranges from +40 to +70‰ (Vengosh et al., 1992). In this solution, the adsorption of B is considered to have occurred, and 10B is more likely to be adsorbed (Spivack et al., 1987). Another fluid with an extremely high B isotope ratio is pore water in the deep subseafloor (Marschall, 2018). At depths of 600 m below the seafloor in Hole 808, which was drilled at the tip of the Nankai Trough accretionary prism off Muroto during the ODP Leg 131, a B isotope ratio of approximately +50‰ was observed in the pore water (You et al., 1993). Additionally, a B isotope ratio of +45.9‰ was observed 874 m below the seafloor in Hole 1150, which was drilled in the forearc of the Japan Trench during ODP Leg 186 (Deyhle and Kopf, 2002). Both values are thought to be the result of advanced re-adsorption, and remarkably high values have been found in the pore water of MVs (Kopf and Deyhle, 2002). B isotope ratios in pore water reaching +65‰ were found in an MV in Taiwan (Gieskes et al., 1992), and Chao et al. (2011) also found a B isotope ratio reaching +55.8‰ in an MV in Taiwan. Considering the results of these studies, the extremely high B isotope ratio observed in this study appears to be the result of strong adsorption. Such a high B isotope ratio is considered to be one of the characteristics of B in the surface sediments of MVs (Kopf and Deyhle, 2002). The surface layers of MVs contain buried sediments and authigenic minerals that would normally be distributed deep below the seafloor (Sokol et al., 2018); B in pore water in the surface sediments of MVs exhibits extremely high B isotope ratios, suggesting that it is subject to very strong adsorption (Kopf and Deyhle, 2002). Therefore, we propose the hypothesis that these MV-specific solid phases may have the ability to strongly adsorb B in pore water.
5.5 Evaluation of MV activity using various indexes
In this study, we compared each MV using the chemical and isotopic compositions of the pore water collected from the surface sediment of the MV off Tanegashima. The estimation of advection velocity using the vertical distribution of the Cl- concentration indicates that the upward advection velocity of MV3 is an order of magnitude higher and MV3 may be the most active MV (Table 4). Estimation of the origin depth using the Na/Li concentration ratio suggests that Na and Li are supplied from clay minerals at the deepest parts of MV3 and MV2 (Table 5), indicating that compared with other MVs, these MVs were formed by the supply of a large amount of energy to migrate materials from deeper regions. This indicates relatively extensive activity. Based on these results, we suggested that MV3 is currently the most active MV. The B isotope ratio in the pore water of MV3, which was the most active, showed the highest value (Table 6). This trend is the opposite of that reported by Chao et al. (2011). MVs in Taiwan show a high B isotope ratio, although the tendency is not clear; however, the slower fluid velocity is strongly affected by re-adsorption (Chao et al., 2011). However, the results of this study are consistent with those of Kopf and Deyhle (2002), who indicated that the larger the isotopic fractionation of the B isotope ratio, the greater is the supply of B from deeper layers. The B isotope ratio in the pore water observed at the surface of the MV shows a stronger degree of adsorption in the more active MV, indicating that the clay minerals were absorbed from the deeper part. This suggests that when the MVs start to be active the B isotope ratio in the surface pore water of the MVs increases. In future studies, the number of observational cases need to be increased to thoroughly verify these regularities.
6 Conclusion
We investigated the chemical composition of pore water in sediments collected from the MVs off Tanegashima and discussed the origin depth, advection velocity, and MV activity. The advection velocity was estimated from the Cl− concentrations, and it was found to be different for each MV. The equilibrium temperature with clay minerals was estimated from Na and Li concentrations in the fresh water source, and we found that it differed for each MV, ranging from 93 to 134°C for MV1 to MV3. The Li concentration in the pore water of MV14 is almost the same as that of seawater, and we presumed that water originating from the dehydration of clay minerals is not supplied. Considering a geothermal gradient of 25°C/km, this indicates that the origin depth is approximately 3.7 to 5.5 km, suggesting that the depth corresponds to the upper crust under the seafloor. Additionally, the B isotope ratio in pore water was very high, suggesting that adsorption had a strong effect. As MV3, which is considered the most active, showed the most adsorption, we assumed that the clay minerals that migrated from deeper depths may have a stronger adsorption capacity. The trend between the isotopic fractionation of B isotope ratios in the solid and liquid phases and the equilibrium temperature with clay minerals estimated from the Na/Li ratios in the pore water is different from the usual trend between the isotopic fractionation of silicate and water and the equilibrium temperature, which is unique to mud volcanoes. Rather than functioning as a geothermometer, the pore water of an active mud volcano may be used as an indicator of extremely high B isotope ratios.
Data availability statement
The original contributions presented in the study are included in the article/Supplementary Material. Further inquiries can be directed to the corresponding author.
Author contributions
AI, TT, and RS: Conception or design of the study. YM, KA, TT, K-HS, RS, and AI: Data collection. TT: Analysis and interpretation of data. YM, KA, TT, and RS: Writing the paper. YM, KA, TT, K-HS, RS, and AI: Approval of final draft. All authors contributed to the article and approved the submitted version.
Funding
This research was supported by JSPS KAKENHI JP (18H03733 and 20H04315), NIHU Research Projects "Interdisciplinary and Integrated Studies on Local Cultures: Aiming for the Emergence of Novel Communities" and the RIHN LINKAGE Project ( No.14200145).
Acknowledgments
We express our gratitude to the captain of the R/V Hakuho-Maru, all crew members, and the NSS operations staff for their help in collecting the samples. We would like to express our gratitude for the opportunity to conduct this research. Finally, we thank Professors Orlando Vaselli and Chen-Feng You for their valuable comments on the manuscript. I would also like to thank Professor Marcelo Ketzer for his free editing work in his busy schedule.
Conflict of interest
The authors declare that the research was conducted in the absence of any commercial or financial relationships that could be construed as a potential conflict of interest.
Publisher’s note
All claims expressed in this article are solely those of the authors and do not necessarily represent those of their affiliated organizations, or those of the publisher, the editors and the reviewers. Any product that may be evaluated in this article, or claim that may be made by its manufacturer, is not guaranteed or endorsed by the publisher.
Supplementary material
The Supplementary Material for this article can be found online at: https://www.frontiersin.org/articles/10.3389/fmars.2023.1229797/full#supplementary-material
Supplementary Figure 1 | Bathymetric maps of (A) MV1, (B) MV2, (C) MV3, and (D) MV14.
References
Ashi J., Tokuyama H. (2005). Navigable sampling system -NSS- (in Japanese). Techno marine: Bull. Soc. Naval Architects Japan 127, 29–33. doi: 10.14856/technom.883.0_29
Brumsack H. J., Zuleger E., Gohn E., Murray R. W. (1992). Stable and radiogenic isotopes in pore waters from Leg 127, Japan Sea. Proc. Ocean Drilling Program Sci. Results 127, 635–650. doi: 10.2973/odp.proc.sr.127128.165.1992
Carter L., Gavey R., Talling P. J., Liu J. T. (2014). Insights into submarine geohazards from breaks in subsea telecommunication cables. Oceanography 27, 58–67. doi: 10.5670/oceanog.2014.40
Carter L., Milliman J. D., Talling P. J., Gavey R., Wynn R. B. (2012). Near-synchronous and delayed initiation of long run-out submarine sediment flows from a record-breaking river flood, offshore Taiwan. Geophysical Res. Lett. 39. doi: 10.1029/2012GL051172
Chao H., You C., Wang B., Chung C., Huang K. (2011). Boron isotopic composition of mud volcano fluids: Implications for fluid migration in shallow subduction zones. Earth Planetary Sci. Lett. 305, 32–44. doi: 10.1016/j.epsl.2011.02.033
Clift P., Vannucchi P. (2004). Controls on tectonic accretion versus erosion in subduction zones: Implications for the origin and recycling of the continental crust. Rev. Geophysics 42. doi: 10.1029/2003RG000127
Deyhle A., Kopf A. (2002). Strong B enrichment and anomalous δ11B in pore fluids from the Japan Trench forearc. Mar. Geology 183, 1–15. doi: 10.1016/S0025-3227(02)00186-X
Deyhle A., Kopf A. J. (2005). The use and usefulness of boron isotopes in natural silicate–water systems. Phys. Chem. Earth Parts A/B/C 30, 1038–1046. doi: 10.1016/j.pce.2005.04.003
Deyhle A., Kopf A., Frape S., Hesse R. (2004). Evidence for fluid flow in the Japan Trench forearc using isotope geochemistry (Cl Sr. B): Results from ODP Site 1150. Island Arc 13, 258–270. doi: 10.1111/j.1440-1738.2003.00424.x
Dickens G. R., Koelling M., Smith D. C., Schnieders L. (2007). Rhizon sampling of pore waters on scientific drilling expeditions: An example from the IODP Expedition 302, Arctic Coring Expedition (ACEX). Sci. Drilling 4, 22–25. doi: 10.5194/sd-4-22-2007
Etiope G., Feyzullayev A., Milkov A. V., Waseda A., Mizobe K., Sun C. H. (2009). Evidence of subsurface anaerobic biodegradation of hydrocarbons and potential secondary methanogenesis in terrestrial mud volcanoes. Mar. Petroleum Geology 26, 1692–1703. doi: 10.1016/j.marpetgeo.2008.12.002
Etiope G., Milkov A. V. (2004). A new estimate of global methane flux from onshore and shallow submarine mud volcanoes to the atmosphere. Environ. Geology 46, 997–1002. doi: 10.1007/s00254-004-1085-1
Feseker T., Boetius A., Wenzhöfer F., Blandin J., Olu K., Yoerger D. R., et al. (2014). Eruption of a deep-sea mud volcano triggers rapid sediment movement. Nat. Commun. 5, 5385. doi: 10.1038/ncomms6385
Fouillac C., Michard G. (1981). Sodium/lithium ratio in water applied to geothermometry of geothermal reservoirs. Geothermics 10, 55–70. doi: 10.1016/0375-6505(81)90025-0
Gavey R., Carter L., Liu J. T., Talling P. J., Hsu R., Pope E., et al. (2017). Frequent sediment density flows during 2006 to 2015, triggered by competing seismic and weather events: Observations from subsea cable breaks off southern Taiwan. Mar. Geology 384, 147–158. doi: 10.1016/j.margeo.2016.06.001
Gieskes J. M., Chen-Feng Y., Typhoon L., Tzen-Fu Y., Hsin-Wei C. (1992). Hydro-geochemistry of mud volcanoes in Taiwan. Acta Geologica Taiwanica Sci. Rep. Natl. Taiwan Univ. 30, 79–88.
Hellstrom J., Paton C., Woodhead J., Hergt J. (2008). Iolite: software for spatially resolved LA-(quad and MC) ICPMS analysis. Mineralogical Assoc. Canada short course Ser. 40, 343–348.
Hensen C., Nuzzo M., Hornibrook E., Pinheiro L., Bock B., Magalhães V., et al. (2007). Sources of mud volcano fluids in the Gulf of Cadiz - indications for hydrothermal imprint. Geochimica Cosmochimica Acta 71, 1232–1248. doi: 10.1016/j.gca.2006.11.022
Hensen C., Wallmann K., Schmidt M., Ranero C. R., Suess E. (2004). Fluid expulsion related to mud extrusion off Costa Rica—A window to the subducting slab. Geology 32, 201–204. doi: 10.1130/G20119.1
Hoshino T., Toki T., Ijiri A., Morono Y., Machiyama H., Ashi J., et al. (2017). Atribacteria from the subseafloor sedimentary biosphere disperse to the hydrosphere through submarine mud volcanoes. Front. Microbiol. 8. doi: 10.3389/fmicb.2017.01135
Ishikawa T., Nakamura E. (1993). Boron isotope systematics of marine sediments. Earth and Planetary Science Letters 117, 567–580. doi: 10.1016/0012-821X(93)90103-G
James R. H., Rudnicki M. D., Palmer M. R. (1999). The alkali element and boron geochemistry of the Escanaba Trough sediment-hosted hydrothermal system. Earth Planetary Sci. Lett. 171, 157–169. doi: 10.1016/S0012-821X(99)00140-5
Kastner M., Elderfield H., Martin J. B. (1991). Fluids in Convergent Margins: What do We Know about their Composition, Origin, Role in Diagenesis and Importance for Oceanic Chemical Fluxes? Philos. Trans. R. Soc. London. Ser. A: Phys. Eng. Sci. 335, 243–259. doi: 10.1098/rsta.1991.0045
Keeling C. D. (1958). The concentration and isotopic abundances of atmospheric carbon dioxide in rural areas. Geochimica Cosmochimica Acta 13, 322–334. doi: 10.1016/0016-7037(58)90033-4
Kioka A. (2020). Geological occurrence and morphological feature of submarine mud volcanoes: A brief review (in Japanese with English abstract). J. Geological Soc. Japan 126, 17–28. doi: 10.5575/geosoc.2019.0004
Kopanina A. V., Shvidskaya K. A. (2021). Possibility of using satellite-based monitoring for large-scale mapping and research of dynamics of mud volcanic landscapes. IOP Conf. Series: Earth Environ. Sci. 946, 012040. doi: 10.1088/1755-1315/946/1/012040
Kopf A. J. (2002). Significance of mud volcanism. Rev. Geophysics 40, 1005. doi: 10.1029/2000RG000093
Kopf A., Deyhle A. (2002). Back to the roots: boron geochemistry of mud volcanoes and its implications for mobilization depth and global B cycling. Chem. Geology 192, 195–210. doi: 10.1016/S0009-2541(02)00221-8
Lalk E., Pape T., Gruen D. S., Kaul N., Karolewski J. S., Bohrmann G., et al. (2022). Clumped methane isotopologue-based temperature estimates for sources of methane in marine gas hydrates and associated vent gases. Geochimica Cosmochimica Acta 327, 276–297. doi: 10.1016/j.gca.2022.04.013
Manga M., Brumm M., Rudolph M. L. (2009). Earthquake triggering of mud volcanoes. Mar. Petroleum Geology 26, 1785–1798. doi: 10.1016/j.marpetgeo.2009.01.019
Manheim F. T. (1966). A hydraulic squeezer for obtaining interstitial water from consolidated and unconsolidated sediments. Geological Survey Prof. Paper (United States) 550, 256–261.
Marschall H. R. (2018). “Boron isotopes in the ocean floor realm and the mantle,” in Boron isotopes: The fifth element. Eds. Marschall H., Foster G. (Cham: Springer international publishing), 189–215.
Mazzini A., Etiope G. (2017). Mud volcanism: An updated review. Earth-Science Rev. 168, 81–112. doi: 10.1016/j.earscirev.2017.03.001
Milkov A. V. (2000). Worldwide distribution of submarine mud volcanoes and associated gas hydrates. Mar. Geology 167, 29–42. doi: 10.1016/S0025-3227(00)00022-0
Mitsutome Y., Toki T., Kagoshima T., Sano Y., Tomonaga Y., Ijiri A. (2023). Estimation of the depth of origin of fluids using noble gases in the surface sediments of submarine mud volcanoes off Tanegashima Island. Sci. Rep. 13, 5051. doi: 10.1038/s41598-023-31582-z
Nakayama N., Ashi J., Tsunogai U., Gamo T., Tanahashi M. (2010). Sources of pore water in a Tanegashima mud volcano inferred from chemical and stable isotopic studies. Geochemical J. 44, 561–569. doi: 10.2343/geochemj.1.0094
Nishio Y., Ijiri A., Toki T., Morono Y., Tanimizu M., Nagaishi K., et al. (2015). Origins of lithium in submarine mud volcano fluid in the Nankai accretionary wedge. Earth Planetary Sci. Lett. 414, 144–155. doi: 10.1016/j.epsl.2015.01.018
Nishizawa A., Kaneda K., Oikawa M., Horiuchi D., Fujioka Y., Okada C. (2017). Variations in seismic velocity distribution along the Ryukyu (Nansei-Shoto) Trench subduction zone at the northwestern end of the Philippine Sea plate. Earth Planets Space 69, 86. doi: 10.1186/s40623-017-0674-7
Ohde A., Otsuka H., Kioka A., Ashi J. (2018). Distribution and depth of bottom-simulating reflectors in the Nankai subduction margin. Earth Planets Space 60, 70. doi: 10.1186/s40623-018-0833-5
Okada H., Whitaker J. H. M. (1979). Sand volcanoes of the Palaeogene Kumage Group, Tanegashima, southwest Japan (In Japanese with English abstract). J. Geological Soc. Japan 85, 187–196. doi: 10.5575/geosoc.85.187
Palmer M. R. (1991). Boron isotope systematics of hydrothermal fluids and tourmalines: A synthesis. Chem. Geology: Isotope Geosci. section 94, 111–121. doi: 10.1016/0168-9622(91)90004-G
Palmer M. R., Swihart G. H. (1996). Boron isotope geochemistry: an overview. Rev. Mineralogy Geochemistry 33, 709–744. doi: 10.1515/9781501509223-015
Paton C., Hellstrom J., Paul B., Woodhead J., Hergt J. (2011). Iolite: Freeware for the visualisation and processing of mass spectrometric data. J. Analytical Atomic Spectrometry 26, 2508–2518. doi: 10.1039/c1ja10172b
Seeberg-Elverfeldt J., Schlüter M., Feseker T., Koelling M. (2005). Rhizon sampling of pore waters near the sediment/water interface of aquatic systems. Limnology oceanography Methods 3, 361–371. doi: 10.4319/lom.2005.3.361
Seno T., Maruyama S. (1984). Paleogeographic reconstruction and origin of the Philippine Sea. Tectonophysics 102, 53–84. doi: 10.1016/0040-1951(84)90008-8
Sokol E., Kokh S., Kozmenko O., Novikova S., Khvorov P., Nigmatulina E., et al. (2018). Mineralogy and geochemistry of mud volcanic ejecta: A new look at old issues (A case study from the bulganak field, northern black sea). Minerals 8, 344. doi: 10.3390/min8080344
Spivack A. J., Edmond J. M. (1987). Boron isotope exchange between seawater and the oceanic crust. Geochimica Cosmochimica Acta 51, 1033–1043. doi: 10.1016/0016-7037(87)90198-0
Spivack A. J., Palmer M. R., Edmond J. M. (1987). The sedimentary cycle of the boron isotopes. Geochimica Cosmochimica Acta 51, 1939–1949. doi: 10.1016/0016-7037(87)90183-9
Tingay M., Manga M., Rudolph M. L., Davies R. (2018). An alternative review of facts, coincidences and past and future studies of the Lusi eruption. Mar. Petroleum Geology 95, 345–361. doi: 10.1016/j.marpetgeo.2017.12.031
Tinivella U., Giustiniani M. (2012). “An overview of mud volcanoes associated to gas hydrate system,” in Updates in volcanology—New advances in understanding volcanic systems. Ed. Karoly N. (Rijeka: Intech Open Science 225–267).
Tsunogai U., Maegawa K., Sato S., Komatsu D. D., Nakagawa F., Toki T., et al. (2012). Coseimic massive methane release from a submarine mud volcano. Earth Planetary Sci. Lett. 341–344, 79–85. doi: 10.1016/j.epsl.2012.06.004
Ujiié Y. (2000). Mud diapirs observed in two piston cores from the landward slope of the northern Ryukyu Trench, northwestern Pacific Ocean. Mar. Geology 163, 149–167. doi: 10.1016/S0025-3227(99)00113-9
Vengosh A., Chivas A. R., Mcculloch M. T., Starinsky A., Kolodny Y. (1991a). Boron isotope geochemistry of Australian salt lakes. Geochimica Cosmochimica Acta 55, 2591–2606. doi: 10.1016/0016-7037(91)90375-F
Vengosh A., Starinsky A., Kolodny Y., Chivas A. R. (1991b). Boron isotope geochemistry as a tracer for the evolution of brines and associated hot springs from the Dead Sea, Israel. Geochimica Cosmochimica Acta 55, 1689–1695. doi: 10.1016/0016-7037(91)90139-V
Vengosh A., Starinsky A., Kolodny Y., Chivas A. R., Raab M. (1992). Boron isotope variations during fractional evaporation of sea water: New constraints on the marine vs. nonmarine debate. Geology 20, 799–802. doi: 10.1130/0091-7613(1992)020<0799:BIVDFE>2.3.CO;2
Wang C.-Y., Manga M. (2021). “Mud volcanoes,” in Water and earthquakes (Cham:Springer Nature), 323–342. doi: 10.1007/978-3-030-64308-9_12
Wang B.-S., You C.-F., Huang K.-F., Wu S.-F., Aggarwal S. K., Chung C.-H., et al. (2010). Direct separation of boron from Na- and Ca-rich matrices by sublimation for stable isotope measurement by MC-ICP-MS. Talanta 82, 1378–1384. doi: 10.1016/j.talanta.2010.07.010
Williams L. B., Hervig R. L., Holloway J. R., Hutcheon I. (2001). Boron isotope geochemistry during diagenesis. Part I. Experimental determination of fractionation during illitization of smectite. Geochimica Cosmochimica Acta 65, 1769–1782. doi: 10.1016/S0016-7037(01)00557-9
Woodhead J., Swearer S., Hergt J., Maas R. (2005). In situ Sr-isotope analysis of carbonates by LA-MC-ICP-MS: interference corrections, high spatial resolution and an example from otolith studies. J. Analytical Atomic Spectrometry 20, 22–27. doi: 10.1039/b412730g
You C.-F., Chan L. H., Spivack A. J., Gieskes J. M. (1995). Lithium, boron, and their isotopes in sediments and pore waters of Ocean Drilling Program Site 808, Nankai Trough: Implications for fluid expulsion in accretionary prisms. Geology 23, 37–40. doi: 10.1130/0091-7613(1995)023<0037:LBATII>2.3.CO;2
You C. F., Gieskes J. M. (2001). Hydrothermal alteration of hemi-pelagic sediments: experimental evaluation of geochemical processes in shallow subduction zones. Appl. Geochemistry 16, 1055–1066. doi: 10.1016/S0883-2927(01)00024-5
Keywords: mud volcano, Tanegashima, pore water, boron isotope, activity
Citation: Mitsutome Y, Agena K, Toki T, Song K-H, Shinjo R and Ijiri A (2023) Assessing the activity of mud volcanism using boron isotope ratios in pore water from surface sediments of mud volcanoes off Tanegashima (SW Japan). Front. Mar. Sci. 10:1229797. doi: 10.3389/fmars.2023.1229797
Received: 27 May 2023; Accepted: 18 September 2023;
Published: 29 September 2023.
Edited by:
Marcelo Ketzer, Linnaeus University, SwedenReviewed by:
Chen-Feng You, National Cheng Kung University, TaiwanOrlando Vaselli, University of Florence, Italy
Copyright © 2023 Mitsutome, Agena, Toki, Song, Shinjo and Ijiri. This is an open-access article distributed under the terms of the Creative Commons Attribution License (CC BY). The use, distribution or reproduction in other forums is permitted, provided the original author(s) and the copyright owner(s) are credited and that the original publication in this journal is cited, in accordance with accepted academic practice. No use, distribution or reproduction is permitted which does not comply with these terms.
*Correspondence: Tomohiro Toki, toki@sci.u-ryukyu.ac.jp