Ocean mixing during Hurricane Ida (2021): the impact of a freshwater barrier layer
 Travis N. Miles
 Samuel J. Coakley1
  Johna E. Rudzin
 Scott M. Glenn
- 1Rutgers University Center for Ocean Observing Leadership, Department of Marine and Coastal Sciences, Rutgers University, New Brunswick, NJ, United States
- 2Department of Geosciences, Northern Gulf Institute, Mississippi State University, Starkville, MS, United States
- 3School of Ocean Science and Engineering, Division of Marine Science, University of Southern Mississippi, John C. Stennis Space Center, MS, United States
Tropical cyclones are one of the costliest and deadliest natural disasters globally, and impacts are currently expected to worsen with a changing climate. Hurricane Ida (2021) made landfall as a category 4 storm on the US Gulf coast after intensifying over a Loop Current eddy and a freshwater barrier layer. This freshwater layer extended from the coast to the open ocean waters south of the shelf-break of the northern Gulf of Mexico (GoM). An autonomous underwater glider sampled this ocean feature ahead of Hurricane Ida operated through a partnership between NOAA, Navy, and academic institutions. In this study we evaluate hurricane upper ocean metrics ahead of and during the storm as well as carry out 1-D shear driven mixed layer model simulations to investigate the sensitivity of the upper ocean mixing to a barrier layer during Ida’s intensification period. In our simulations we find that the freshwater barrier layer inhibited cooling by as much as 57% and resulted in enhanced enthalpy flux to the atmosphere by as much as 11% and an increase in dynamic potential intensity (DPI) of 5 m s-1 (~9.72 knots) in the 16 hours leading up to landfall. This highlights the utility of new ocean observing systems in identifying localized ocean features that may impact storm intensity ahead of landfall. It also emphasizes the northern Gulf of Mexico and the associated Mississippi River plume as a region and feature where the details of upper ocean metrics need to be carefully considered ahead of landfalling storms.
1 Introduction
Tropical cyclones (TCs) are one of the costliest and deadliest natural disasters on the planet (Smith, 2020). The ability to forecast TC intensity has improved recently (Cangialosi et al., 2020), however intensity forecast errors remain large (~12 kts at 72 hours). The primary controls of the intensity of mature TCs are vertical wind shear, dry air intrusion, and the fluxes of enthalpy and momentum between the surface ocean and atmosphere (Emanuel, 1986). Numerous studies have shown that the upper ocean can evolve rapidly beneath TCs and feedback on storm intensity (Cione and Uhlhorn, 2003; Black et al., 2007; D’Asaro et al., 2007; Zedler et al., 2009; Mrvaljevic et al., 2013; Steffen and Bourassa, 2020) among many others therein. Recent studies have focused on coastal ocean processes and their feedbacks on storm intensity, including coastal upwelling, downwelling, and enhanced shear-driven mixing (Glenn et al., 2016; Seroka et al., 2016; Miles et al., 2017; Seroka et al., 2017; Zhang et al., 2018; Dzwonkowski et al., 2021; Gramer et al., 2022), with a particular focus on highly stratified water columns. A common hurricane intensity forecasting challenge in regions with large river runoff are upper ocean salinity barrier layers (Lukas and Lindstrom, 1991; Sprintall and Tomczak, 1992; Foltz and McPhaden, 2009; Grodsky et al., 2012; Steffen and Bourassa, 2018). Generally, stratification can inhibit vertical mixing and limit entrainment of cool subsurface waters into the mixed layer during TC passage (e.g. Rudzin et al., 2018). These ocean features are found on continental shelves, near river outflows (Sengupta et al., 2008), and over the open ocean with offshore transport of freshwater (Pailler et al., 1999; Grodsky et al., 2012). Barrier layers increase the potential energy gradient, inhibit sea surface temperature (SST) cooling, and can support enhanced enthalpy fluxes into the atmosphere during hurricanes (Wang et al., 2011; Balaguru et al., 2012; Rudzin et al., 2018; Rudzin et al., 2019; Balaguru et al., 2020; Rudzin et al., 2020; Sanabia and Jayne, 2020). Only a few observations and studies have explicitly focused on the interactions of TCs passing over the Mississippi river-induced salinity barrier layer (Le Hénaff et al., 2021; John et al., 2023). This barrier layer is a product of the largest river outflow in the US from the Mississippi River, in a region where strong hurricanes make landfall and coastal communities have repeatedly been devastated by powerful landfalling hurricanes, including Hurricane Ida in the summer of 2021.
Hurricane Ida (2021) underwent rapid intensification (RI) over the warm waters of the Gulf of Mexico (GoM) (Figure 1), with an increase in maximum wind speed of 60 kts (~30 m/s) in 24 hours (Beven et al., 2022). Ida continued to intensify as it passed over the continental shelf before making landfall as a category 4 hurricane in Louisiana on August 29th (Figure 1) as the second costliest storm to make landfall in the region after Hurricane Katrina (2005); (Smith, 2020). A recent study (Zhu et al., 2022) identified that nearshore SSTs ahead of Ida were >30°C, above the mean SSTs (28.7°C) that other major hurricanes crossed over in the region. They also indicated that slow translation speeds kept the backside of the storm over these warm and fresh waters for an extended duration, contributing to Ida’s slow weakening after landfall. While there is a large body of research on freshwater plume, or salinity barrier layer, impacts on hurricane intensity there are only a few focused on the Mississippi River plume (Le Hénaff et al., 2021; John et al., 2023). Despite major hurricanes regularly transiting this region, there are limited upper ocean observations during storm events in this region. For example, in the highly dynamic region where Ida rapidly reached and maintained category 4 (Figure 1) from 27.5° to 30° N and between 91° and 88.5° W only 20 Argo floats and 252 profiles are available in the last 20 years (~13 profiles/year) during hurricane season (https://erddap.ifremer.fr/erddap/index.html).
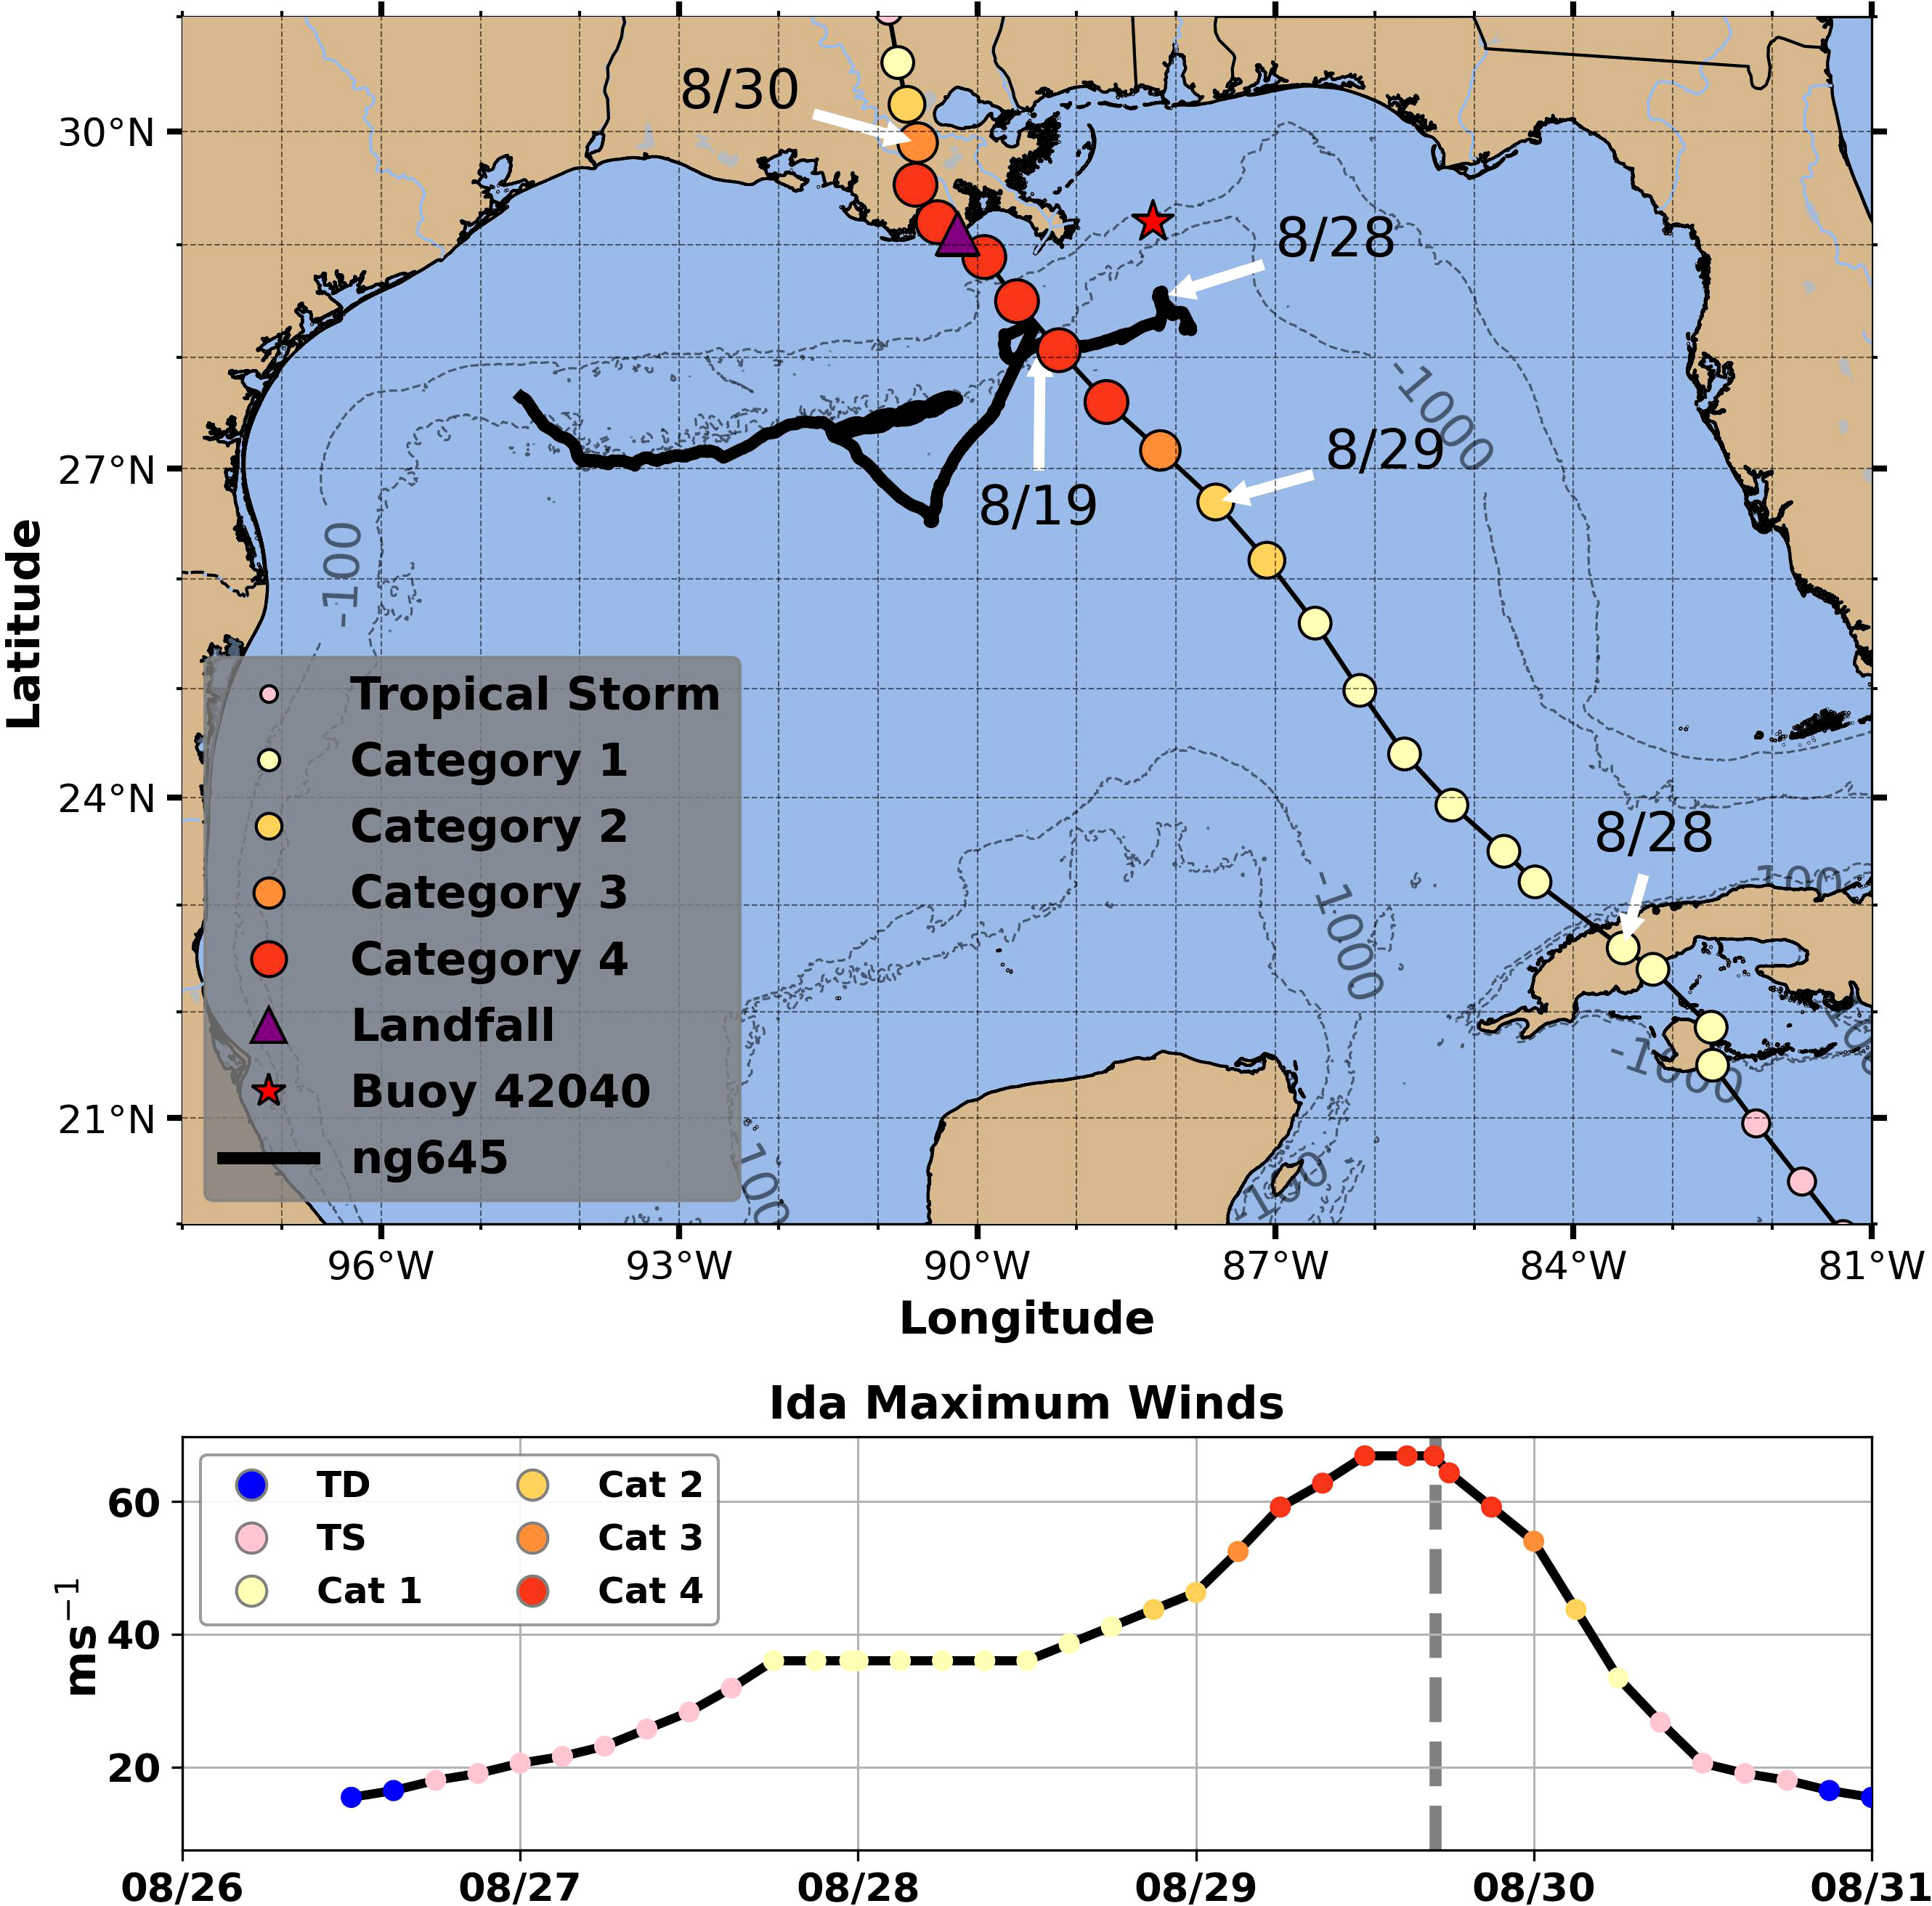
Figure 1 A map (top) of Hurricane Ida’s NHC best track with colored circles denoting the storm’s category in three-hour increments, with an additional purple triangle denoting landfall. Arrows pointing to track locations indicate Ida’s position on 8/28, 8/29, and 8/30 for reference. The black line indicates the NG645 glider track, with additional arrows indicating the glider position on 8/19 and 8/28 for reference to profiles used to initialize our PWP experiments. NDBC Buoy 42040 is represented by the red star. A time-series (bottom) of Ida’s NHC best track maximum wind speed and intensity (colored circles) as well as the storms landfall time (dashed grey line).
According to Beven et al. (2022), official forecasts for Hurricane Ida (2021) generally outperformed guidance and the previous five year mean official forecasts for the full storm period. However, few models or official forecasts captured Ida’s peak winds at landfall including as Ida rapidly intensified over the warm waters of the central GoM and fresh Mississippi River plume coastal waters (Figures 2, 3). Fortunately, as part of the 2021 Hurricane Glider Program (Miles et al., 2021) a Navy operated and NOAA coordinated autonomous underwater glider, NG645, was deployed ahead of and during Ida’s eye passage over the region (Figures 1–3). Ahead of the storm, in the deep ocean (>100m depth) just south of the GoM northern escarpment NG645 observed (Figure 2) warm sea surface temperatures, low salinity, and heat content near a threshold (60 kJ cm-2) typically conducive for intensification (Mainelli et al., 2008). The presence of the freshwater barrier layer and elevated SSTs suggest that, even with marginal ocean heat content, these ocean conditions are conducive to storm intensification. In this study we investigate upper ocean metrics for storm intensification in the region Hurricane Ida (2021) passed over, as well as the sensitivity of SST cooling to the strong vertical salinity stratification in the region ahead of landfall. To carry out this work we combine the in-situ observations from NG645 and satellite remote sensing with a 1-D mixed layer model sensitivity experiments to evaluate the impact of barrier layer presence and absence with the Price-Weller-Pinkel (PWP) model (Price et al., 1986).
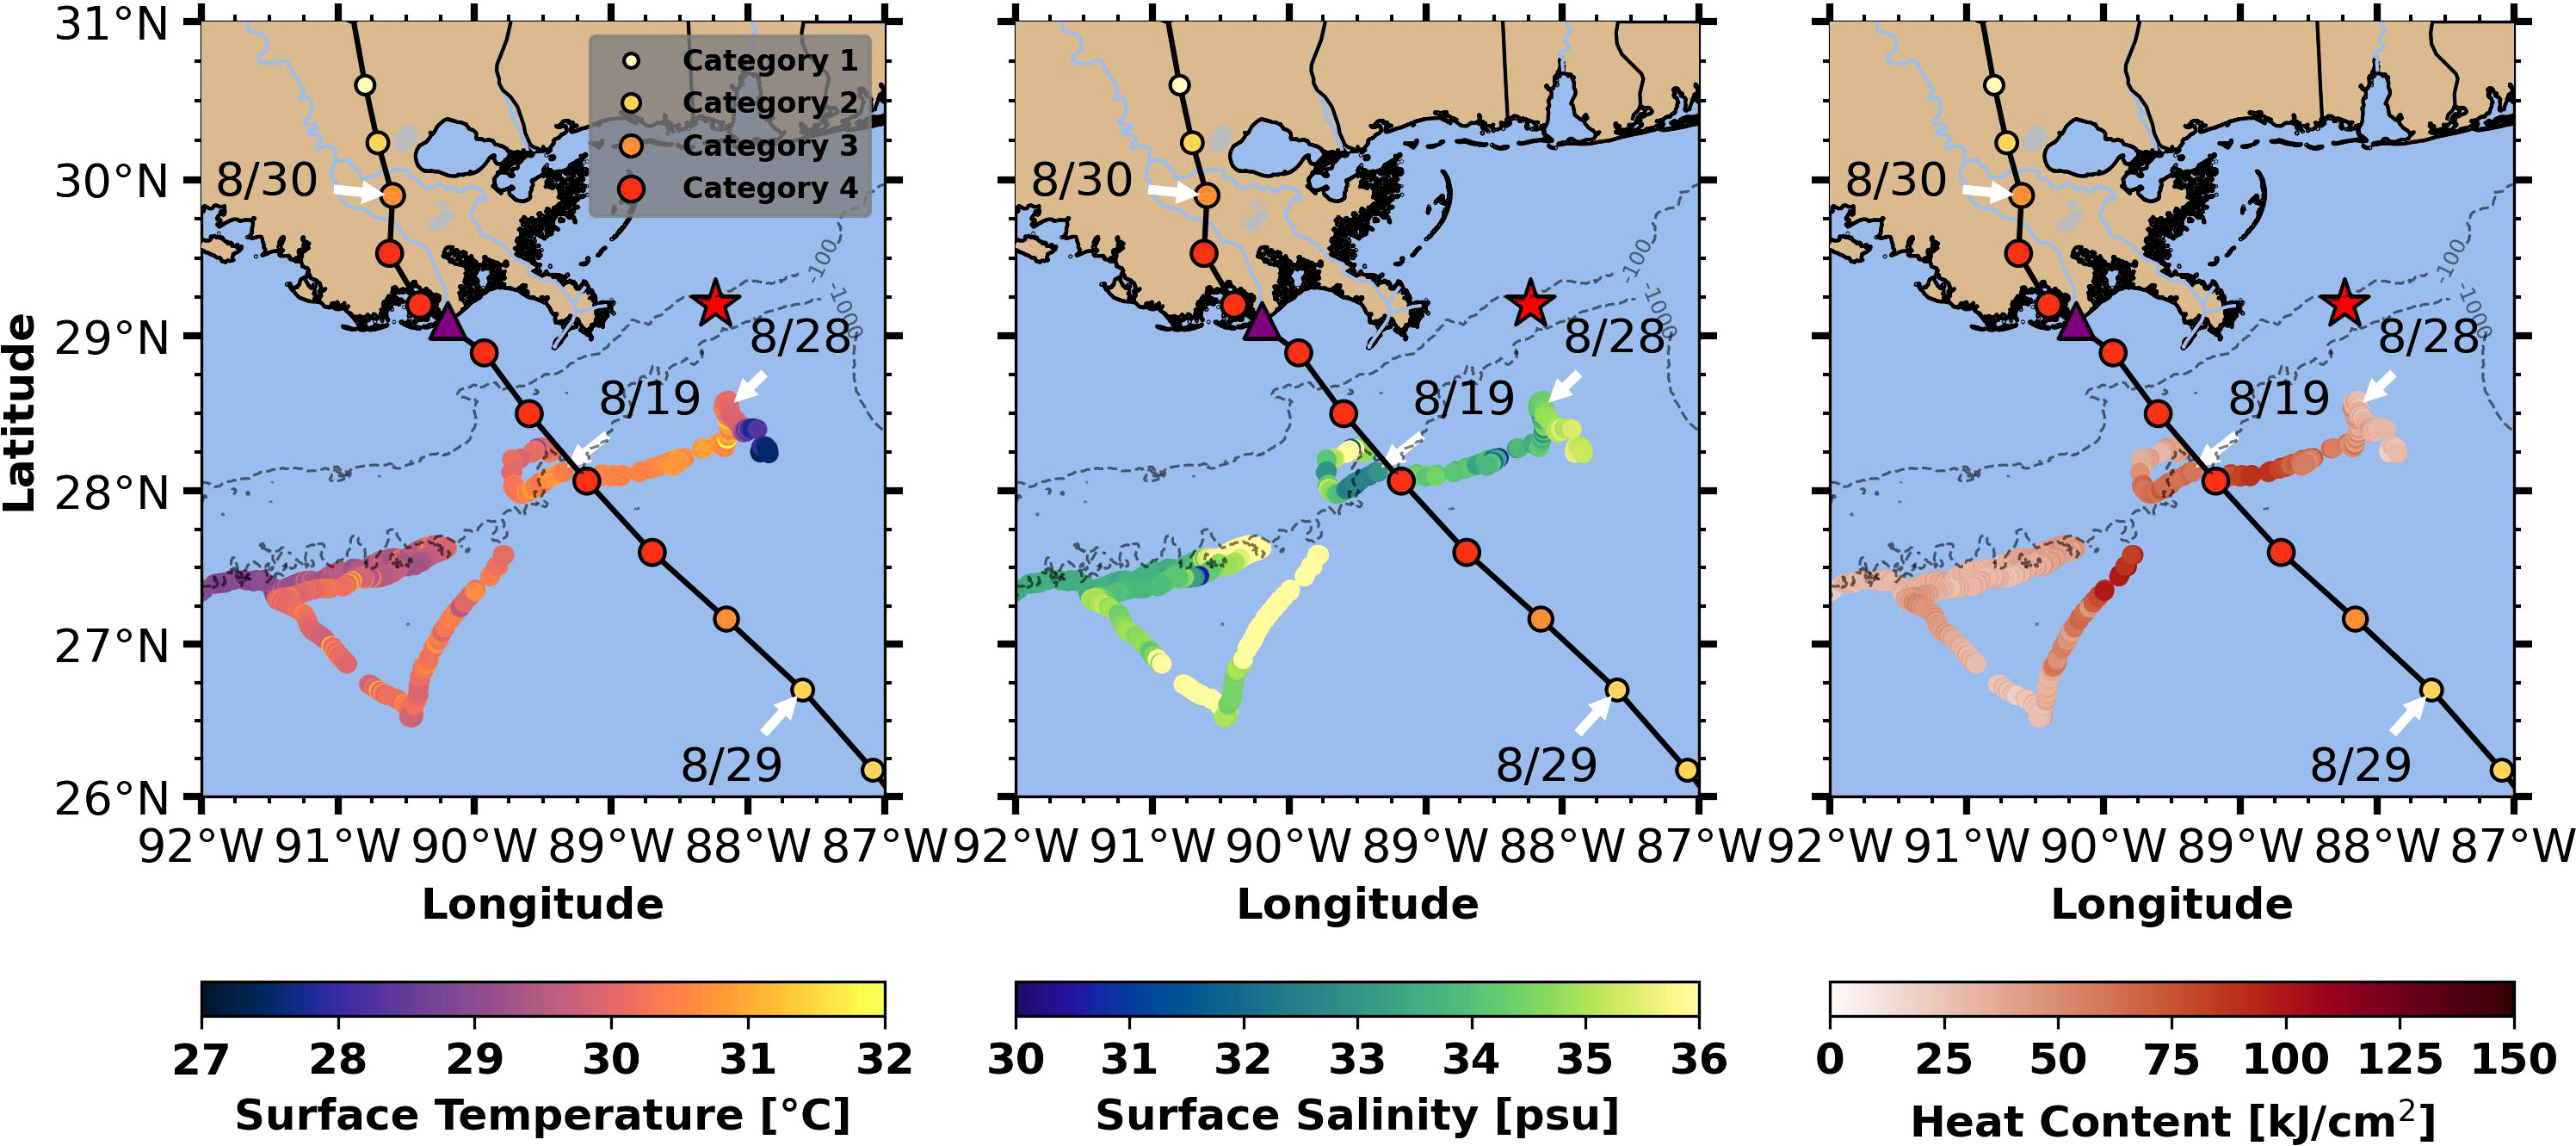
Figure 2 Maps of upper ocean metrics calculated from NG645. From left to right, scatter plot of NG645 sea surface temperature (SST), sea surface salinity (SSS), ocean heat content (OHC), respectively, represented by colored markers. Hurricane Ida’s storm track as-in Figure 1, with an additional time reference arrow at 8/29.
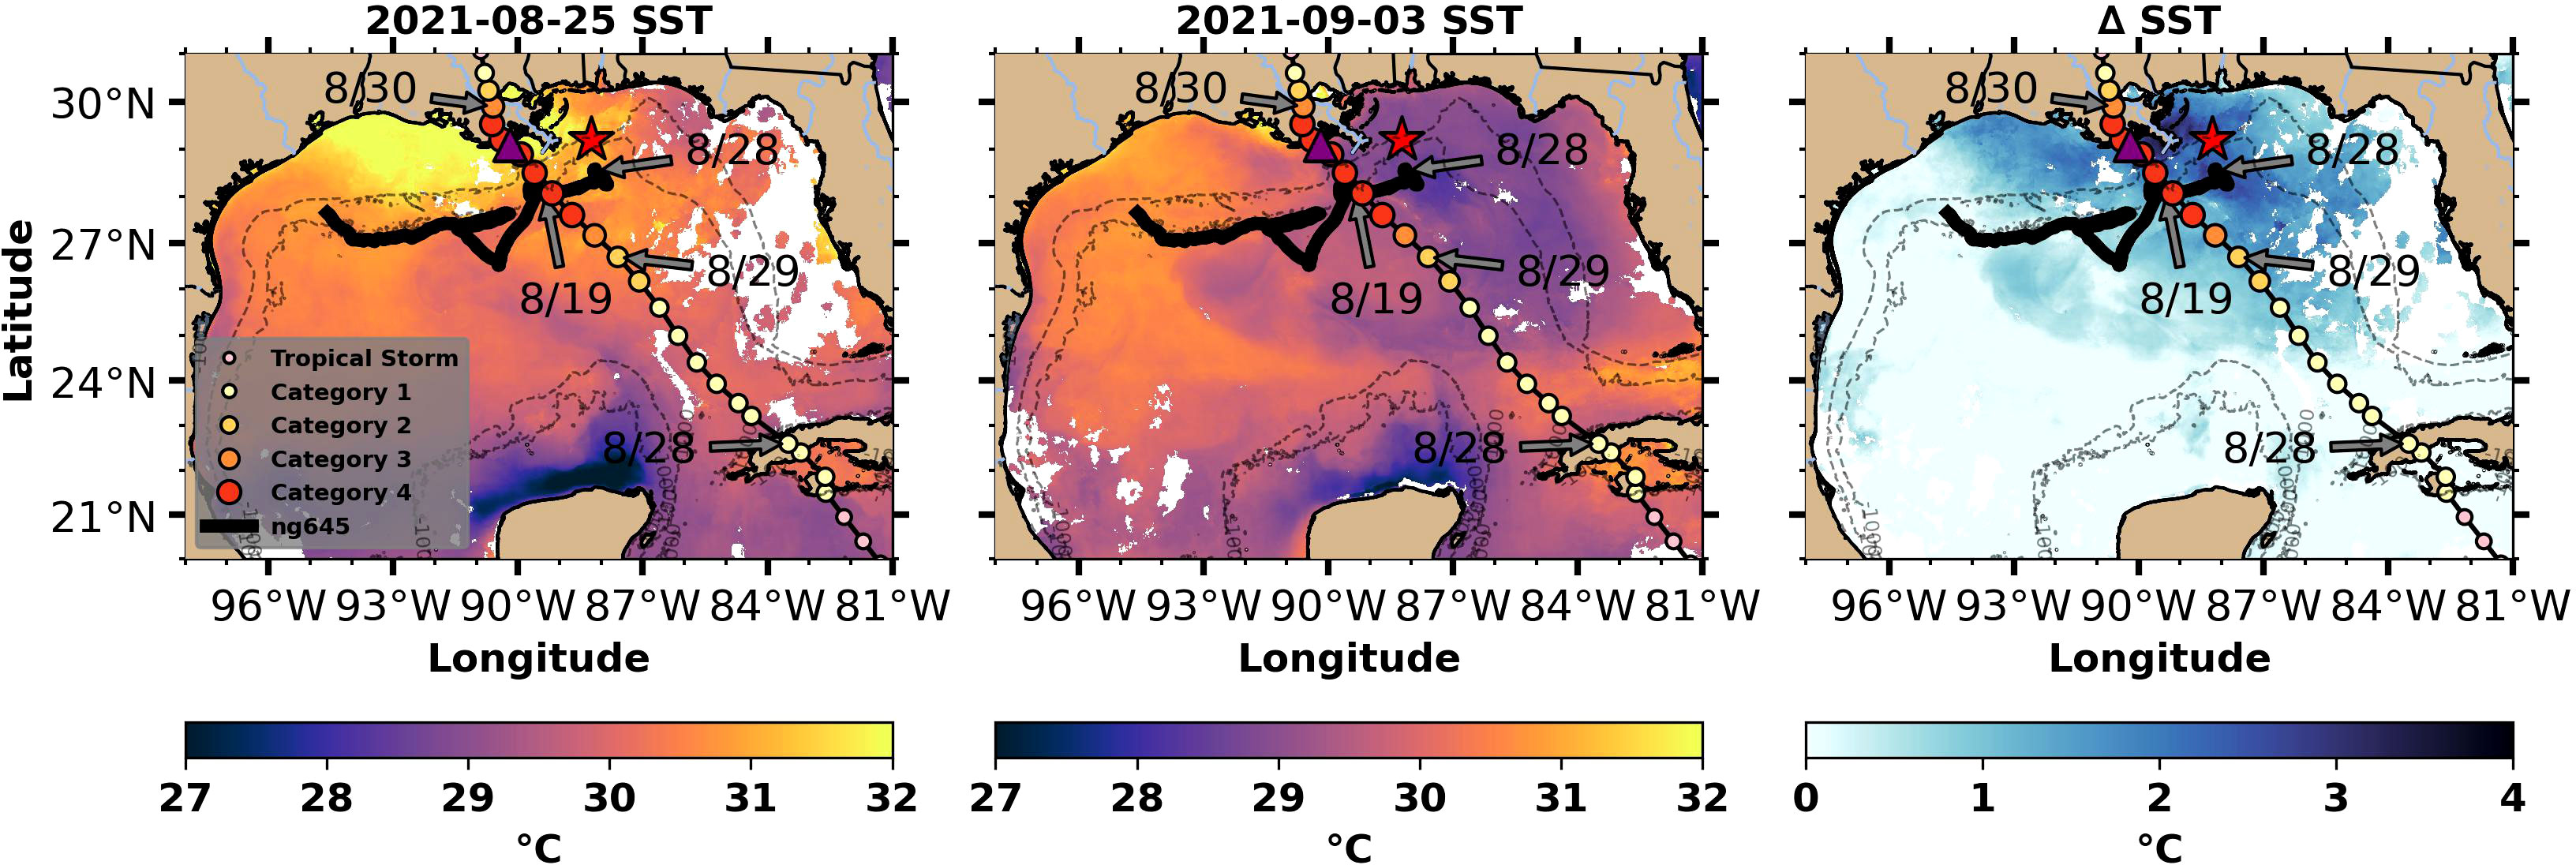
Figure 3 Maps of Sea Surface Temperature (SST) from GOES16 SST daily composite SST on 8/25 (left) and 9/3 (middle). The right panel is the difference (8/25 – 9/3) in SST with positive values indicating ocean cooling. Hurricane Ida’s storm track as-in Figure 1, with an additional time reference arrow at 8/29.
2 Methods
Ocean observations ahead of and during Hurricane Ida were obtained from Slocum glider (Schofield et al., 2007) NG645, operated by the Naval Oceanographic office in close collaboration with the Integrated Ocean Observing System (IOOS) Hurricane Glider Program. Slocum gliders are buoyancy driven uncrewed underwater vehicles that can profile vertically (up to 1000 m at ~20 cm s-1) and horizontally (~ 20 km day-1). They typically collect data at up-to 2 second intervals, resulting in high (<1m) vertical resolution. These systems have been used over the past decade to study upper ocean processes during TCs (Domingues et al., 2015; Glenn et al., 2016; Seroka et al., 2016; Miles et al., 2017; Seroka et al., 2017; Lim et al., 2020) and to provide near real-time data for assimilation into operational hurricane forecast models (Miles et al., 2021). NG645 specifically was operated as part of an agreement between NOAA and the Navy with the goal of providing real-time in-situ glider observations to improve and inform hurricane intensity forecasts.
NG645 was deployed on June 13th, 2021, offshore of the continental shelf at 27.6°N and 94.6°W. In mid-August the glider was navigated eastward south of the escarpment of the northern GoM (Figures 1–3), through the northwestern edge of a loop current eddy (LCE) and into a gap region south of the continental shelf, but north of the LCE. The glider transited in the deep (>1000 m) of water off the continental shelf for the duration of the mission. NG645 crossed ahead of Ida’s track at 89.23°W and 28.12°N on August 19th, 60 km from the shelf-break and 100 km from the nearest land point. The glider did not station keep at this location but was piloted to collect a broad swath of data further eastward before station keeping on August 27th ahead of the storm at 88.17°W and 28.57°N. The region to the east of Ida’s track was a gap region between the continental shelf to the north and the LCE to the south. In this study we present data from NG645 through August 31st, however the glider continued sampling through September 24th in further support of hurricane forecast models. NG645 was equipped with a standard Seabird Scientific, Inc. (SBE) pumped conductivity, temperature, and depth sensor (CTD), which reported data in at ~8s intervals. The Naval Oceanographic Office submitted data in near real-time and for archiving via the IOOS Glider Data Assembly Center (DAC). However, post-deployment data was not made available, thus intermittent data transmission issues resulted in periodic data gaps.
2.1 Upper ocean metrics
Upper ocean metrics relevant to hurricane intensity and salinity barrier layers were calculated from NG645 CTD data extracted from the IOOS GDAC (https://gliders.ioos.us/erddap/tabledap/index.html). This includes sea surface temperature and salinity and metrics described below starting with Ocean Heat Content (OHC). OHC, introduced by Leipper and Volgenau (1972), and used in operational hurricane forecasting is the vertical integral of heat from the 26°C isotherm to the surface calculated as:
Where =1025 kg m-3 and J kg-1°C-1 and is the depth of the 26°C isotherm. The 26°C isotherm has historically been chosen to represent average subtropical atmospheric boundary layer temperatures, implying that ocean temperatures and associated heat warmer than that value would be available for flux into the relatively cooler atmosphere during a storm event, leading to storm intensification. Mainelli et al. (2008) found that in statistical hurricane intensity predictions, OHC values greater than 60 kJ cm-2 were predictive of storm intensification, while OHC below this threshold were predictive of weakening. However, Mainelli et al. (2008) also proposed that the larger OHC was not the direct cause of storm intensification, but rather larger OHC were related to deeper warm temperatures and thus limited SST cooling throughout storms. Other OHC value thresholds have been discussed for intensification (Jaimes et al., 2016), however for simplicity we use 60 kJ cm-2 as a reference throughout this work. More recent work (Balaguru et al., 2018; Potter and Rudzin, 2021) has also shown that pre-storm SST and OHC are not always a good predictor of storm intensity, particularly when there are shallow mixed layers present. Price (2009) detailed an alternative upper ocean average temperature metric Td, where d = 100m over the deep ocean (indicated as a typical depth of mixing for a category 3 tropical cyclone) or d = the water column depth on shallow continental shelves. As NG645 was located off the continental shelf in more than 100m of water for the duration of its deployment we calculate Td metric to 100m (T100).
Price (2009) briefly discussed necessary modifications of Td for salinity stratified water columns, where mixing would not reach 100m in deep ocean cases or the bottom on continental shelves, and alternative dynamic temperature metrics (Balaguru et al., 2018) have been used to represent upper ocean temperatures down to the 26°C isotherm. To evaluate the role of salinity stratification in the case of Hurricane Ida we additionally calculate the potential energy anomaly (PEA), , which is the amount of energy required to vertically redistribute the mass of the water column from stratified to fully mixed (Simpson and Hunter, 1974; Simpson et al., 1981), represented by the equations:
In this case is equal to the 100m water depth, is the density measured at a given depth , and is the gravitational constant. We limit the PEA to the upper 100m for similar reasons as T100, e.g. we expect TC induced upper ocean mixing to be limited to water shallower than 100m. While PEA is a useful water column metric, we also calculate barrier layer thickness (BLT) as the difference between the isothermal layer depth (ILD) and mixed layer depth (MLD). Each glider profile was evaluated for the presence of a barrier layer where the MLD was defined following de Boyer Montégut et al. (2007) using the potential density:
where and are the 2m temperature and salinity, respectively. ΔT is 0.5°C. We calculated the ILD as the shallowest depth where the temperature is 0.5°C less than the , and the BLT as the distance between the ILD and the MLD. The 0.5°C criterion is larger than that used by de Boyer Montégut et al. (2007) however it is aligned with Rudzin et al. (2017), which adapted the criteria for salinity barrier layers.
2.1.1 1-D mixed layer experiments
Upper ocean mixing experiments were carried out with twin PWP model simulations at two sites to investigate the role of salinity stratification in shear-driven upper ocean mixing as Ida (2021) approached and made landfall on the Louisiana coastline. The 1-D PWP model has been used extensively to study ocean mixing during hurricane conditions (Zedler et al., 2002; Wang et al., 2011; Rudzin et al., 2018; Yang et al., 2019). The PWP model is initialized from profiles of temperature and salinity and forced with observed or idealized wind stress, freshwater surface flux, and heat flux. The bulk and gradient Richardson numbers determine mixed layer and shear stability, respectively. The model uses boundary conditions to solve a non-advective momentum equation for velocity, temperature, and salinity. During the implementation of forcing at each time-step the model will check both bulk () and gradient ( Richardson number stability criteria. If there is an instability present the water column will be iteratively mixed until the criteria are satisfied. PWP primarily includes processes and parameterizations that represent shear-induced mixing and buoyancy forcing processes, as well as rotational effects due to Coriolis, and is not designed to evaluate 3-D mixing or advective processes. Considering this limitation, we expect our model results to provide insights on the forced stage sensitivity to barrier layer presence and absence analysis of the model simulations on the ahead-of-eye forced stage and sensitivity to barrier layer presence and absence. We do not expect the PWP model to account for all upper ocean mixing and cooling processes during Ida and expect future studies to investigate those processes more broadly.
We limited external PWP model forcing to surface wind stress as in previous studies (Balaguru et al., 2020) to evaluate the isolated impact of salinity stratification on upper ocean shear-driven mixing processes. The surface wind stress was extracted in real-time from the publicly available High Resolution Rapid Refresh (HRRR) model operated by NOAA via their Operational Model Archive and Distribution System. HRRR is a 3km horizontal resolution implementation of the Weather Research and Forecasting model (Skamarock et al., 2019) updated hourly. We evaluated HRRR with the nearest National Data Buoy Center (NDBC) buoy 42040 to the northeast of Ida’s track (Figure 1). Other sites were considered, however available data were either located over land, far away from study sites or experienced data loss ahead-of and during the storm event. Evaluation of the HRRR model 10m wind speeds vs 42040 showed that the wind speed magnitudes mean bias for the longest model forcing duration (08/19 to 08/31) was 0.14 m s-1 with a correlation coefficient of 0.92. Maximum HRRR winds were 23.63 m s-1 at the buoy site, or 1.24 m s-1 faster than observed, occurring an hour and forty minutes earlier.
2.3 Enthalpy flux and dynamic potential intensity
For intercomparison of model experiments we estimate both enthalpy flux and dynamic potential intensity. Our enthalpy flux calculations are based on bulk formula as presented in Jaimes et al. (2015) and derived from numerous observational studies in high winds (Powell et al., 2003; Black et al., 2007; Zhang et al., 2008) with wind speed dependent exchange coefficients of momentum and enthalpy. Ocean properties used in bulk formula are extracted from the PWP model experiments with an assumed 98% saturation state. However, atmospheric parameters such as 10m wind speed (), air temperature Ta, and atmospheric specific humidity () are estimated from HRRR model output with an assumed relative humidity of 95%.
For an additional comparison with the PWP model output we calculate the dynamic potential intensity (DPI) (Balaguru et al., 2015; Rudzin et al., 2020) of our pre-storm glider data with and without the barrier layer included to evaluate how the influence of barrier layer presence and absence could potentially impact storm intensity. The DPI is calculated as:
Where is the average temperature of the upper ocean, is the hurricane outflow temperature at 200mb (assumed to be 221 K), is the enthalpy of air above an ocean with a temperature of , and is the specific enthalpy of air near the surface ocean. The ratio of enthalpy and drag coefficients is set to 1 for simplicity as in Rudzin et al. (2020).
Where is the MLD; is a reference density of 1025 kg m-3; is the mixing time period calculated as the radius of maximum winds of the storm divided by the storm’s translation speed (= Rmax/Uh = 1.15 hours); is the surface friction velocity calculated using the maximum wind stress from HRRR output during time t, is the von Karman constant of 0.4; is gravitational acceleration; is the vertical density stratification below the mixed layer calculated as the density gradient from the MLD to 50m below the MLD. is the forecasted mixing depth based on the initial profile and storm properties based on the Monin-Obukhov mixing length (Balaguru et al., 2015). is the temperature of the upper ocean if the passing storm homogeneously mixes the ocean down to a depth of .
2.4 Additional datasets
Sea surface temperature (SST) data from the GOES-16 (Schmit et al., 2017) geostationary satellite are used to show storm SST cooling throughout the Gulf of Mexico. Daily composites of hourly GOES-16 images were extracted from 8/25 and 09/03, the last and first clear composite images before and after the storm respectively. Hurricane Ida (2021) best track information was extracted from the International Best Track Archive for Climate Stewardship (IBTrACS) dataset (Knapp et al., 2010; Knapp et al., 2018) including position and maximum wind speeds at 3 hourly intervals, with additional reported data at landfall times.
3 Results
Hurricane Ida impacted Cuba and entered the GoM late on 08/27 and into 08/28 as a category 1 storm (Figure 1). It began to intensify over the central GoM late on 08/28, and rapidly intensified to a category 4 storm over the northern GoM and continental shelf until landfall at 08/29 16:00, gradually weakening on 08/30 as it moved inland (Figure 1). A zoomed in view of Ida’s track and intensity in relation to glider NG645’s position and pre-storm in-situ SST, salinity, and OHC are shown in Figure 2. These in-situ data show that the upper ocean was warm, and a freshwater barrier layer was present to the right of the storm track in the week prior to Ida’s passage.
SST imagery ahead of the storm (08/25) showed warm pre-storm SSTs above 30°C along the storm track (Figure 3). The first clear composite image was available approximately 4-days after landfall and showed significant cooling (Figures 3) of more than 1°C over more than 230,000 km2 of the GoM, a maximum cooling of 3.8°C on the shelf near the landfall location and 2.38°C near the glider station keeping location. Ida’s rapid intensification despite this cooling implies that a significant portion of the satellite observed SST cooling occurred after the storm’s eye-passage. We use in-situ glider data to investigate the specific timing of the cooling further.
Cross-sections (Figure 4) and derived upper ocean metrics (Figure 4) demonstrate pre-storm ocean properties during the cross-track storm survey period (08/17 – 08/27) and the ocean response to the right of the storm track during the station keeping period (08/27 – 08/31). During the pre-storm survey period the glider observed an isothermal warm (>30°C) layer extending to ~30 meters depth to the west and ahead of the storm track. As the glider progressed eastward the isothermal layer shoaled to<20 meters. In contrast, the MLD was found near the surface (<5m) because of a shallow layer of low salinity water (~ 32.5 to 34.5 PSU) aside from a brief salty surface salinity on 08/17.
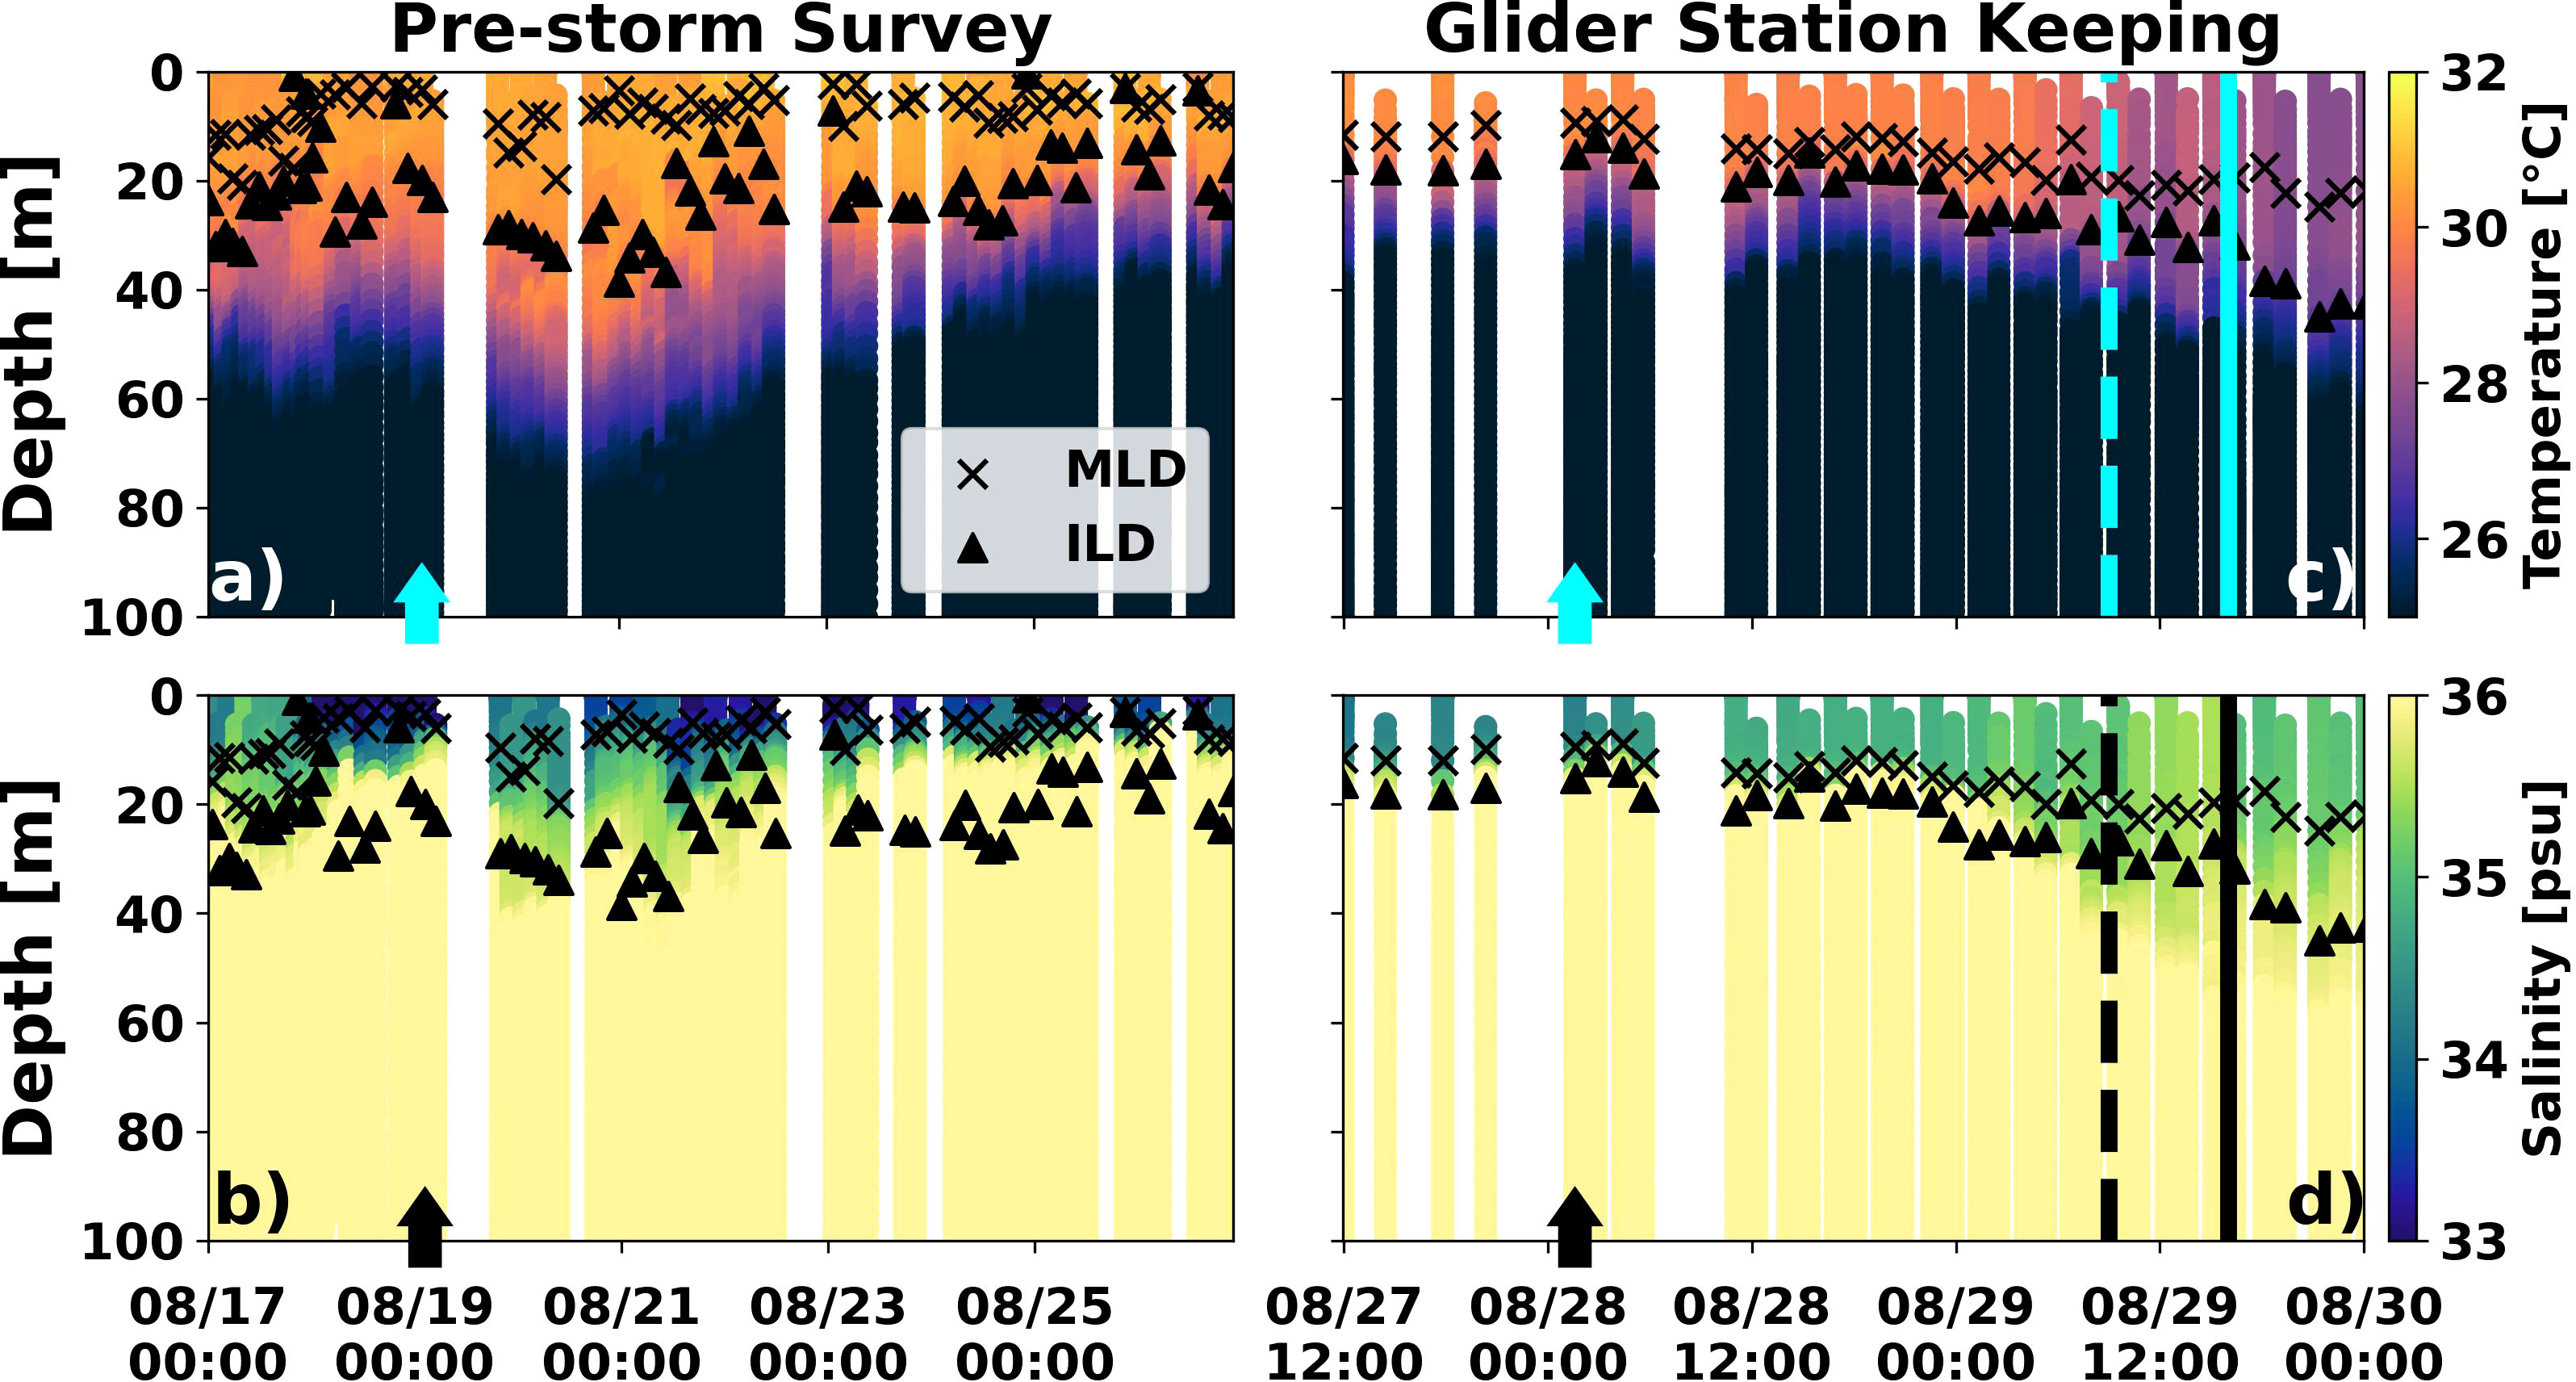
Figure 4 Glider NG645 cross-sections of temperature (A, C) and salinity (B, D) during the pre-storm survey (A, B) 8/17 to 8/27 and glider station keeping (c,d) 8/27 to 8/30 0900. MLD and ILD estimates are represented by x’s and triangles, respectively in all panels. The arrow in the pre-storm survey (A, B) on 8/19 denotes the glider profile used in PWP experiment 1, and the arrow in the glider station keeping (C, D) on 8/28 denotes the glider profile used in PWP experiment 2. The vertical lines represent the times that Hurricane Ida passed the glider (dashed line) and made landfall (solid line), respectively.
T100 showed warm average upper ocean temperatures to the west peaking at (28.2°C) and cooler temperatures to the east reaching a minimum of 23.4°C where the glider began its station keeping mission (Figure 5C). Ocean heat content (Figure 5D) had a similar pattern as T100, notably with values above the 60 kJ cm-2 threshold identified for hurricane intensification by Mainelli et al. (2008) on the western portion of the track. Observed OHC dropped below that threshold on 08/23 as the glider progressed eastward reaching a minimum of 25 kJ cm-2 as the glider started its station keeping mission. Aside from a brief dip to 400 J m-3 on 08/21 the PEA remained near 500 J m-3 throughout the pre-storm survey (Figure 5E). The consistently high PEA indicates that the water column stability was high, and the SST was not likely to cool to the full T100 value, despite the strength of the storm. For context, later in section 4 we detail the difference in PEA with and without a barrier layer as shown in (Figure 6).
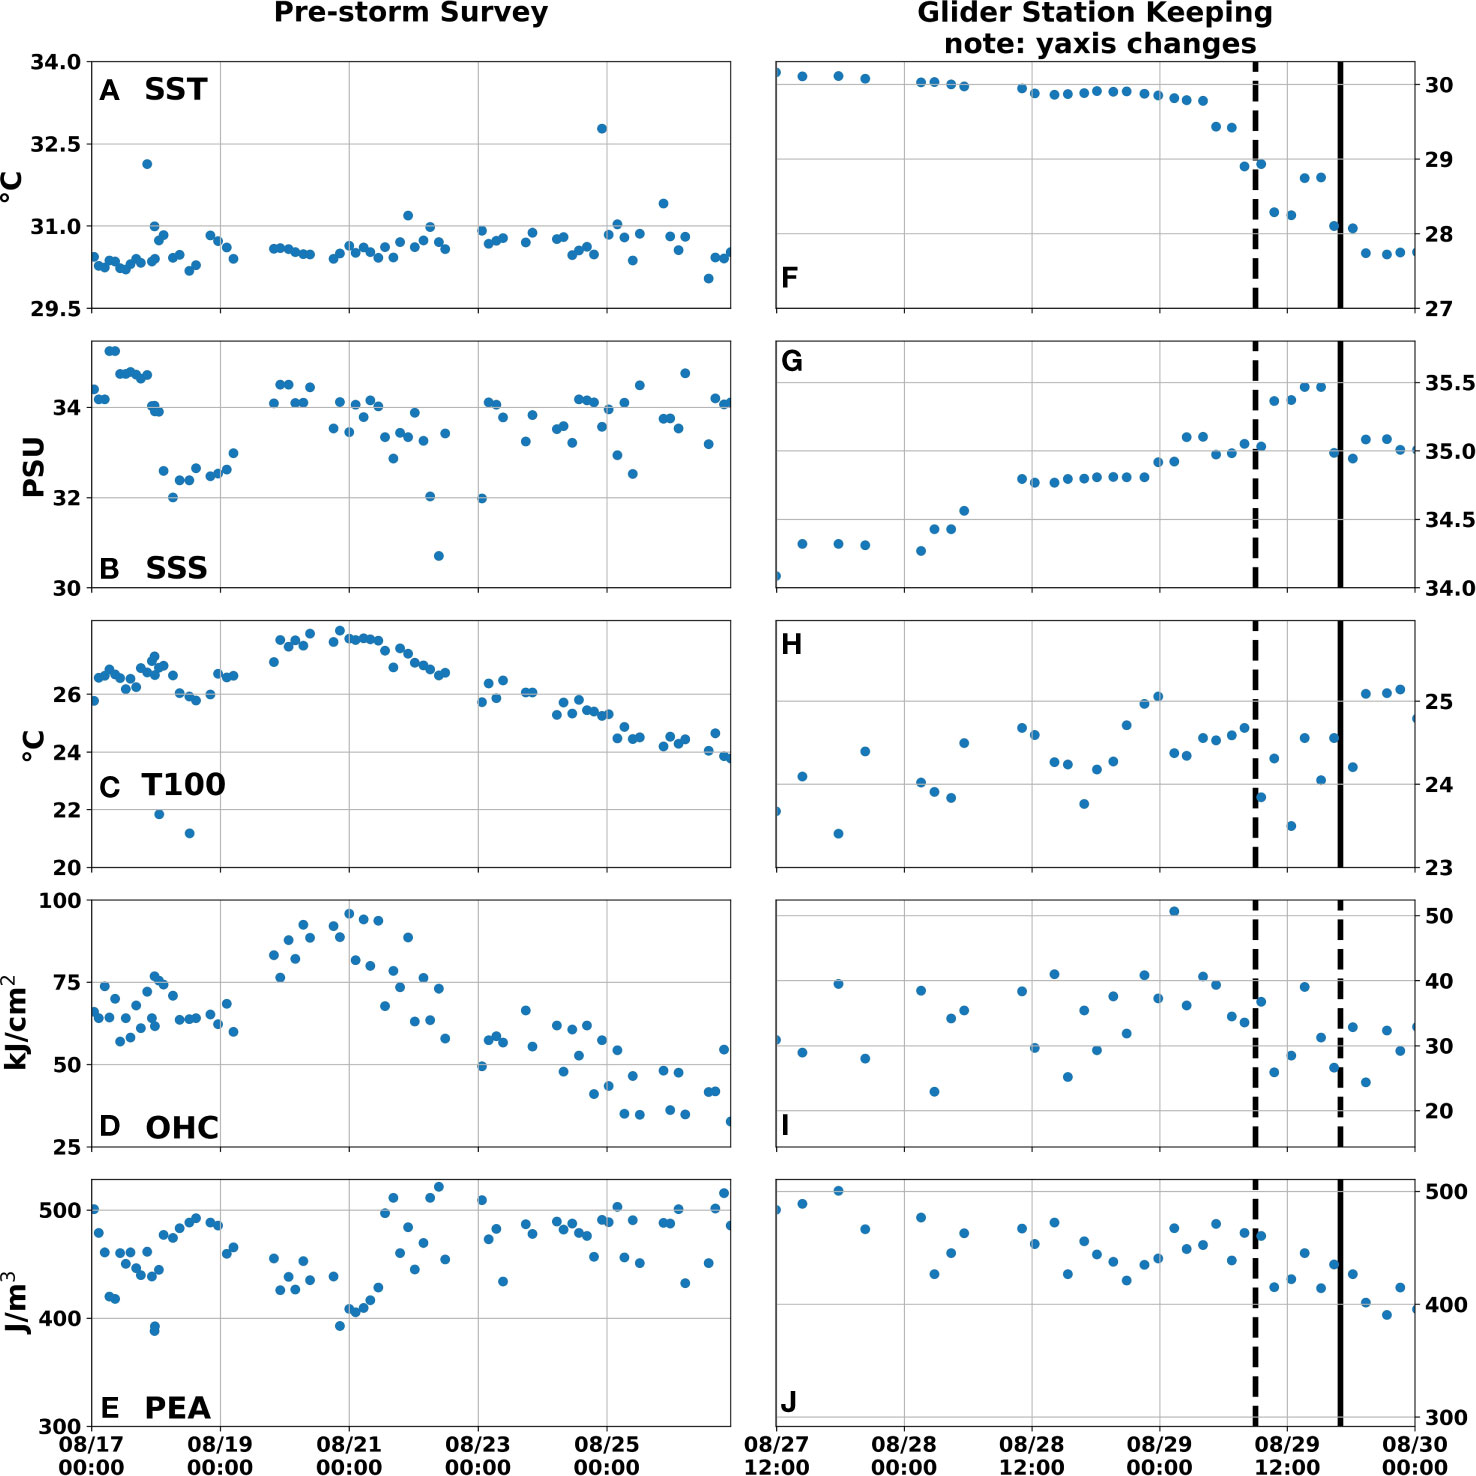
Figure 5 Upper ocean metrics derived from NG645 data split into pre-storm survey (A–E) 8/17 to 8/27 and glider station keeping (F–J) 8/27 to 8/30. SST (A,F), SSS (B, G), T100 (C, H), OHC (D, I), and PEA (E, J). Note the glider station keeping y-axis differs from the pre-storm survey. The vertical lines represent the times when Hurricane Ida passed the glider (dashed line) and made landfall (solid line), respectively.
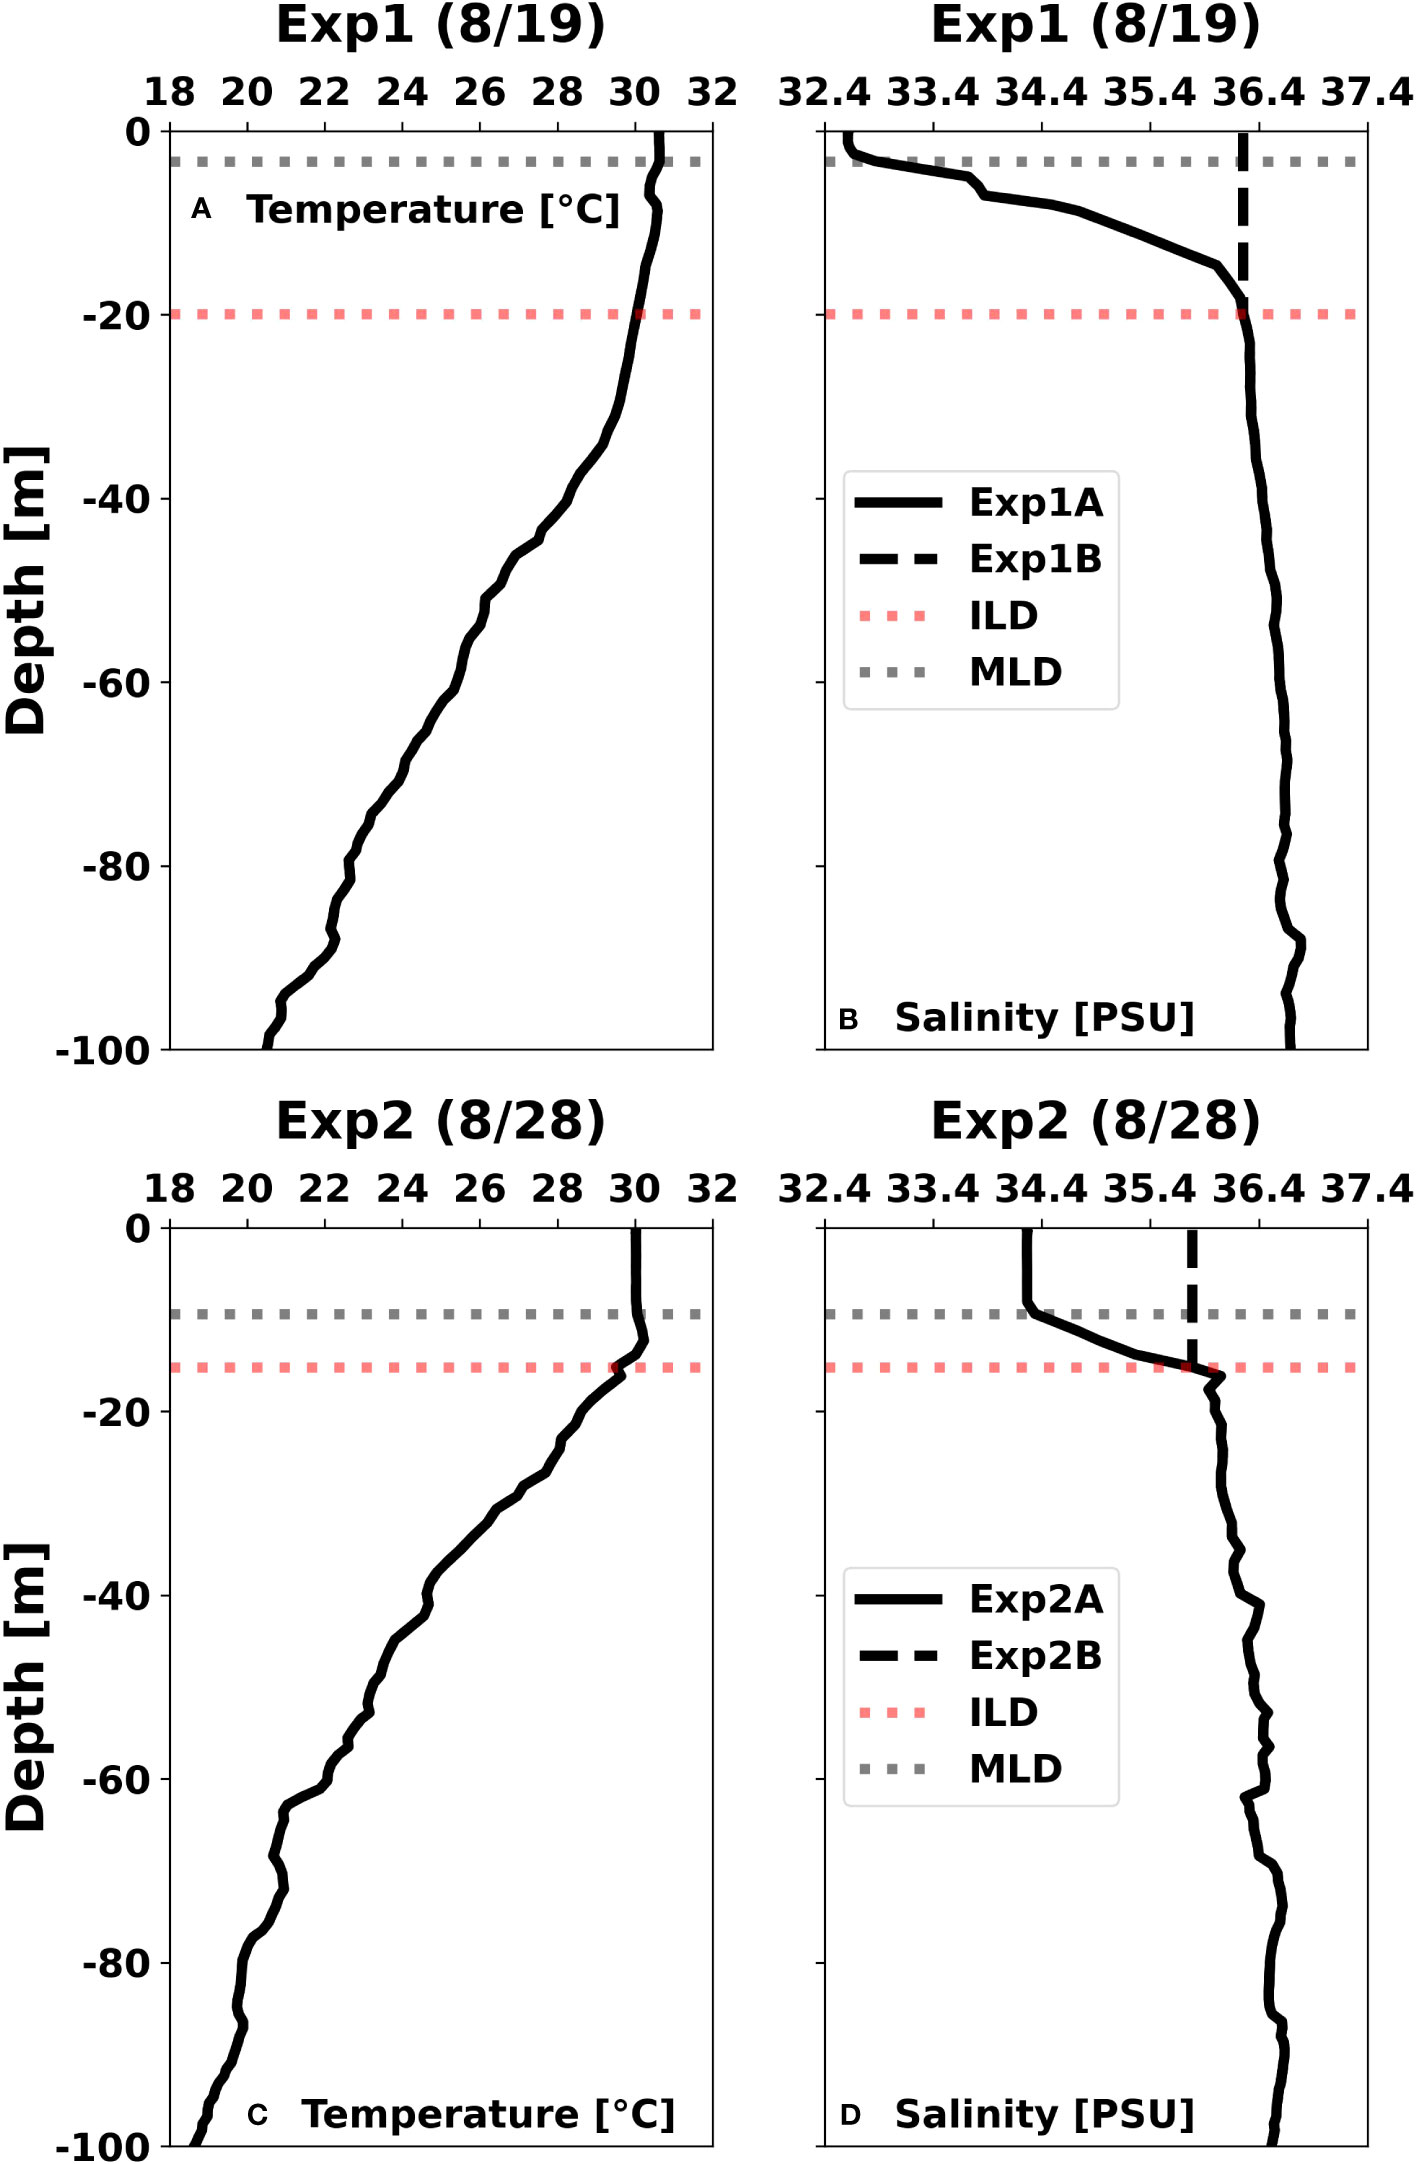
Figure 6 Initial profiles of temperature (A, C) and salinity (B, D) from Glider NG645 on 8/19 and 8/28 used to initalize PWP experiments 1 (A, B) and 2 (B, C). Panel a shows the initial temperature profiles from 8/19 for Exp1A and Exp1B. Panel b) shows the initial salinity profiles from 8/19 for Exp1A inclusive of the barrier layer (solid black line) and Exp1B - barrier layer removed (dashed black line). Panel c shows the initial temperature profiles from 8/28 for Exp2A and Exp2B. (D) shows the initial salinity profiles from 8/28 for Exp2A inclusive of the barrier layer (solid black line) and Exp2B - barrier layer removed (dashed black line). In all panels, the dashed gray line and dashed red line represent the MLD and ILD, respectively.
During the station keeping period the glider showed that the upper ocean cooled, increased in salinity, and both the ILD and MLD deepened throughout and following the storm event (Figures 5F–J). From 8/28 to eye-passage and landfall the SST cooled by 1.1°C and 1.96°C, respectively. This represents less than half of the satellite observed ocean cooling by eye-passage, and 82% by landfall. Sea surface salinity only experienced a small increase of 0.44 PSU for a brief period between eye-passage and landfall (Figure 5G). The MLD and ILD deepened from ~5m to ~20m and ~18m to ~30m. T100 and OHC experienced negligible changes throughout the storm mixing period (Figures 5H, I), while PEA dropped almost 100 J m-3 from the station keeping period to landfall and continued to drop to 350 J m-3 following landfall (Figure 5J). The minimal changes in T100 and OHC paired with a large drop in PEA suggest ocean mixing processes were first breaking down the upper ocean salinity stratification before accessing deeper cold subsurface waters. We evaluate this with the 1-D PWP model in the following section.
3.1 PWP model simulations
We carry out four 1-D model mixing experiments using the PWP model to evaluate sensitivity of upper ocean temperatures to the presence and absence of the salinity barrier layer. We initialized the PWP model with temperature and salinity profiles extracted from the pre-storm glider data at two locations and times (Figure 6). Specifically, 08/19 ~02:00 where NG645 crossed ahead of Ida’s future track, and 08/28 00:00 as NG645 was station keeping to the right of the storm track (Figures 1–3). We selected these two sites to focus on 1) the region of high salinity stratification directly beneath the storms track and 2) the region to the right of the track where the glider was located throughout the storm event.
Twin model experiments for each site included cases with the barrier layer removed at each study site. Initial profiles of temperature and salinity from the glider and calculated ILD and MLDs are presented in Figure 6 at each site. At both sites the initial surface temperatures were >30°C. At the along-track site (Figures 6A, B) the MLD and ILD were at 3.29m and 19.9m, respectively resulting in a 16.61m BLT. Salinity above the MLD was at 32.5 PSU and increased to 36.3 PSU at the ILD. At the glider station keep location (Figures 6C, D) the initial MLD was deeper at 9.36m and ILD shallower at 15.17m, resulting in a smaller barrier layer of 5.81m. Salinity above the MLD was 34.4 PSU and increased to 35.79 PSU at the ILD. To remove the barrier layer at both sites we extrapolated the salinity from the ILD to the sea surface as in Wang et al. (2011). Experiment 1A (Exp1A) and 1B (Exp1B) were carried out with the initial profiles from the along-track site, while experiment 2A (Exp2A) and 2B (Exp2B) were carried out with initial profiles from NG645’s station keeping location. B experiments used extrapolated salinity to artificially remove the barrier layer as shown in Figures 6B, D.
Wind speeds extracted from the HRRR model at each study location are shown in Figure 7. Winds at both locations rapidly increased late on 8/28 and through 8/29 reaching a first peak just ahead of eye-passage at 8/29 08:00. Winds at the glider station-keep location used in Exp2A and Exp2B steadily decreased following this peak, while at the along-track site used in Exp1A and Exp1B winds dropped dramatically as the eye-passed and reached a second, higher, peak of over 30 m s-1 from the back side of the storm just before it made landfall. Wind speeds then dramatically weakened as the storm moved inland.
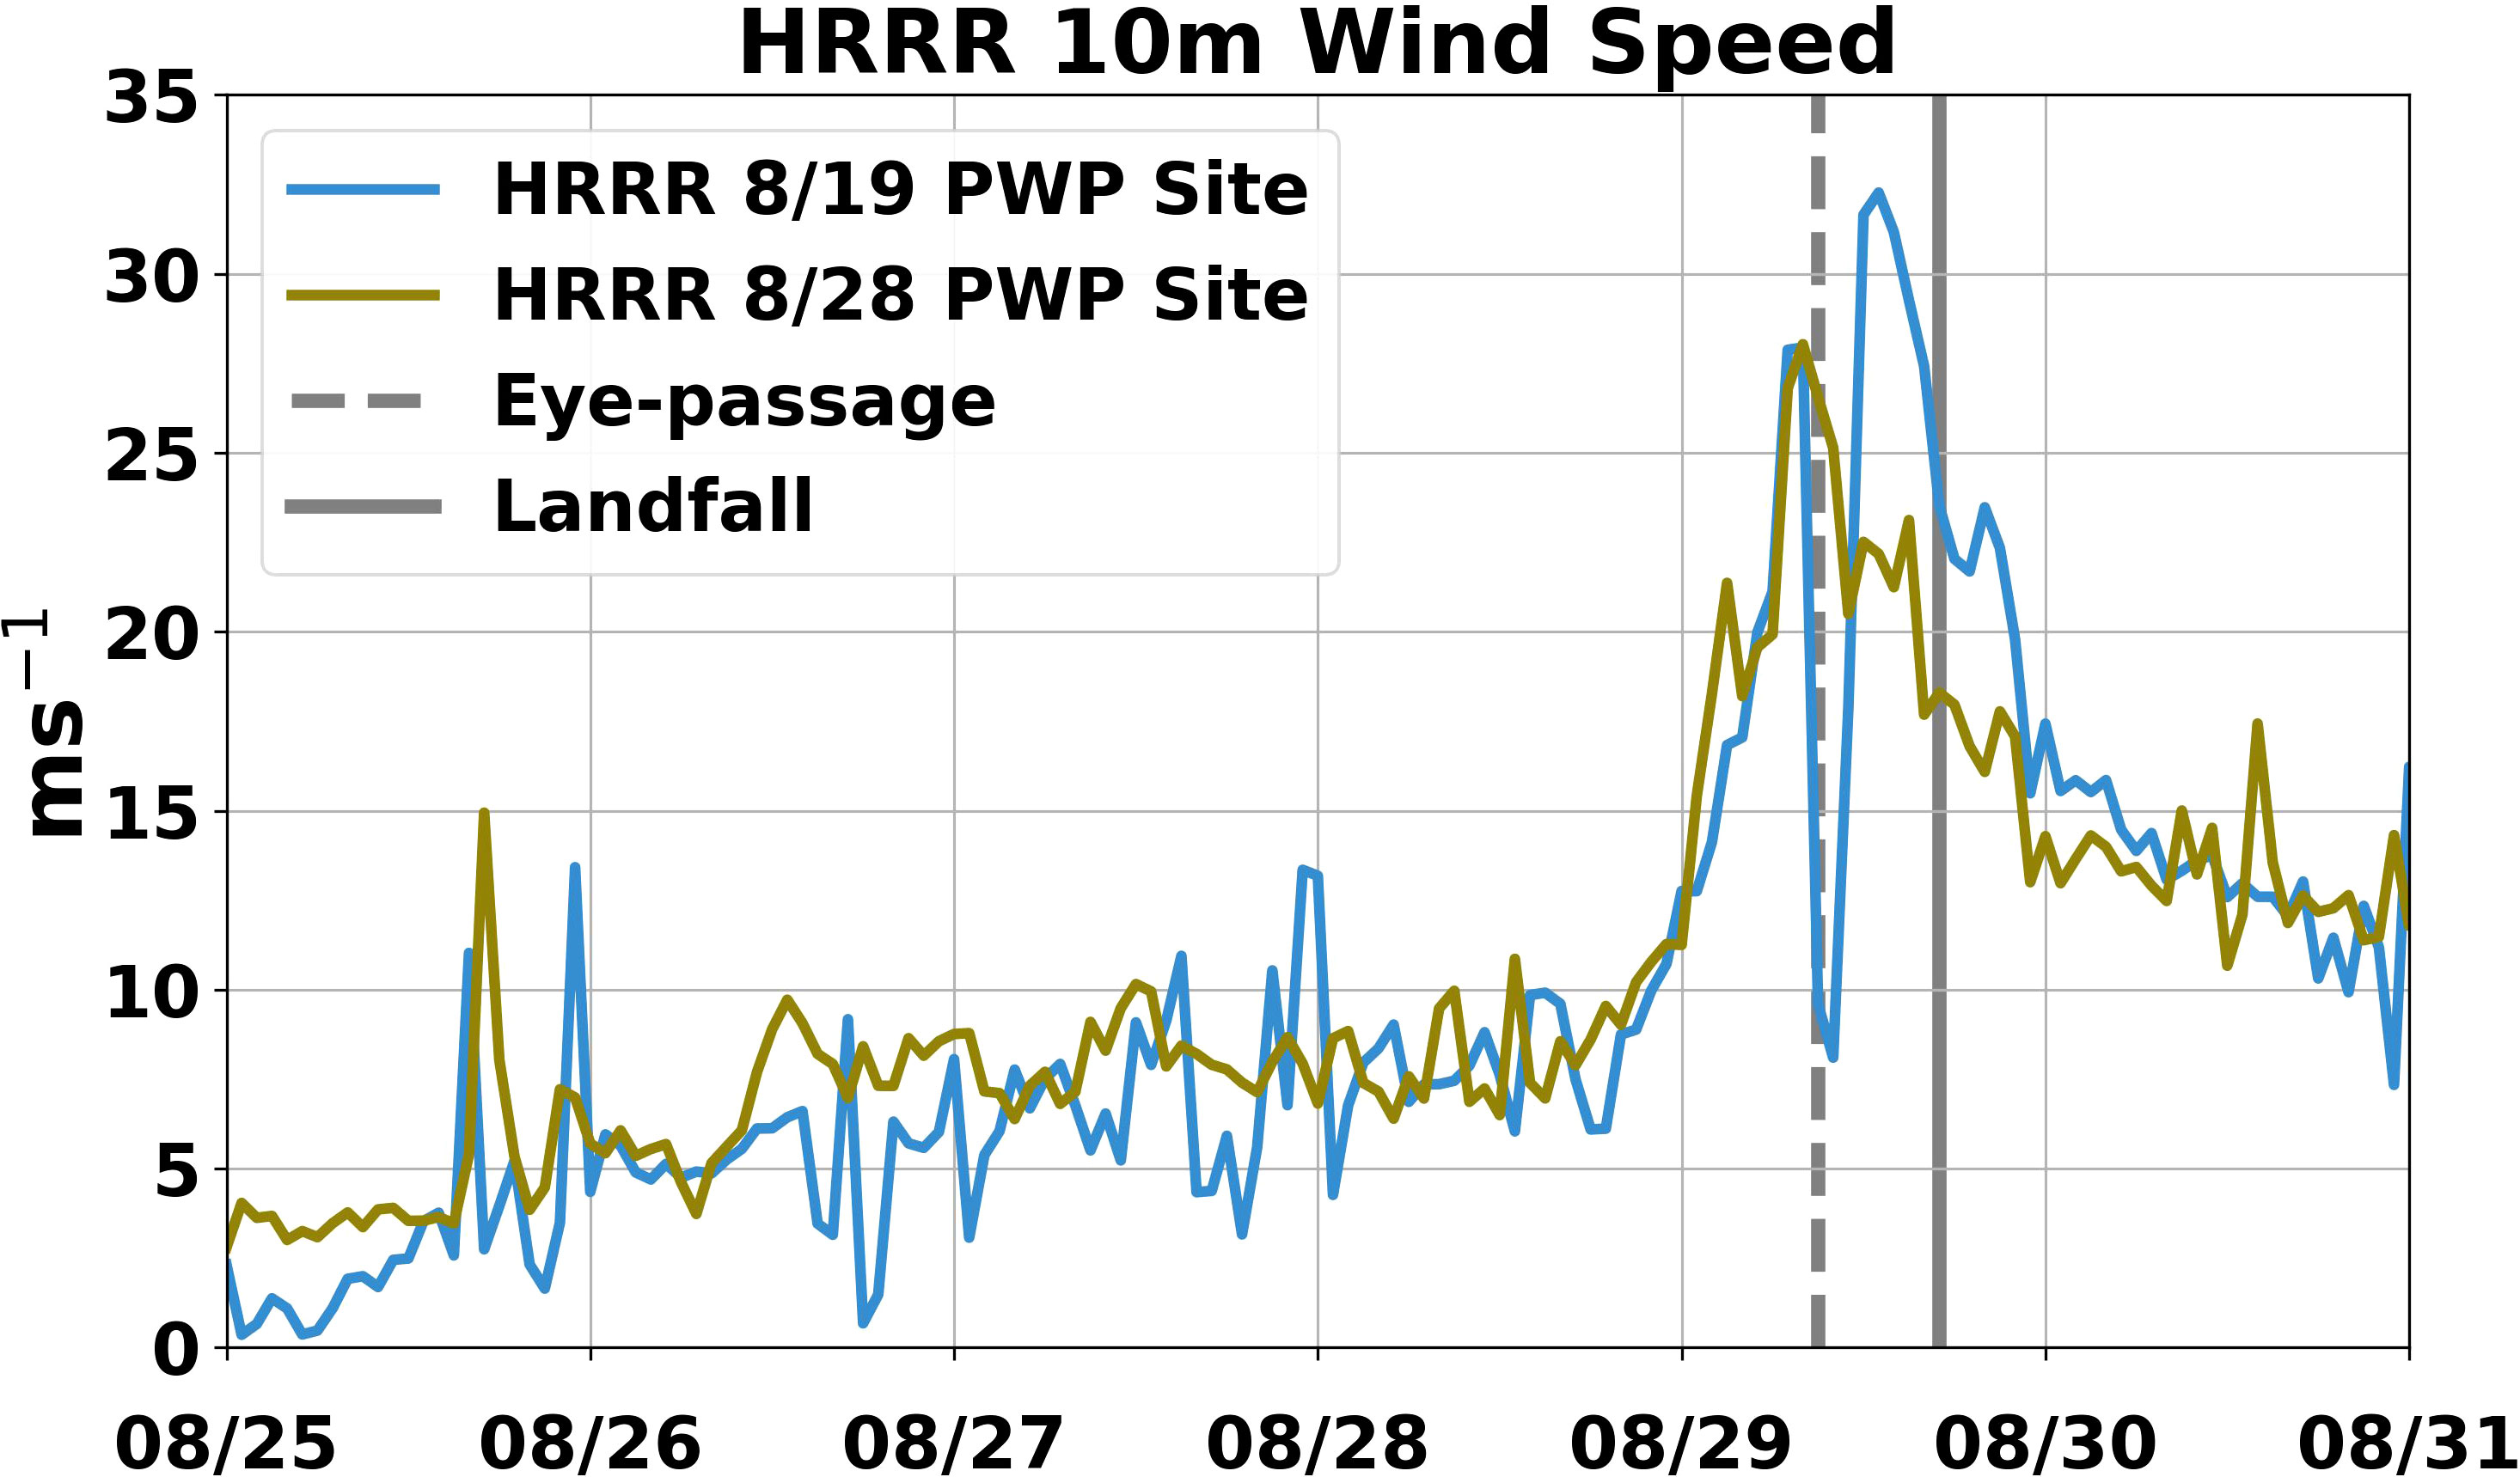
Figure 7 10m HRRR windspeeds extracted from the 8/19 Exp1 study-site (blue) and 8/28 Exp2 study-site (brown) used to force PWP simulations. The vertical lines represent the times at which Hurricane Ida’s eye-passage (dashed line) and landfall (solid line).
PWP model results for Exp1A and Exp1B are presented in Figures 8, 9. Minimal upper ocean mixing occurred during the first 6 days of the simulation thus we present results starting on 8/25 through when Ida was downgraded to a tropical storm. The upper ocean in Exp1B, with the barrier layer removed, cooled earlier and the ILD and MLD reached deeper depths than Exp1A. In Exp1A SSTs were reduced by 0.19°C at eye-passage and a total of 0.44°C by landfall. ILD and MLD reached 38m and 34m, respectively (Figures 8A, C). In Exp1B SSTs were reduced by 0.4°C at eye-passage and a total of 0.71°C by landfall. The ILD and MLD reached 44m and 41m, respectively (Figures 8B, D). With the barrier layer removed, SST cooled by an additional 0.21°C by eye-passage and 0.27°C by landfall (Figure 9B). Inclusion of the barrier layer resulted in an additional 7% cumulative enthalpy flux to the atmosphere over the 16 hours from 8/29 to landfall (Figure 9D).
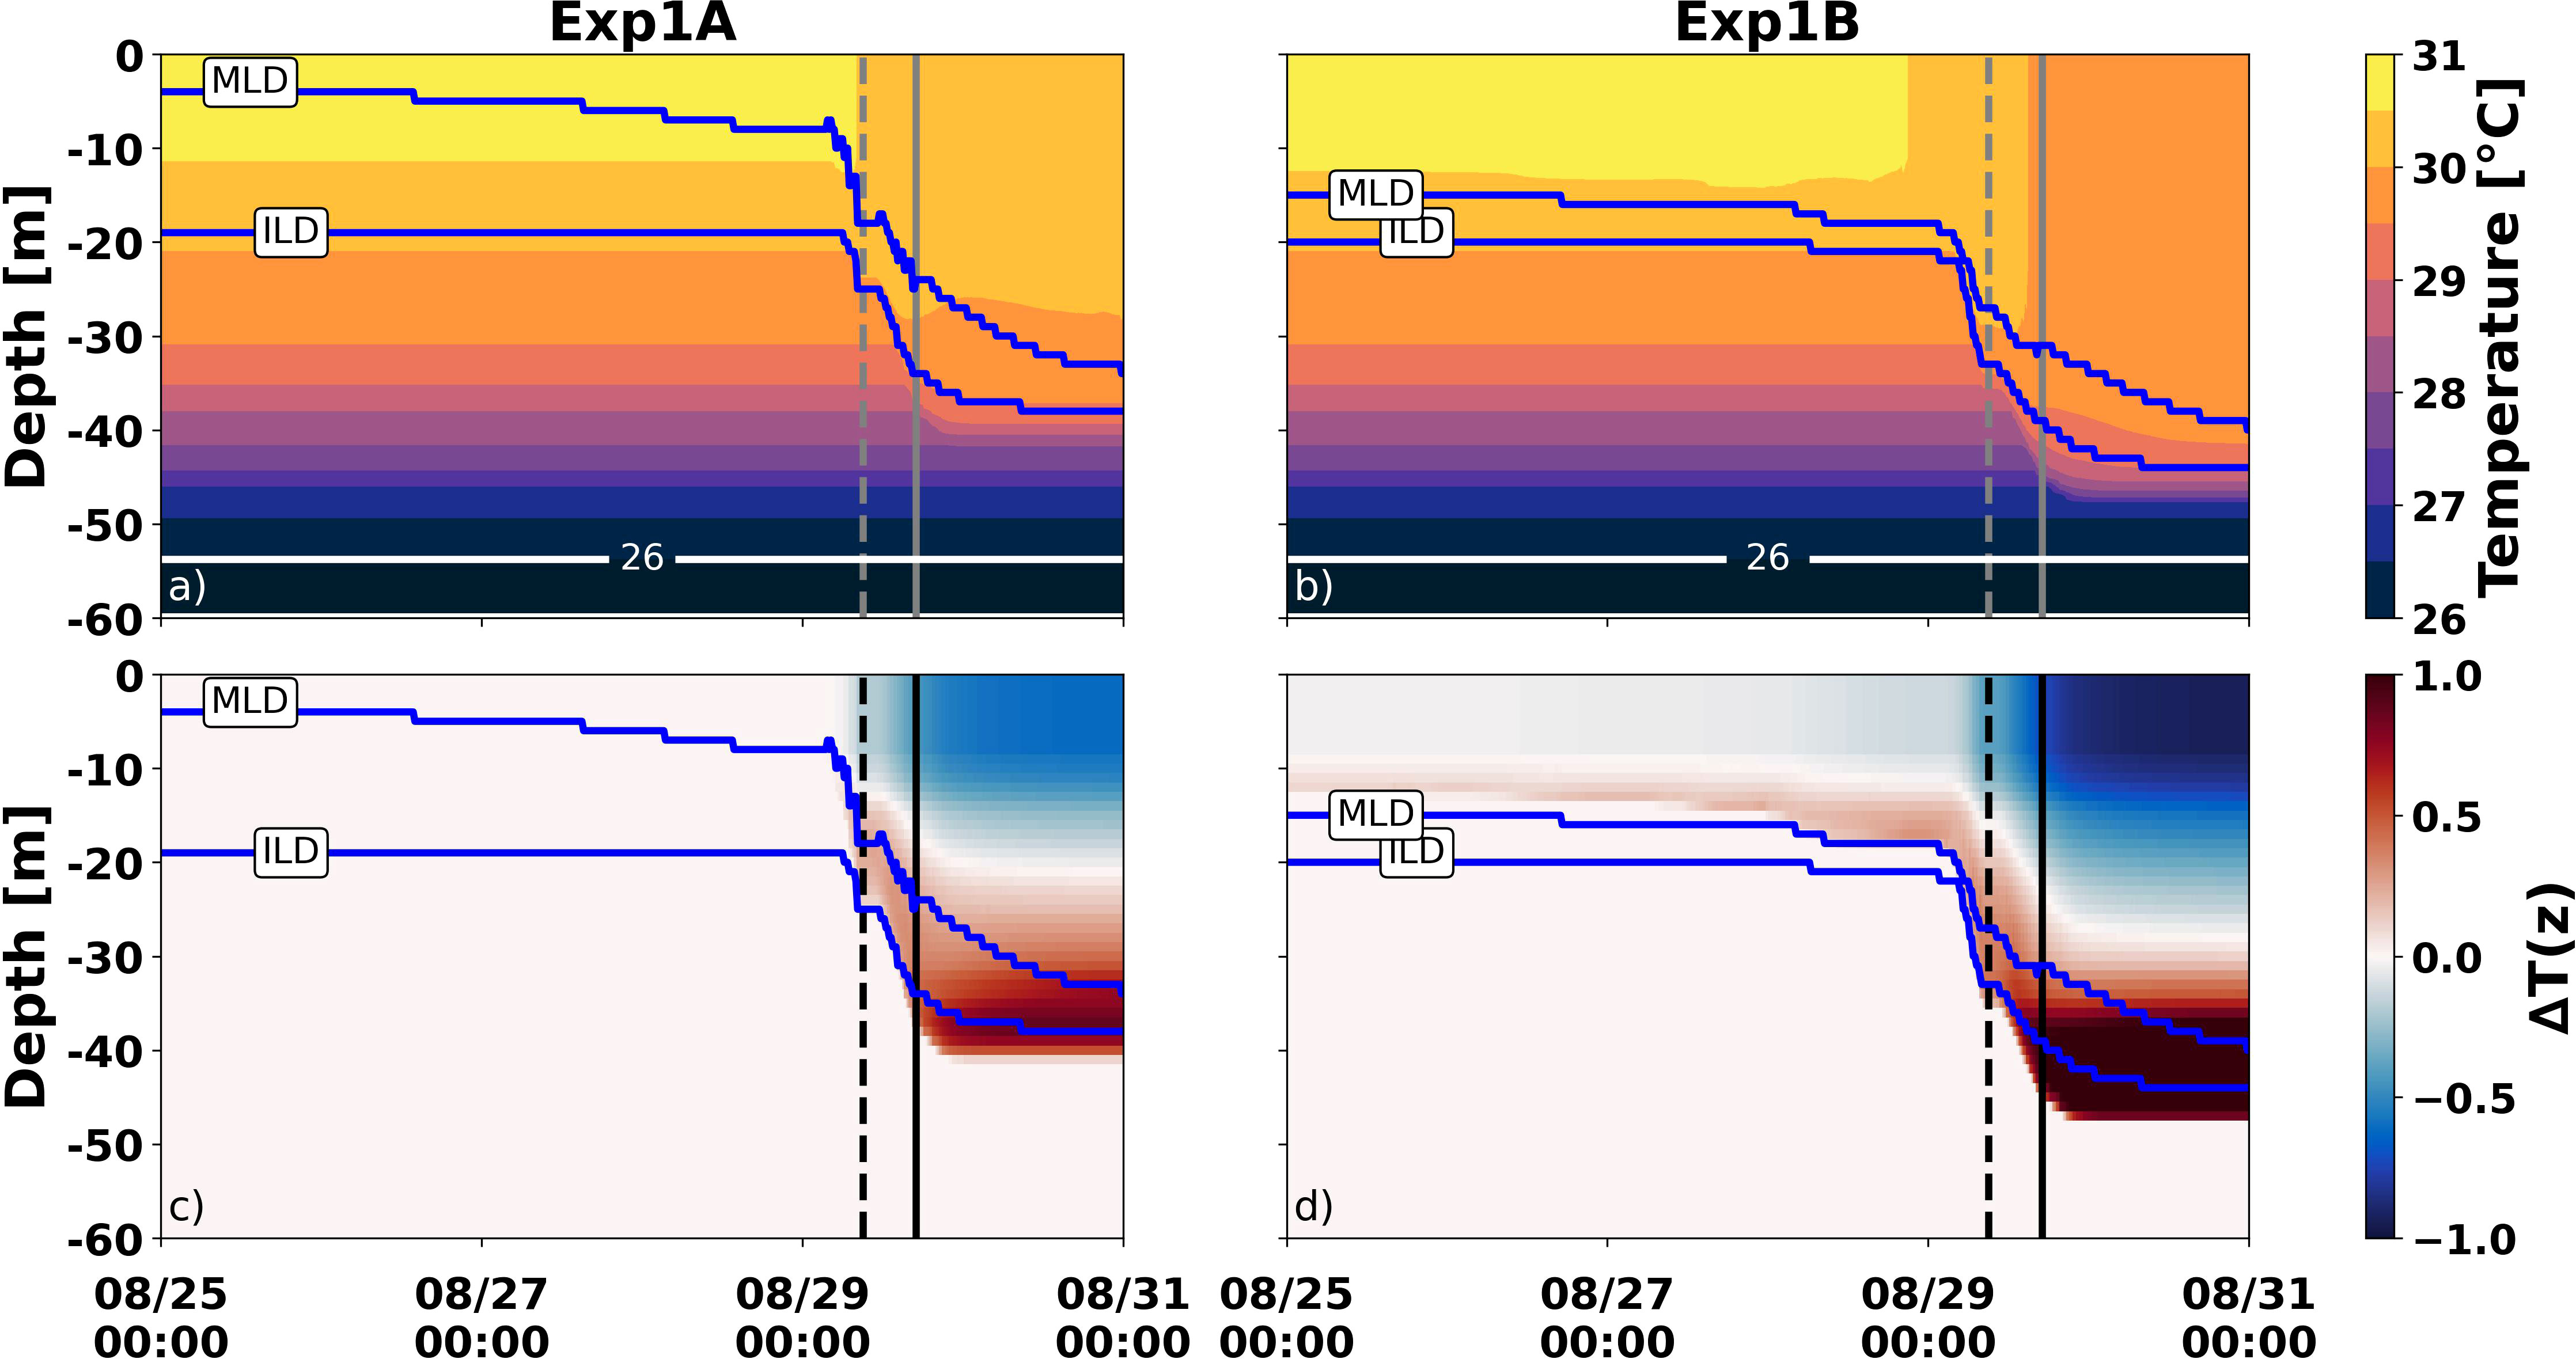
Figure 8 PWP model runs initialized using the 8/19 NG645 profile and simulated from 8/19 00:00 to 8/31 00:00. Exp1A (A, C) is inclusive of the barrier layer and depicts (A) temperature with the 26°C isotherm (white) and (C) contoured change in temperature since initialization. The MLD and ILD are labeled and contoured in blue. Panels (B, D) are similar but for Exp1B with the barrier layer removed as shown in Figure 6. The vertical lines represent the times at which Hurricane Ida passed the glider (dashed line) and made landfall (solid line). We limit the beginning display period from 8/25 00:00 as limited ocean cooling occurred before that time.
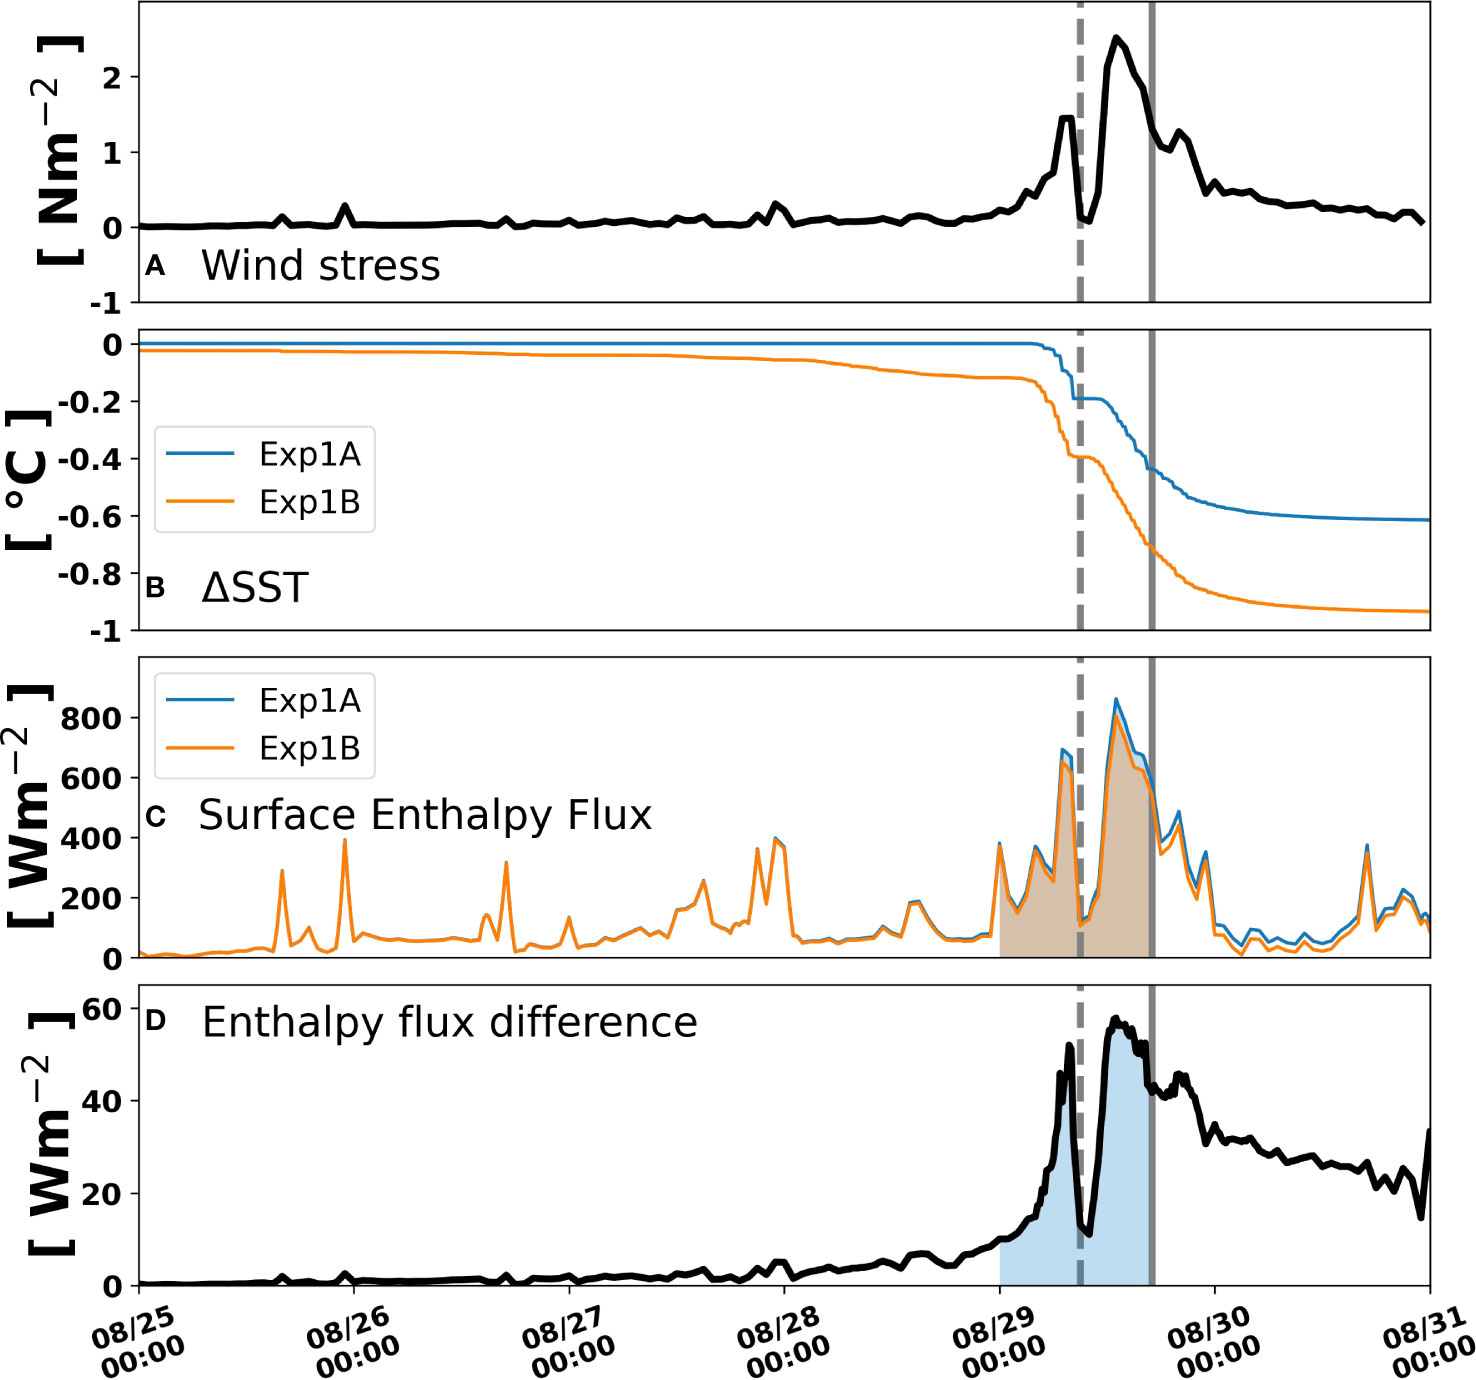
Figure 9 Time-series plots from experiment 1 (A) wind stress, (B) ΔSST from both Exp1A (blue) and Exp1B (orange), (C) surface enthalpy flux from both Exp1A (blue) and Exp1B (orange), and (D) difference (Exp1A – Exp1B). The shading in c and d represents the period used to calculate the cumulative enthalpy flux. The vertical lines represent the times at which Hurricane Ida passed the glider (dashed line) and made landfall (solid line).
For Exp2A and Exp2B presented in Figures 10, 11 we show the period 08/28 00:00 through 08/30 09:00. The upper ocean in Exp2B, with the barrier layer removed, cooled earlier and the ILD and MLD reached deeper depths than Exp2A. In Exp2A SSTs were reduced by 0.44°C at eye-passage and a total of 0.65°C by landfall. ILD and MLD reached 29m and 28m, respectively (Figures 10A, C). In Exp2B SSTs were reduced by 0.73°C at eye-passage and a total of 0.98°C by landfall. ILD and MLD reached 32m and 31m, respectively (Figures 10B, D). Thus, with the barrier layer removed SST cooled by an additional 0.29°C by eye passage and 0.34°C by landfall (Figure 11B). Similar to Exp1, inclusion of the barrier layer resulted in an additional 11% cumulative enthalpy flux over the 16 hours from 8/29 to landfall (Figure 11D).
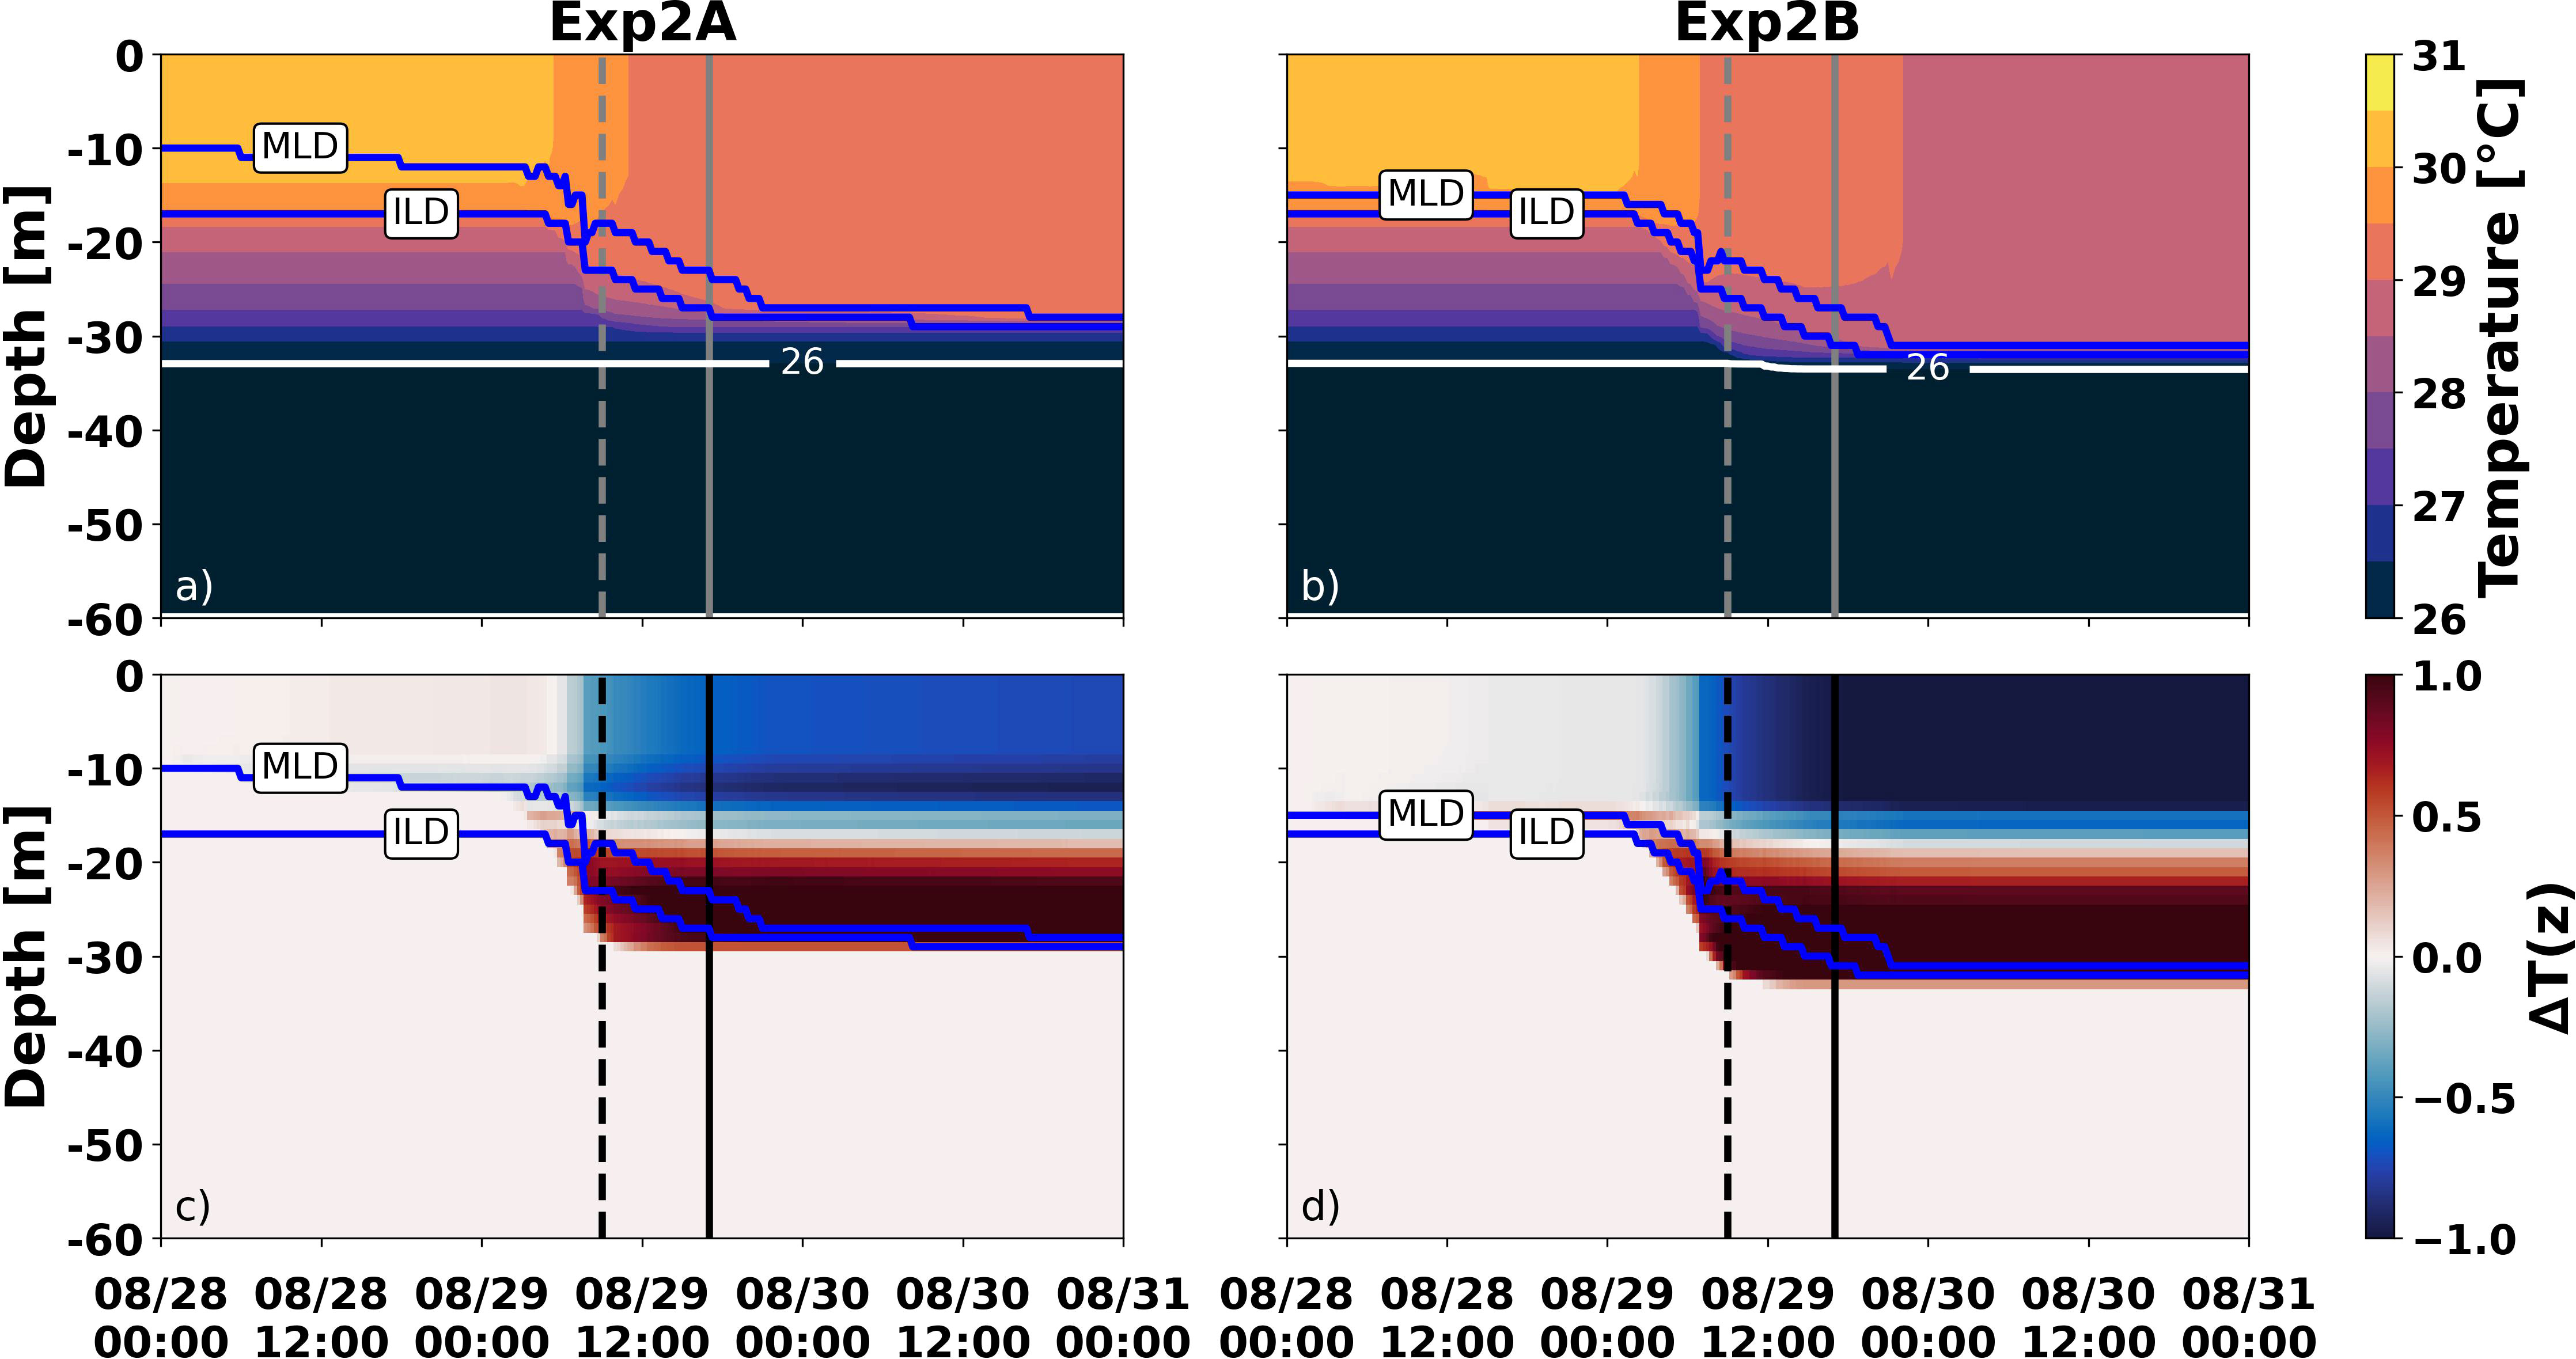
Figure 10 As-in Figure 8, but for experiment 2 initialized on 08/28 00:00.
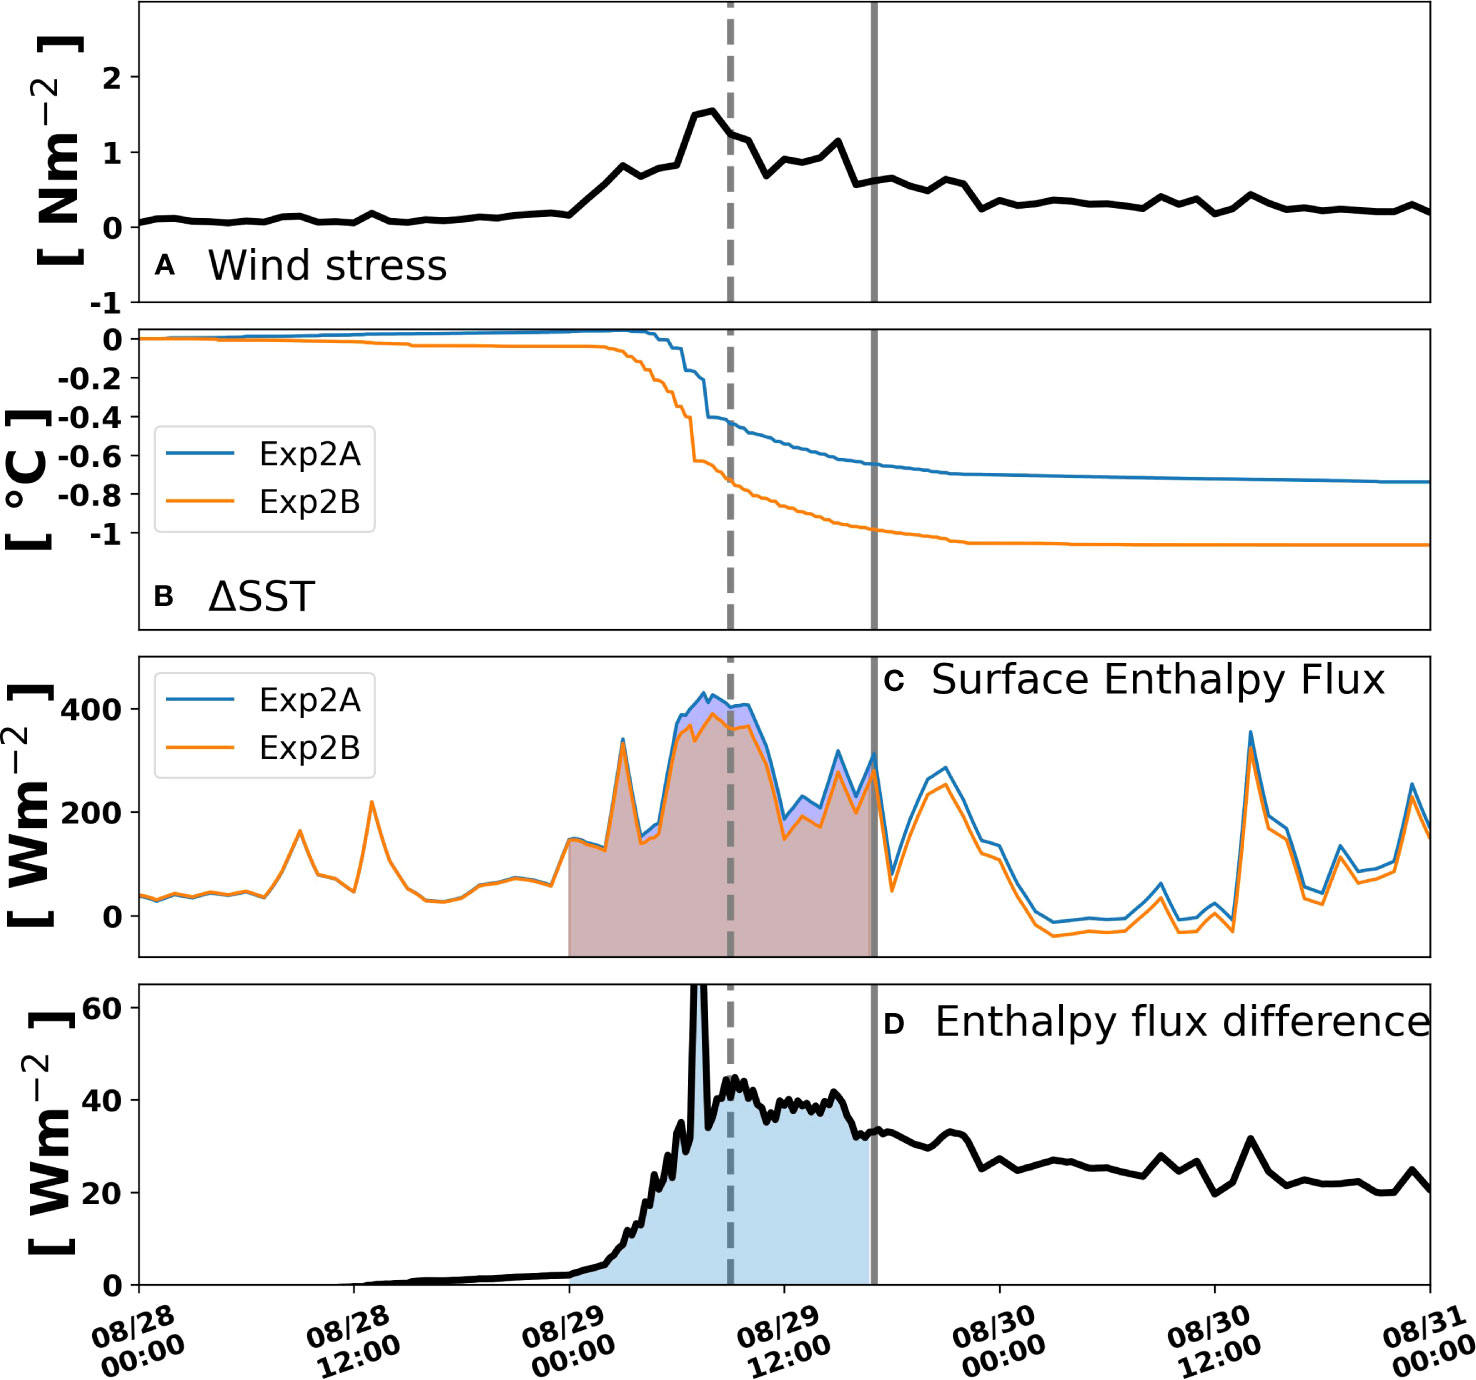
Figure 11 As-in Figure 9, but for experiment 2 initialized on 08/28 00:00.
The Exp2A control run cooled by 0.66°C and 1.31°C less than the glider observed at eye-passage and landfall, respectively. The PWP experiments presented here represent 40% (33%) of the glider observed cooling at eye-passage (landfall). This suggests that PWP captures a significant portion of the cooling and ocean processes ahead of eye-passage but has less utility in the period between eye-passage and landfall. As described previously, we did not expect PWP to capture the full range of 3-D upper ocean mixing processes (advection, Ekman pumping, inertial mixing, waves, and sub-mesoscale stratified upper ocean mixing processes). However, the twin model experiments indicate that for the 1-D shear driven processes represented by PWP the SST cooling during the landfall approach of Hurricane Ida had a large sensitivity to the presence and absence of the barrier layer. This finding agrees with idealized PWP simulations from Rudzin et al. (2019) that showed sensitivity in SST cooling to shear-driven mixing between strong and weak salinity stratification for TC wind forcing.
As an additional comparison we calculate the dynamic potential intensity as described in section 2.3, specifically for the initial conditions extracted from the glider in Exp1A and modified for the removal of the barrier layer in Exp1B at the along-track site. Exp1A initial conditions (Table 1) showed a shallower mixing depth, warmer depth integrated temperature, and higher DPI than Exp1B with the barrier layer removed. The removal of the barrier layer reduced stratification, deepened the initial MLD, resulting in a deeper mixing depth. The enhanced cooling in Exp1B led to a decrease in DPI of 5.01 m s-1, which is approximately the order of the 2022 NHC official intensity error (Cangialosi et al., 2020). These findings along with the PWP model simulations show that there is a demonstrated potential for the freshwater barrier layer to enhance enthalpy flux into the atmosphere by restricting upper ocean cooling, thus contributing to Ida’s continued intensification ahead of landfall.
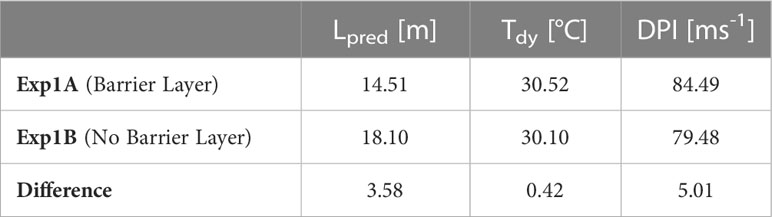
Table 1 A table of dynamic potential intensity parameters showing the difference between Exp1A (Barrier Layer) and Exp1B (No Barrier Layer) initial conditions from the glider location on 08/19.
4 Discussion
Observations from Slocum glider NG645 ahead of and beneath Hurricane Ida (2021) in the GoM captured upper ocean cooling ahead of eye-passage and landfall (Figures 4, 5). Despite this cooling, SST at the glider location just prior to landfall remained warm (28.1°C), approximately 3.5°C above T100 (24.6°C) at landfall. This indicates that the standard assumption made in Price (2009) that a typical category 3 hurricane will mix to ~100m was not valid for Hurricane Ida (2021) passing over the northern GoM. The freshwater barrier layer located over the deep ocean suggests that the northern GoM could be added to the list of regions where T100 is an unreliable metric such as the Bay of Bengal (McPhaden et al., 2009) or western Tropical Pacific (Price, 2009). Additionally, the glider observed OHC was just above the intensification threshold of 60 kJ cm-2 suggested by Mainelli et al. (2008) in its pre-storm survey period (Figure 6) and well below that threshold during the glider station keep period. Despite this relatively low OHC, Ida underwent RI and maintained its status as a Category 4 storm as it passed over the glider sampled region and made landfall. This indicates that OHC in this region was a poor metric for storm intensification, again likely due to salinity stratification as described in Price (2009). In contrast, both in the pre-storm survey and glider station- keep time periods (Figure 5) PEA of the upper 100m suggested the water column was highly stable. For reference, the PEA of the initial profiles used in PWP Exp1A and Exp2A were 460 and 477 J m-3. With the barrier layer removed in Exp1B and Exp2B the initial PEAs were reduced to 327 and 381 J m-3, respectively. This represents a reduction in stability of 29% and 20%, respectively with the largest reduction in the along-track region.
The reduced cooling in PWP experiments at both the along-track and glider locations simulated here due to the barrier layer is consistent with previous studies focused on other regions. In these twin model experiments the salinity barrier layer inhibited SST cooling in Exp1 (and Exp2) by 53% (57%) ahead-of-eye passage, 38% (32%) by landfall. For example, Balaguru et al. (2012) identified a 33% reduction in cooling due to barrier layers in the category 4 hurricane Omar (2008) in the northeastern Caribbean. In the Bay of Bengal Neetu et al. (2012) showed that monsoon generated barrier layers are responsible for a ~40% reduction in cooling by TCs relative to post monsoon seasons. Idealized PWP experiments in Rudzin et al. (2018) were designed to represent a range of ocean features in the eastern Caribbean that showed cooling ranges of 0.4 to 0.8 °C, also consistent with the total cooling presented here. Similarly, an idealized coupled numerical modeling barrier layer sensitivity study (Hlywiak and Nolan, 2019) showed reduced cooling of more than 0.6°C for TCs that were slow moving, strong, and with favorable atmospheric conditions for generation using barrier layer conditions typical of the Amazon-Orinoco River Plume. Balaguru et al. (2020) also carried out extensive PWP model experiments with and without salinity stratification for the Amazon-Orinoco River plume to evaluate the connection between rapid intensification (RI) and salinity barrier layer cooling inhibition. They found for idealized RI cases, salinity barrier layers reduced SST cooling by up to 0.3°C, which is consistent with what we simulated for a rapidly intensifying Hurricane Ida. For non-RI cases in their study, salinity barrier layers were only responsible for inhibiting 0.15°C of cooling, highlighting potential feedbacks between barrier layers and RI. Despite their findings in the Amazon-Orinoco River Plume, they found that barrier layers had limited impact on storm intensity in the GoM. Their study utilized the Navy Global Ocean Forecast System (GOFS) to initialize PWP. The dearth of upper ocean observations to support data assimilation in the northern GoM, and practice of using climatological river inputs in GOFS may have limited their ability to resolve the sharp upper ocean salinity gradients such as those observed by NG645.
One of the few studies (Le Hénaff et al., 2021) of barrier layer and hurricane interactions in the GoM identified a barrier layer ahead of Hurricane Michael (2018). They identified SSS<34 PSU to as far south as 27.5°N, above the 32.6 PSU SSS observed in the pre-storm survey by NG645 (Figure 2) but ~75km further south. However, a study of the intensification of Hurricane Isaac (Jaimes et al., 2016), which followed a similar track to Ida, found no evidence of barrier layers in profiles collected from air-deployed expendables. A recently published study of the ocean conditions ahead of Hurricane Sally (2020) (John et al., 2023) identified similar freshwater salinity barrier layers from the Mississippi River Plume as observed here in Ida, which contributed to continued intensification over the continental shelf. A study investigated the evolution of barrier layers during TCs globally with Argo floats (Steffen and Bourassa, 2018) using a barrier layer potential energy (BLPE) metric with similarities to PEA. They showed Argo floats between 2001 and 2014 with both low BLPE approaching 0 J m-2 and high >1200 J m-2 near overlapping at our study site. These studies and our findings indicate that barrier layers in the GoM are highly variable and can cover broad areas that hurricanes, such as Isaac (2012), Michael (2018), Sally (2020), and Ida (2021) must pass over before making landfall, and can have an impact on intensity.
The observations from NG645 and the results from the PWP sensitivity study highlight the potential importance of salinity stratification on the deep open ocean region off the continental shelf in the northern GoM, which is clearly influenced by coastal freshwater inputs. In the northern GoM a variety of thermal stratification regimes exist. In the nearshore environment it can be warm throughout the water column or highly thermally stratified. Ahead of Hurricane Michael (2018) subsurface temperatures of 22°C were observed near 10m depth to the northeast of our study-site (Dzwonkowski et al., 2020). This feature was removed during a marine heatwave that dramatically warmed the shelf waters to over 28°C in a few days. Further offshore the presence of LC/LCE waters can lead to warm and salty features that extend throughout the upper 100m and beyond (Elliott, 1982). In contrast, the region between the LC/LCE and continental shelf is typically warm at the sea surface but can have cooler waters beneath the seasonal thermocline in the upper ocean, as evidenced in the glider observations by NG645. In this “gap” region between the LC/LCEs and the continental shelf where the Mississippi River plume can be exported off the continental shelf, our findings suggest that salinity barrier layers can increase stratification and further isolate the subsurface cold water from mixing and cooling the surface. These warm and fresh surface waters would theoretically support storm intensification approaching landfall, or at a minimum reduce the oceans contribution to storm weakening.
5 Conclusion
We have shown that the standard upper ocean metrics OHC and T100 were likely not robust indicators of storm intensity in the deep waters of the northern GoM escarpment ahead of Ida’s landfall. An alternative stability metric, PEA, and 1-D upper ocean mixing model experiments indicated that the presence of a freshwater barrier layer likely inhibited additional sea surface cooling and enhanced enthalpy flux under a rapidly intensifying Hurricane Ida (2021). In our experiments the removal of the barrier led to earlier, more rapid, and greater cooling, which resulted in reduced enthalpy flux to the atmosphere, and a greater DPI. This is particularly critical as it highlights an essential ocean feature, a Mississippi River plume freshwater barrier layer, in the “gap” region south of the continental shelf and north of the LC/LCE that landfalling hurricanes must cross before impacting coastal communities. While the limited utility of OHC on continental shelves and T100 in freshwater stratified layers is well-known (McPhaden et al., 2009; Price, 2009; Potter et al., 2019), salinity observations are severely lacking in this region. This study highlights the need and capability of expanded ocean observing assets along the shelf-break of the GoM to identify freshwater barrier layers and improve intensity forecasts of landfalling hurricanes in this vulnerable region.
Data availability statement
The datasets presented in this study can be found in online repositories. The names of the repository/repositories and accession number(s) can be found below: NG645 was operated by the Naval Oceanographic Office and coordinated by the Integrated Ocean Observing System (IOOS) Regional Association Gulf of Mexico Coastal Ocean Observing System through the Commercial Engagement Through Ocean Technology Act of 2018. Data sources included glider NG645 (https://gliders.ioos.us/erddap/tabledap/ng645-20210613T0000.html), Buoy 42040 from the National Data Buoy Center (https://www.ndbc.noaa.gov/station_history.php?station=42040). The PWP model was adapted from https://github.com/earlew/pwp_python_00.
Author contributions
TM, SC, and SG designed the initial experiments and carried out analysis. JE generated figures and carried out data analysis. SC, SG, JR, and ST provided scientific guidance and paper edits. TM prepared the manuscript for publication. All authors contributed to the article and approved the submitted version.
Funding
This work included support by the Integrated Ocean Observing System directed funding via the Mid Atlantic Regional Association Coastal Ocean Observing System (MARACOOS) through NOAA Grant NA21NOS0120096.
Acknowledgments
We thank two reviewers for their thoughtful comments that significantly enhanced this paper. NG645 was operated by the Naval Oceanographic Office and coordinated by the Integrated Ocean Observing System (IOOS) Regional Association Gulf of Mexico Coastal Ocean Observing System through the Commercial Engagement Through Ocean Technology Act of 2018. Data sources included glider NG645 (https://gliders.ioos.us/erddap/tabledap/ng645-20210613T0000.html), Buoy 42040 from the National Data Buoy Center (https://www.ndbc.noaa.gov/station_history.php?station=42040). The PWP model was adapted from https://github.com/earlew/pwp_python_00.
Conflict of interest
The authors declare that the research was conducted in the absence of any commercial or financial relationships that could be construed as a potential conflict of interest.
Publisher’s note
All claims expressed in this article are solely those of the authors and do not necessarily represent those of their affiliated organizations, or those of the publisher, the editors and the reviewers. Any product that may be evaluated in this article, or claim that may be made by its manufacturer, is not guaranteed or endorsed by the publisher.
References
Balaguru K., Chang P., Saravanan R., Leung L. R., Xu Z., Li M., et al. (2012). Ocean barrier layers’ effect on tropical cyclone intensification. Proc. Natl. Acad. Sci. 109, 14343–14347. doi: 10.1073/PNAS.1201364109.10.1073/PNAS.1201364109
Balaguru K., Foltz G. R., Leung L. R., Asaro E. D., Emanuel K. A., Liu H., et al. (2015). Dynamic Potential Intensity: An improved representation of the ocean’s impact on tropical cyclones. Geophys. Res. Lett. 42, 6739–6746. doi: 10.1002/2015GL064822
Balaguru K., Foltz G. R., Leung L. R., Hagos S. M., Judi D. R. (2018). On the use of ocean dynamic temperature for hurricane intensity forecasting. Weather Forecast. 33, 411–418. doi: 10.1175/WAF-D-17-0143.1
Balaguru K., Foltz G. R., Leung L. R., Kaplan J., Xu W., Reul N., et al. (2020). Pronounced impact of salinity on rapidly intensifying tropical cyclones. Bull. Am. Meteorol. Soc 101, E1497–E1511. doi: 10.1175/BAMS-D-19-0303.1
Beven J. II, Hagan A., Berg R. (2022) Tropical cyclone report: Hurricane Ida (National Hurricane Center). Available at: https://www.nhc.noaa.gov/data/tcr/AL092021_Ida.pdf (Accessed January 6, 2023).
Black P. G., D’Asaro E. A., Sanford T. B., Drennan W. M., Zhang J. A., French J. R., et al. (2007). Air–sea exchange in hurricanes: synthesis of observations from the coupled boundary layer air–sea transfer experiment. Bull. Am. Meteorol. Soc 88, 357–374. doi: 10.1175/BAMS-88-3-357
Cangialosi J. P., Blake E., Demaria M., Penny A., Latto A., Rappaport E., et al. (2020). Recent progress in tropical cyclone intensity forecasting at the national hurricane center. Weather Forecast. 35, 1913–1922. doi: 10.1175/WAF-D-20-0059.1
Cione J. J., Uhlhorn E. W. (2003). Sea surface temperature variability in hurricanes: implications with respect to intensity change. Mon. Weather Rev. 131, 1783–1796. doi: 10.1175//2562.1
D’Asaro E., Sanford T. B., Niiler P. P., Terrill E. J. (2007). Cold wake of hurricane Frances. Geophys. Res. Lett. 34, L15609. doi: 10.1029/2007GL030160
de Boyer Montégut C., Mignot J., Lazar A., Cravatte S. (2007). Control of salinity on the mixed layer depth in the world ocean: 1. General description. J. Geophys. Res. Oceans 112, 1–12. doi: 10.1029/2006JC003953
Domingues R., Goni G., Bringas F., Lee S.-K., Kim H.-S., Halliwell G., et al. (2015). Upper ocean response to Hurricane Gonzalo, (2014): Salinity effects revealed by targeted and sustained underwater glider observations. Geophys. Res. Lett. 42, 7131–7138. doi: 10.1002/2015GL065378
Dzwonkowski B., Coogan J., Fournier S., Lockridge G., Park K., Lee T. (2020). Compounding impact of severe weather events fuels marine heatwave in the coastal ocean. Nat. Commun. 11, 1–10. doi: 10.1038/s41467-020-18339-2
Dzwonkowski B., Fournier S., Lockridge G., Coogan J., Liu Z., Park K. (2021). Cascading weather events amplify the coastal thermal conditions prior to the shelf transit of hurricane sally, (2020). J. Geophys. Res. Oceans 126, e2021JC017957. doi: 10.1029/2021JC017957
Elliott B. A. (1982). Anticyclonic rings in the gulf of Mexico. J. Phys. Oceanogr. 12, 1292–1309. doi: 10.1175/1520-0485(1982)012<1292:ARITGO>2.0.CO;2
Emanuel K. A. (1986). An air-sea interaction theory for tropical cyclones. Part I: steady-state maintenance. J. Atmospheric Sci. 43, 585–605. doi: 10.1175/1520-0469(1986)043<0585:AASITF>2.0.CO;2
Foltz G. R., McPhaden M. J. (2009). Impact of barrier layer thickness on SST in the central tropical north atlantic. J. Clim. 22, 285–299. doi: 10.1175/2008JCLI2308.1
Glenn S. M., Miles T. N., Seroka G. N., Xu Y., Forney R. K., Yu F., et al. (2016). Stratified coastal ocean interactions with tropical cyclones. Nat. Commun. 7, 1–10. doi: 10.1038/ncomms10887
Gramer L. J., Zhang J. A., Alaka G., Hazelton A., Gopalakrishnan S. (2022). Coastal downwelling intensifies landfalling hurricanes. Geophys. Res. Lett. 49, e2021GL096630. doi: 10.1029/2021GL096630
Grodsky S. A., Reul N., Lagerloef G., Reverdin G., Carton J. A., Chapron B., et al. (2012). Haline hurricane wake in the Amazon/Orinoco plume: AQUARIUS/SACD and SMOS observations. Geophys. Res. Lett. 39, 1–8. doi: 10.1029/2012GL053335
Hlywiak J., Nolan D. S. (2019). The influence of oceanic barrier layers on tropical cyclone intensity as determined through idealized, coupled numerical simulations. J. Phys. Oceanogr. 49, 1723–1745. doi: 10.1175/JPO-D-18-0267.1
Jaimes B., Shay L. K., Brewster J. K. (2016). Observed air-sea interactions in tropical cyclone Isaac over Loop Current mesoscale eddy features. Dyn. Atmospheres Oceans 76, 306–324. doi: 10.1016/j.dynatmoce.2016.03.001
Jaimes B., Shay L. K., Uhlhorn E. W. (2015). Enthalpy and momentum fluxes during hurricane Earl relative to underlying ocean features. Mon. Wea. Rev. 143, 111–131. doi: 10.1175/MWR-D-13-00277.1
John E. B., Balaguru K., Leung L. R., Foltz G. R., Hetland R. D., Hagos S. M. (2023). Intensification of Hurricane Sally, (2020) over the Mississippi River plume. Weather Forecast. 1, 1391–1404. doi: 10.1175/WAF-D-22-0191.1
Knapp K. R., Diamond H. J., Kossin J. P., Kruk M. C., Schreck C. J. I. (2018) International best track archive for climate stewardship (IBTrACS) project, version 4 (Accessed January 6, 2023).
Knapp K. R., Kruk M. C., Levinson D. H., Diamond H. J., Neumann C. J. (2010). The international best track archive for climate stewardship (IBTrACS): unifying tropical cyclone data. Bull. Am. Meteorol. Soc 91, 363–376. doi: 10.1175/2009BAMS2755.1
Le Hénaff M., Domingues R., Halliwell G., Zhang J. A., Kim H. S., Aristizabal M., et al. (2021). The role of the gulf of Mexico ocean conditions in the intensification of hurricane michael, (2018). J. Geophys. Res. Oceans 126, 1–28. doi: 10.1029/2020JC016969
Leipper D. F., Volgenau D. (1972). Hurricane heat potential of the Gulf of Mexico. J. Phys. Oceanogr. 2, 218–224. doi: 10.1175/1520-0485(1972)002<0218:HHPOTG>2.0.CO;2
Lim H. S., Miles T. N., Glenn S., Kim D., Kim M., Shim J. S., et al. (2020). Rapid ocean destratification by typhoon soulik over the highly stratified waters of west jeju island, korea. J. Coast. Res. 95, 1480–1484. doi: 10.2112/SI95-285.1
Lukas R., Lindstrom E. (1991). The mixed layer of the western equatorial Pacific Ocean. J. Geophys. Res. Oceans 96, 3343–3357. doi: 10.1029/90JC01951
Mainelli M., DeMaria M., Shay L. K., Goni G. (2008). Application of oceanic heat content estimation to operational forecasting of recent atlantic category 5 hurricanes. Weather Forecast. 23, 3–16. doi: 10.1175/2007WAF2006111.1
McPhaden M. J., Foltz G. R., Lee T., Murty V. S. N., Ravichandran M., Vecchi G. A., et al. (2009). Ocean-atmosphere interactions during cyclone nargis. Eos Trans. Am. Geophys. Union 90, 53–54. doi: 10.1029/2009EO070001
Miles T., Seroka G., Glenn S. (2017). Coastal ocean circulation during Hurricane Sandy. J. Geophys. Res. Oceans 122, 7095–7114. doi: 10.1002/2017JC013031
Miles T. N., Zhang D., Foltz G. R., Zhang J. A., Meinig C., Bringas F., et al. (2021). Uncrewed ocean gliders and saildrones support hurricane forecasting and research. Oceanography 34, 78–81. doi: 10.5670/oceanog.2021.supplement.02-28
Mrvaljevic R. K., Black P. G., Centurioni L. R., Chang Y.-T., D’Asaro E., Jayne S. R., et al. (2013). Observations of the cold wake of Typhoon Fanapi, (2010). Geophys. Res. Lett. 40, 316–321. doi: 10.1029/2012GL054282
Neetu S., Lengaigne M., Vincent E. M., Vialard J., Madec G., Samson G., et al. (2012). Influence of upper-ocean stratification on tropical cyclone-induced surface cooling in the Bay of Bengal. J. Geophys. Res. Oceans 117, 1–19. doi: 10.1029/2012JC008433
Pailler K., Bourlès B., Gouriou Y. (1999). The barrier layer in the western tropical Atlantic Ocean. Geophys. Res. Lett. 26, 2069–2072. doi: 10.1029/1999GL900492
Potter H., DiMarco S. F., Knap A. H. (2019). Tropical cyclone heat potential and the rapid intensification of hurricane harvey in the texas bight. J. Geophys. Res. Oceans 124, 2440–2451. doi: 10.1029/2018JC014776
Potter H., Rudzin J. E. (2021). Upper-ocean temperature variability in the gulf of Mexico with implications for hurricane intensity. J. Phys. Oceanogr. 51, 3149–3162. doi: 10.1175/JPO-D-21-0057.1
Powell M. D., Vickery P. J., Reinhold T. (2003). Reduced drag coefficient for high wind speeds in tropical cyclones. Nature 422, 279–283. doi: 10.1038/nature01481
Price J. F. (2009). Metrics of hurricane-ocean interaction: vertically-integrated or vertically-averaged ocean temperature? Ocean Sci. 5, 351–368. doi: 10.5194/os-5-351-2009
Price J. F., Weller R. A., Pinkel R. (1986). Diurnal cycling: Observations and models of the upper ocean response to diurnal heating, cooling, and wind mixing. J. Geophys. Res. 91, 8411. doi: 10.1029/JC091iC07p08411
Rudzin J. E., Chen S., Sanabia E. R., Jayne S. R. (2020). The air-sea response during hurricane irma’s, 2017) rapid intensification over the amazon-orinoco river plume as measured by atmospheric and oceanic observations. J. Geophys. Res. Atmospheres 125, e2019JD032368. doi: 10.1029/2019JD032368
Rudzin J. E., Shay L. K., Jaimes B., Brewster J. K. (2017). Upper ocean observations in eastern Caribbean Sea reveal barrier layer within a warm core eddy. J. Geophys. Res. Oceans 122, 1057–1071. doi: 10.1002/2016JC012339
Rudzin J. E., Shay L. K., Jaimes de la Cruz B. (2019). The impact of the amazon–orinoco river plume on enthalpy flux and air–sea interaction within caribbean sea tropical cyclones. Mon. Weather Rev. 147, 931–950. doi: 10.1175/MWR-D-18-0295.1
Rudzin J. E., Shay L. K., Johns W. E. (2018). The influence of the barrier layer on SST response during tropical cyclone wind forcing using idealized experiments. J. Phys. Oceanogr. 48, 1471–1478. doi: 10.1175/JPO-D-17-0279.1
Sanabia E. R., Jayne S. R. (2020). Ocean observations under two major hurricanes: evolution of the response across the storm wakes. AGU Adv. 1, e2019AV000161. doi: 10.1029/2019AV000161
Schmit T. J., Griffith P., Gunshor M. M., Daniels J. M., Goodman S. J., Lebair W. J. (2017). A closer look at the ABI on the GOES-R series. Bull. Am. Meteorol. Soc 98, 681–698. doi: 10.1175/BAMS-D-15-00230.1
Schofield O., Kohut J., Aragon D., Creed L., Graver J., Haldeman C., et al. (2007). Slocum gliders: robust and ready. J. Field Robot. 24, 473–485. doi: 10.1002/rob.20200
Sengupta D., Goddalehundi B. R., Anitha D. S. (2008). Cyclone-induced mixing does not cool SST in the post-monsoon north Bay of Bengal. Atmospheric Sci. Lett. 9, 1–6. doi: 10.1002/asl.162
Seroka G., Miles T., Xu Y., Kohut J., Schofield O., Glenn S. (2016). Hurricane irene sensitivity to stratified coastal ocean cooling. Mon. Weather Rev. 144, 3507–3530. doi: 10.1175/MWR-D-15-0452.1
Seroka G., Miles T., Xu Y., Kohut J., Schofield O., Glenn S. (2017). Rapid shelf-wide cooling response of a stratified coastal ocean to hurricanes. J. Geophys. Res. Oceans 122, 4845–4867. doi: 10.1002/2017JC012756
Simpson J. H., Crisp D. J., Hearn C., Swallow J. C., Currie R. I., Gill A. E., et al. (1981). The shelf-sea fronts: implications of their existence and behaviour. Philos. Trans. R. Soc Lond. Ser. Math. Phys. Sci. 302, 531–546. doi: 10.1098/rsta.1981.0181
Simpson J. H., Hunter J. R. (1974). Fronts in the irish sea. Nature 250, 404–406. doi: 10.1038/250404a0
Skamarock W. C., Klemp J. B., Dudhia J., Gill D. O., Liu Z., Berner J., et al. (2019). A description of the advanced research WRF model version 4 (Boulder, CO, USA: National Center for Atmospheric Research).
Smith A. (2020). U.S. Billion-dollar Weather and Climate Disasters 1980 - present (NCEI Accession 0209268). (NOAA National Centers for Environmental Information) (2020). Available at: https://www.ncei.noaa.gov/access/metadata/landing-page/bin/iso?id=gov.noaa.nodc:0209268 (Accessed January 6, 2023).
Sprintall J., Tomczak M. (1992). Evidence of the barrier layer in the surface layer of the tropics. J. Geophys. Res. Oceans 97, 7305–7316. doi: 10.1029/92JC00407
Steffen J., Bourassa M. (2018). Barrier layer development local to tropical cyclones based on argo float observations. J. Phys. Oceanogr. 48, 1951–1968. doi: 10.1175/JPO-D-17-0262.1
Steffen J., Bourassa M. (2020). Upper-ocean response to precipitation forcing in an ocean model hindcast of hurricane gonzalo. J. Phys. Oceanogr. 50, 3219–3234. doi: 10.1175/JPO-D-19-0277.1
Wang X., Han G., Qi Y., Li W. (2011). Impact of barrier layer on typhoon-induced sea surface cooling. Dyn. Atmospheres Oceans 52, 367–385. doi: 10.1016/j.dynatmoce.2011.05.002
Yang Y. J., Chang M.-H., Hsieh C.-Y., Chang H.-I., Jan S., Wei C.-L. (2019). The role of enhanced velocity shears in rapid ocean cooling during Super Typhoon Nepartak 2016. Nat. Commun. 10, 1627. doi: 10.1038/s41467-019-09574-3
Zedler S. E., Dickey T. D., Doney S. C., Price J. F., Yu X., Mellor G. L. (2002). Analyses and simulations of the upper ocean’s response to Hurricane Felix at the Bermuda Testbed Mooring site: 13–23 August 1995. J. Geophys. Res. Oceans 107, 3232. doi: 10.1029/2001JC000969
Zedler S. E., Niiler P. P., Stammer D., Terrill E., Morzel J. (2009). Ocean’s response to Hurricane Frances and its implications for drag coefficient parameterization at high wind speeds. J. Geophys. Res. 114, C04016. doi: 10.1029/2008JC005205
Zhang J. A., Black P. G., French J. R., Drennan W. M. (2008). First direct measurements of enthalpy flux in the hurricane boundary layer: The CBLAST results. Geophys. Res. Lett. 35, 3100–3116. doi: 10.1029/2008GL034374
Zhang F., Li M., Miles T. (2018). Generation of near-inertial currents on the mid-atlantic bight by hurricane arthur, (2014). J. Geophys. Res. Oceans 123, 3100–3116. doi: 10.1029/2017JC013584
Keywords: hurricanes, barrier layers, uncrewed systems, ocean observing networks, and upper ocean mixing
Citation: Miles TN, Coakley SJ, Engdahl JM, Rudzin JE, Tsei S and Glenn SM (2023) Ocean mixing during Hurricane Ida (2021): the impact of a freshwater barrier layer. Front. Mar. Sci. 10:1224609. doi: 10.3389/fmars.2023.1224609
Received: 17 May 2023; Accepted: 01 August 2023;
Published: 18 August 2023.
Edited by:
Won Sang Lee, Korea Polar Research Institute, Republic of KoreaReviewed by:
Karthik Balaguru, Pacific Northwest National Laboratory (DOE), United StatesSok Kuh Kang, Korea Institute of Ocean Science and Technology (KIOST), Republic of Korea
Copyright © 2023 Miles, Coakley, Engdahl, Rudzin, Tsei and Glenn. This is an open-access article distributed under the terms of the Creative Commons Attribution License (CC BY). The use, distribution or reproduction in other forums is permitted, provided the original author(s) and the copyright owner(s) are credited and that the original publication in this journal is cited, in accordance with accepted academic practice. No use, distribution or reproduction is permitted which does not comply with these terms.
*Correspondence: Travis N. Miles, tnmiles@marine.rutgers.edu