Ocean acidification influences the gene expression and physiology of two Caribbean bioeroding sponges
 John T. Morris1,2*†
  Ian C. Enochs1
  Michael S. Studivan1,2
  Benjamin D. Young1,2
  Anderson Mayfield3
  Nash Soderberg1,2
  Nikki Traylor-Knowles4
  Graham Kolodziej1,2
  Derek Manzello5
- 1Ocean Chemistry and Ecosystems Division, Atlantic Oceanographic and Meteorological Laboratory, National Oceanic and Atmospheric Administration (NOAA), Miami, FL, United States
- 2Cooperative Institute for Marine and Atmospheric Studies, University of Miami, Miami, FL, United States
- 3Coral Reef Diagnostics, Miami, FL, United States
- 4Rosenstiel School of Marine, Atmospheric and Earth Science, The University of Miami, Miami, FL, United States
- 5Coral Reef Watch, Center for Satellite Applications and Research, Satellite Oceanography & Climatology Division, National Oceanic and Atmospheric Administration, College Park, MD, United States
Introduction: Coral reef ecosystems are experiencing increased rates of carbonate dissolution due to losses in live coral cover coupled with the impacts of ocean acidification (OA) on coral reef calcifiers and bioeroders. While the stimulating effect of OA on bioerosion has been demonstrated experimentally, predominantly in the Pacific, the underlying physiological and molecular mechanisms behind the response are still poorly understood.
Methods: To address this, we subjected common zooxanthellate (Cliona varians) and azooxanthellate (Pione lampa) Caribbean sponges to pre-industrial (8.15 pH), present-day (8.05 pH), and two future OA scenarios (moderate OA, 7.85 pH; extreme OA, 7.75 pH) and evaluated their physiological and transcriptomic responses.
Results: The influence of OA on sponge bioerosion was nonlinear for both species, with the greatest total bioerosion and chemical dissolution rates found in the 7.85 pH treatment, then not increasing further under the more extreme 7.75 pH conditions. A trend towards reduced bioerosion rates in the 7.75 pH treatment occurred regardless of the presence of algal symbionts and suggests that the sponges may become physiologically impaired under prolonged OA exposure, resulting in diminished bioerosion potential. These findings were supported by the RNA-seq analysis, which revealed differentially expressed genes involved in a stress response to OA, in particular, suppressed metabolism.
Discussion: This may indicate that the sponges had reallocated energy resources towards more critical physiological needs in response to OA as a survival mechanism under stressful conditions. These data reveal that while the bioerosion rates of excavating sponges in Caribbean reef ecosystems may increase under moderate OA scenarios, this OA-stimulation may plateau or be lost at extreme end-of-century pH conditions, with implications for the dissolution and long-term persistence of reef habitat structures.
Introduction
The rapid rise of anthropogenic CO2 concentrations, and the subsequent acidification of marine environments, will have strong negative implications for the ecology of coral reefs and the organisms that comprise them (Andersson and Gledhill, 2012). Ocean acidification (OA), a term commonly used to describe the reduction in seawater pH and associated changes in carbonate chemistry, is of particular concern (Caldeira and Wickett, 2003). Under a “business-as-usual” scenario, current models predict a decrease in ocean pH by as much as 0.29 units by the end of the century, representing a level unseen in the last 14-17 million years (IPCC, 2019). Reef habitat is likely to be adversely affected by OA due to a combination of reduced carbonate production (Chan and Connolly, 2012) and accelerated erosion/dissolution (Enochs et al., 2015; Morris et al., 2022). Associated with these changes is the potential for reef habitat to shift toward a net loss of reef framework (Alvarez-Filip et al., 2009), and with it, a loss of economically and ecologically critical functions (e.g., coastline breakwater protection, commercial fishing, tourism) (Hoegh-Guldberg et al., 2007; Spalding et al., 2017).
Ocean acidification has been shown to have a negative impact on the physiology of calcifiers (e.g., coral, crustose coralline algae) (De’ath et al., 2009; Kroeker et al., 2010). This includes depressed calcification rates (Langdon and Atkinson, 2005), impaired defensive vigor accompanied by increased production of reactive oxygen species (Fabry et al., 2008; Kaniewska et al., 2012), and compromised recruitment and settlement success (Fabricius et al., 2017; Jiang et al., 2019). By contrast, OA enhances the bioeroding capabilities of organisms that excrete acidic compounds and/or use active ion transport to chemically dissolve reef substrate (Garcia-Pichel et al., 2010; Webb et al., 2019). Macroborers (e.g., sponges, polychaetes, Lithophaga bivalves) have been shown to undergo enhanced bioerosion rates and more rapid substrate colonization under acidified seawater conditions (Enochs et al., 2015; Morris et al., 2022; Enochs et al., 2016b), indicating that the relative importance of bioeroders within reef ecosystems will increase due to OA.
Bioeroding sponges consist of zooxanthellate (host photosynthetic dinoflagellates of the family Symbiodiniaceae) and azooxanthellate species that differ in their bioerosion strategies, growth rates, and metabolic requirements (Murphy et al., 2016; de Bakker et al., 2018; Achlatis et al., 2021). Within the bioeroding community, sponges are considered among the most prolific eroders, responsible for as much as 90% of all internal macrobioerosion of reef framework in the Caribbean (Glynn, 1997). Sponge carbonate excavation is accomplished through a combination of chemical dissolution (i.e., chemically etched fissures) and the mechanical removal of small carbonate chips (Rutzler and Rieger, 1973; Pomponi, 1980). The internal cavities left behind have also been shown to compromise the skeletal integrity of reef framework, making it more susceptible to breakage (Tunnicliffe, 1979).
Several studies have measured accelerated sponge biologically-mediated chemical dissolution rates in response to OA (Wisshak et al., 2012; Wisshak et al., 2014; Enochs et al., 2015). This chemical enhancement has been shown for zooxanthellate and azooxanthellate species found within tropical and temperate marine environments, suggesting that this may be a ubiquitous sponge response to OA conditions. Regression models from these datasets predict that sponge bioerosion could increase by as much as 100-150% by the end of the century, an effect that may have far-reaching consequences for the development of reef habitat (Wisshak et al., 2014; Enochs et al., 2015). The underlying mechanism leading to these stimulated rates remains unclear, but it is thought that OA may reduce the energetic cost of biologically-mediated chemical dissolution, as the calcium carbonate (CaCO3) dissolution threshold would be more easily met under acidified seawater conditions (reviewed by Schönberg et al., 2017).
Prior work investigating the pathways involved in sponge bioerosion have measured significantly lower intracellular pH (pH ≈ 5.0) at the site of chemical dissolution compared to that of ambient seawater (Webb et al., 2019). The same study found that the active transport of low intracellular pH vesicles to the sponge/substrate dissolution front is required to establish an acidified microenvironment necessary to promote chemical dissolution. This process involves the use of several enzymes thought to be responsible for transporting and filling intracellular vesicles (e.g., carbonic anhydrase, V-type proton ATPase, acid phosphatase) that deliver protons to the dissolution front in exchange for bioerosion waste products (i.e., dissolved inorganic carbon). Other binding compounds, such as calcium chelators, are needed for the exchange of calcium (Ca2+) and hydrogen (H+) ions at the dissolution/seawater interface in order to maintain an essential pH gradient (Sullivan et al., 1986; Webb et al., 2019). Transcriptomic responses can provide insight into the molecular mechanisms involved in sponge bioerosion, and to date, remain underreported.
This study represents the first comprehensive evaluation of the combined physiological and molecular impacts of OA on two common excavating sponges native to Caribbean reef ecosystems. Cliona varians (zooxanthellate) and Pione lampa (azooxanthellate) species were incorporated in the experimental design to partition out the light/symbiotic response from the physiological and molecular OA responses. We hypothesized that there would be a molecular signature of the physiological results that could be used to describe the underlying mechanisms behind sponge bioerosion. Addressing this important research need is critical to understand how the essential processes involved in sponge bioerosion are influenced by OA in order to accurately assess their effect on future reef ecosystems and the threat they may pose to habitat persistence throughout the region.
Methods
Sample collection and experimental design
Dead coral skeleton (Siderastrea siderea) was collected from patch reefs in the upper Florida Keys using an underwater pneumatic drill with a 5 cm diameter core bit. Cores were returned to NOAA’s Atlantic Oceanographic and Meteorological Laboratory (AOML), cut into cylinders of consistent height (1 cm x 5 cm diameter), and treated with 12.5% sodium hypochlorite for 48 hrs to remove organic matter (Fang et al., 2013). Each was rinsed with deionized water, dried for 24 hrs at 60°C, dry weighed using a calibrated analytical balance (0.0001 g precision, Ohaus), and CT-scanned (SOMATOM, Siemens) to detect prior boring (Enochs et al., 2016a). Any skeletal cylinders with signs of prior bioeroding activity were not included in the study.
Fragments of reef rock (dead Siderastrea siderea) colonized by P. lampa (forma incrustans) and C. varians (forma incrustans) were collected from reefs in the Florida Keys (Cheeca Rocks, 24.8966 N, 80.6169 W) and State waters of Miami-Dade (Emerald Reef, 25.6742 N, 80.0987 W), respectively, using the same coring methodology. Samples were collected from seven P. lampa parent sponges (72 total samples) and six C. varians parent sponges (64 total samples). The number of samples collected from each parent sponge varied based on the size of the parent sponge, and ranged from eight to 16 samples. Care was taken to ensure each sponge fragment had at least one protruding oscula to conserve sponge filter-feeding activity. Fragments were transported to shore in thermally-insulated 75 L YETI® coolers, cut to a consistent height (1.5 cm x 5 cm cylinder diameter; sponge tissue present at the base of the cylinder) using a diamond band-saw (Gryphon AquaSaw XL), and securely attached to the top of the skeletal cylinders using monofilament (0.8 mm diameter) and stainless-steel crimps (Figure S1). The samples were then left in “recovery baskets” at the site of sponge collection for two-weeks to encourage healing of the scarred tissue and promote attachment to the skeletal cylinders (Figure S1). Following the two-week recovery period, samples were returned to the University of Miami’s Cooperative Institute for Marine and Atmospheric Studies (CIMAS) and NOAA AOML’s Experimental Reef Lab (ERL).
Replicates were randomly allocated across eight independent aquarium systems (75 L glass tank circulating with 75 L sump tank) based on the maximum number of achievable replicates per parent sponge. Samples were acclimated to laboratory conditions for one week that were consistent with their in situ field conditions (28.1°C and 8.05 ± 0.02 pH; mean pH ± diurnal variability). Each tank received incoming seawater from Biscayne Bay (filtered to 1 μm) at a rate of 250 mL min-1 to allow for complete system turnover every 15 hrs. Tank pH conditions were precisely controlled using two gas-specific (CO2 and air) mass flow controllers (GFC series, Aalborg) in an automated system (Enochs et al., 2018). Each tank contained eight samples of C. varians, nine samples of P. lampa, and two control skeletal cylinders with no attached sponges that were used to assess passive dissolution. After acclimation, a one-week ramping period was used to bring the tanks to four randomly assigned pH treatments (two tanks per treatment): pre-industrial (8.15 ± 0.02; mean pH ± diurnal variability), contemporary (8.05 ± 0.02), and two future OA scenarios (moderate OA, 7.85 ± 0.02; extreme OA, 7.75 ± 0.02) (IPCC, 2019). Diurnal pH variability within each treatment mimicked that of natural reef ecosystems, with the pH maximum and minimum occurring at 6 pm and 6 am, respectively. Tanks were maintained at 27.5°C and supplied with 4.5 L hr-1 of fresh seawater. Light was provided by 135 W LED arrays (Hydra 52 HD, Aqua Illumination), with peak photosynthetically active radiation (PAR) set to 250 µmol m-2 s-1. Sponges were fed a protein-rich macroalgal mix (N-rich High Pro, Reed Mariculture, Campbell, USA) every three hrs from 6 pm to 6 am using a custom doser. These daily increments supplied food to a final concentration of 25 μL L-1 (Achlatis et al., 2017). Treatment conditions were maintained for 31 days.
Seawater pH (total scale) was measured continuously in each tank using low-drift Durafet pH sensors (Honeywell) that were calibrated twice weekly using spectrophotometric pH measurements (Agilent Cary, 8454 UV-Vis Spectrophotometer). Additionally, seawater samples (250 mL) were collected weekly from each tank for analysis of spectrophotometric pH, total alkalinity (TA; Apollo SciTech, AS-ALK2), and dissolved inorganic carbon (DIC; Apollo SciTech, AS-C3) in accordance with the manufacturers’ protocols (two seawater replicates; calibrated with certified reference materials, Scripps Institution of Oceanography). Parameters were used to calculate pCO2 (μatm) and ΩAr with CO2SYS (Lewis and Wallace, 1998). Mean carbonate chemistry conditions across treatments and tanks are provided in Table 1.
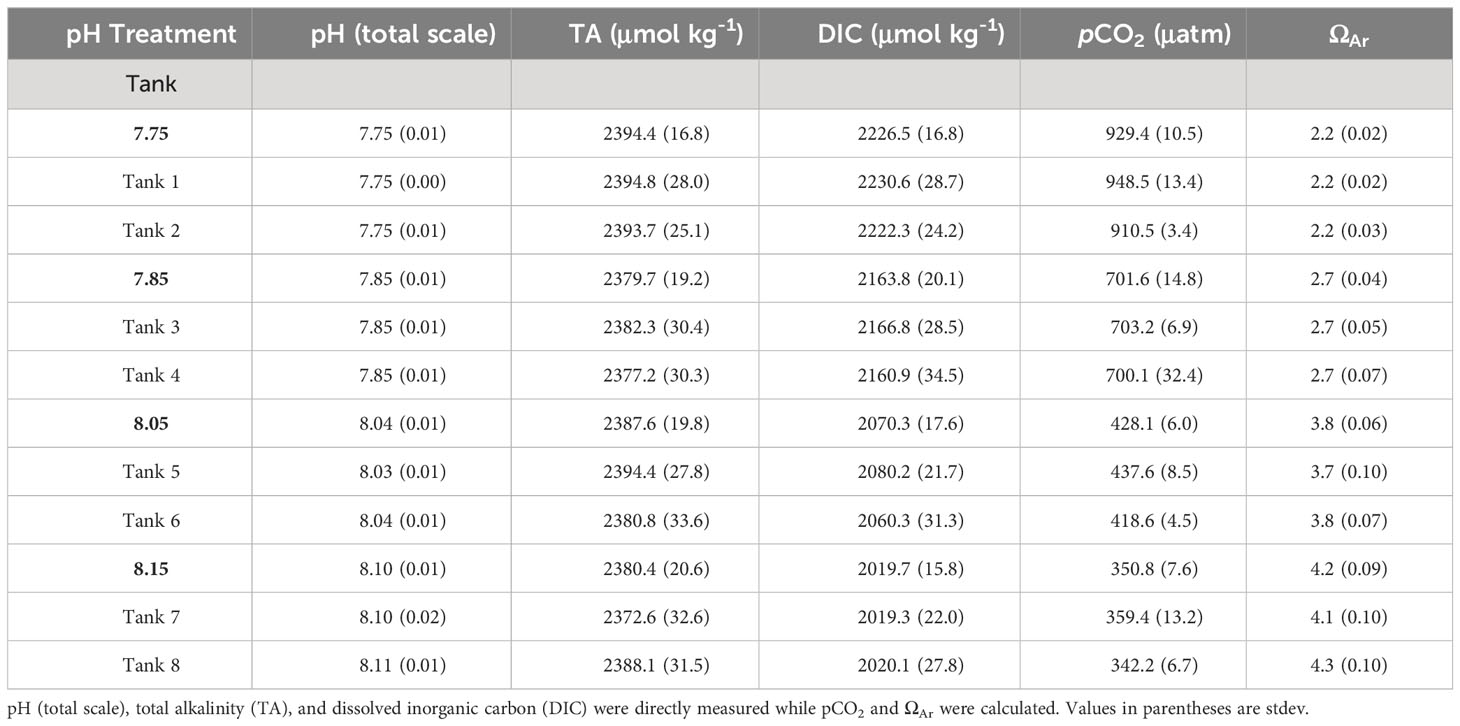
Table 1 Carbonate chemistry parameters across pH treatments (7.75, 7.85, 8.05, 8.15 pH) and tanks.
Total bioerosion
Buoyant weighing (Dodge et al., 1984) was used to quantify total bioerosion using a calibrated analytical balance (0.0001 g precision, Ohaus). Samples were placed on a suspended stainless-steel basket attached to the balance using tungsten wire (0.05 mm). Measurements were taken at the start of treatment conditions and 31 days after treatment conditions. Seawater density (Anton Paar, DMA 5000M) and temperature (Digi-Sense) were used to convert buoyant weight to skeletal mass. The diameter (cm) and height (cm) of sponge tissue was measured with calipers and used to calculate sponge tissue surface area (cm2) for standardization of the bioerosion rates.
Biologically-mediated chemical dissolution
Daytime and nighttime chemical dissolution was measured using the alkalinity anomaly technique (Zundelevich et al., 2007) 21 to 25 days into treatment conditions. Daily incubations were conducted using twenty custom-built light (i.e., clear acrylic) and dark (i.e., black acrylic) 750 mL chambers (Figure S1). Each chamber contained a stir-bar magnetically attached to a 12 V motor that maintained continuous water motion. For each incubation period, four chambers (one sponge sample per chamber) were placed within a treatment tank (five tanks simultaneously used per incubation period), with the incubation order of tanks randomly selected. Sponge samples had a minimum of a one-day “rest period” between the day and night incubations. Sponge samples were monitored for signs of physiological stress (e.g., tissue paling, closing of oscula) after each incubation period. Dark incubations were run from 6:00 am to 9:00 am, with the treatment tanks blacked out the night before to ensure dark acclimation of the sponges prior to the incubations. Light incubations were run from 12 pm to 3 pm, with each chamber exposed to a consistent PAR (250 µmol m-2 s-1). Sponge samples were returned to their treatment tanks following each incubation, with the duration spent in the enclosed chamber never exceeding the 3 hr incubation period.
Chemical dissolution measurements were performed on a subset of each species (i.e., 48 per species, 12 per treatment, 6 per tank) from the 31-day experiment. Additionally, eight control skeletal cylinders were incubated to account for the impact of passive dissolution. Seawater samples (250 mL) were taken at the start and end of each incubation and analyzed for TA, pH, and DIC as above. Oxygen levels were monitored to confirm that incubations did not reach hyperoxic (200-250% dissolved oxygen; Cohen et al., 2017) or hypoxic (< 75% dissolved oxygen; Haas et al., 2014) conditions. Nutrients (ammonium, phosphate, nitrate, nitrite) were analyzed (SEAL Analytics) and applied as TA corrections to ensure that the change in TA used to estimate chemical dissolution came exclusively from calcium carbonate (CaCO3) dissolution/precipitation and was independent of nutrient production/consumption (Webb et al., 2017). Biologically-mediated chemical dissolution (mg CaCO3 cm-2 d-1) rates were calculated from the corrected change in TA using the formula described by Zundelevich et al. (2007) and were standardized to the tissue surface area of each sponge sample.
Mechanical bioerosion:
Daytime and nighttime mechanical bioerosion rates were evaluated through the collection of sponge sediment chips (Fang et al., 2013) 25 to 29 days into treatment conditions. The same subset of 48 sponges per species from the chemical dissolution experimentation were each placed within submerged, open-top containers (750 mL) for 10-hr day (7 am to 5 pm) and night (8 pm to 6 am) periods. Sponges had a one-day “rest period” between the day and night collections. Following the collection period, the seawater within each container was poured through a 100 µm sieve to remove coarser materials and vacuum filtered through a pre-combusted/pre-weighed GF/F glass microfiber filter paper (0.7 µm pore size). The filter paper was then combusted again at 550°C for 3 hrs, yielding only the weight of the collected sediment chips (Fang et al., 2013). Mechanical bioerosion rates (mg CaCO3 cm-2 d-1) were standardized to sponge tissue surface area.
Statistical analysis of physiological response data
Prior to running the statistical tests, parent sponge identity and tank effects were evaluated for all bioerosion metrics. The assumptions of normality (Shapiro-Wilk test) and equal variance (Bartlett’s test) were met for both blocking factors, and statistical tests (ANOVA) determined that neither had a significant effect on any of the bioerosion metrics. This was further confirmed through additional testing with a reduced dataset of fully-crossed individuals across all tanks and treatments. Therefore, parent sponge identity and tank were removed as factors, with sponge sample used as a factor in the models. Separate one-way ANOVAs were used for the statistical analysis of bioerosion rates for each species with pH treatment used as a fixed effect. An individual ANOVA was conducted for all three bioerosion parameters: total bioerosion, chemical dissolution (day and night), and mechanical bioerosion (day and night) (α = 0.05). Post-hoc Tukey’s tests were used to evaluate treatment groups that were significantly different from one another (p < 0.05). Statistical analyses and development of plots were conducted with R (R Core Team, 2020), RStudio (RStudio Team, 2020), and ggplot extensions (Wickham, 2016).
Sample collection and preparation for sponge transcriptomic profiling
Transcriptomic samples were taken from the 8.05 and 7.75 pH treatment groups at 12 pm on day five of the 31-day experiment. As to not affect downstream physiological measurements of the sampled sponges, small razor blade scrapes were taken, resulting in ~1-2 mm of sponge tissue. Prior to sampling, razor blades were cleaned using RNase AWAY™ (Thermo-Fisher Scientific). For transcriptomic profiling, only three of the seven P. lampa parent sponges and three of the six C. varians parent sponges were sampled. For each treatment (8.05 and 7.75 pH), this resulted in four replicates (two from each experimental tank) from each parent sponge. Tissue samples were rapidly transferred to 2-mL microcentrifuge tubes, submerged in 1 mL of TRIzol™ (Invitrogen), flash-frozen in liquid nitrogen, and stored at -80°C. Sampled sponges were monitored after the tissue collection, with full recovery (tissue healing) reported after two to three days.
RNA extractions
Total RNA was extracted from each sponge biopsy following Mayfield et al. (2011), with an initial modification of a bead mill used in place of a mortar and pestle for sample homogenization. Frozen sponge tissues were thawed and stainless-steel beads (Navy Eppendorf RNA Lysis Kit) were added to each 2 mL sample tube. Homogenization was done using a FastPrep-24 Classic (MP Biomedicals) with four rounds of 30 s at 6 m/s. Between each FastPrep round, samples were placed on ice for 5 min to avoid heat buildup from homogenization. Following homogenization, 250 µL of homogenized sponge tissues and 750 µL of fresh TRIzol were combined in a new 1.5-mL microcentrifuge tube.
Tubes containing homogenized tissue and TRIzol were vortexed and incubated at room temperature (RT) for 10 min. Chloroform (200 µL) was added to each tube, and the samples were vigorously vortexed, incubated at RT for 3 min, and centrifuged at 12,000 xg and 4°C for 15 min. The RNA-containing aqueous phase (~550 µL) was transferred to new 1.5-mL tubes that were prefilled with 250 µL of “high salt” solution (0.8 M Na citrate and 1.2 M NaCl) and 250 µL of isopropanol. Tubes were vortexed and incubated on ice for 10 min. This was followed by centrifugation at 12,000 xg at 4°C (10 min each). The supernatant was removed, and the RNA pellet was washed with 1 mL of 75% ethanol. RNA pellets were dried on the lab bench for 60-100 min to evaporate any residual ethanol. Dried RNA pellets underwent a DNase I digestion with the following solution: 45 µL RNase-free water, 5 µL of 10x DNase I buffer (Machery-Nagel), and 0.5 µL DNase I (Machery-Nagel). RNA pellets were resuspended in 50.5 µL of DNase I solution and incubated at RT for 15 min.
The remaining RNA extraction steps were conducted using the RNA Clean & Concentrator™-5 kit (Zymo Research) with no deviations from the manufacturer protocol. RNA was eluted in 30 µL of nuclease-free water pre-warmed to 25°C. Quantification of RNA was assessed using a Nanodrop 8000 Spectrophotometer (Thermo-Fisher Scientific) and an initial quality check was made by electrophoresing 5 µL on 0.8% TBE-agarose gels with 1X SYBR® Gold (Thermo-Fisher Scientific). Samples with > 25 ng/µL, and for which 28s and 18s bands were present on the gel, were shipped on dry ice to the Duke University Center for Genomic and Computational Biology. Additional quality control was undertaken by the sequencing core using a Qubit™ fluorometer (Thermo-Fisher Scientific) and an Agilent Bioanalyzer 2100 (Table S1). Only samples with RNA integrity numbers (RIN) > 7.0 were prepared for RNA-Seq. cDNA libraries were prepped using Kapa Stranded mRNA-Seq library prep kit (Illumina) with 100 ng of total RNA. Samples were sequenced across one Illumina NovaSeq 6000 lane to produce 2 x 150 S-Prime base pair (bp) paired-end (PE) reads with requested 10 M PE reads per sample.
RNA sequencing and bioinformatic analysis
All scripts and data files used for the bioinformatic analysis are available on Github repositories for C. varians (Morris and Studivan, 2023) and P. lampa (Studivan, 2023). Demultiplexing was done by the sequencing facility, and read quality was assessed and visualized using FastQC (Andrews, 2010). Adaptor sequences and low-quality reads (Phred < 15) were removed using Cutadapt (Martin, 2011). Re-pairing and deduplicating of the trimmed reads was performed prior to the transcriptome assembly to remove any PCR duplicates. De novo transcriptome assembly was completed for both species using Trinity (Grabherr et al., 2011). The assembled transcriptomes were then filtered for reads ≥ 500 bp, mitochondrial RNA (mitoRNA) and ribosomal RNA (rRNA) contamination was removed, and GC-content was evaluated.
For C. varians, the sponge host and symbiont sequences were bioinformatically filtered and separated by comparison to the complete genomes of Amphimedon queenslandica (Demospongiae) and Symbiodinium microadriaticum (Symbiodiniaceae), as well as the NCBI’s non-redundant protein (nr) database. Annotation of the de novo assembled sponge transcriptomes was completed using UniProt (The UniProt Consortium, 2018), Gene Ontology (Ashburner et al., 2000), and KEGG (Kanehisa and Goto, 2000) annotation resources, and eggnog-mapper (Cantalapiedra et al., 2021) was used to generate annotations based on the GO/KOG databases.
Sponge reads were aligned and quantified to their respective de novo reference transcriptomes using bowtie2 (Langmead and Salzberg, 2012) and samtools before being read into R (R Core Team, 2020) and RStudio (RStudio Team, 2020) for downstream analyses.
Differential gene expression and GO enrichment analysis
An initial pre-filtering to remove low count genes (less than 1 count in greater than 8 samples) was used to reduce memory requirements and increase computational speed. Principal components analysis (PCA) was performed using a variance stabilized transformation (VST) (Love et al., 2014) of the low count filtered genes. The function PCAtools::eigencorplot (Blighe and Lun, 2020) was used to correlate metadata variables of interest with each PC axes using Pearson correlation coefficients (PCC) and statistical significance for the respective metadata variables. A likelihood ratio test (LRT) in DESeq2 (Love et al., 2014) was used to identify all differentially expressed genes between parent sponge for each species (p.adj < 0.05), with subsequent contrasts run between parent sponge (alpha < 0.05). To identify sets of unique and common genes between parent sponge contrasts within each species, Venn diagram analysis was performed using the R package venn (Dusa, 2022). To identify the effect of OA, the DESeq2 model ~ parent sponge + treatment was used, with genes deemed significantly differentially expressed if p.adj < 0.05. For all significance testing using DESeq2 (Love et al., 2014), the adjusted p-value was computed using the Benjamini-Hochberg methodology.
Visualization of the significant OA differentially expressed genes (DEGs) was done using the VST counts with parent sponge identity variance removed using limma (Ritchie et al., 2015). Variance removed VST counts were then used as input for visualization in ComplexHeatMap (Gu et al., 2016), with hierarchical clustering of genes (rows) and samples (columns) incorporated.
Gene ontology (GO) enrichment analyses were run using Cytoscape (Shannon et al., 2003) and BiNGO (Maere et al., 2005) using the gene to GO identifiers generated during the de novo transcriptome assembly annotations. To test for enrichment against the background gene set, the genes remaining after initial low count filtering were used. The hypergeometric test was utilized, and p-values were corrected with a Benjamini-Hochberg false discovery rate (FDR) with alpha set to 0.01.
Results
Total bioerosion
Treatment had a significant effect on total bioerosion rates for zooxanthellate C. varians and azooxanthellate P. lampa (ANOVA: Table 2, Figure 1). Post hoc analysis revealed that C. varians total bioerosion rates were significantly higher under 7.85 conditions than 8.15 (p = 0.012; Figure 1A). While no other treatment groups were significantly different for C. varians, there was a trend towards increased bioerosion rates for sponges exposed to 7.85 pH conditions compared to 8.05 (p = 0.099). For P. lampa, total bioerosion rates measured in both OA treatments (7.75 pH and 7.85 pH) were significantly higher than the 8.15 treatment (p = 0.046 and p = 0.027, respectively; Figure 1B). Relative to contemporary pH conditions, P. lampa bioerosion rates were elevated in the 7.75 and 7.85 OA treatments, although neither were statistically significant (p = 0.118 and p = 0.073, respectively).
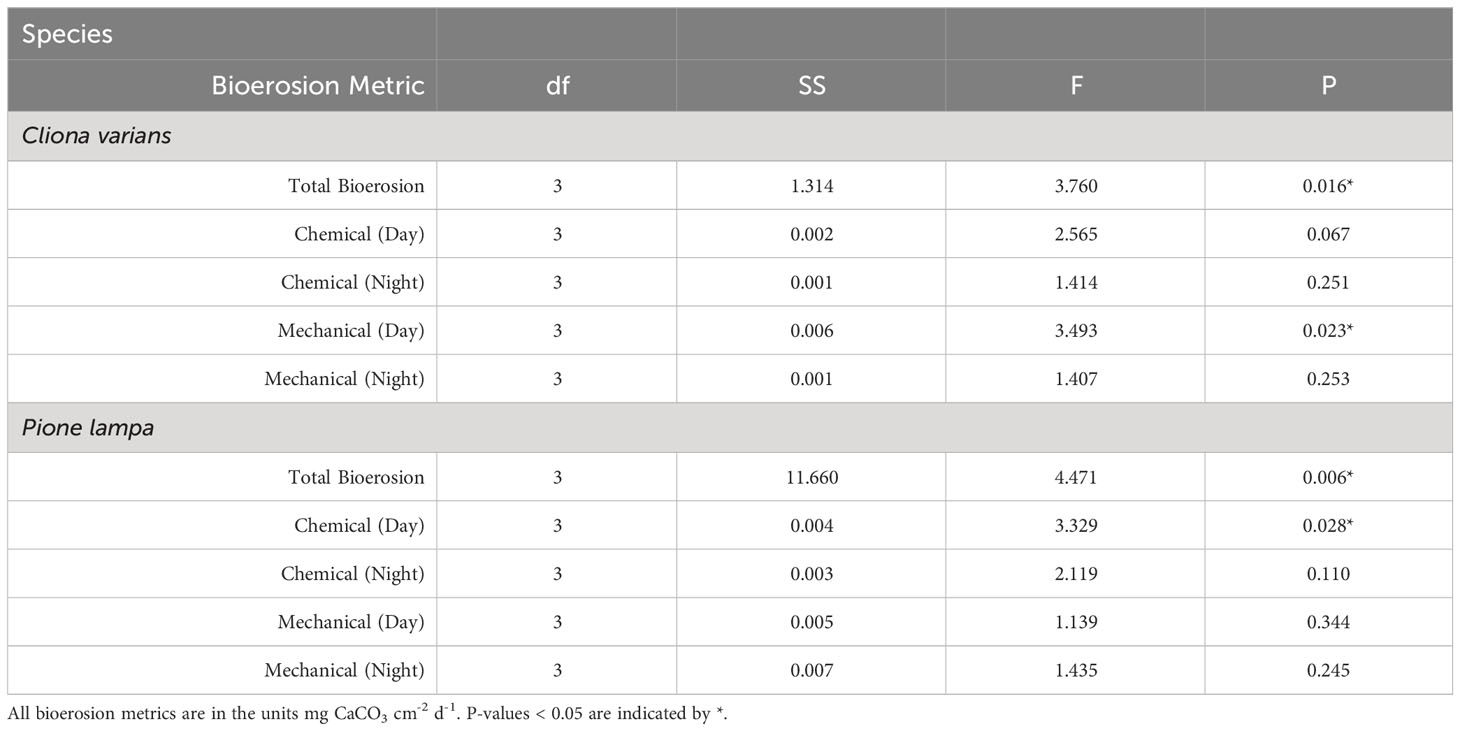
Table 2 One-way ANOVA results for total bioerosion, chemical dissolution (day and night), and mechanical bioerosion (day and night) across treatment for Cliona varians and Pione lampa.
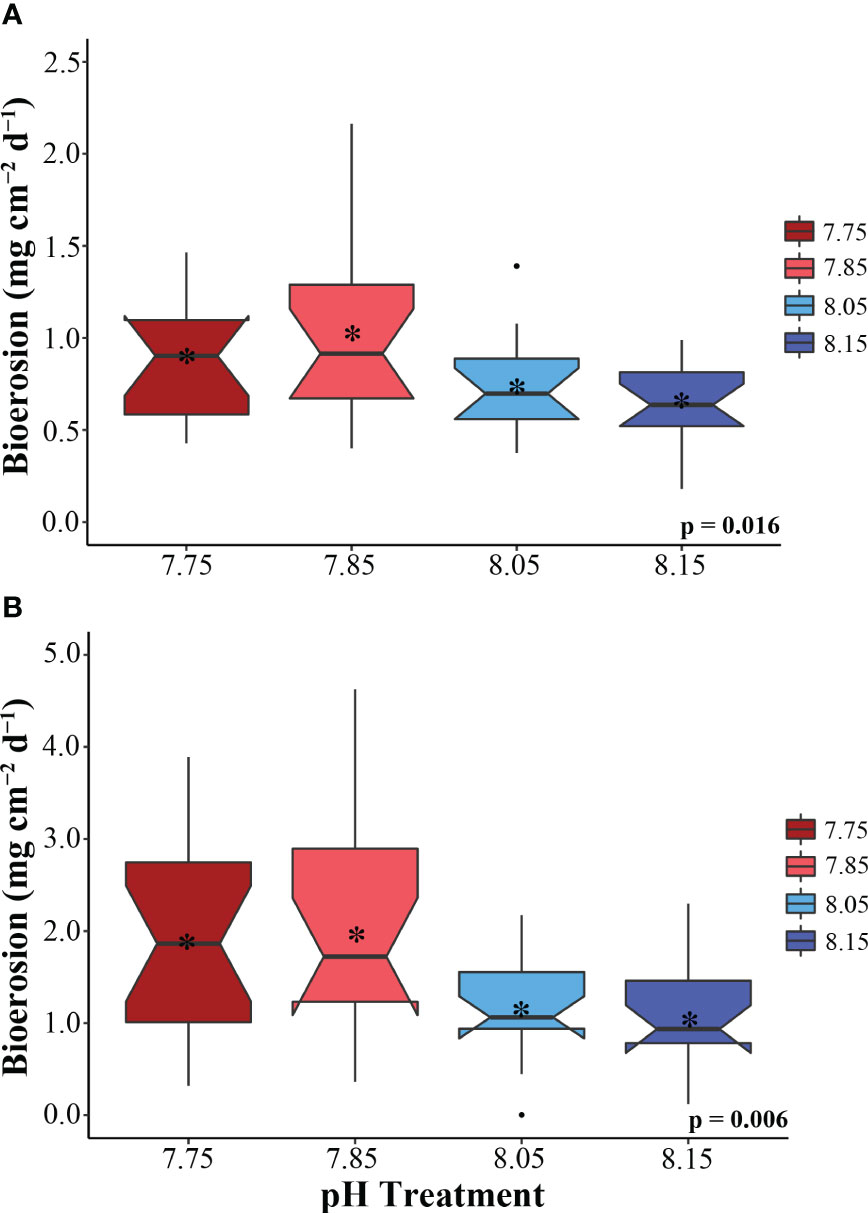
Figure 1 Total bioerosion rates (mg cm-2 day-1) for the zooxanthellate sponge C varians (A) (n = 16) and the azooxanthellate sponge, P. lampa (B) (n = 18), subjected to the following pH treatment conditions (mean pH): 7.75 (dark red), 7.85 (light red), 8.05 (light blue), 8.15 (dark blue) (y-axis scale is species specific). P-values for treatment effects are indicated (ANOVA). Central horizontal bars represent median values and notches indicate 95% confidence intervals around the medians. Error bars represent Std. error. * indicates mean bioerosion rate.
Under 7.85 pH conditions, average rates were 1.03 ± 0.12 mg CaCO3 cm-2 d-1 (mean ± SEM) for C. varians and 1.97 ± 0.31 mg CaCO3 cm-2 d-1 for P. lampa. In comparison, a slight decline in bioerosion was measured for sponges in the most extreme 7.75 pH treatment group (0.85 ± 0.08 and 1.88 ± 0.24 mg CaCO3 cm-2 d-1, respectively). The lowest average rates were found in the pre-industrial pH treatment (0.64 ± 0.05 and 1.05 ± 0.15 mg CaCO3 cm-2 d-1, respectively). This was followed by the contemporary pH treatment group, where average bioerosion rates were 0.73 ± 0.07 mg CaCO3 cm-2 d-1 for C. varians and 1.18 ± 0.13 mg CaCO3 cm-2 d-1 for P. lampa.
Biologically-mediated chemical dissolution
The incubations of the control skeletal cylinders measured negligible passive dissolution (0.71 ± 0.31 μmol kg-1; mean change in TA ± SEM) with no significant difference reported across treatments (F3,4 = 1.47, p = 0.350). This TA signal represented only 7.9% and 6.1% of the average TA signal for C. varians and P. lampa, respectively. As such, chemical dissolution rates of the sponge samples were not corrected for passive dissolution.
Cliona varians daytime (Figure 2A) and nighttime (Figure 2B) chemical dissolution rates were not significantly different among treatments (ANOVA: Table 2). The highest average daytime rates were measured in the 7.85 and 8.05 treatments (0.038 ± 0.004 and 0.036 ± 0.005 mg CaCO3 cm-2 d-1, respectively), whereas the lowest daytime rates were measured in the 7.75 and 8.15 treatments (0.024 ± 0.003 and 0.028 ± 0.004 mg CaCO3 cm-2 d-1, respectively). In comparison, average nighttime chemical dissolution rates were higher under pre-industrial (0.031 ± 0.004 mg CaCO3 cm-2 d-1) than contemporary pH conditions (0.022 ± 0.003 mg CaCO3 cm-2 d-1), although the relationship was not significant. Sponges of the two OA treatments (7.85 and 7.75) were characterized by virtually identical nighttime chemical dissolution rates (0.028 ± 0.003 and 0.028 ± 0.002 mg CaCO3 cm-2 d-1, respectively).
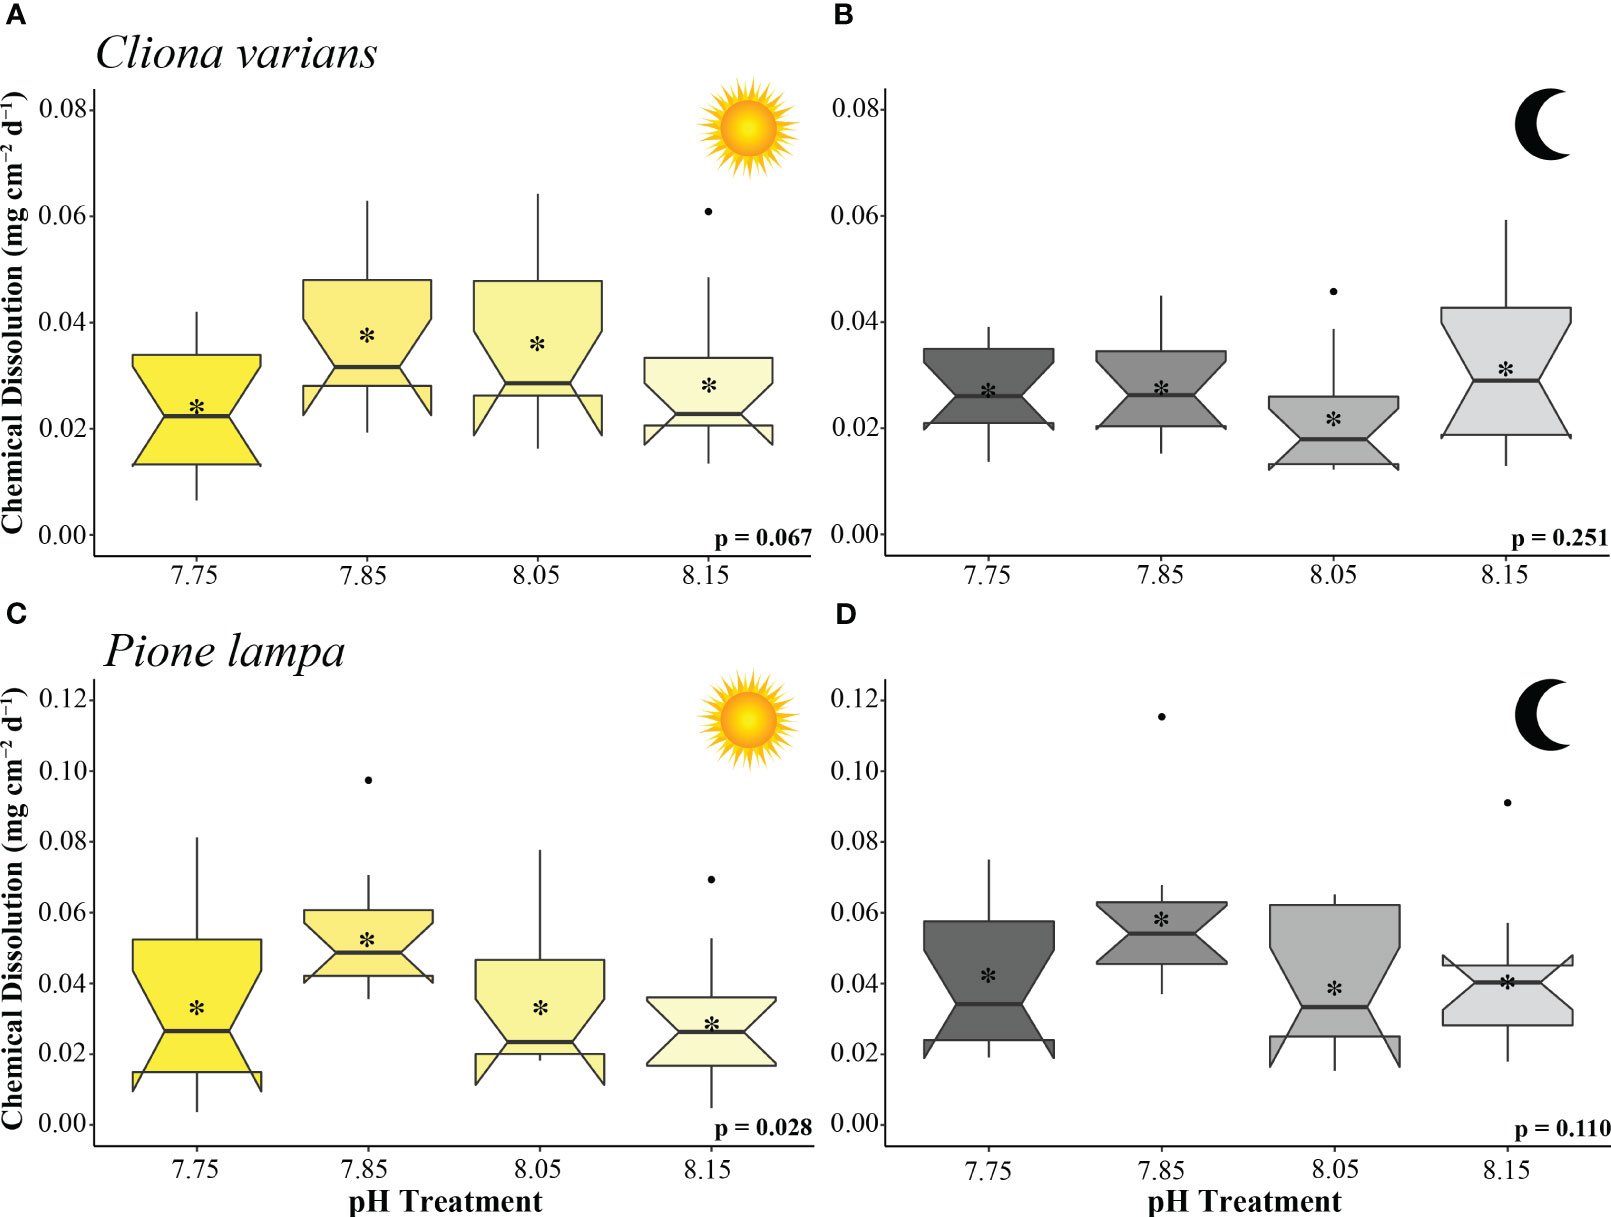
Figure 2 Chemical dissolution rates (mg cm-2 d-1) of zooxanthellate sponge, C varians (A, B) (n = 12), and azooxanthellate sponge, P. lampa (B, C) (n = 12), subjected to the following pH treatment conditions (left to right; mean pH): 7.75, 7.85, 8.05, 8.15 (y-axis scale is species specific). Measurements came from 3 hr static incubations (collected 21 to 25 days into treatment conditions) conducted under light (A, C) and dark (B, D) scenarios. P-values for treatment effects under day and night scenarios are indicated (ANOVA). Central horizontal bars represent median values and notches indicate 95% confidence intervals around the medians. Error bars represent Std. error. * indicates mean bioerosion rate.
Pione lampa daytime chemical dissolution rates were significantly different across treatments (Figure 2C) whereas nighttime rates were not (Figure 2D) (ANOVA: Table 2). Post hoc analysis revealed that daytime chemical dissolution rates in the 7.85 treatment (0.054 ± 0.005 mg CaCO3 cm-2 d-1) were significantly higher (p = 0.028) than those from the 8.15 treatment (0.029 ± 0.006 mg CaCO3 cm-2 d-1). Average daytime chemical dissolution rates under 7.85 conditions were higher than that of the 8.05 (0.034 ± 0.006 mg CaCO3 cm-2 d-1) and 7.75 treatments (0.034 ± 0.007 mg CaCO3 cm-2 d-1), though neither were significant (p = 0.108 and p = 0.107, respectively). While nighttime chemical dissolution rates were not significantly different across treatments, sponges exposed to 7.85 pH conditions had higher average nighttime rates (0.057 ± 0.006 mg CaCO3 cm-2 d-1) than those from the 8.15 (0.041 ± 0.006 mg CaCO3 cm-2 d-1), 8.05 (0.039 ± 0.005 mg CaCO3 cm-2 d-1), and 7.75 (0.042 ± 0.006 mg CaCO3 cm-2 d-1) treatments.
Mechanical bioerosion
Cliona varians daytime mechanical bioerosion rates (Figure 3A) were significantly different across treatments (ANOVA: Table 2). Daytime mechanical bioerosion rates under 8.05 pH conditions (0.052 ± 0.005 mg CaCO3 cm-2 d-1) were significantly higher than those measured from the 8.15 treatment (0.022 ± 0.002 mg CaCO3 cm-2 d-1) (p = 0.013). There was also a trend towards higher average daytime mechanical bioerosion rates in the 8.05 pH treatment than the 7.85 (0.041 ± 0.011 mg CaCO3 cm-2 d-1) and 7.75 (0.037 ± 0.004 mg CaCO3 cm-2 d-1) OA treatments, though neither difference was significant (p = 0.658 and p = 0.388, respectively). Average nighttime mechanical bioerosion rates ranged from 0.023 ± 0.002 mg CaCO3 cm-2 d-1 (7.85 pH treatment) to 0.033 ± 0.004 mg CaCO3 cm-2 d-1 (8.05 pH treatment) and were not significantly different across treatments (ANOVA: Table 2, Figure 3B).
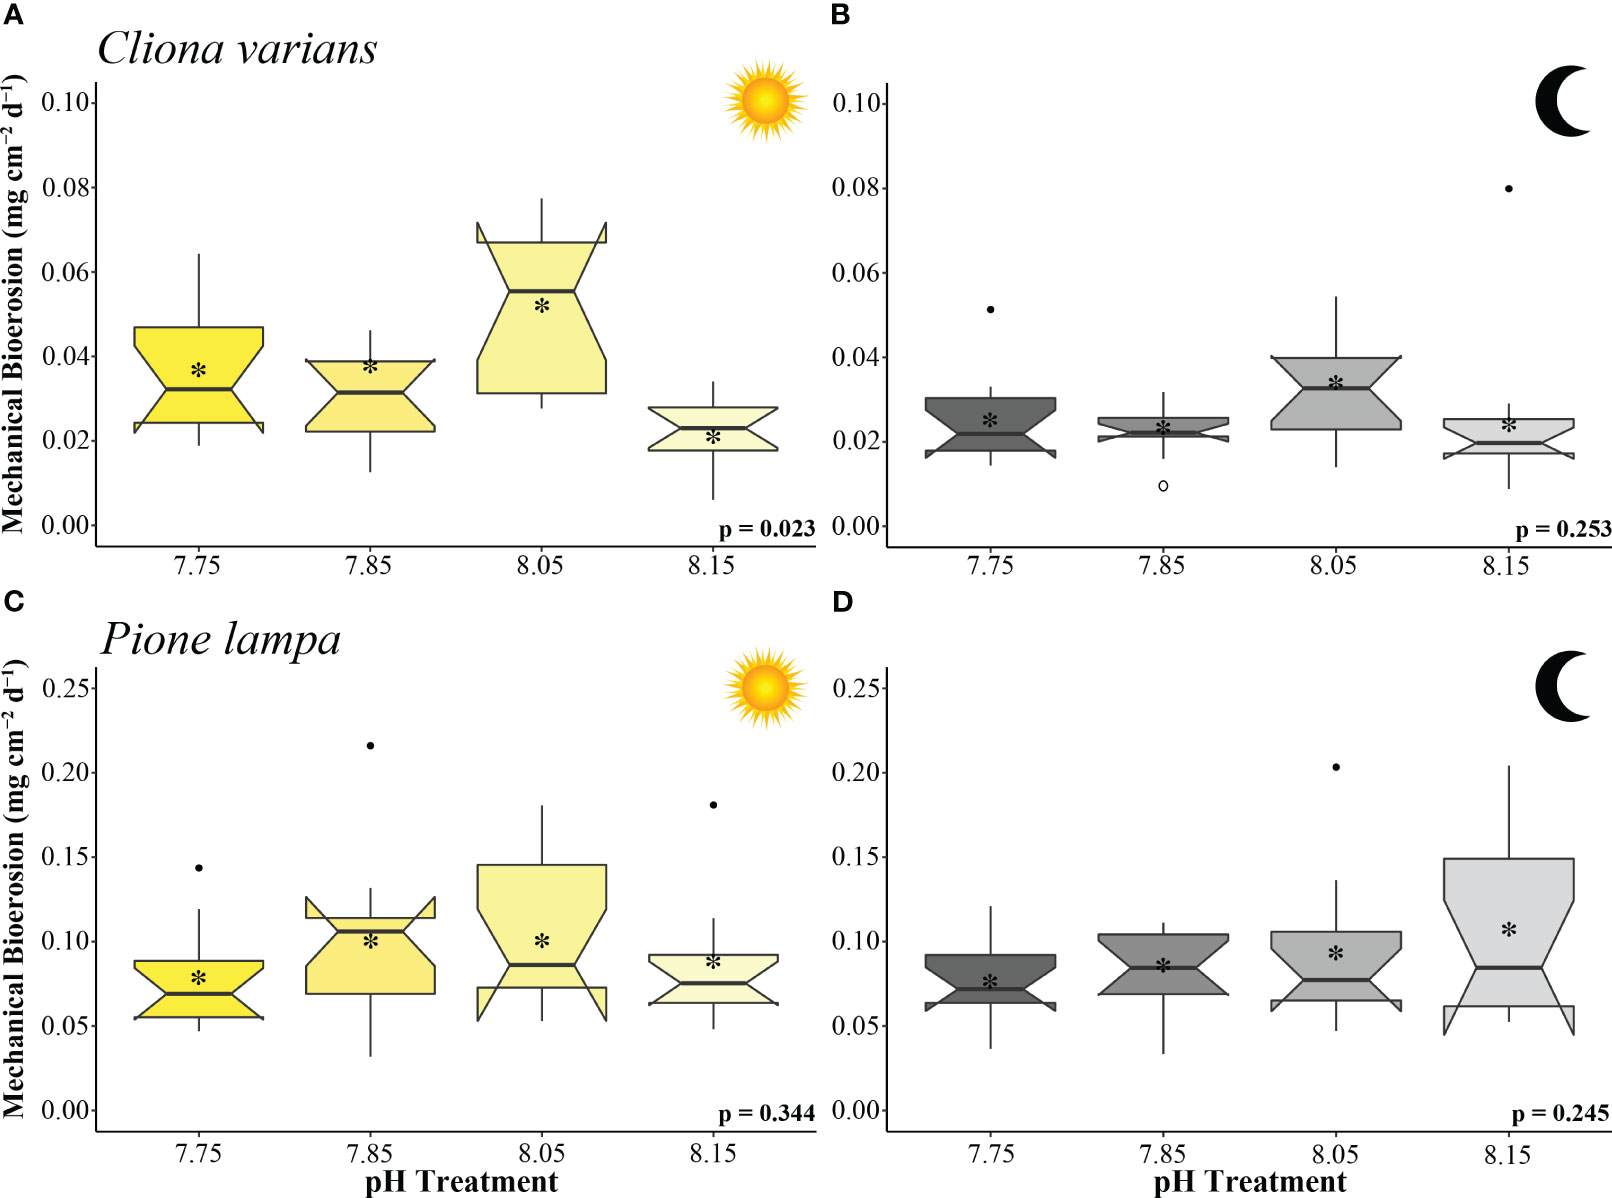
Figure 3 Mechanical bioerosion rates (mg cm-2 d-1) of zooxanthellate sponge, C varians (A, B) (n = 12), and azooxanthellate sponge, P. lampa (B, C) (n = 12), subjected to the following pH treatment conditions (left to right; mean pH): 7.75, 7.85, 8.05, 8.15 (y-axis scale is species specific). Measurements came from the collection of sponge chips (collected 25 to 29 days into treatment conditions) conducted under light (A, C) and dark (B, D) 10 hr scenarios. P-values for treatment effects under day and night scenarios are indicated (ANOVA). Central horizontal bars represent median values and notches indicate 95% confidence intervals around the medians. Error bars represent Std. error. * indicates mean bioerosion rate.
Pione lampa daytime (Figure 3C) and nighttime (Figure 3D) mechanical bioerosion rates were not significantly different among treatments (ANOVA: Table 2). Average mechanical bioerosion rates were 0.091 ± 0.005 under daytime conditions and 0.089 ± 0.005 mg CaCO3 cm-2 d-1 under nighttime conditions, and were similar across all treatments.
Transcriptomic profiling - sequencing depth, read alignment, and transcript quantification
A total of 23 samples of C. varians, average sequencing depth of 10.2 x 10⁶ PE reads, and 22 samples of P. lampa, average sequencing depth of 11.6 x 10⁶ PE reads, were successfully sequenced. Trinity (Grabherr et al., 2011) de novo transcriptome assembly outputted a total of 346,222 and 220,699 sequences for C. varians and P. lampa, with an average contig length of 1,453 and 1,260 bp respectively (Table 3). Quantification using bowtie2 (Langmead and Salzberg, 2012) resulted in counts for 45,009 and 88,405 genes for C. varians and P. lampa, respectively.
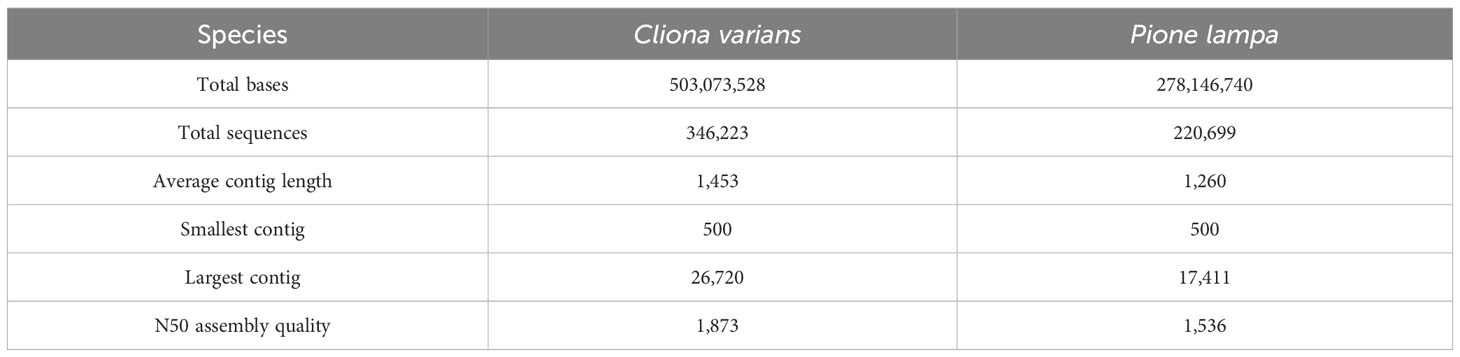
Table 3 Transcriptome statistics of the de novo transcriptome assembly from Trinity for Cliona varians (zooxanthellate) and Pione lampa (azooxanthellate) sponges.
Differential gene expression and GO enrichment analysis
PCA identified parent sponge (PS) as the largest driver of gene expression, with a significant correlation of PS identity for C. varians on PC1 (r2 = 0.66, explained variance = 69%) (Figure 4A) and P. lampa on PC2 (r2 = 0.73, explained variance = 23%) (Figure 4C). For both species, visualization of PC1 (69% explained variance; 39% explained variance) and PC2 (11% explained variance; 23% explained variance) corroborated the correlation results, with no overlap between 95% confidence intervals for C. varians (Figure 4B) and P. lampa (Figure 4D). LRT analysis detected significantly differentially expressed genes (DEGs) when looking at PS identity for C. varians and P. lampa. Venn analysis identified 738 genes for C. varians and 963 genes for P. lampa that were present in all DESeq2 contrasts between PS (Figure S2).
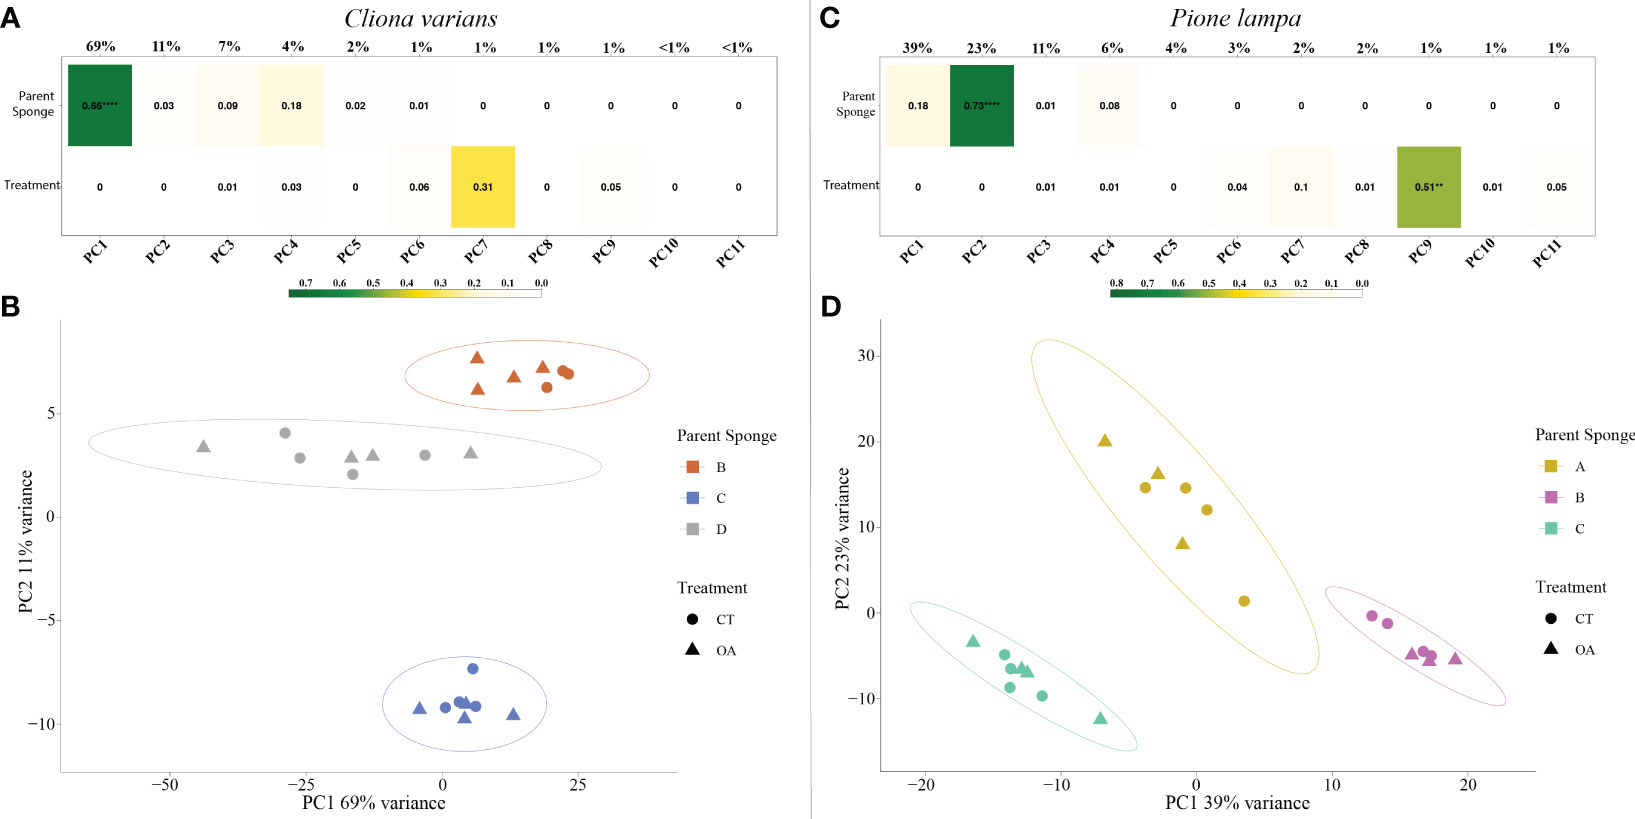
Figure 4 Correlation matrix of the variables parent sponge (top) and treatment (bottom), including their correlation to the principal components (PC1 to PC11) for C varians (A) and P. lampa (C). The r2 correlation is represented within each box and the level of significance is listed as follows: 0.01 to 0.001 = **, 0.001 to 0.0001 = ***, <0.0001 = ****. Color gradient describes the level of correlation for the two variables, with green depicting strong correlation, yellow depicting moderate correlation, and white depicting weak correlation. PC1 (explained variance = 69%) and PC2 (explained variance = 11%) for C varians (B), and PC1 (explained variance = 39%) and PC2 (explained variance = 23%) for P. lampa (D), identified clear clustering of the parent sponges for both species. CT represents the contemporary pH treatment (8.05 pH) and OA represents the extreme OA treatment (7.75 pH).
PCA revealed no strong correlation between pH treatment (8.05 pH and 7.75 pH) and gene expression for C. varians (Figure 4A) or P. lampa (Figure 4C). When accounting for PS identity, differential gene expression analysis identified sets of significantly DEGs between the 8.05 and 7.75 pH treatments for C. varians (177 DEGs; 9 upregulated and 168 downregulated) and P. lampa (105 DEGs; 17 upregulated and 88 downregulated) (Table S2). Using generated annotation files, 95% (C. varians) and 77% (P. lampa) of significant DEGs received annotation (Supporting data, see methods section). Visualization of annotated genes identified clear treatment and expression clusters for C. varians (Figure 5) and P. lampa (Figure 6).
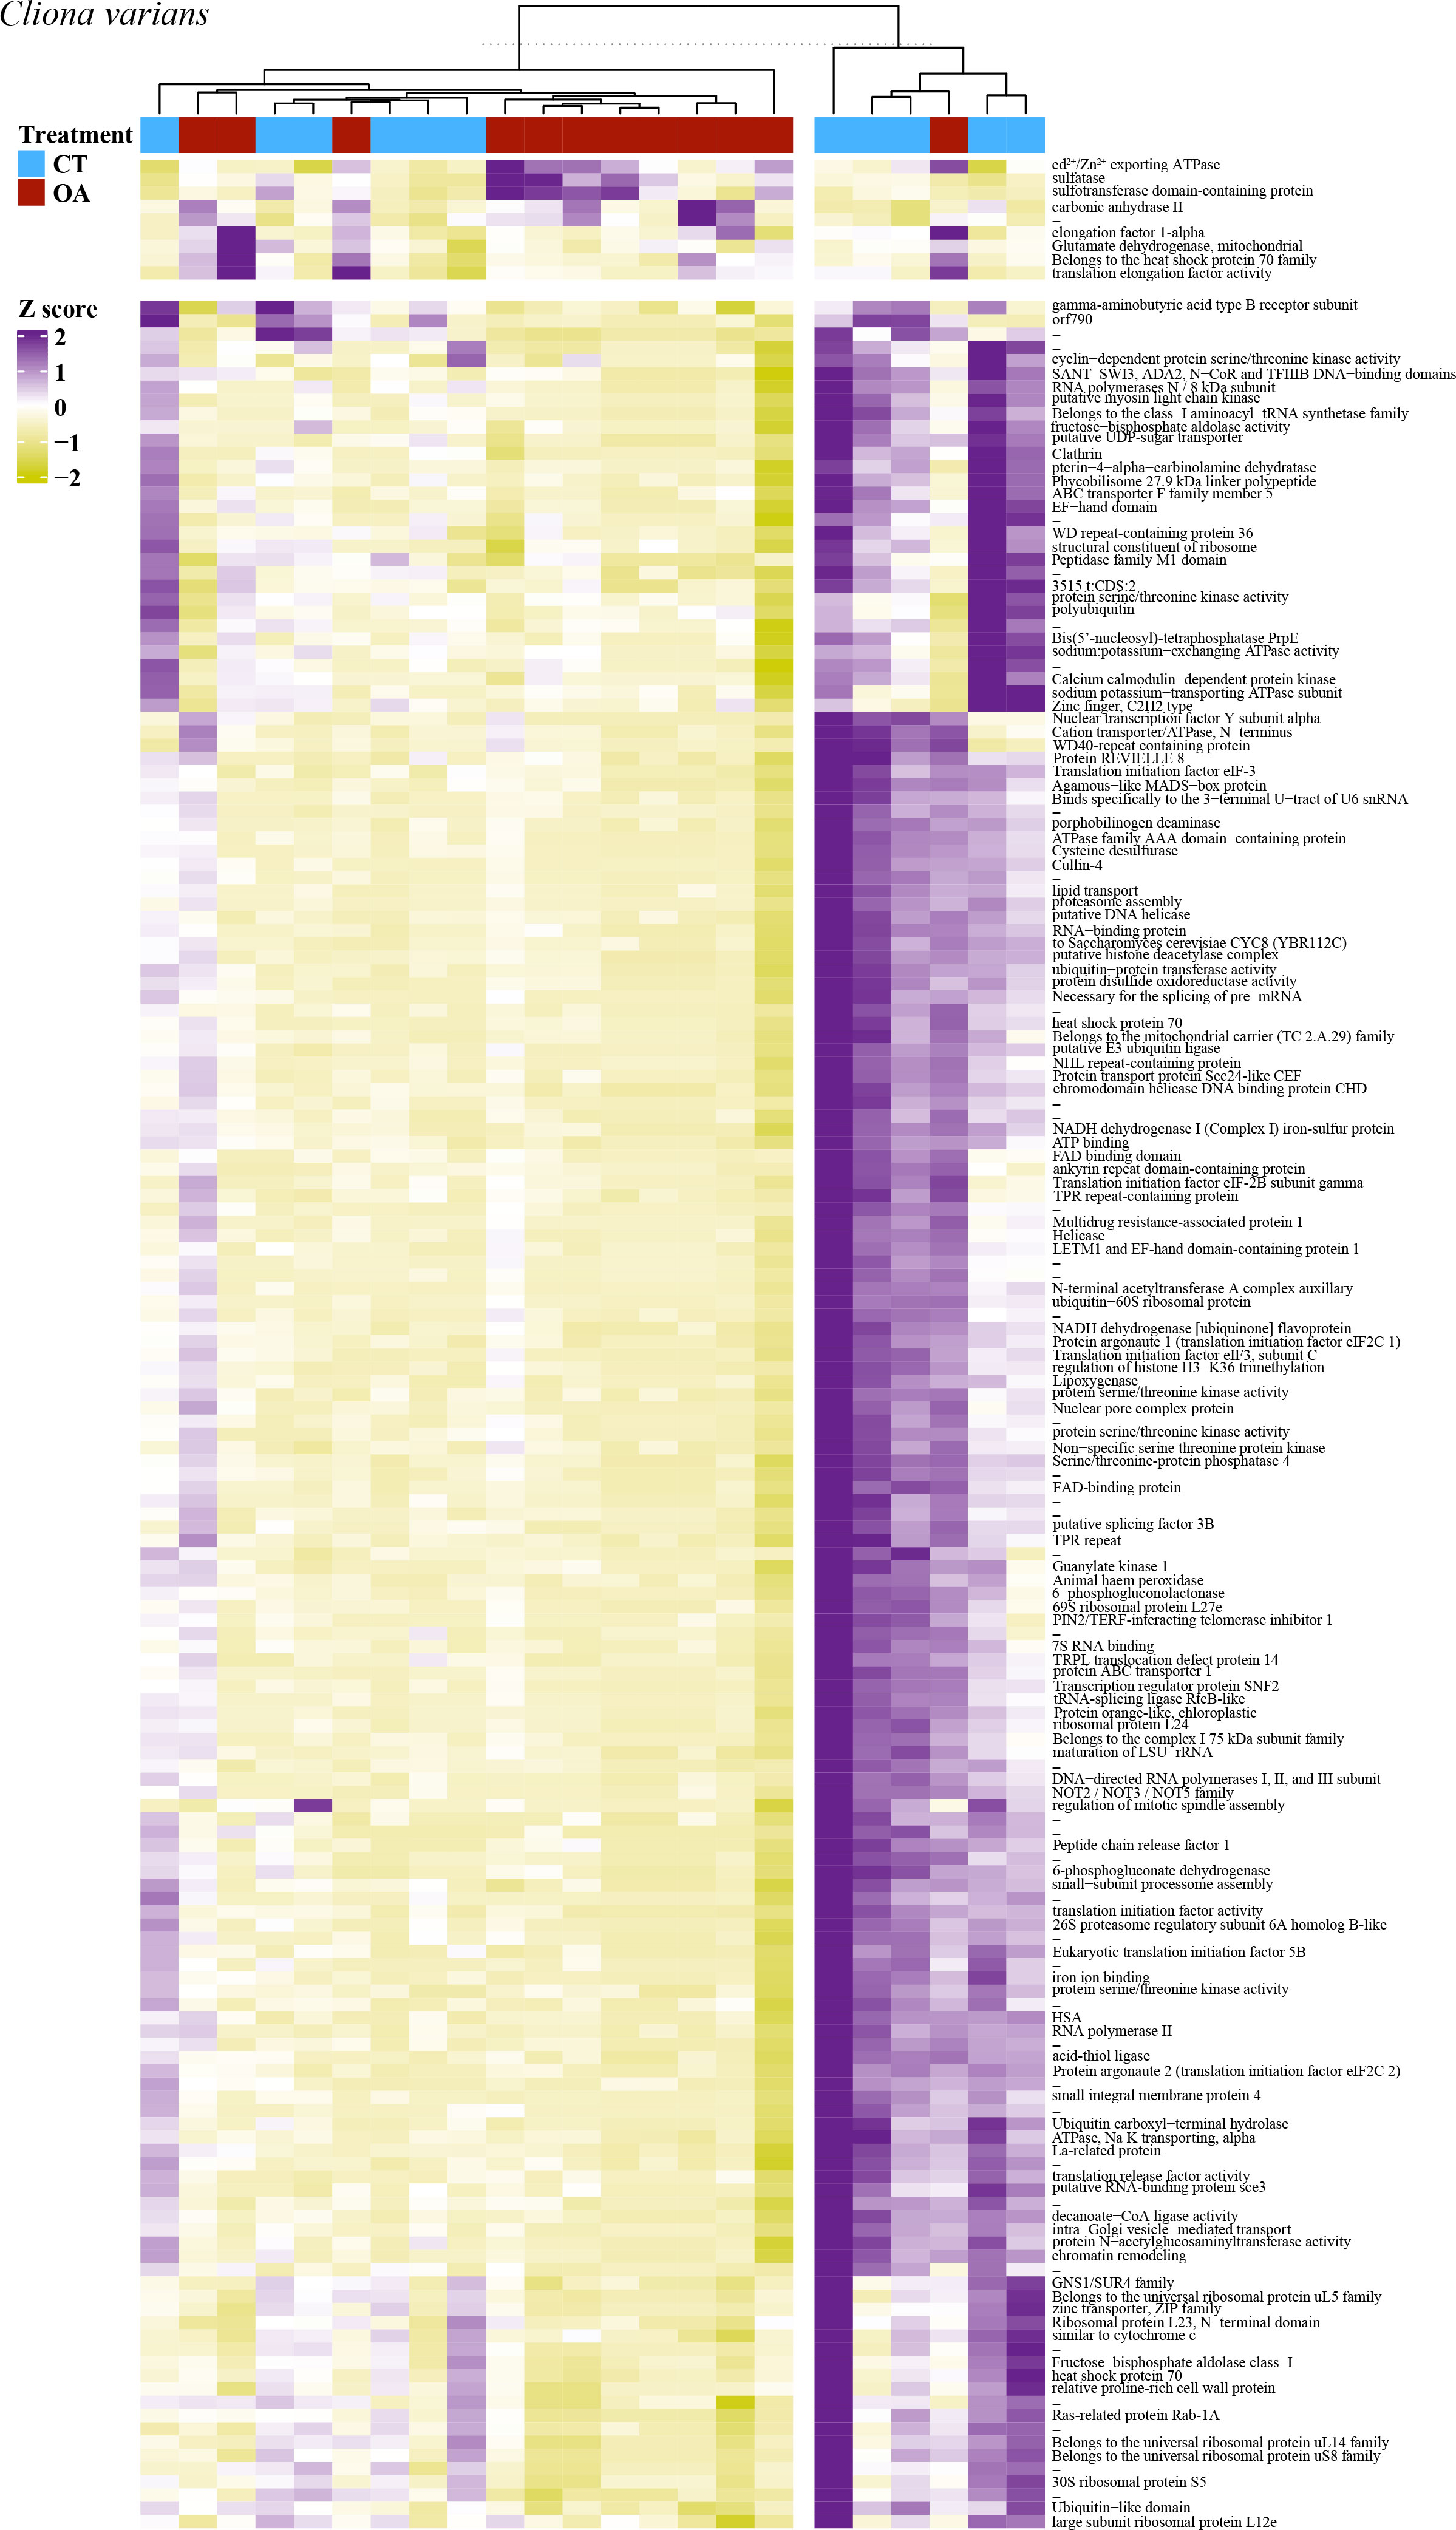
Figure 5 A heatmap of the 177 significantly differentially expressed genes for C. varians, with VST of the raw filtered gene counts used to remove parent sponge variance. Purple coloring describes higher gene expression relative to other samples, yellow coloring describes lower gene expression relative to other samples, and white coloring (z-score = 0) describes no difference in gene expression relative to other samples. Heatmap includes hierarchical clustering of annotated genes (rows) and samples (columns), with the sample treatment identified as blue for the contemporary pH treatment (CT, 8.05 pH) and red for the OA treatment (7.75 pH). Hyphen denotes genes that were not annotated.
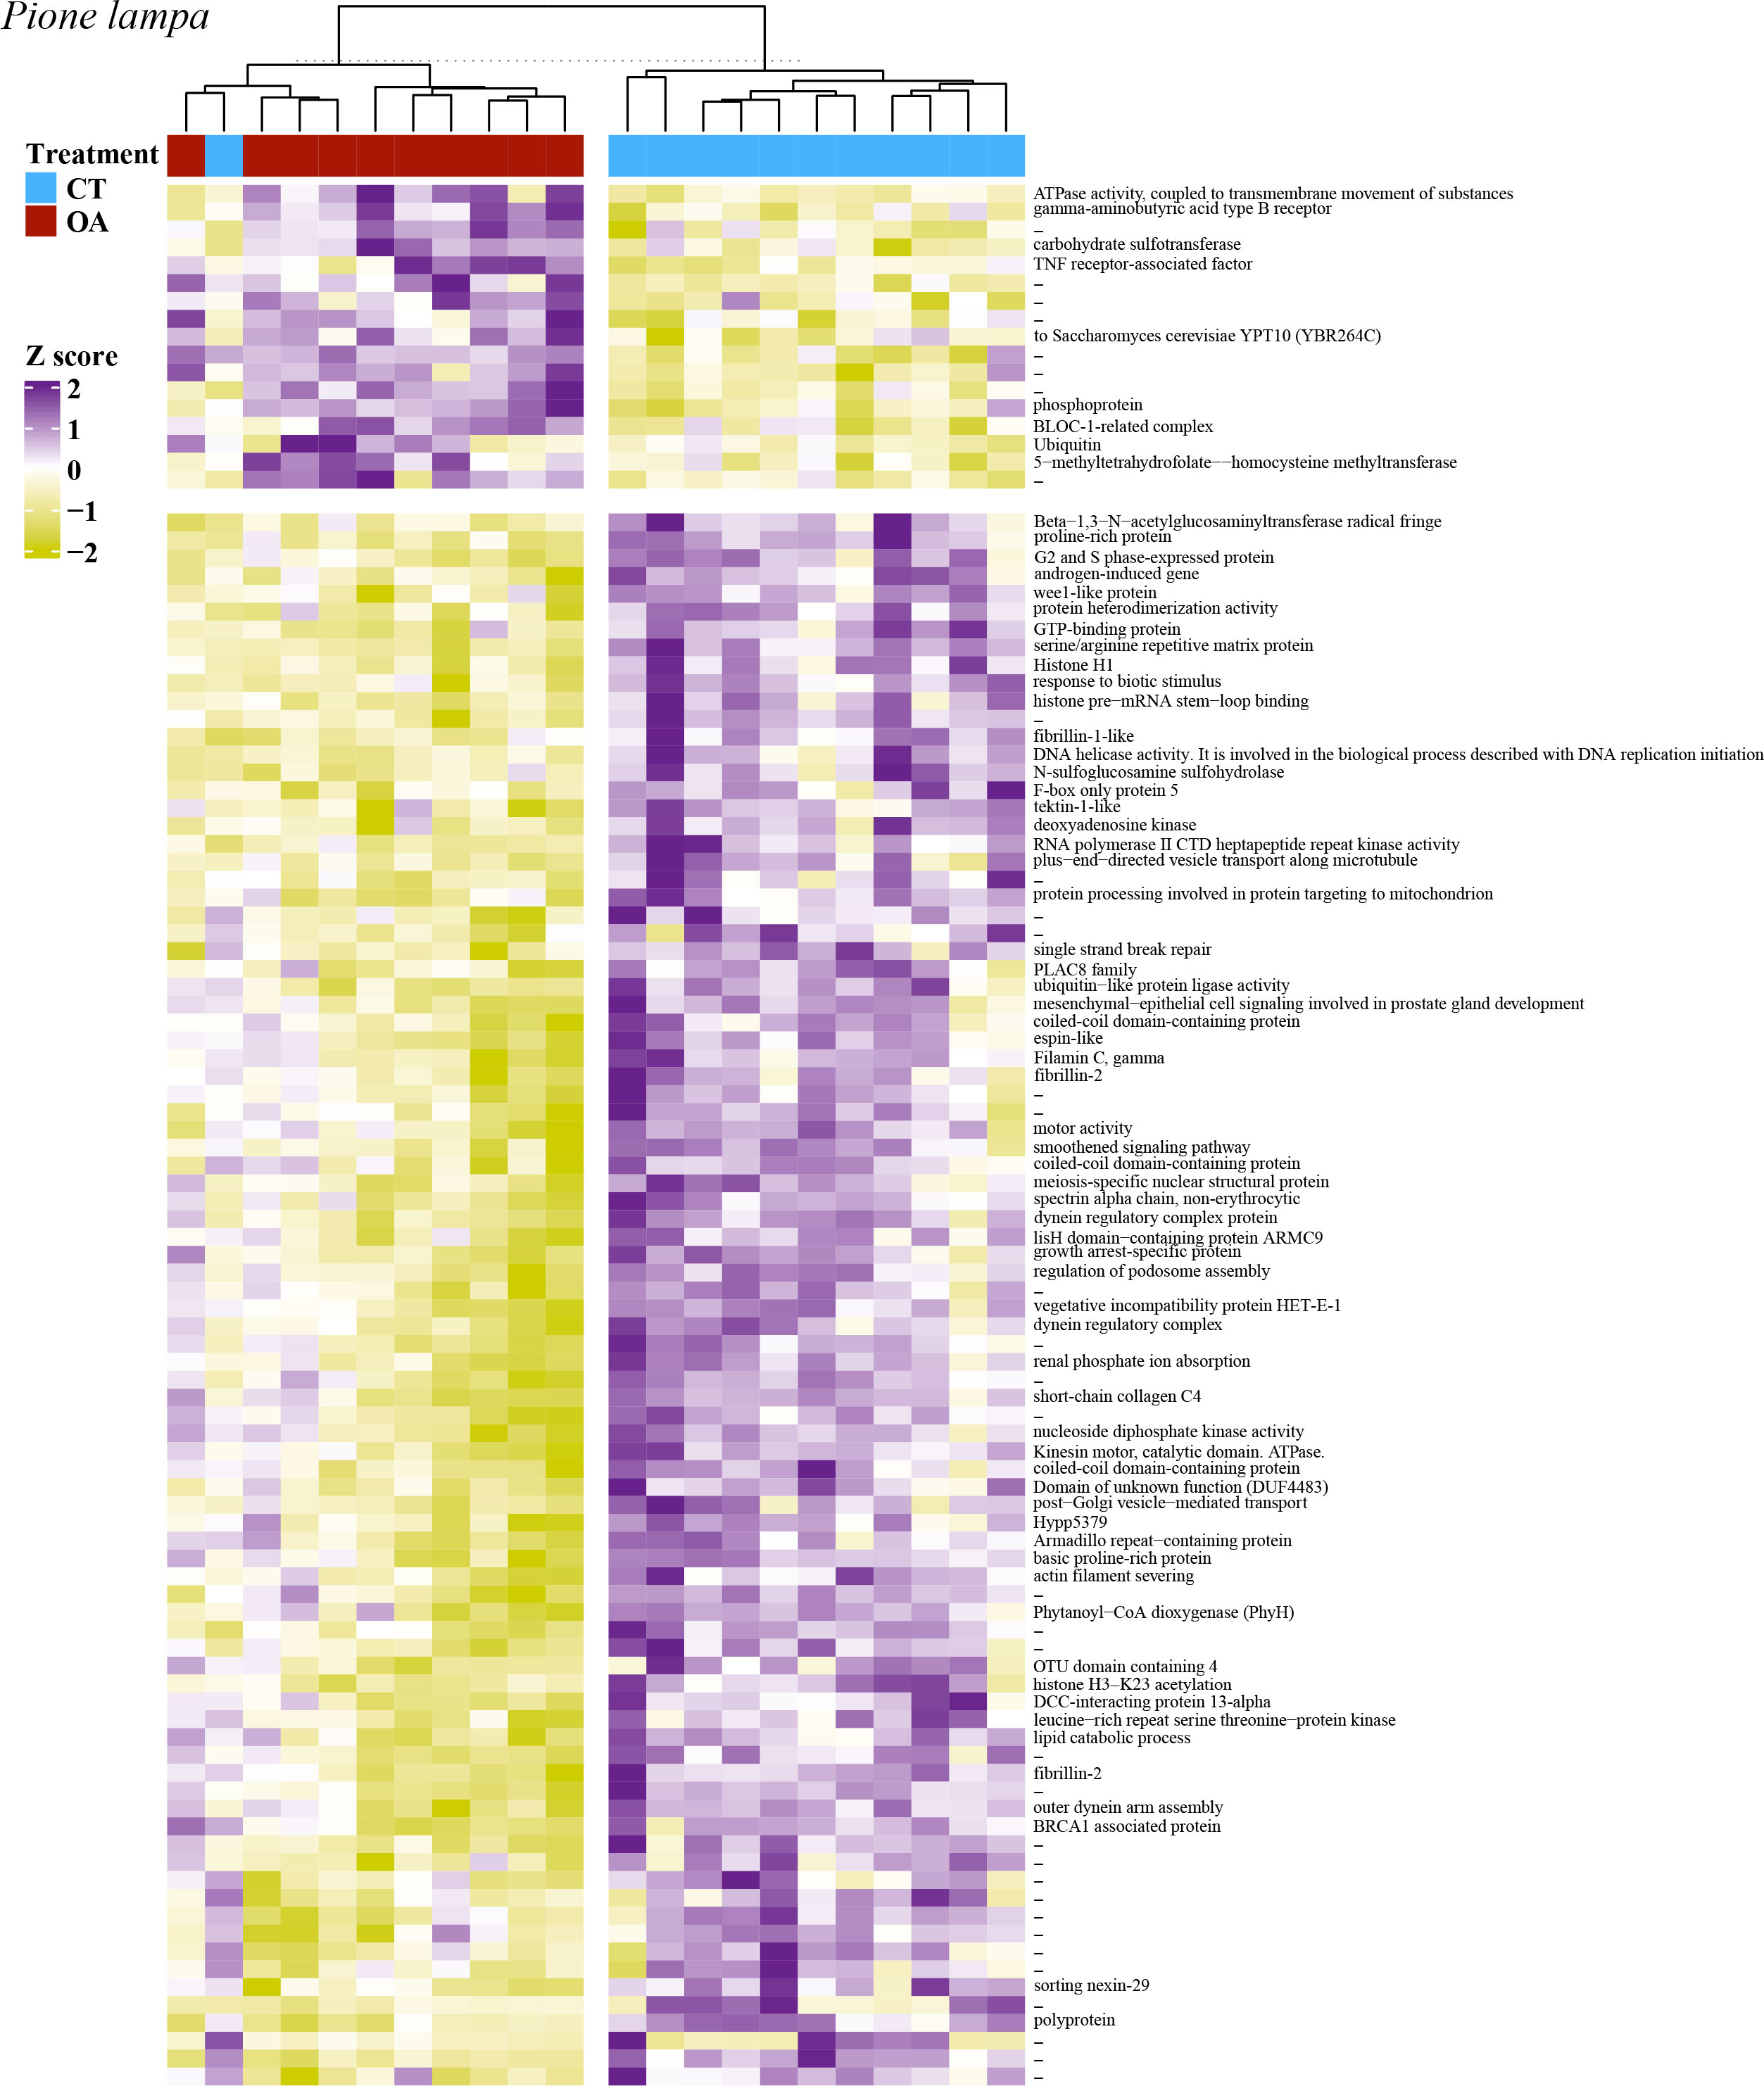
Figure 6 A heatmap of the 105 significantly differentially expressed genes for P. lampa, with VST of the raw filtered gene counts used to remove parent sponge variance. Purple coloring describes higher gene expression relative to other samples, yellow coloring describes lower gene expression relative to other samples, and white coloring (z-score = 0) describes no difference in gene expression relative to other samples. Heatmap includes hierarchical clustering of annotated genes (rows) and samples (columns), with the sample treatment identified as blue for the contemporary pH treatment (CT, 8.05 pH) and red for the OA treatment (7.75 pH). Hyphen denotes genes that were not annotated.
In C. varians, the most significantly upregulated DEG between the 8.05 and 7.75 pH treatments was carbonic anhydrase II [CA2, p.adj = 0.001, log2 fold change = 4.20]. Other significant upregulated DEGs included three genes involved in metal ion binding [cadmium/zinc-transporting ATPase HMA2, p.adj = 0.002, L2fc = 3.72; ulvan-active sulfatase, p.adj = 0.017, L2fc = 4.07; protein phosphatase 2C 8, p.adj = 0.011, L2fc = 3.00] and one gene linked to the production of heat shock proteins [heat shock cognate 71 kDA protein, p.adj = 0.001, L2fc = 2.75].
Significant downregulated DEGs between the 8.05 and 7.75 pH treatments, for C. varians, consisted of 25 genes related to transcription, including 23 genes involved in transcription initiation/regulation [e.g., nuclear transcription factor Y subunit alpha, p.adj = 0.031, L2fc = -4.88; DNA-directed RNA polymerase II subunit RPB1, p.adj = 0.015, L2fc = -5.43] and two genes specific to DNA binding [myb-like protein G, p.adj = 0.031, L2fc = -4.51; myocyte-specific enhancer factor 2C, p.adj = 0.016, L2fc = -3.74]. Eight downregulated DEGs were linked to the post-transcriptional modification of mRNA [e.g., E3 ubiquitin ligase SUD1, p.adj = 0.029, L2fc = -5.50]. A total of 26 downregulated DEGs were annotated to genes that are known to play a role in protein synthesis. This included 11 genes involved in translation initiation/regulation [e.g., translation initiation factor eIF-2b subunit gamma, p.adj = 0.045, L2fc = -4.99; eukaryotic translation initiation factor 3 subunit D, p.adj = 0.022, L2fc = -4.25], in addition to 15 genes associated with the production/maintenance of the 40S and 60S ribosomal subunits [e.g., 40S ribosomal protein S2, p.adj = 0.002, L2fc = -5.21; 60S ribosomal protein, p.adj = 0.016, L2fc = -6.50]. Other significant downregulated DEGs included 10 genes linked to protein degradation [e.g., polyubiquitin, p.adj = 0.026, L2fc = -1.69; ubiquitin-conjugating enzyme E2 J1, p.adj = 0.041, L2fc = -5.27], nine genes associated with cellular signal transduction [e.g., DEP domain-containing protein, p.adj = 0.013, L2fc = -5.48; CBL-interacting protein kinase 8, p.adj = 0.012, L2fc = -5.50], seven genes related to cell division [e.g., mitotic checkpoint protein bub3, p.adj = 0.032, L2fc = -3.82; cell division control protein 2 homolog A, p.adj = 0.043, L2fc = -3.23], four genes involved in sodium potassium ion transport [e.g., sodium/potassium-transporting ATPase subunit alpha-4, p.adj = 0.005, L2fc = -4.40], and three genes that mediate apoptosis [e.g., N-alpha-acetyltransferase 16, p.adj = 0.031, L2fc = -5.65; SNF-related serine/threonine-protein kinase, p.adj = 0.018, L2fc = -4.61].
For C. varians, GO enrichment of the significantly DEGs due to OA identified four significantly enriched GO terms all associated with the ribosome and ribosomal processes: Ribonucleoprotein complex (GO:0030529), Structural constituent of ribosome (GO:0003753), Cytosolic ribosome (GO:0022626), and Ribosome (GO:0005840). A list of genes associated with each term are provided in the Supporting Information (File S1).
In P. lampa, significant upregulated DEGs between the 8.05 and 7.75 pH treatments consisted of one gene involved with cellular signal transduction [TNF receptor-associated factor, p.adj = 0.043, L2fc = 0.36], one gene that plays a role in intracellular membrane trafficking and vesicular transport [Ras-related protein Rab-17, p.adj = 0.039, L2fc = 0.19], and two genes linked to protein degradation and protein turnover [BLOC-1-related complex subunit 8-like, p.adj = 0.043, L2fc = 0.18; ubiquitin, p.adj = 0.045, L2fc = 2.05].
The most abundant significantly downregulated DEGs for P. lampa included 12 genes related to the cell cycle, specifically 11 genes involved in cell division [e.g., G2 and S phase-expressed protein 1 isoform X4, p.adj = 0.001, L2fc = -0.48; wee1-like protein kinase 1-A, p.adj = 0.045, L2fc = -0.37], and one gene linked to cell differentiation [thioredoxin domain-containing protein 3 homolog, p.adj = 0.049, L2fc = -0.43]. Other downregulated DEGs consisted of nine genes that play a role in the production/regulation of microtubule motor proteins [e.g., tektin-1-like, p.adj = 0.041, L2fc = -0.37; coiled-coil domain-containing protein 170-like, p.adj = 0.048, L2fc = -0.43], five genes involved in the post-transcriptional modification of mRNA [e.g., histone pre-mRNA stem-loop binding, p.adj = 0.007, L2fc = -0.58; serine/arginine repetitive matrix protein 2-like isoform X1, p.adj < 0.001, L2fc = -0.35], five genes that mediate apoptosis [e.g., PTB domain-containing engulfment adapter protein 1, p.adj = 0.014, L2fc = -0.39; Villin-1, p.adj = 0.025, L2fc = -0.26], three genes associated with cellular signal transduction [e.g., Proline-rich transmembrane protein 1, p.adj = 0.017, L2fc = -0.16; LisH domain-containing protein ARMC9, p.adj = 0.017, L2fc = -0.44], and three genes involved in protein binding/transport [e.g., Kinesin-like protein KIF9, p.adj = 0.035, L2fc = -0.60]. There were an additional five genes involved in post-translational modification of proteins and protein turnover [e.g., GTP-binding protein 2, p.adj = 0.014, L2fc = -0.20; BRCA1 associated protein, p.adj = 0.046, L2fc = -0.26].
For P. lampa, GO enrichment analysis of the significantly DEGs due to OA identified only one enriched term: Axoneme (GO:0005930). Genes associated with this term are provided in the Supporting Information (File S1).
Discussion
Impact of OA on sponge physiology and bioerosion
The present study identified a stimulating effect of OA on sponge bioerosion but indicate a potential threshold response that occurs regardless of the presence of sponge algal symbionts, as evident by an apparent nonlinear response seen for the zooxanthellate sponge, C. varians, and azooxanthellate sponge, P. lampa. These findings and measured rates are in support of prior sponge literature, with OA-accelerated bioerosion having been previously reported for zooxanthellate C. orientalis (Wisshak et al., 2012), C. celata (Wisshak et al., 2014), C. varians (Morris et al., 2022), C. caribbaea (Webb et al., 2017), and azooxanthellate C. delitrix (Morris et al., 2022) and P. lampa (Enochs et al., 2015). However, the majority of these studies detected a linear relationship between OA and sponge bioerosion (Wisshak et al., 2012, pH range 7.57 to 8.10; Wisshak et al., 2014, pH range 7.67 to 8.07), with only one (Enochs et al., 2015, pH range 7.74 to 7.98) describing a similar nonlinear relationship to our study (pH range 7.75 to 8.15). As we reported comparable results to Enochs et al. (2015) for P. lampa and C. varians, this could indicate that a nonlinear OA response is specific to these Caribbean sponge species, though further assessments are needed to determine whether this response is apparent for species in other regions, such as the Pacific.
Compared to total bioerosion rates, the nonlinear OA relationship was more pronounced for biologically-mediated chemical dissolution (Figure 2), though this should be cautiously interpreted due to a lack of significance between the two OA treatments (7.75 and 7.85 pH). Contrary to prior studies that assessed the response for zooxanthellate Pacific species (Wisshak et al., 2012), OA-enhanced chemical dissolution was not evident for C. varians, with similar daytime rates measured in the moderate OA and contemporary pH treatments. Additionally, a trend towards decreasing chemical dissolution was observed under 7.75 pH conditions, as average rates from this treatment diminished to pre-industrial levels, which could represent bioerosion impairment under extreme OA conditions (Figure 2A). Nighttime chemical dissolution was considerably lower under contemporary pH conditions than the other three treatments (Figure 2B) and likely reflects a symbiont effect, as zooxanthellate species are known to have higher daytime chemical dissolution rates under present-day pH conditions (Fang et al., 2016; Webb et al., 2017; de Bakker et al., 2018). Webb et al. (2017) also found that relative to nighttime conditions, elevated daytime chemical dissolution rates are lost at high pCO2 conditions, which they hypothesized as being due to an antagonistic relationship between enhanced photosynthetic efficiency of sponge photosymbionts under OA leading to a higher uptake of daytime CO2. This in turn could counteract the benefits of acidified seawater conditions on daytime chemical bioerosion. While we did not measure photosynthetic efficiency in our study, this temporal shift across treatments was supported by our data, as similar daytime and nighttime chemical dissolution rates were observed for C. varians in the 7.75 pH treatment (Figures 2A, B).
The P. lampa chemical dissolution OA response differed slightly from that of C. varians, with markedly higher rates measured under moderate OA conditions (7.85 pH) than the three other treatments (Figures 2C, D), though this was only significant relative to the daytime pre-industrial rates. This implies that specific to P. lampa, the process of sponge chemical dissolution appears to be enhanced in the 7.85 pH treatment, but that a threshold is surpassed at lower pH conditions (7.75 pH) that curtails the positive influence of OA, in a similar manner as that of C. varians. This corroborates Enochs et al. (2015), where reduced chemical dissolution rates were measured for P. lampa in the lowest pH treatment (972.5 pCO2) after ~22 hrs of treatment conditions, suggesting that the same nonlinear relationship to OA is apparent under short-term (i.e., < 1 day) and longer-term (i.e., > 21 days) OA exposure. Unlike C. varians, no temporal differences in daytime and nighttime chemical dissolution rates were detected for P. lampa, which supports prior characterizations of other Caribbean azooxanthellate sponge species (de Bakker et al., 2018).
Contrary to previous studies that described chemical dissolution as the primary sponge bioeroding mechanism sensitive to pH conditions (Wisshak et al., 2012; Wisshak et al., 2014), our data indicates that mechanical bioerosion, specifically under daytime conditions, may also be influenced by the pH of ambient seawater (Figure 3). Contemporary daytime mechanical bioerosion rates were significantly higher for C. varians than the pre-industrial pH treatment (Figure 3A), an effect that was not detected for the azooxanthellate P. lampa (Figure 3C). This result was unexpected, considering that the process of chemical etching (i.e., chemical dissolution) of reef framework is thought to predate the mechanical removal of CaCO3 (reviewed by Schönberg et al., 2017). Under this theory, accelerated chemical dissolution would likely increase the production of sponge carbonate chips, and therefore, lead to higher mechanical bioerosion rates. However, despite the lack of significance in chemical dissolution found across the pH treatments for C. varians, mechanical bioerosion rates were significantly higher under contemporary pH conditions. This suggests that seawater pumping rates responsible for the expulsion of sponge sediment chips could have been impacted by treatment conditions. While the underlying mechanisms behind this response need to be investigated further, this could be related to differences in the sponge energy budget across pH treatments (Fang et al., 2014). The energetically costly process of seawater pumping may be influenced by ambient seawater conditions, and therefore impact the rate at which carbonate chips are ejected from the sponge oscula. This may be further supported by the fact that only the zooxanthellate species showed this response in our study, as the transfer of autotrophic by-products are important components of the sponge energy budget (Weisz et al., 2010; Achlatis et al., 2019; Achlatis et al., 2021). A prior study found that prolonged OA exposure can significantly reduce the uptake of dissolved organic carbon by sponges (Achlatis et al., 2017), a result that could be indicative of reduced pumping activity under OA conditions (Achlatis et al., 2019). Alternatively, sponges could have retained the sediment chips under OA conditions (Emson, 1966) or reallocated resources to processes critical for survival, rather than bioerosion, as a result of physiological stress (Bates and Bell, 2017).
Sponge transcriptomic response to OA
Short-term (five days) exposure to OA led to a change in gene expression of only a small proportion of genes, with 0.004% and 0.001% of the identified genes found to be significantly differentially expressed for C. varians and P. lampa, respectively. While the overall transcriptomic response was limited, the set of DEGs characterized for both species leads us to speculate that extreme OA conditions (7.75 pH) may be stressful for reef-excavating sponges. Prior studies have described the prominent downregulation of genes to be emblematic of a generalized stress response, as it is thought to be an adaptive mechanism for organisms to redirect energy resources towards maintaining critical physiological processes (Moya et al., 2012). This widespread downregulation has been reported for a non-bioeroding Caribbean Demospongiae (Histioneis tubifera) under temperature stress (Guzman and Conaco, 2016) and scleractinian corals (Acropora spp. and Pocillopora damicornis) under OA stress (Moya et al., 2012; Vidal-Dupiol et al., 2013). A similar stress response could be supported by our study, where 95% and 84% of all significant DEGs were downregulated for C. varians and P. lampa, respectively (Table S2), though additional assessments with higher replication and deeper sequencing are needed.
The gene annotations for the significant downregulated DEGs further reinforce the proposed stress response to extreme OA. Significant DEGs implicated in sponge metabolism were prominently influenced by OA, with 19% (C. varians) and 34% (P. lampa) of all annotated downregulated DEGs in our study known to play a role in metabolic functioning. These included genes involved in carbohydrate, lipid, and amino acid metabolism, and suggests that sponges may suppress metabolism or modify metabolic activity in response to OA. The active suppression of metabolism has been described as a survival response to acute environmental stressors for coral adults (Moya et al., 2012), coral recruits (Albright et al., 2010), and sea-urchins (Todgham and Hofmann, 2009; O’Donnell et al., 2010), which could indicate that sponges may reallocate energy towards more important physiological needs in response to OA stress. Additionally, genes that participate in the negative regulation and mediation of apoptosis were significantly downregulated in the OA treatment for both species, which demonstrates that apoptotic processes increased under 7.75 pH conditions. DEGs specific to apoptosis have previously been observed for marine organisms in response to OA, thermal, and disease-induced stress (Libro et al., 2013; Guzman and Conaco, 2016; Dineshram et al., 2021).
While these downregulated DEGs may describe a generalized OA stress response for both species, there was a notable difference in the number of downregulated genes implicated in protein synthesis between species. For C. varians, protein synthesis was the biological function most impacted by OA, as these genes represented 29% of the significantly downregulated DEGs. This was corroborated by the GO enrichment analysis, as significantly enriched terms were linked to ribosomes, which are imperative for synthesizing proteins. In comparison, downregulated genes involved in protein synthesis were far less abundant for P. lampa, as they were only the sixth most impacted biological function, represented 7% of the significantly downregulated DEGs, and showed no significant GO enrichment for terms linked to protein synthesis. This could suggest that photosymbionts alter the molecular response of sponges to OA if they provide the sponge host with carbon-rich photosynthetic products (Achlatis et al., 2019), and/or impact the availability of ammonium (NH4+) and bicarbonate (HCO3-), that may modify the sponge physiological needs resulting from OA stress. However, this could instead be broadly interpreted as response variability specific to each genus (i.e., Cliona vs Pione) and requires further evaluation.
Specific to the process of sponge chemical dissolution, the transcriptomic analysis identified a significant downregulation of DEGs involved in calcium:proton ion transport for C. varians (four genes) and P. lampa (four genes) under OA conditions, which is in support of a recently described OA response for C. varians (DeBiasse et al., 2022). Calcium ions (Ca2+) play an important role in chemical dissolution, as the transport of Ca2+ away from the dissolution site in exchange for protons (H+) in seawater is needed maintain an acidified microenvironment at the sponge/substrate interface to promote CaCO3 dissolution (Sullivan et al., 1986; Webb et al., 2019). While Ca2+ is involved in other cellular roles in marine sponges, including tissue contraction and cell to cell communication (de Ceccatty, 1971; Lorenz et al., 1996), the downregulation of these DEGs could suggest that the intracellular exchange of Ca2+/H+ is less critical to the bioerosion process under OA, as the pH gradient between the sponge/substrate interface and ambient seawater is reduced. Alternatively, the downregulation of genes involved in Ca2+ transport could represent an overall decline in chemical dissolution in response to extreme OA conditions (at five days), as seen by the nonlinear bioerosion response reported in our study (at 21 to 25 days), though short-term chemical dissolution measurements are needed to test this hypothesis.
Of additional relevance to chemical dissolution, carbonic anhydrase 2 (CA2) was significantly upregulated in C. varians, with a fourfold increase in gene expression reported in the 7.75 pH treatment. This result is consistent with a previous study that described the upregulation of two carbonic anhydrase transcripts for C. varians (gamma stage) under short-term OA exposure (7.6 pH) (DeBiasse et al., 2022), indicating that this response is apparent across multiple C. varians growth forms (beta stage and gamma stage). Carbonic anhydrases (CAs) serve several important functional roles within sponges, one of which is catalyzing the interconversion of HCO3- and CO2 involved in pH regulation at the site of carbonate dissolution (Webb et al., 2019). Carbonate ions (CO3-2) produced during chemical dissolution are converted to HCO3- and CO2, with the ratio between the two depending on the rate at which protons (H+) are delivered and DIC is removed from the site of dissolution (Webb et al., 2019). CAs are thought to enhance the rate at which DIC is removed by promoting the protonation of HCO3- and therefore supporting the passive diffusion of CO2 molecules away from the etching site (Webb et al., 2019). This in turn could accelerate chemical dissolution and may partially explain some of the underlying mechanisms behind OA-stimulated sponge bioerosion (Wisshak et al., 2012; Enochs et al., 2015).
However, despite this upregulation of CAs, chemical dissolution of C. varians was not significantly enhanced in the OA treatment. While a direct comparison between the transcriptomic and chemical dissolution measurements should be cautiously applied since they were derived from different time points (day five and days 21 to 25, respectively), this could indicate that CAs play less of a prominent role in chemical dissolution than previously reported. Alternatively, these findings could be the result of short-term upregulation of CAs that may have stimulated sponge bioerosion under OA at the time of transcriptomic tissue sampling. This effect may have diminished during the chemical dissolution measurements performed > 21 days into treatment conditions if the sponges were stressed from prolonged OA exposure. As these results represent a snapshot of the sponge transcriptomic response to OA at day five, further testing is needed to determine whether genes involved in chemical dissolution are differentially expressed under shorter or longer OA exposure to evaluate whether there is a significant correlation between CA gene expression and chemical dissolution. Additionally, since the upregulation of CAs was not evident for P. lampa, this instead could indicate that the role of CAs in sponge bioerosion may differ between zooxanthellate and azooxanthellate species. This could be supported by a prior study that measured 5-10x higher concentrations of carbonic anhydrase in zooxanthellate sponges compared to azooxanthellate species (Hill, 1996).
In our study, parent sponge was identified as a larger driver of sponge gene expression than pH treatment. This was not surprising, as several OA studies have previously described a similar genotypic effect. Glazier et al. (2020) found that genotype explained most of the gene expression variance for the scleractinian coral, Leptoseris pertusa, when exposed to 6 months of OA, a result that was supported by physiological data from the same experiment (Kurman et al., 2017). This type of molecular response has also been described for parental genotypes of spiny damselfish, Acanthochromis polyacanthus (Schunter et al., 2016). While our study is the first to characterize DEGs parent sponge variability for both zooxanthellate and azooxanthellate bioeroding sponges under OA, and therefore this variability needs to be investigated further, this could imply that some sponges are more resilient to OA, in a similar manner to that of thermally resilient coral genotypes (Barshis et al., 2013). Contrary to the studies by Glazier et al. (2020) and Kurman et al. (2017), however, we did not observe a corresponding significant effect of parent sponge identity on the physiology data, as sponge bioerosion rates were not significantly different between parent sponges. This suggests that OA-induced parent sponge variability in gene expression may not have a considerable influence on sponge bioerosion. However, this could also be related to the duration of our experiment, where 31 days of treatment conditions may not have been long enough to fully capture the physiological impact of this parent sponge variability.
Predicted fate of sponge persistence in response to OA
Contrary to prior studies, these data provide a less-than-dire impact of OA on sponge bioerosion under projected end-of-the-century pH scenarios. While the buoyant weight-derived total bioerosion rates (Figure 1) support previously reported OA-stimulated sponge bioerosion (Wisshak et al., 2012; Enochs et al., 2015; Morris et al., 2022), the chemical dissolution rates (Figure 2) and transcriptomic profiling (Figures 5, 6) indicate that this enhancement could be unsustainable and may plateau or diminish in response to prolonged OA. The molecular data identified an onset of stress related DEGs for both species after only five-days of extreme OA exposure, suggesting that the sponges may have already experienced the effects of physiological impairment early in the experiment. This OA stress response was further reinforced by the chemical dissolution data, where a trend towards depressed bioerosion was apparent in the 7.75 pH treatment, though this should be cautiously interpreted due to a lack of significance compared to the 7.85 pH treatment. While reduced bioerosion in the extreme OA treatment relative to the moderate OA treatment was still present in the total bioerosion rates (Figure 1), the drop-off was less notable than that of chemical dissolution, which is likely a function of differences in response data that these two methodologies are designed to address.
The buoyant weight methodology could be less effective at capturing a sponge stress response, since the bioerosion rates measured using this methodology were calculated exclusively from change in mass after 31 days of treatment conditions. Therefore, OA-depressed sponge bioerosion captured using this technique could have been muted if the sponges were able to maintain OA-stimulated bioerosion in the short-term, before eventually succumbing to OA-related stress further into the experiment. By contrast, the 3 hr incubations used to measure chemical dissolution were designed to capture instantaneous bioerosion rates and therefore may better reflect the physiological state of the sponges after 21 days of OA exposure (though food depletion, waste accumulation, and acidosis effects could have influenced the measured rates, see de Bakker et al., 2018). This aspect of the chemical dissolution methodology may also account for discrepancies between our findings and that of other sponge bioerosion studies, which used rapid techniques and relatively short exposure to assess responses to OA (4 days see Wisshak et al., 2014; 22 hrs see Enochs et al., 2015), suggesting that sponge bioerosion may not have been impaired by OA stress at that point in their experiments.
Based on these results, predictions calling for sponge bioerosion to double by the end of the century may be unrealistic if the sponges become physiologically impaired by extreme OA conditions (Enochs et al., 2015; Bates and Bell, 2017). This prognosis is further supported by previous studies that found a similar physiologically damaging effect (e.g., tissue necrosis, bleaching, mortality) from predicted “business-as-usual” seawater temperature conditions (Fang et al., 2014; Fang et al., 2018; Ramsby et al., 2018). However, while this may ameliorate reef erosion in the long-term, our data agrees with prior predictions for accelerated sponge bioerosion under moderate OA conditions (Enochs et al., 2015). When considering that OA is simultaneously expected to reduce coral calcification (Langdon and Atkinson, 2005; Chan and Connolly, 2012) and enhance the bioeroding activity of other reef organisms (Tribollet et al., 2009; DeCarlo et al., 2015; Enochs et al., 2016a), this accelerated sponge bioerosion under moderate OA conditions could still have considerable implications for the persistence of coral reef ecosystems in the upcoming decades, even if OA-enhanced bioerosion plateaus or diminishes later in the century.
Conclusions
This study represents the first assessment of the combined physiological and molecular responses of bioeroding sponges to OA. A nonlinear relationship between OA and sponge bioerosion was identified, with the highest bioerosion rates measured in the moderate OA treatment. The transcriptomic component of the study provided an investigation of the molecular mechanisms behind this nonlinear response, with the analysis of DEGs indicating a potential stress response under extreme OA, an effect that was apparent regardless of the presence of dinoflagellates. Our data suggest that sponge physiology and gene expression are both impacted by OA conditions (though they were collected from different timepoints), which appears to directly influence sponge bioerosion potential. These findings imply that previously reported OA-accelerated sponge bioerosion may not be sustainable under predicted end-of-the-century OA scenarios for all species.
Data availability statement
The physiology data that support the findings are available at NOAA National Centers for Environmental Information (Accession Number 0276485). Raw transcriptomic sequences are available in the National Center for Biotechnology Information (NCBI) Sequence Read Archive (SRA) under BioProject PRJNA924051, accession numbers SAMN32744931 through SAMN32745020.
Ethics statement
The manuscript presents research on animals that do not require ethical approval for their study.
Author contributions
JM, IE, MS, BY, AM, NS, and GK contributed to field-operations and experimentation. JM completed data analysis. JM, IE, MS, NT-K, and DM contributed to manuscript development. JM completed data submission. All authors contributed to the article and approved the submitted version.
Acknowledgments
Funding was provided by NOAA Oceanic and Atmospheric Research’s ‘Omics Initiative and NOAA’s Coral Reef Conservation Program. NOAA’s Ocean Acidification Program supported the acquisition of equipment used for analysis of carbonate chemistry. The content of this manuscript has been presented in part at the 15th International Coral Reef Symposium (ICRS 2022 Book of Abstracts: A-1461).
Conflict of interest
The authors declare that the research was conducted in the absence of any commercial or financial relationships that could be construed as a potential conflict of interest.
Publisher’s note
All claims expressed in this article are solely those of the authors and do not necessarily represent those of their affiliated organizations, or those of the publisher, the editors and the reviewers. Any product that may be evaluated in this article, or claim that may be made by its manufacturer, is not guaranteed or endorsed by the publisher.
Supplementary material
The Supplementary Material for this article can be found online at: https://www.frontiersin.org/articles/10.3389/fmars.2023.1223380/full#supplementary-material
References
Achlatis M., Pernice M., Green K., de Goeij J., Guagliardo P., Kilburn M., et al. (2019). Single-cell visualization indicates direct role of sponge host in uptake of dissolved organic matter. Proc. R. Soc B 286, 20192153. doi: 10.1098/rspb.2019.2153
Achlatis M., van der Zande R., Schönberg C., Fang J., Hoegh-Guldberg O., Dove S. (2017). Sponge bioerosion on changing reefs: ocean warming poses physiological constraints to the success of a photosymbiotic excavating sponge. Sci. Rep. 7, 10705. doi: 10.1038/s41598-017-10947-1
Achlatis M., van der Zande R., Web A., de Bakker D., de Nooijer L., de Goeij J. (2021). Photosynthetically stimulated bioerosion in symbiotic sponges: the role of glycerol and oxygen. Coral Reefs 40, 881–891. doi: 10.1007/s00338-021-02091-0
Albright R., Mason B., Miller M., Langdon C. (2010). Ocean acidification compromises recruitment success of the threatened Caribbean coral Acropora palmata. Proc. Natl. Acad. Sci. 107, 20400–20404. doi: 10.1073/pnas.1007273107
Alvarez-Filip L., Dulvy N., Gill J., Cote I., Watkinson A. (2009). Flattening of Caribbean coral reefs: region-wide declines in architectural complexity. Proc. R. Soc B 276, 3019–3025. doi: 10.1098/rspb.2009.0339
Andersson A., Gledhill D. (2012). Ocean acidification and coral reefs: effects on breakdown, dissolution, and net ecosystem calcification. Ann. Rev. Mar. Sci. 5, 321–348. doi: 10.1146/annurev-marine-121211-172241
Andrews S. (2010). FastQC: a quality control tool for high throughput sequence data (UK: Babraham Institute).
Ashburner M., Ball C., Blake J., Botstein D., Butler H., Cherry J. M., et al. (2000). Gene Ontology: tool for the unification of biology. Nat. Genet. 25, 25–29. doi: 10.1038/75556
Barshis D., Ladner J., Oliver T., Seneca F., Traylor-Knowles N., Palumbi S. (2013). Genomic basis for coral resilience to climate change. Proc. Natl. Acad. Sci. 110, 1387–1392. doi: 10.1073/pnas.1210224110
Bates T., Bell J. (2017). Responses of two temperate sponge species to ocean acidification. N. Z. J. Mar. Freshw. Res. 52, 1–17. doi: 10.1080/00288330.2017.1369132
Blighe K., Lun A. (2020). PCAtools: Everything Principal Components Analysis (Bioconductor Open Source Software for Bioinformatics: R package version 2.2.0). Available at: https://github.com/kevinblighe/PCAtools.
Caldeira K., Wickett M. (2003). Anthropogenic carbon and ocean pH. Nature 425, 365. doi: 10.1038/425365a
Cantalapiedra C., Hernandez-Plaza A., Letunic I., Bork P., Huerta-Cepas J. (2021). eggNOG- mapper v2: functional annotation, orthology assignments, and domain prediction at the metagenomic scale. Mol. Biol. Evol. 31, 5825–5829. doi: 10.1093/molbev/msab293
Chan N., Connolly S. (2012). Sensitivity of coral calcification to ocean acidification: a meta-analysis. Glob. Change Biol. 19, 282–290. doi: 10.1111/gcb.12011
Cohen S., Krueger T., Fine M. (2017). Measuring coral calcification under ocean acidification: methodological considerations for the 45Ca-uptake and total alkalinity anomaly technique. PeerJ 5, e3749. doi: 10.7717/peerj.3749
De’ath G., Lough J., Fabricius K. (2009). Declining coral calcification on the Great Barrier Reef. Science 323, 116–119. doi: 10.1126/science.1165283
de Bakker D., Webb A., van den Bogaart L., van Heuven S., Meesters E., van Duyl F. (2018). Quantification of chemical and mechanical bioerosion rates of six Caribbean excavating sponge species found on the coral reefs of Curacao. PloS One 13, e0197824. doi: 10.1371/journal.pone.0197824
DeBiasse M., Stubler A., Kelly M., Benzie J. (2022). Comparative transcriptomics reveals altered species interactions between bioeroding sponge Cliona varians and the coral Porites furcate under ocean acidification. Mol. Ecol. 31, 3002–3017. doi: 10.1111/mec.16432
DeCarlo T., Cohen A., Barkley H., Cobban Q., Young C., Shamberger K., et al. (2015). Coral macrobioerosion is accelerated by ocean acidification and nutrients. Geology 43, 7–10. doi: 10.1130/G36147.1
de Ceccatty M. (1971). Effects of drugs and ions on a primitive system of spontaneous contractions in a sponge (Euspongia officinalis). Experientia 27, 57–59. doi: 10.1007/BF02137740
Dineshram R., Xiao S., Ko G., Li J., Smrithi K., Thiyagarajan V., et al. (2021). Ocean acidification triggers cell signaling, suppress immune and calcification in the Pacific oyster larvae. Front. Mar. Sci. 8, 1–13. doi: 10.3389/fmars.2021.782583
Dodge R., Wyers S., Frith H., Knap A., Smith S., Cook C., et al. (1984). Coral calcification rates by the buoyant weight technique: effects of alizarin staining. J. Exp. Mar. Biol. Ecol. 75, 217–232. doi: 10.1016/0022-0981(84)90167-9
Dusa A. (2022). venn: Draw Venn diagrams (Bucuresti, ROmania: University of Bucharest). Available at: https://github.com/dusadrian/venn.
Emson R. (1966). The reactions of the sponge Cliona celata to applied stimuli. Comp. Biochem. Physiol. 18, 805–827. doi: 10.1016/0010-406X(66)90215-5
Enochs I., Manzello D., Carlton R., Graham D., Ruzicka R., Colella M. (2015). Ocean acidification enhances the bioerosion of a common coral reef sponge: implications for the persistence of the Florida Reef Tract. Bull. Mar. Sci. 91, 271–290. doi: 10.5343/bms.2014.1045
Enochs I., Manzello D., Jones P., Aguilar C., Cohen K., Valentino L., et al. (2018). The influence of diel carbonate chemistry fluctuations on the calcification rate of Acropora cervicornis under present day and future acidification conditions. J. Exp. Mar. Biol. Ecol. 506, 135–143. doi: 10.1016/j.jembe.2018.06.007
Enochs I., Manzello D., Kolodziej G., Noonan S., Valentino L., Fabricius K. (2016a). Enhanced macroboring and depressed calcification drive net dissolution at high-CO2 coral reefs. Proc. R. Soc B 283, 20161742. doi: 10.1098/rspb.2016.1742
Enochs I., Manzello D., Tribollet A., Valentino L., Kolodziej G., Donham E., et al. (2016b). Elevated colonization of microborers at a volcanically acidified coral reef. PloS One 11, e0159818. doi: 10.1371/journal.pone.0159818
Fabricius K., Noonan S., Abrego D., Harrington L., De’ath G. (2017). Low recruitment due to altered settlement substrata as primary constraint for coral communities under ocean acidification. Proc. R. Soc B 284, 20171536. doi: 10.1098/rspb.2017.1536
Fabry V., Seibel B., Feely R., Orr J. (2008). Impacts of ocean acidification on marine fauna and ecosystem processes. ICES J. Mar. Sci. 65, 414–432. doi: 10.1093/icesjms/fsn048
Fang J., Mello-Athayde M., Schönberg C., Kline D., Hoegh-Guldberg O., Dove S. (2013). Sponge biomass and bioerosion rates increase under ocean warming and acidification. Glob. Change Biol. 20, 1043–1054. doi: 10.1111/gcb.12369
Fang J., Schönberg C., Hoegh-Guldberg O., Dove S. (2016). Day-night ecophysiology of the photosymbiotic bioeroding sponge Cliona orientalis Thiel. Mar. Biol. 163, 100. doi: 10.1007/s00227-016-2848-4
Fang J., Schönberg C., Mello-Athayde M., Achlatis M., Hoegh-Guldberg O., Sophie D. (2018). Bleaching and mortality of a photosymbiotic bioeroding sponge under future carbon dioxide emissions scenarios. Oecologia 18, 25–35. doi: 10.1007/s00442-018-4105-7
Fang J., Schönberg C., Mello-Athayde M., Hoegh-Guldberg O., Dove S. (2014). Effects of ocean warming and acidification on the energy budget of an excavating sponge. Glob. Change Biol. 20, 1043–1054. doi: 10.1111/gcb.12369
Garcia-Pichel F., Ramirez-Reinat E., Gao Q. (2010). Microbial excavation of solid carbonates powered by P-type ATPase-mediated transcellular Ca2+ transport. Proc. Natl. Acad. Sci. 107, 21749–21754. doi: 10.1073/pnas.1011884108
Glazier A., Herrera S., Weinnig A., Kurman M., Gomez C., Cordes E. (2020). Regulation of ion transport and energy metabolism enables certain coral genotypes to maintain calcification under experimental ocean acidification. Mol. Ecol. 29, 1657–1673. doi: 10.1111/mec.15439
Glynn P. (1997). Bioerosion and coral reef growth: a dynamic balance (New York: The View from Here Chapman & Hall), 69–98.
Grabherr M., Haas B., Yassour M., Levin J., Thompson D., Amit I., et al. (2011). Trinity: reconstructing a full-length transcriptome without a genome from RNA-Seq data. Nat. Biotechnol. 29, 644–652. doi: 10.1038/nbt.1883
Gu Z., Eils R., Schlesner M. (2016). Complex heatmaps reveal patterns and correlations in multidimensional genomic data. Bioinformatics 32, 2847–2849. doi: 10.1093/bioinformatics/btw313
Guzman C., Conaco C. (2016). Gene expression dynamics accompanying the sponge thermal stress response. PloS One 11, e0165368. doi: 10.1371/journal.pone.0165368
Haas A., Smith J., Thompson M., Deheyn D. (2014). Effects of reduced dissolved oxygen concentrations on physiology and fluorescence of hermatypic corals and benthic algae. PeerJ 2, e235. doi: 10.7717/peerj.235
Hill M. (1996). Symbiotic zooxanthellae enhance boring and growth rates of the tropical sponge Anthosigmella varians forma varians. Mar. Biol. 125, 649–654. doi: 10.1007/BF00349246
Hoegh-Guldberg O., Mumby P., Hooten A., Steneck R., Greenfield, Gomez E., et al. (2007). Coral reefs under rapid climate change and ocean acidification. Science 318, 1737–1742. doi: 10.1126/science.1152509
IPCC (2019). IPCC special report on the ocean and cryosphere in a changing climate. (Cambridge, UK and New York, NY, USA: Cambridge University Press).
Jiang L., Guo Y., Zhang F., Zhang Y., McCook L., Yuan X., et al. (2019). Diurnally fluctuating pCO2 modified the physiological responses of coral recruits under ocean acidification. Front. Physiol. 9, 1–12. doi: 10.3389/fphys.2018.01952
Kanehisa M., Goto S. (2000). KEGG: Kyoto encyclopedia of genes and genomes. Nucleic Acid Res. 28, 27–30. doi: 10.1093/nar/28.1.27
Kaniewska P., Campbell P., Kline D., Rodriguez-Lanetty M., Miller D., Dove S., et al. (2012). Major cellular and physiological impacts of ocean acidification on a reef building coral. PloS One 7, e34659. doi: 10.1371/journal.pone.0034659
Kroeker K., Kordas R., Crim R., Singh G. (2010). Meta-analysis reveals negative yet variable effects of ocean acidification on marine organisms. Ecol. Lett. 13, 1419–1434. doi: 10.1111/j.1461-0248.2010.01518.x
Kurman M., Gomez C., Georgian S., Lunden J., Cordes E. (2017). Intra-specific variation reveals potential for adaptation to ocean acidification in a cold-water coral from the Gulf of Mexico. Front. Mar. Sci. 4, 1–14. doi: 10.3389/fmars.2017.00111
Langdon C., Atkinson M. (2005). Effect of elevated pCO2 on photosynthesis and calcification of corals and interactions with seasonal change in temperature/irradiance and nutrient enrichment. J. Geophys. Res. 110, C09S07. doi: 10.1029/2004jc002576
Langmead B., Salzberg S. (2012). Fast gapped-read alignment with Bowtie 2. Nat. Methods 9, 357–359. doi: 10.1038/nmeth.1923
Lewis E., Wallace D. (1998). Program developed for CO2 system calculations (Oak Ridge National Laboratory, Oak Ridge, Tennessee: Carbon Dioxide Information Analysis Center).
Libro S., Kaluzziak S., Vollmer S. (2013). RNA-seq profiles of immune related genes in the staghorn coral Acropora cervicornis infected with White Band Disease. PloS One 8, e81821. doi: 10.1371/journal.pone.0081821
Lorenz B., Bohnensack R., Gamulin V., Steffen R., Muller W. (1996). Regulation of motility of cells from marine sponges by calcium ions. Cell. Signal. 8, 517–524. doi: 10.1016/S0898-6568(96)00108-8
Love M., Huber W., Anders S. (2014). Moderated estimation of fold change and dispersion for RNA-seq data with DESeq2. Genome Biol. 15, 550. doi: 10.1186/s13059-014-0550-8
Maere S., Heymans K., Kuiper M. (2005). BiNGO: a Cytoscape plugin to assess overrepresentation of Gene Ontology categories in biological networks. Bioinformatics 21, 3448–3449. doi: 10.1093/bioinformatics/bti551
Martin M. (2011). Cutadapt removes adapter sequences from high-throughput sequencing reads. EMBnet.journal 17, 10–12. doi: 10.14806/ej.17.1.200
Mayfield A., Wang L. H., Tang P. C., Fan T. Y., Hsiao Y. Y., Tsai C. L., et al. (2011). Assessing the impacts of experimentally elevated temperature on the biological composition and molecular chaperone gene expression of a reef coral. PloS One 6, e26529. doi: 10.1371/journal.pone.0026529
Morris J., Enochs I., Webb A., de Bakker D., Soderberg N., Kolodziej G., et al. (2022). The influences of diurnal variability and ocean acidification on the bioerosion rates of two reef-dwelling Caribbean sponges. Glob. Change Biol. 28, 7126–7138. doi: 10.1111/gcb.16442
Morris J. T., Studivan M. S. (2023). jmorris181818/Cvarians-Gerakladium-denovo-transcriptome: Cvarians-denovo-transcriptome: De novo transcriptome assembly and annotation of the sponge Cliona varians v1.0. Zenodo. doi: 10.5281/zenodo.7535281
Moya A., Huisman L., Ball E., Hayward D., Grasso L., Chua C., et al. (2012). Whole transcriptome analysis of the coral Acropora millepora reveals complex responses to CO2-driven acidification during the initiation of calcification. Mol. Ecol. 21, 2440–2454. doi: 10.1111/j.1365-294X.2012.05554.x
Murphy G., Perry C., Chin P., McCoy C. (2016). New approaches to quantifying bioerosion by endolithic sponge populations: applications to the coral reefs of Grand Cayman. Coral Reefs 35, 1109–1121. doi: 10.1007/s00338-016-1442-z
O’Donnell M., Todgham A., Sewell M., Hammond L., Ruggiero K., Fangue N., et al. (2010). Ocean acidification alters skeletogenesis and gene expression in larval sea-urchins. Mar. Ecol. Prog. Ser. 399, 157–171. doi: 10.3354/meps08346
Pomponi S. (1980). Cytological mechanisms of calcium carbonate excavation by boring sponges. Int. Rev. Cytol. 65, 301–319. doi: 10.1016/S0074-7696(08)61963-4
Ramsby B., Hoogenboom M., Whalan S., Webster N. (2018). Elevated seawater temperature disrupts the microbiome of an ecologically important bioeroding sponge. Mol. Ecol. 27, 2124–2137. doi: 10.1111/mec.14544
R Core Team (2020). R: a language and environment for statistical computing (Vienna, Austria: R Foundation for Statistical Computing). Available at: https://www.R-project.org/.
Ritchie M., Phipson B., Wu D., Hu Y., Law C., Shi W., et al. (2015). limma powers differential expression analyses for RNA-sequencing and microarray studies. Nucleic Acids Res. 43, e47. doi: 10.1093/nar/gkv007
RStudio Team (2020). RStudio: Integrated Development for R (PBC, Boston, MA: RStudio). Available at: http://www.rstudio.com/.
Rutzler K., Rieger G. (1973). Sponge burrowing: fine structure of Cliona lampa penetrating calcareous substrata. Mar. Biol. 21, 144–162. doi: 10.1007/BF00354611
Schönberg C., Fang J., Carreiro-Silva M., Tribollet A., Wisshak M. (2017). Bioerosion: the other ocean acidification problem. ICES J. Mar. Sci. 74, 895–925. doi: 10.1093/icesjms/fsw254
Schunter C., Welch M., Ryu T., Zhang H., Berumen M., Nilsson G., et al. (2016). Molecular signatures of transgenerational response to ocean acidification in a species of reef fish. Nat. Clim. Change 6, 1014–1018. doi: 10.1038/nclimate3087
Shannon P., Markiel A., Ozier O., Baliga N., Wang J., Ramage D., et al. (2003). Cytoscape: a software environment for integrated models of biomolecular interaction networks. Genom. Res. 13, 2498–2504. doi: 10.1101/gr.1239303
Spalding M., Burke L., Wood S., Ashpole J., Hutchinson J., zu Ermgassen P. (2017). Mapping the global value and distribution of coral reef tourism. Mar. Policy 82, 104–113. doi: 10.1016/j.marpol.2017.05.014
Studivan M. S. (2023). Mstudiva/Plampa-denovo-transcriptome: De novo transcriptome assembly and annotation of the sponge Pione lampa v1.0. Zenodo. doi: 10.5281/zenodo.7531524
Sullivan B., Faulkner D., Matsumoto G., He C., Clardy J. (1986). Metabolites of the burrowing sponge Siphonodictyon coralliphagum. J. Org. Chem. 51, 4568–4573. doi: 10.1021/jo00374a015
The UniProt Consortium (2018). UniProt: a worldwide hub of protein knowledge. Nucleic Acids Res. 47, D506–D515. doi: 10.1093/nar/gky092
Todgham A., Hofmann G. (2009). Transcriptomic response of sea urchin larvae Strongylocentrotus purpuratus to CO2-drive seawater acidification. J. Exp. Biol. 212, 2579–2594. doi: 10.1242/jeb.032540
Tribollet A., Godinot C., Atkinson M., Langdon C. (2009). Effects of elevated pCO2 on dissolution of coral carbonates by microbial euendoliths. Glob. Biogeochem. Cycles 23, 1–7. doi: 10.1029/2008GB003286
Tunnicliffe V. (1979). The role of boring sponges in coral fracture. Biologie Des. Spongiaires 291, 309–315.
Vidal-Dupiol J., Zoccola D., Tambutte E., Grunau C., Cosseau C., Smith K., et al. (2013). Genes related to ion-transport and energy production are upregulated in response to CO2-drive pH decrease in corals: new insights from transcriptome analysis. PloS One 8, e58652. doi: 10.1371/journal.pone.0058652
Webb A., Pomponi S., van Duyl F., Reichart G., Nooijer L. (2019). pH regulation and tissue coordination pathways promote calcium carbonate bioerosion by excavating sponges. Sci. Rep. 9, 1–10. doi: 10.1038/s41598-018-36702-8
Webb A., van Heuven S., de Bakker D., van Duyl F., Reichart G., de Nooijer L. (2017). Combined effects of experimental acidification and eutrophication on reef sponge bioerosion rates. Front. Mar. Sci. 4, 311. doi: 10.3389/fmars.2017.00311
Weisz J., Massaro A., Ramsby B., Hill M. (2010). Zooxanthellar symbionts shape host sponge trophic status through translocation of carbon. Biol. Bull. 219, 189–197. doi: 10.1086/BBLv219n3p189
Wickham H. (2016). ggplot2: elegant graphics for data analysis (New York: Springer-Verlag), ISBN: ISBN 978-3-319-24277-2.
Wisshak M., Schönberg C., Form A., Freiwald A. (2012). Ocean acidification accelerates reef bioerosion. PloS One 7, e45124. doi: 10.1371/journal.pone.0045124
Wisshak M., Schönberg C., Form A., Freiwald A. (2014). Sponge bioerosion accelerated by ocean acidification across species and latitudes? Helgoland Mar. Res. 68, 253–262. doi: 10.1007/s10152-014-0385-4
Keywords: ocean acidification, bioerosion, sponges, transcriptomics, Caribbean
Citation: Morris JT, Enochs IC, Studivan MS, Young BD, Mayfield A, Soderberg N, Traylor-Knowles N, Kolodziej G and Manzello D (2023) Ocean acidification influences the gene expression and physiology of two Caribbean bioeroding sponges. Front. Mar. Sci. 10:1223380. doi: 10.3389/fmars.2023.1223380
Received: 16 May 2023; Accepted: 14 August 2023;
Published: 04 September 2023.
Edited by:
Verena Schoepf, University of Amsterdam, NetherlandsReviewed by:
Federica Maggioni, University of New Caledonia, New CaledoniaMichelle Achlatis, University of Amsterdam, Netherlands
Copyright © 2023 Morris, Enochs, Studivan, Young, Mayfield, Soderberg, Traylor-Knowles, Kolodziej and Manzello. This is an open-access article distributed under the terms of the Creative Commons Attribution License (CC BY). The use, distribution or reproduction in other forums is permitted, provided the original author(s) and the copyright owner(s) are credited and that the original publication in this journal is cited, in accordance with accepted academic practice. No use, distribution or reproduction is permitted which does not comply with these terms.
*Correspondence: John T. Morris, john.morris@noaa.gov
†ORCID: John T. Morris, orcid.org/0000-0001-7734-8492