Shell microstructures (disturbance lines) of Arctica islandica (Bivalvia): a potential proxy for severe oxygen depletion
 Nils Höche1*†
  Michael L. Zettler
 Xizhi Huang
 Bernd R. Schöne
- 1Institute of Geosciences, University of Mainz, Mainz, Germany
- 2Department of Biological Oceanography, Leibniz Institute for Baltic Sea Research Warnemünde, Rostock, Germany
The spread of oxygen deficiency in nearshore coastal habitats endangers benthic communities. To better understand the mechanisms leading to oxygen depletion and eventually hypoxia, predict the future development of affected ecosystems, and define suitable mitigation strategies requires detailed knowledge of the dissolved oxygen (DO) history. Suitable high-resolution DO archives covering coherent time intervals of decades to centuries include bivalve shells. Here, we explored if the microstructure, specifically disturbance lines, in shells of Arctica islandica from the Baltic Sea can be used as an alternative or complementary proxy to Mn/Cashell to track the frequency and severity of past low-DO events. Disturbance lines differ from periodic annual growth lines by the presence of fine complex crossed lamellae instead of irregular simple prisms. Aside from a qualitative assessment of microstructural changes, the morphology of individual biomineral units (BMUs) was quantitatively determined by artificial intelligence-assisted image analysis to derive models for DO reconstruction. As demonstrated, Mn-rich disturbance lines can provide a proxy for past deoxygenation events (i.e., DO < 45 µmol/L), but it currently remains unresolved if low DO leads to microstructurally distinct features that differ from those caused by other environmental stressors. At least in studied specimens from the Baltic Sea and Iceland, low temperature, salinity near the lower physiological tolerance, or food scarcity did not result in disturbance lines. With decreasing DO supply, disturbance lines seem to become more prominent, contain more Mn, and consist of increasingly smaller and more elongated BMUs with a larger perimeter-to-area ratio. Although the relationship between DO and BMU size or elongation was statistically significant, the explained variability (<1.5%) was too small and the error too large to reconstruct DO values. BMU parameters may reveal a closer relationship with DO if studied in three dimensions and if the DO content was determined at high resolution, directly at the position where the bivalves lived, something that future work should address.
1 Introduction
There is growing concern about the rapid spread of bottom hypoxia in nearshore coastal habitats (Conley et al., 2009; Carstensen et al., 2014a; Fennel and Testa, 2019). Severe oxygen depletion can have deleterious effects on marine biodiversity and ecosystem functioning (Karlson et al., 2002; Vaquer-Sunyer and Duarte, 2008; Zillén et al., 2008). Specifically, dissolved oxygen (DO) levels below 2.3 mg/L (equivalent to 1.7 mL/L or 71.9 µmol/L at 1 atm and 10°C) are lethal for most biota (Vaquer-Sunyer and Duarte, 2008), as proper breathing is then no longer possible (Herreid, 1980). This DO threshold marks the transition from normoxia to hypoxia. Furthermore, deoxygenation can result in an enhanced porewater efflux of nutrients into the overlying water body, which further increases eutrophication leading to enhanced primary production, organic carbon export to the seafloor, and subsequent oxygen loss in bottom waters (Österblom et al., 2007; Conley et al., 2007; Carstensen et al., 2014a).
In order to better comprehend the mechanisms leading to oxygen depletion (Andrén et al., 2000; Carstensen et al., 2014b), identify the ecosystem baseline (Sohlenius et al., 2001; Zillén et al., 2008), predict the future development of oxygen availability, and define proper mitigation and ecosystem restoration strategies (Carstensen et al., 2014a; Caballero-Alfonso et al., 2015), detailed knowledge of the DO history on seasonal to decadal timescales is required. However, even in the Baltic Sea, the largest and best-studied oxygen-depleted setting (Carstensen and Conley, 2019), this is not the case. The ultimate causes for coastal deoxygenation remain incompletely understood mainly due to short and incomplete instrumental datasets (online database of the Leibnitz-Institut für Ostseeforschung Warnemünde, 2021, at https://odin2.io-warnemuende.de/; last access Nov. 20, 2022) and low-resolution proxy archives (e.g., Westman and Sohlenius, 1999; Filipsson and Nordberg, 2004; Osterman et al., 2005; Jilbert and Slomp, 2013). While sediments provide extremely valuable insights into the long-term DO trends and cycles (Jilbert and Slomp, 2013), little is known about the short-term fluctuations of bottom-water oxygen supply. Suitable high-resolution DO archives obtained by geochemical analysis include fish otoliths (Limburg et al., 2011) and, as recently demonstrated, shells of bivalve mollusks (Zhao et al., 2017; Schöne et al., 2021; Schöne et al., 2022).
As shown by numerous studies, shells of bivalves can serve as very powerful, temporally well-constrained in situ archives providing information on seasonal to inter-annual changes of environmental conditions—including DO—over coherent time intervals of decades to centuries (Weidman et al., 1994; Witbaard et al., 1997; Wanamaker et al., 2012; Lohmann and Schöne, 2013; Reynolds et al., 2017; Edge et al., 2021). The shells of the sessile animals grow on a periodic basis, resulting in a distinct pattern of alternating growth increments (fast growth) and lines or bands (slow growth), which can be used to place each shell portion into a precise temporal context and determine the ontogenetic age of the bivalves (Belding, 1910; Jones, 1980). According to sclerochronological analyses, some species such as Arctica islandica attain a lifespan of nearly 400 to more than 500 years (Schöne et al., 2005a; Wanamaker et al., 2008; Butler et al., 2013). Environmental changes experienced during life are recorded in the shells in the form of variable growth increment widths and chemical and microstructural properties (e.g., Epstein and Lowenstam, 1953; Jones et al., 1989; Milano et al., 2017). For example, when exposed to physiological stress (i.e., temperature and DO outside physiological tolerance), A. islandica forms disordered microstructures and a large number of disturbance lines in its shell (Dunca et al., 2009; Höche et al., 2021; Höche et al., 2022a). Furthermore, shell Mn/Ca ratios are negatively correlated to DO in the water column because sedimentary manganese can be remobilized under reducing conditions, i.e., the absence of oxygen (Schöne et al., 2021; Schöne et al., 2022). Few species such as A. islandica are also highly tolerant against low oxygen supply and can survive in the complete absence of oxygen (anoxia) and even the presence of H2S (euxinia) for several weeks or months (Theede et al., 1969; Dries and Theede, 1974; Oeschger, 1990). Under such hostile conditions, they leave their valves closed and switch to an anaerobic metabolism (Theede et al., 1969; Oeschger, 1990). The generated acidic metabolites are then neutralized by the dissolution of inner shell surfaces (Crenshaw and Neff, 1969; Crenshaw, 1980). Specimens from the Baltic Sea thus tend to be very thin (<1.5 mm) and fragile with the inner shell layer and parts of the inner portion of the outer shell layer missing (pers. communication Weigelt cited in Oeschger, 1990; Schöne, 2013).
In the present study, we explored if the shell microstructure, specifically, disturbance lines can be used as an alternative or complementary proxy to Mn/Cashell values to track the number and severity of past low-oxygen events. So far, descriptions of microstructural changes in shells of bivalves from stressful environments remain descriptive (Clark, 1974; Kennish and Olsson, 1975; Dunca et al., 2009; Cardoso et al., 2013; Höche et al., 2021), and no detailed microstructural comparison of shells from oxygen-depleted and normoxic environments has been undertaken. For that purpose, here, the microstructure properties of A. islandica shells from NE Iceland (well-oxygenated habitat) were compared to specimens from the western Baltic Sea (Mecklenburg Bight, Fehmarn Belt), which were exposed to seasonally recurring oxygen depletion, occasionally hypoxia. Aside from a qualitative assessment of microstructural changes, the morphology of individual biomineral units (size, elongation, solidity, perimeter-to-size ratio, and coverage) was quantitatively determined by means of artificial intelligence-assisted image analysis to derive models for the reconstruction of DO. The results of our study can help to obtain better insights into the historical development of low-oxygen environments.
2 Materials and methods
Eight A. islandica specimens were collected alive between 2001 and 2020 by dredging from two different regions in the North Atlantic realm, namely, the western Baltic Sea (n = 4; three specimens from Mecklenburg Bight and one specimen from Fehmarn Belt) and NE Iceland (n = 4; Þistilfjörður) (Table 1; Figure 1). All specimens were used for microstructure analyses via scanning electron microscopy (SEM). SEM analysis was preferred over more sophisticated analytical techniques such as electron backscatter diffraction (EBSD) and high-resolution electron backscatter diffraction (used, e.g., by Karney et al., 2012) in order to study large areas of shell in adequate time. In addition, we were interested in identifying a method that can be applied by a large number of laboratories; i.e., SEM is more often available than EBSD machines. In three specimens per region, individual biomineral units (BMUs) were quantitatively characterized, and in the remaining specimen, the microstructure was qualitatively described (Table 1). All except one specimen from NE Iceland were used in previous studies targeting the element chemistry (in particular, Mn/Cashell and Ba/Cashell) and the seasonal timing and rate of shell growth (see Table 1 and references provided in the table caption).
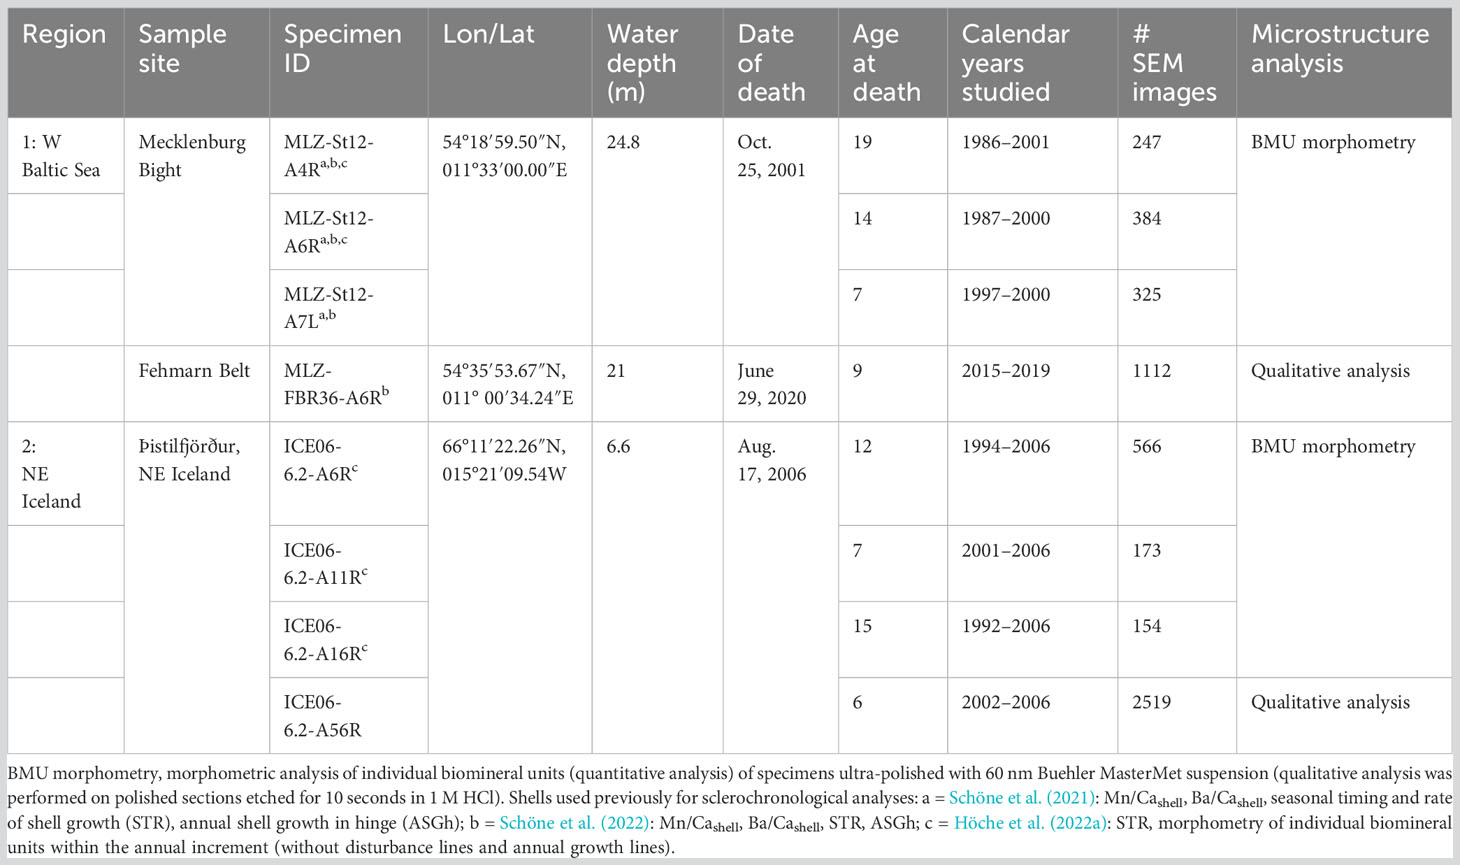
Table 1 List of Arctica islandica shells used in present study.
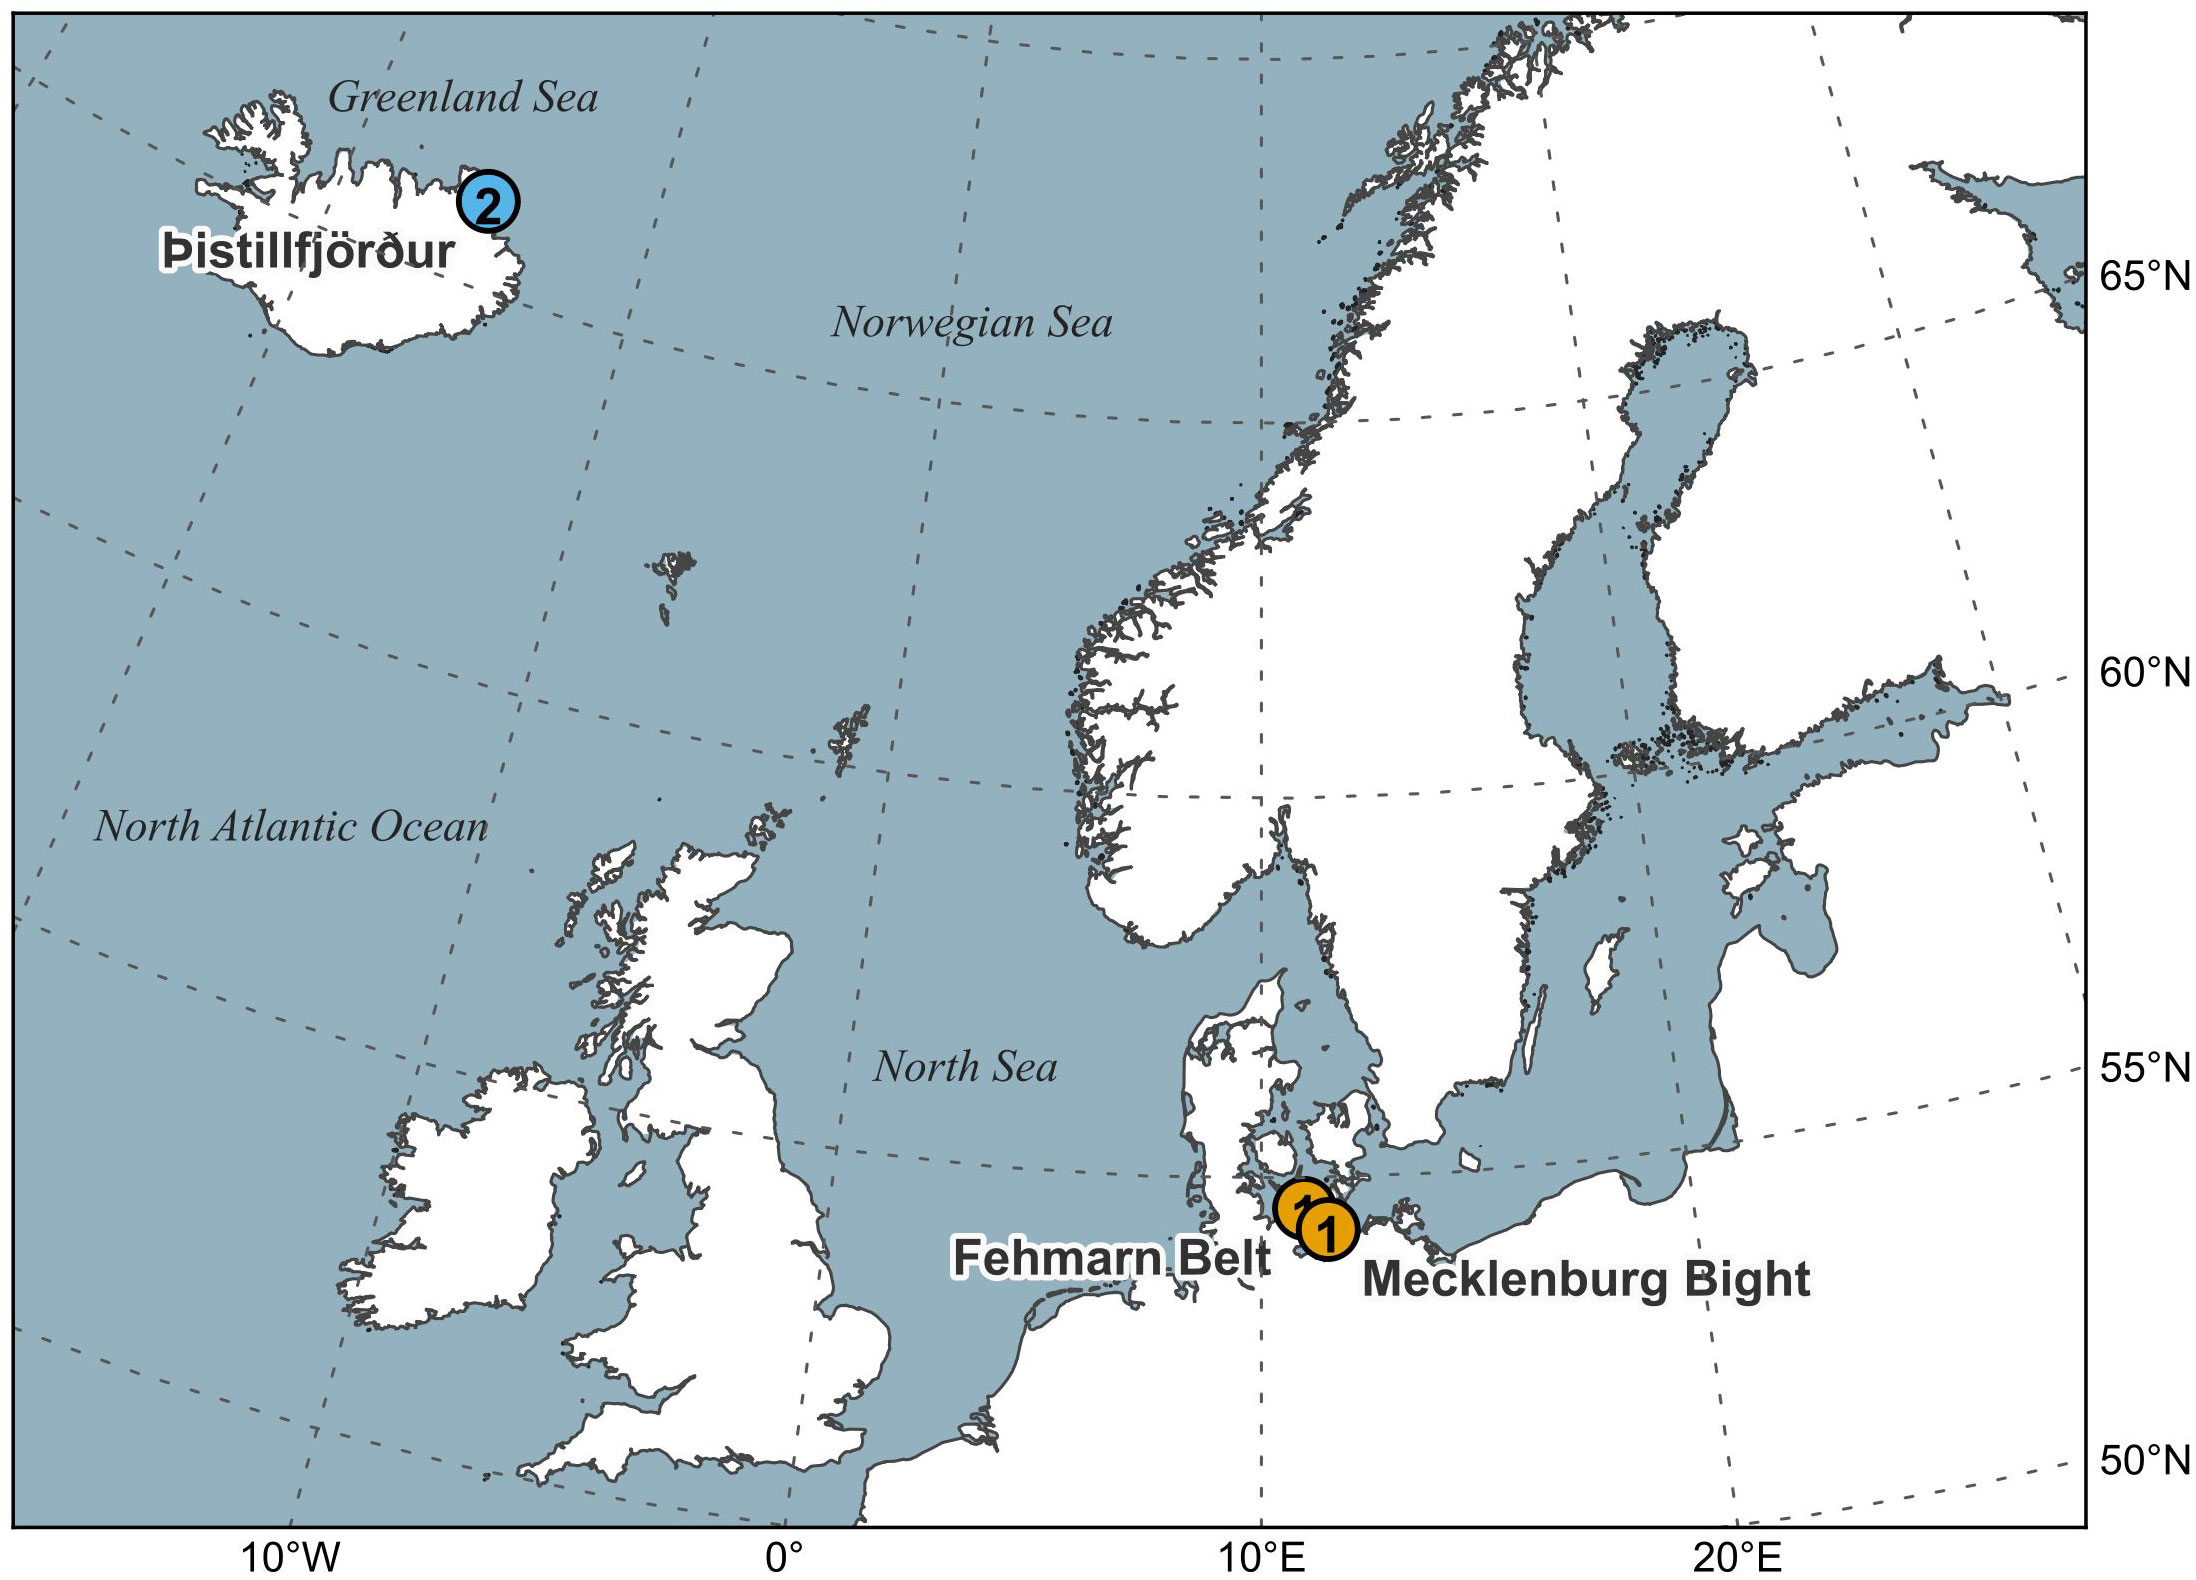
Figure 1 Map showing the regions where Arctica islandica specimens were collected. (1) Western Baltic Sea, (2) NE Iceland.
2.1 Sample preparation
For sclerochronological analyses, three ca. 3-mm-thick sections were cut from one valve of each specimen along the axis of maximum growth (Supplementary Figure 1). One of the sections was used for growth pattern analyses, the mirroring side for in situ chemical analyses, and the remaining shell slab for microstructure investigations. Before sectioning, the shells were covered along the cutting axis with an approx. 1–1.5-cm-wide and 0.3-cm-thick protective layer of metal epoxy resin (WIKO EpoFix 05). To mount the shells for cutting, acrylic glass blocks were attached to the anterior side of the valves using a plastic welder (WIKO Multi Power 03). Specimens were then sliced at approx. 200 rpm using a rotational low-speed saw (Buehler IsoMet 1000) equipped with a 0.4-mm-thick diamond-coated blade (Buehler 15LC 11-4255). After cutting, the shell slabs were ground on glass plates using F800 and F1200 SiC grit powders (suspended in deionized water) and then polished on a polishing cloth (Buehler MasterTex) using a 1 µm Al2O3 suspension. After each grinding and polishing step, the samples were ultrasonically rinsed with deionized water. Sections used for growth pattern analysis were then mounted to glass slides using metal epoxy (WIKO EpoFix 05).
2.2 Growth pattern analysis and temporal alignment of the growth record
For growth pattern analysis, one polished slab of each specimen was immersed in Mutvei’s solution (Schöne et al., 2005b) for 20 minutes at 37°C to 40°C under constant stirring. This treatment facilitated the recognition of annual growth lines. Stained sections were then photographed with a digital camera (Canon EOS 600D) mounted to a reflected-light binocular microscope (Zeiss Stemi 508). Samples were illuminated using sectoral (= one-quarter) dark-field ring-light illumination (Schott VisiLED MC1000). Growth pattern analyses were carried out on stitched images (Microsoft Image Composite Editor) using the image analysis software ImageJ (Schneider et al., 2012; Schindelin et al., 2015; Rueden et al., 2017). The number of annual increments provided information on the lifespan of the studied specimens and helped to assign each shell portion to a precise calendar year. The time of the year represented by each SEM image was determined based on the relative position between consecutive annual growth lines and existing seasonal growth models for the study sites (Schöne et al., 2021; Höche et al., 2022a). For details on the seasonal dating procedure, see also Schöne et al. (2021). These growth models provide information not only on the timing of seasonal shell growth but also on daily growth rates (in %).
2.3 Microstructural analysis via SEM
Shell microstructures (see review in, e.g., Checa, 2018) consist of hierarchically organized BMUs, which can be rounded as in the homogeneous microstructures (HOMs) or needle-shaped as in crossed-lamellar, fine complex crossed-lamellar (FCCL) and crossed-acicular (CA) microstructures. Each BMU is enveloped by intercrystalline organic matrices and interwoven with intracrystalline organic matrices (proteins, lipids, sugars, etc.) (Bevelander and Nakahara, 1980; Marin et al., 2012).
In the present study, different preparation techniques were employed for qualitative and quantitative analyses (Table 1) of the microstructural properties of the shells. For qualitative analyses, the third polished shell section of each specimen was briefly (10 seconds) immersed in diluted (1 M) hydrochloric acid to generate a topographical relief highlighting the BMUs. Immediately after etching, specimens were rinsed with demineralized water, air-dried, and then coated with a 5-nm-thick platinum layer using a sputter coater (Leica EM ACE200). For quantitative BMU analyses, the same shell slabs were first repolished with 1 µm Al2O3 suspension and subsequently ultra-polished with an alkaline polishing agent (Buehler MasterMet, 60-nm grain size) and sputter-coated with Pt.
Microstructure investigations were conducted with a Desktop SEM (Phenom Pro, third generation) equipped with a CeB6 electron source backscatter electron detector at 10 keV. For qualitative assessment of the HCl-etched shells, mappings of large shell regions were generated automatically by stitching up to 400 individual images together. Each SEM image was taken at approx. ×3,500 magnification. Quantitative measurements of the BMU shape were performed on individual SEM images taken at a magnification of approx. ×7,500. When viewed under backscatter SEM, the intercrystalline organic envelopes appeared black, while BMUs appeared in shadings of gray reflecting variations in the amount of intracrystalline organics. This approach greatly facilitated the quantitative BMU analysis.
2.4 Automated measurement of the BMU shape
SEM images taken for quantitative analysis of the BMU size and shape were fed into the machine learning-based image segmentation software ilastik (Berg et al., 2019). For details on how this software can assist in microstructure analysis, the reader is referred to (Höche et al., 2022a). In brief, the program classifies each pixel of the SEM images (Supplementary Figure 2A) as belonging to either a BMU or the interstitial space (= organic envelope, intercrystalline organic matrix) based on user-supplied examples and returns an image where the pixels of each BMU are labeled in an individual color, while the background is labeled black. This color-coded image (Supplementary Figure 2B) can then be used as an input for automatic particle analysis to obtain the morphological parameters of each BMU. Particle analysis was performed using the python programming language and the scikit-learn image analysis library (as well as the image analysis software ImageJ using the plugin MorphoLibJ). The trained classifier used by ilastik is available in Höche et al. (2022b).
In addition to the BMU size, width, length, elongation, perimeter, and coverage, which have already been studied in prior publications (e.g., Milano et al., 2017; Ballesta-Artero et al., 2018; Höche et al., 2021; Höche et al., 2022a), several novel shape parameters were investigated in the present study, namely, i) the perimeter-to-size ratio of the BMUs, which is a two-dimensional representation of the surface-to-volume ratio of three-dimensional particles, and ii) the BMU solidity, i.e., the size of the BMUs in relation to the size of the smallest convex polygonal envelope of the BMU (= BMU size/size of convex hull; Supplementary Figure 2C). This value decreases when a smaller proportion of the convex hull is filled out by the BMU, i.e., when the BMU has more crevices that are not filled with CaCO3.
2.5 Statistical analyses
For specimens from the Baltic Sea, correlation analysis was performed between the morphological parameters of the BMUs and environmental parameters. For this purpose, Spearman’s rank correlation was used because BMU morphology data were not consistently normally distributed. In Baltic Sea shells, the properties of microstructures formed under well-oxygenated conditions were compared to such formed during low-oxygen conditions during summer. For this purpose, the time covered by the shell growth records was categorized into “high-DO” and “low-DO” intervals based on the oxygenation status during biomineralization. Since we do not know the DO concentration of the water inhaled by the bivalves (see also Section 4.1), the average summer DO concentration of the study region (Mecklenburg Bight and Fehmarn Belt) at 5 m above the seafloor (where actual DO measurements were completed), i.e., 5 mL/L, was set as the boundary between “high-DO” and “low-DO”. Very likely, the formation of disturbance lines is coupled to the metabolic rate. According to Strahl et al. (2011), in A. islandica, the metabolic rate decreases markedly below DO values of 5 kPa, which likely corresponds to the threshold set for the categorization into high- and low-DO time intervals. An oxygen partial pressure of 5 kPa (measured at 1 atm and 10°C; Strahl et al., 2011) corresponds to 0.43 mL/L, 1.62 mg/L, or 44.93 µmol/L DO assuming the environmental conditions of the Mecklenburg Bight, i.e., a temperature of 7.5°C, a salinity of 19.3 (averages during the studied time interval), and water depth of 24.8 m (converted using Henry’s law and the ideal gas constant). Subsequently, all BMU data of the “low-DO” category were compared to those of the “high-DO” category using non-parametric Mann–Whitney U-tests. An analogous comparison between low- and high-salinity conditions was not performed because salinity only causes severe stress in A. islandica below values of approx. 15 (Hiebenthal et al., 2012). Furthermore, salinity in Mecklenburg Bight only fell below this threshold for 25 days during the entire studied time interval.
2.6 Environmental conditions at the study sites
For comparison with the microstructure data, instrumental temperature, salinity, DO, and chlorophyll a (Chl a) data were acquired for Þistilfjörður, NE Iceland, and Mecklenburg Bight, western Baltic Sea (Table 1). In the case of Þistilfjörður, temperature data were obtained from Grímsey station (Hanna et al., 2006), and salinity data were taken from satellite measurements (Gaillard et al., 2016). High-resolution DO time series were not available for the site at NE Iceland, but given that the habitat belongs to the well-agitated surface water body and the sandy substrates prevail, permanent well-oxygenated conditions can be assumed. According to the World Ocean Atlas (https://www.ncei.noaa.gov; last access Nov. 21, 2022), surface waters in that region contained ca. 0.35 mol O2 per g, corresponding to 11.2 mg/L or 4.9 mL/L O2 at the water depth in which the bivalves lived, i.e., 6.6 m, and the local water temperature (see below). For Mecklenburg Bight, temperature, salinity, and DO concentration data were taken from in situ measurements in a water depth of 20 m at Station 12 (Zettler et al., 2017; online database, reference Leibnitz-Institut für Ostseeforschung Warnemünde, 2021, at https://odin2.io-warnemuende.de/, last access Nov. 20, 2022), located ca. 172 m NW of the sampling site. Note that these DO data may overestimate the actual oxygen availability at the seafloor where the bivalves dwelled (see also discussion in Schöne et al., 2022). Within the timespan covered by the shell records (1986–2006; Table 1), the instrumental DO dataset (Figure 2) comprises 179 points of data (on average, ca. nine per year), with 20 of them falling into summer months (i.e., one per year). All environmental datasets are provided in Höche et al. (2022b).
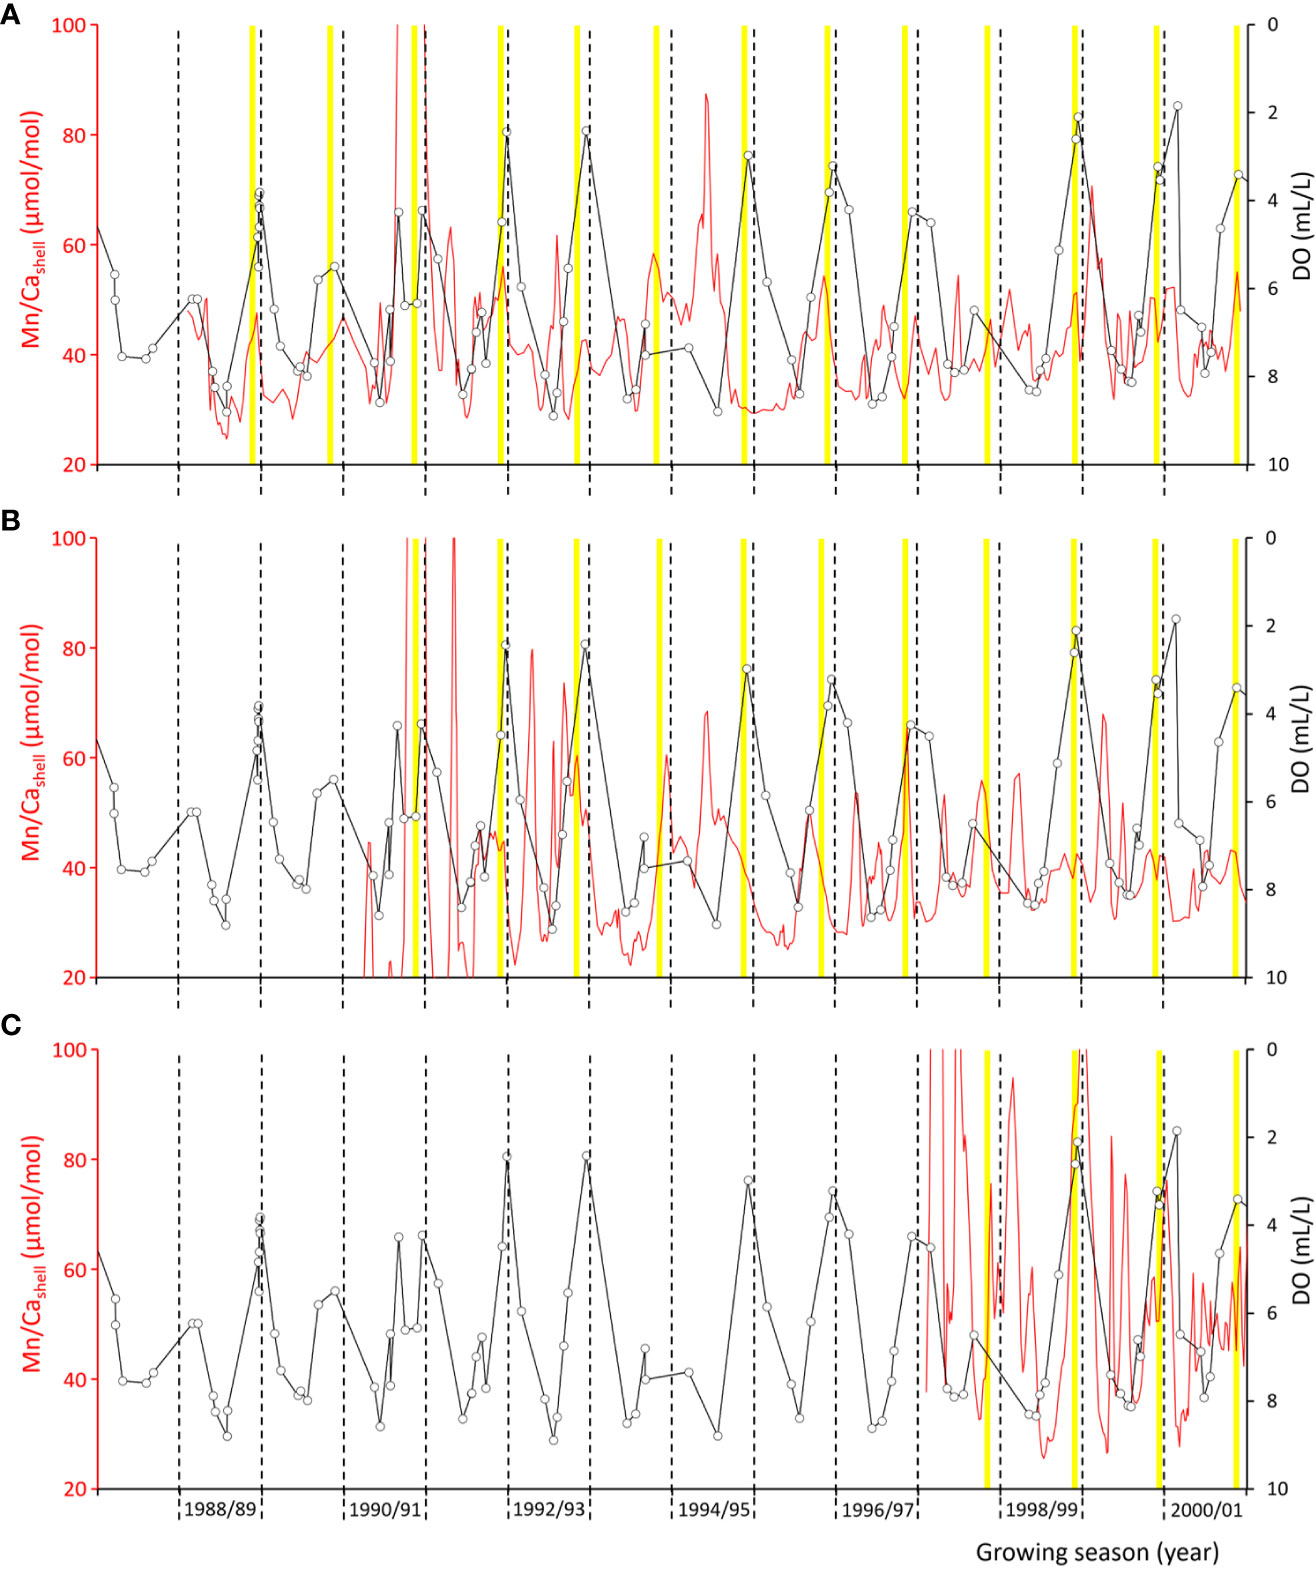
Figure 2 Shell Mn/Ca chronologies of the three studied Arctica islandica specimens from Mecklenburg Bight ((A) MLZ-St12-A4R, (B) …-A6R, and (C) …-A7L) in comparison to levels of dissolved oxygen (DO) measured 5 m above the seafloor. Open circles denote actual DO measurements, and black connecting lines represent linearly interpolated DO data. Also shown are annual growth lines (black dashed lines) and disturbance lines (solid yellow lines). Note that the formation of disturbance lines occurs in summer (July/August) and typically falls together with the seasonal DO minimum and shell Mn/Ca maximum.
The water at the study site at Mecklenburg Bight was, on average, >3°C warmer than at NE Iceland (7.4°C ± 3.5°C vs. 4.3°C ± 2.3°C; 1983–2012) but significantly lower in salinity (19.4 ± 2.7 vs. 34.4 ± 0.2) and contained highly variable amounts of dissolved oxygen (2.0–8.9 mL/L vs. ca. 4.2–5.1 mL/L) (Höche et al., 2022b). Food availability (Chl a) was nearly identical at both study sites (Mecklenburg Bight, 1.8 ± 0.7 mg/m3; NE Iceland, 1.8 ± 0.8 mg/m3) but more extreme in the Baltic Sea (0–10.3 vs. 0.6–4.7 mg/m3). Seasonal temperature and salinity amplitudes at Mecklenburg Bight (−0.4°C to 16.9°C; 14.9–28.9) clearly exceeded those at NE Iceland (−1.1°C to 10.3°C; 34.4–34.7). During summer, the study site at Mecklenburg Bight experienced temperatures as high as 12.2°C ± 2.1°C and salinities, Chl levels, and DO concentrations of 23.6 ± 2.7, 1.76 ± 0.02 mg/m3, and 3.0 ± 1.2 mL/L, respectively.
3 Results
After immersion in Mutvei’s solution, cross-sectioned shells revealed internal growth patterns, i.e., annual growth lines and—in the case of specimens from the Baltic Sea—disturbance lines in both the hinge portion and the ventral margin (Figure 3; Supplementary Figures 3, 4). Disturbance lines typically developed shortly before the annual growth lines and typically fell together with the seasonal DO minima and shell Mn/Ca maxima (Figure 2). As outlined further below, the two types of growth lines can be distinguished from each other by means of microstructure analysis. More distinct disturbance lines appeared to be associated with more severe oxygen depletion, but quantification of this link was not possible. For example, more prominent disturbance lines were observed in the summer of 1995 and 1999 (i.e., growing seasons 1994/95 and 1998/99), but weaker lines during the summer of 1996 and 1998, although DO levels dropped to similarly low values in 1996 as in 1995 (Figures 2, 3; Supplementary Figures 3, 4). In studied specimens from NE Iceland (well-oxygenated habitat), no disturbance lines developed (see Supplementary Figure 5).
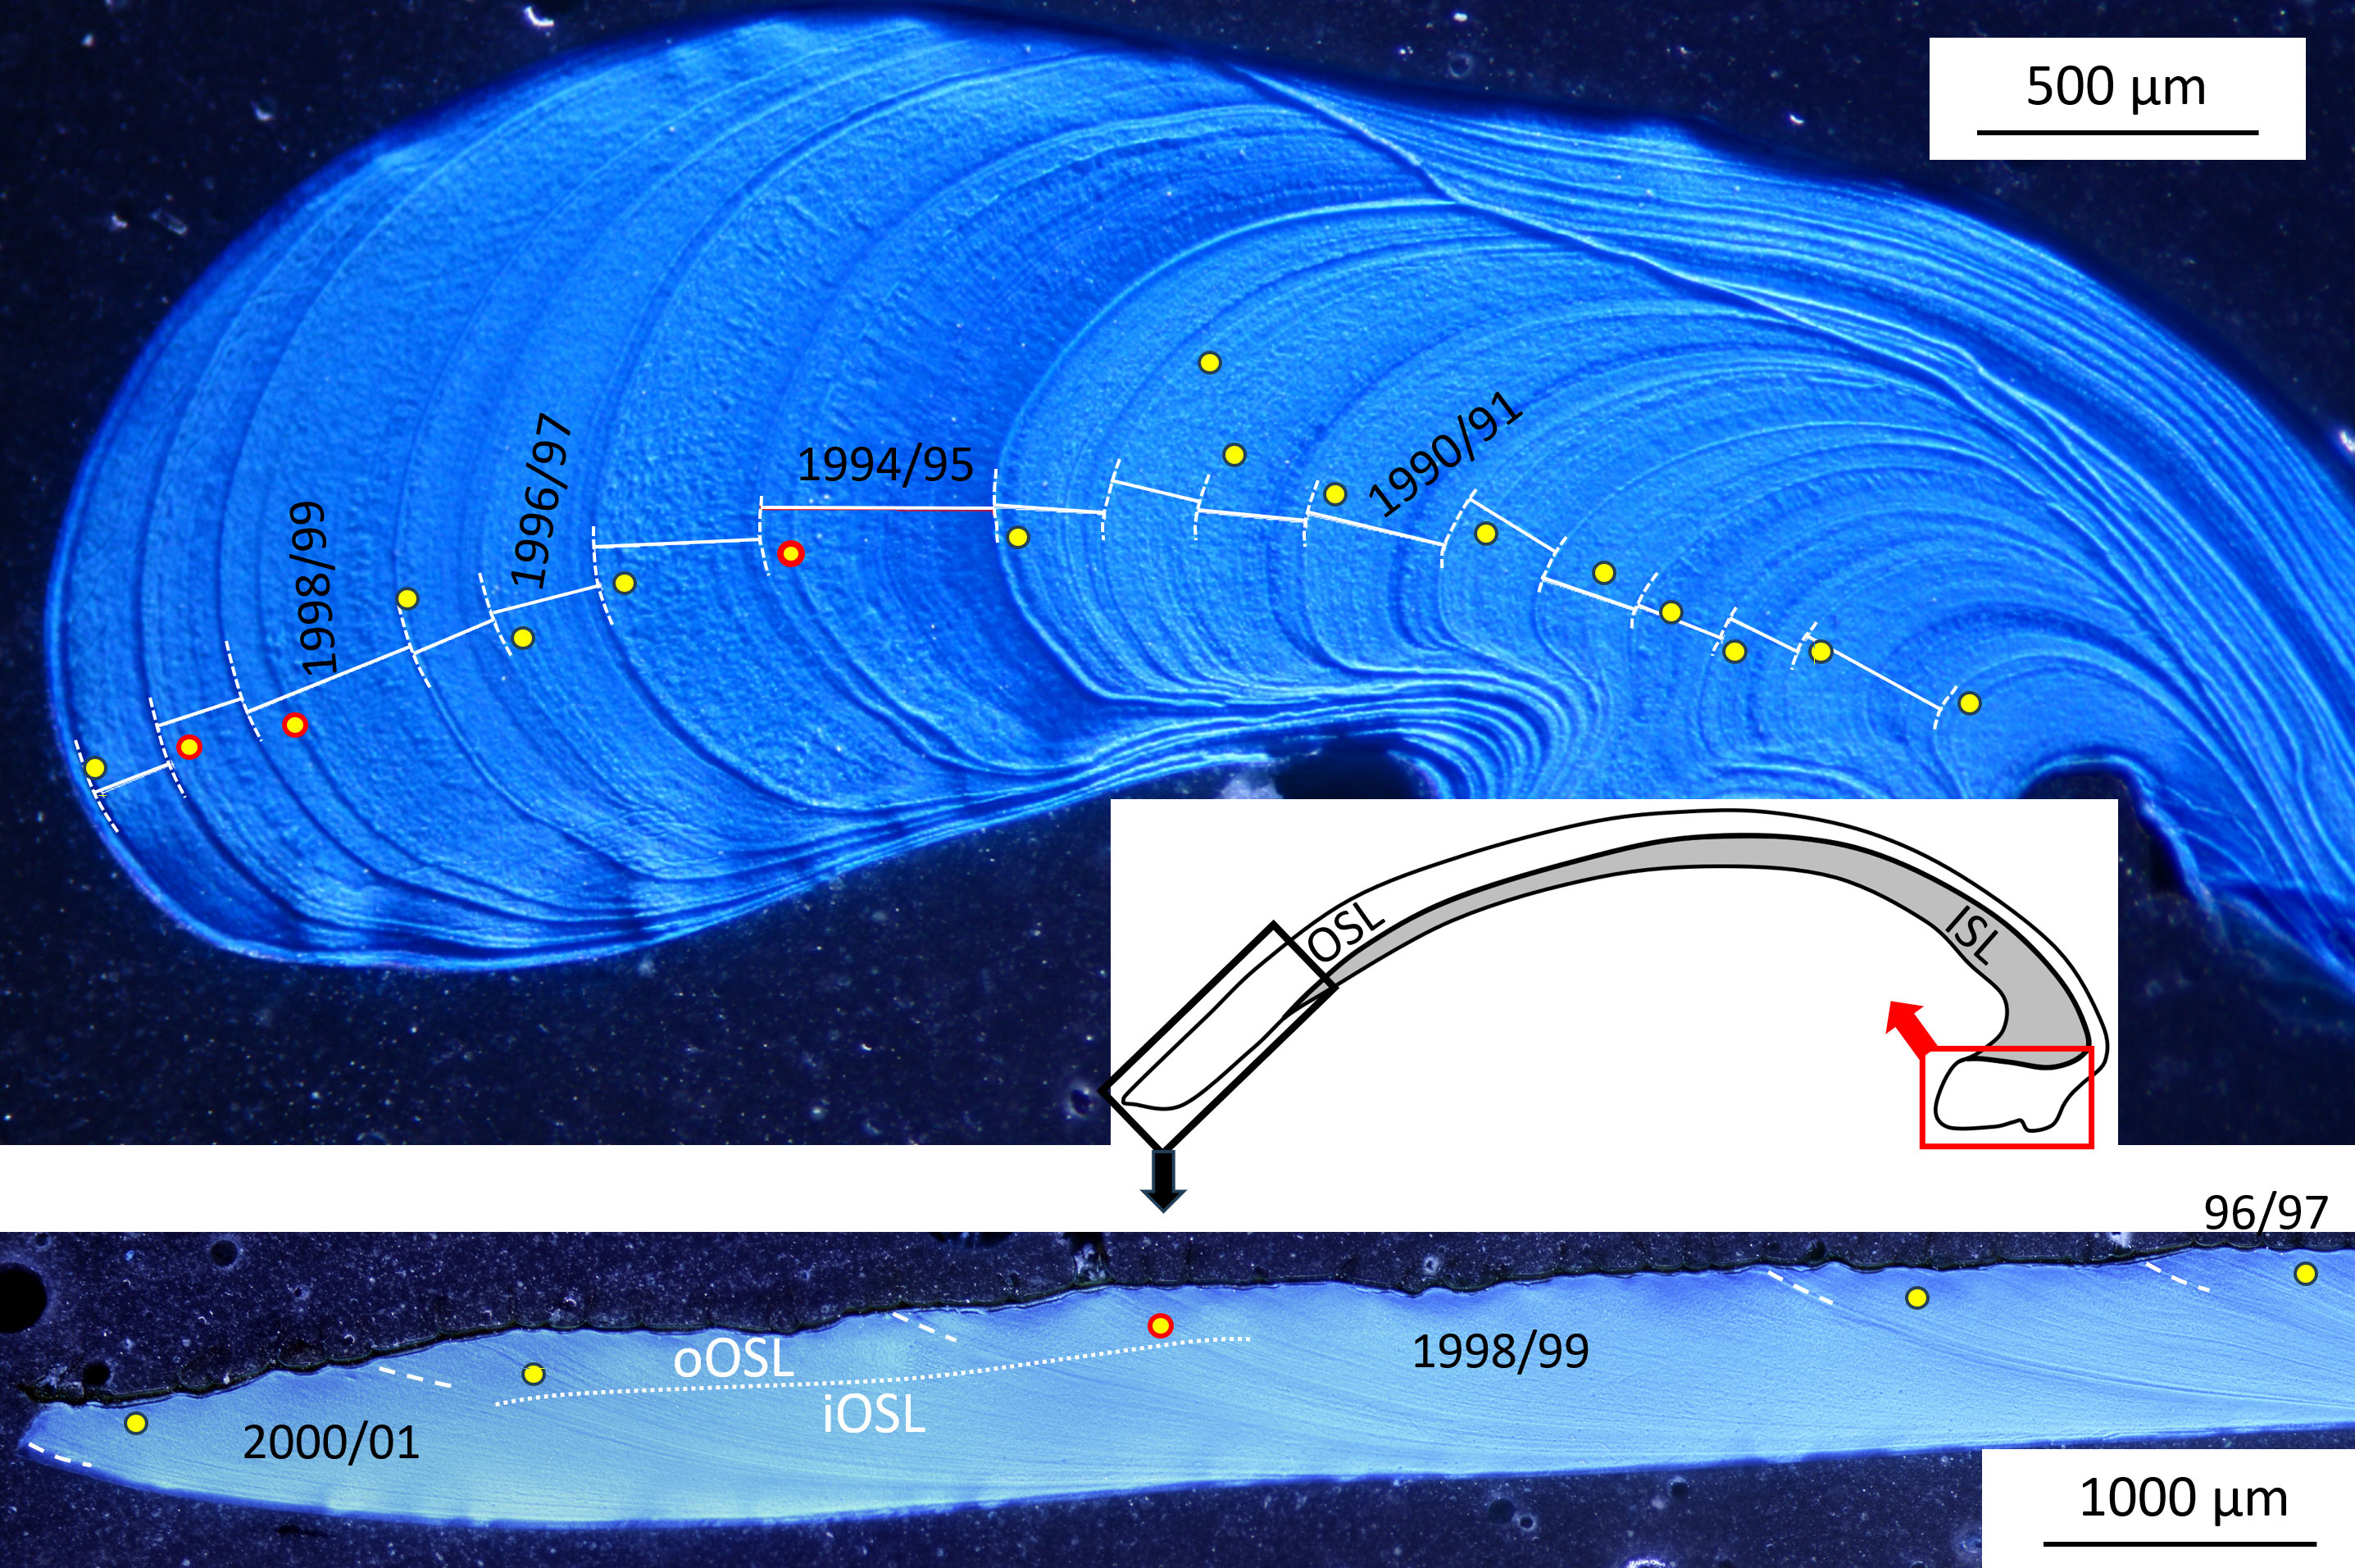
Figure 3 Mutvei’s solution-stained cross-section of an Arctica islandica specimen from Mecklenburg Bight (specimen MLZ-St12-A4R) showing annual growth lines (dashed white lines) and disturbance lines (yellow circles) in the hinge (upper panel) and the ventral margin (lower panel). Circles with red outlines denote particularly prominent disturbance lines. OSL, outer shell layer; ISL, inner shell layer; oOSL, iOSL, outer and inner portions of the OSL.
3.1 Relationship between shell growth and environmental parameters
In the western Baltic Sea, shells of A. islandica grew up to 0.6% of the annual growth increment within a single day (Höche et al., 2022a). In general, daily growth rates increased with higher oxygen supply (r = 0.55, p < 0.05; Figure 4A). The fastest shell production (0.3%–0.6% of annual growth per day) was observed at DO concentrations above ca. 6 mL/L. Below this threshold, however, no more than 0.25% of the annual growth increment was produced per day. Shell growth was also negatively correlated to water temperature (r = −0.54, p < 0.05; Figure 4B). The fastest growth rates occurred between 2.5°C and 5°C. In contrast, in Iceland, growth rates were weakly positively linked to the water temperature (r = 0.22, p < 0.05), and daily shell growth varied between 0.1% and 1% of the annual increment (Figure 4B).
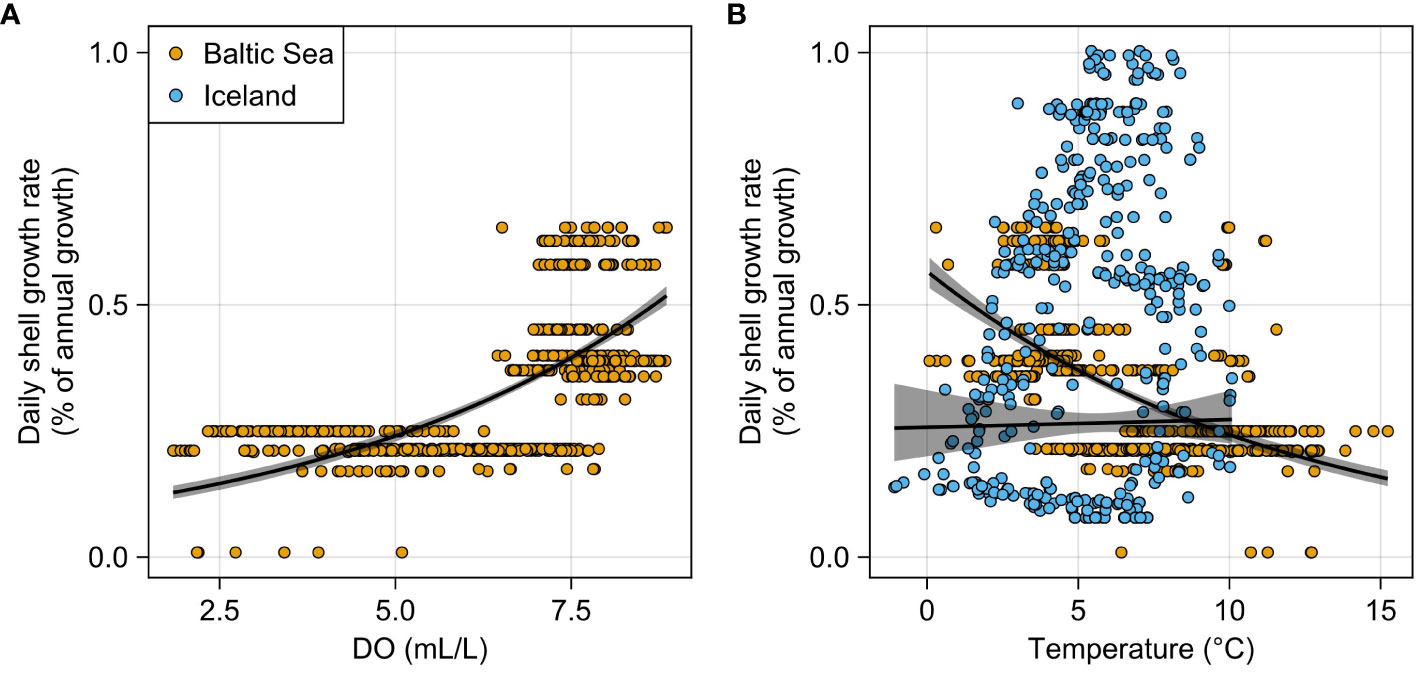
Figure 4 Correlation between intra-annual shell growth rate of Arctica islandica and environmental variables. Note that data were pooled from three specimens per site and the regression curves, thus treating all data points as independent variables. (A) Specimens from the western Baltic Sea (Mecklenburg Bight) grew faster when dissolved oxygen (DO) levels were higher. Below DO concentrations of ca. 6 mL/L, shell growth rates were strongly reduced. (B) In the Baltic Sea, shell growth rates decreased with rising water temperature, but the opposite was observed in specimens from NE Iceland (Þistilfjörður). Note that DO concentration was measured 5 m above the sediment surface. Actual DO concentration experienced by the bivalves was much lower due to sedimentary porewater efflux.
3.2 Qualitative assessment of microstructural differences between localities
Irrespective of locality, the outer shell layer (OSL) of the ventral margin of the studied specimens (Table 1) was subdivided into microstructurally distinct sub-layers (Figure 3), i.e., an outer portion (oOSL) dominated by HOM (Figures 5A, D, G, J) and an inner portion (iOSL) in which CA microstructure prevailed (Figures 5B, K). From the oOSL/iOSL transition (i.e., the boundary between HOM and CA microstructure) toward the myostracum, individual BMUs became gradually smaller and more elongated. In the innermost part of the iOSL, i.e., the slowest growing portion near the myostracum, FCCL microstructure was observed (Figures 5C, L).
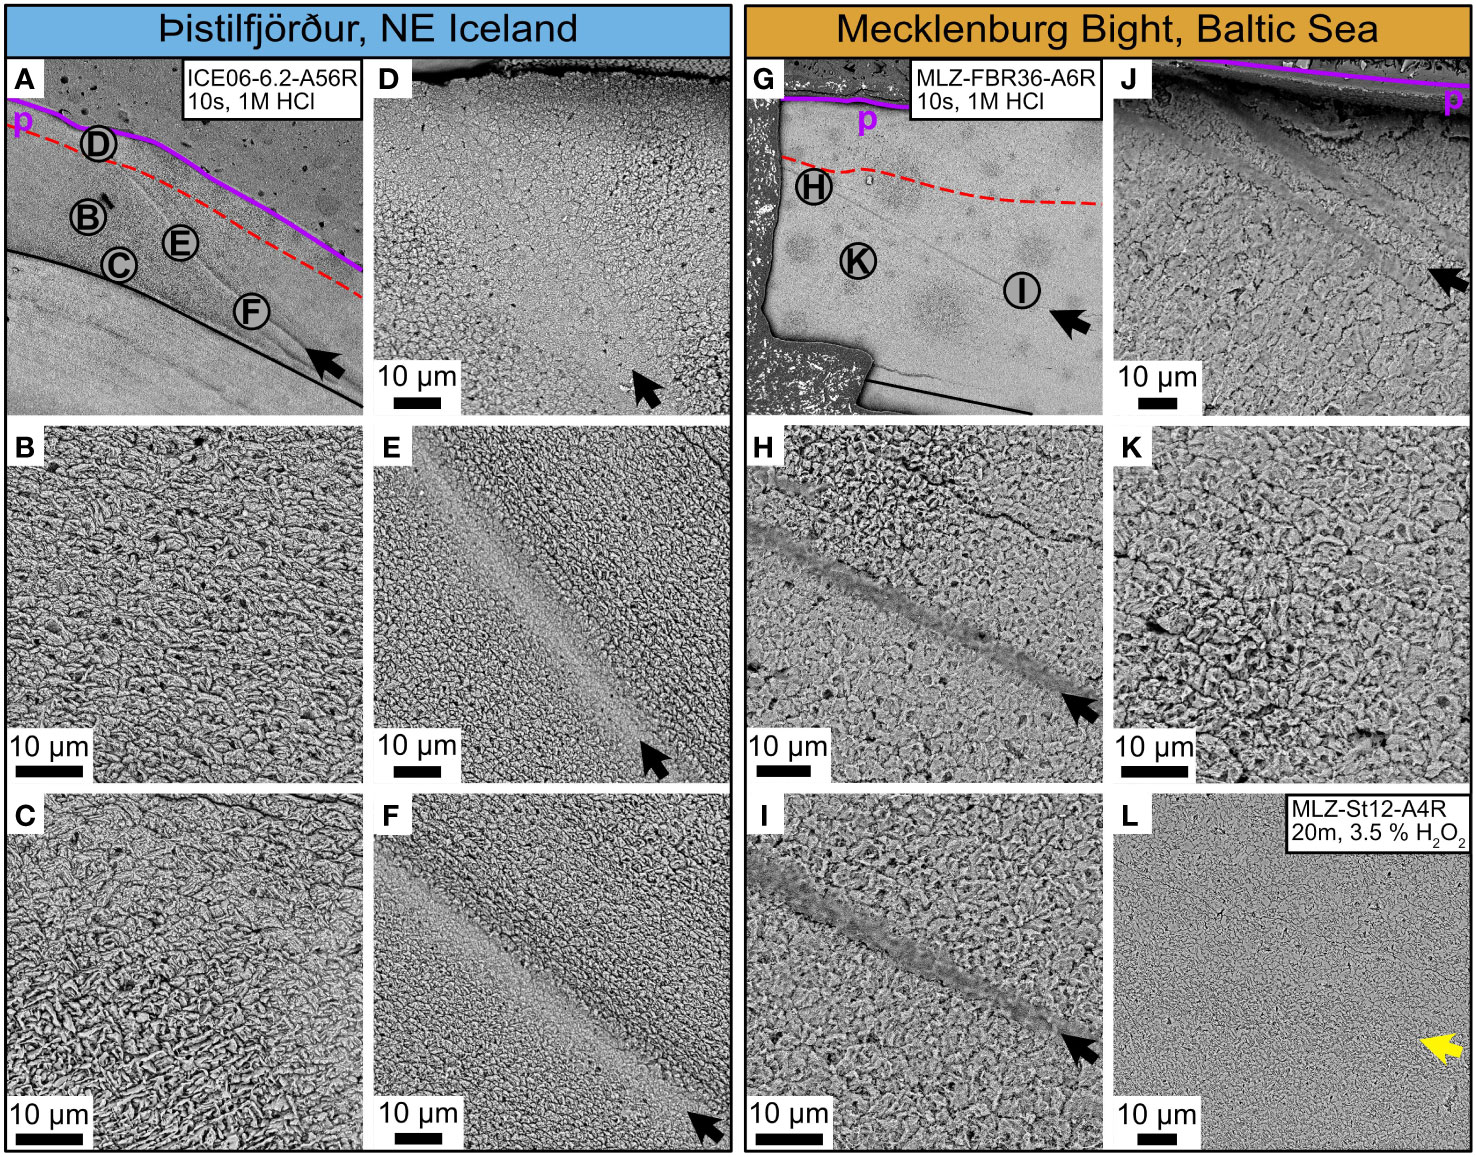
Figure 5 Microstructures in the ventral margin of Arctica islandica shells. Icelandic shells: left panel, blue header. Shells from the Baltic Sea: right panel, orange header. The direction of growth is from the upper right to the lower left in all images. (A, G) SEM overviews showing the position of magnified shell portions (letters in gray circles) as well as the periostracum (p; purple line), the myostracum (black line), and the boundary between the inner and outer portion of the outer shell layer (dashed red line). (B, K) Crossed-acicular and (C, L) fine complex-crossed lamellar microstructures were formed in annual increments toward the myostracum (bottom of the images). (K, L) Biomineral units (BMUs) in shells from the Baltic Sea were arranged in layers and traced by thin spacings (presumably filled with organics before preparation), and occasionally, voids were arranged like a row of pearls perpendicular to the growth direction. (B, C) This layered BMU arrangement including the voids was missing in shells from Iceland. (D, J) In the outermost portion of the outer shell layer, homogeneous microstructure was formed at both localities, with similar biomineral unit (BMU) morphologies, especially near the periostracum. (E, F) In shells from Iceland, BMU sizes varied strongly before and after an annual growth line (black arrows), but no strong enrichment of organic components was observed (which would be indicated by darker gray shadings). (H, I) In shells from the Baltic Sea, in contrast, BMU sizes remained nearly unchanged before and after annual growth lines or bands, but the growth lines/bands contained larger amounts of organics and were much broader than in Iceland (dark gray shadings). (L) Disturbance lines (yellow arrow) in the ventral margin of Baltic Sea specimens consisted of fine complex crossed-lamellar microstructures with small and highly elongated BMUs.
In contrast, the hinge plate (portion formed in the outer extrapallial space (i.e., the same from which the oOSL of the ventral margin was precipitated) was microstructurally more uniform than the ventral margin and showed less gradual microstructural transitions (Figure 6). CA microstructure prevailed, with occasional intercalations of FCCL microstructure (Figures 6A, D, G, J). In shells from both study sites, the annual growth lines in the hinge and ventral margin were typically composed of irregular simple/spherulitic prismatic (ISP) microstructure (e.g., Figures 6B, C, E, F, I, K), but significant differences were detected regarding their relative proportions. In the following, these differences will be described in more detail.
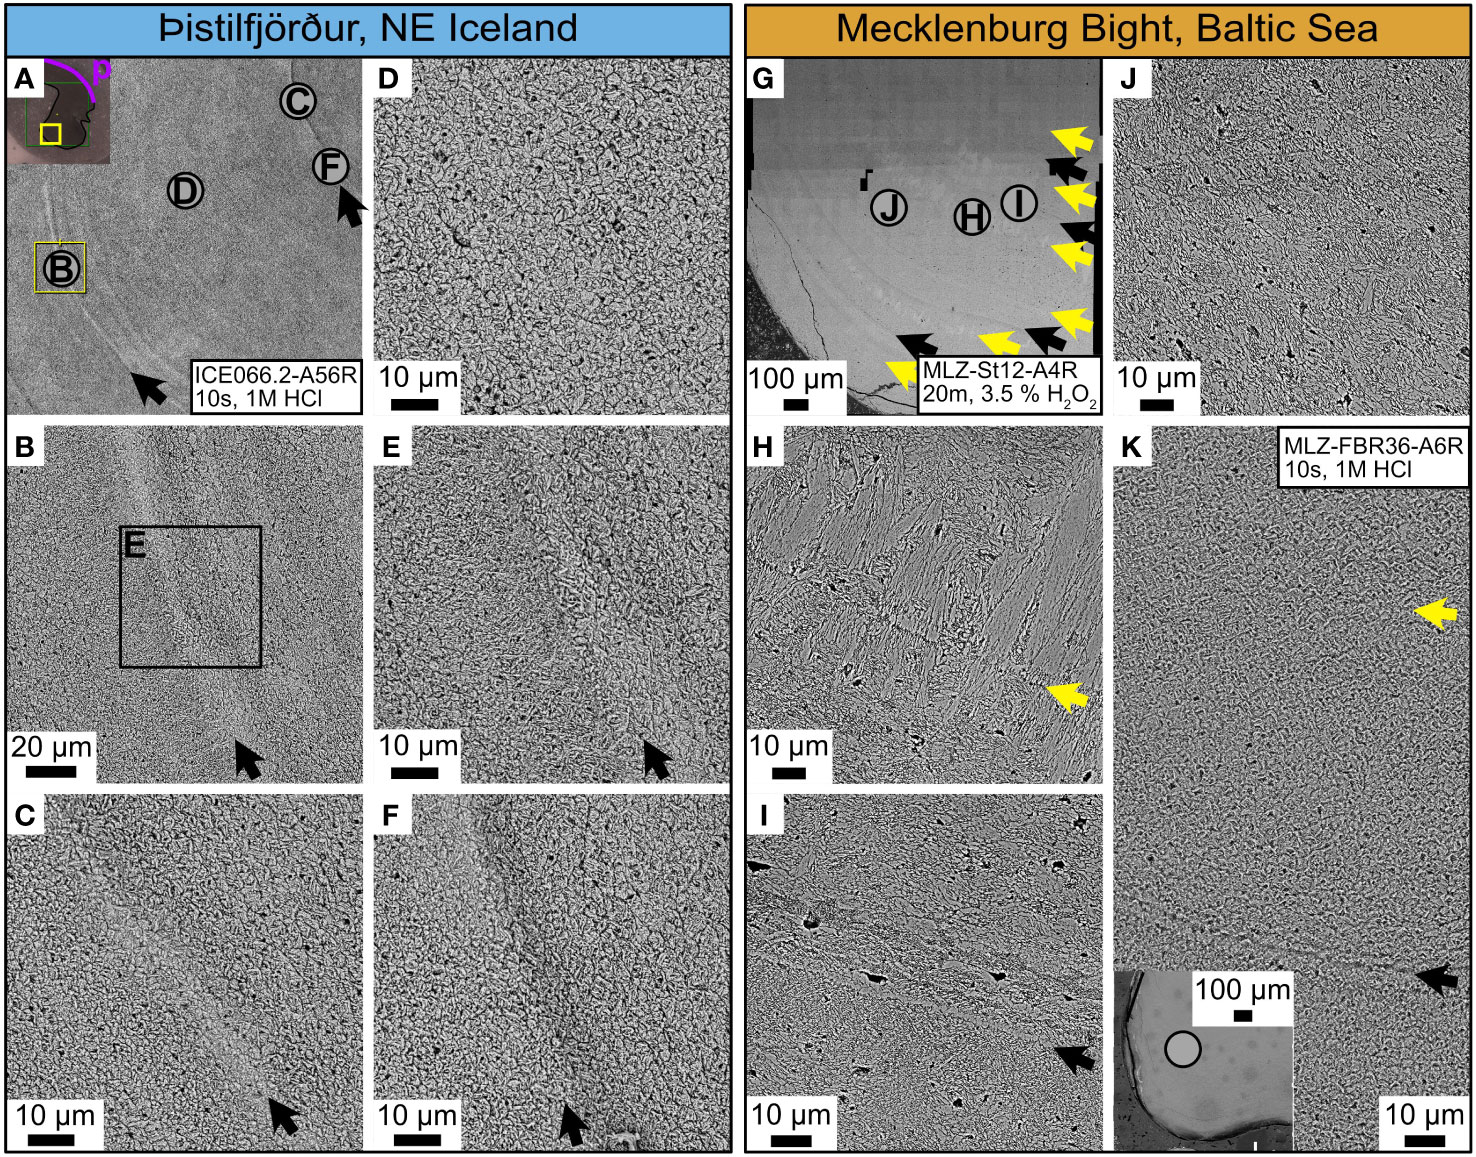
Figure 6 Shell microstructures in the hinge plate of Arctica islandica. Icelandic shells: left panel, blue header. Shells from the Baltic Sea: right panel, orange header. (A, G) SEM overviews showing the position of (B–F, H–I), respectively (letters in gray circles). The periostracum (p) is indicated by the purple line. (D, J) Within the annual increments, crossed-acicular and fine complex crossed-lamellar microstructures prevailed. Biomineral units (BMUs) in shells from Iceland appeared more rounded than those of shells from the Baltic Sea. The latter were more acute and frequently contained small voids (presumably filled with organics before preparation). (B, C, E, F) Annual growth lines (black arrows) in the hinge plates of Icelandic specimens had the same microstructural appearance as in the ventral margin; i.e., BMU sizes varied strongly before and after the annual growth lines. (I, K) Annual growth lines of specimens from the Baltic Sea, in contrast, consisted of distinct bands (or layers) of irregular simple prismatic microstructure, and BMUs before and after the annual growth lines exhibited less variability in size than in specimens from Iceland. In addition, BMUs were more acute and elongated at the annual growth lines than in the annual increments. (H, K) Disturbance lines (yellow arrows) in the hinge plate of Baltic Sea specimens consisted of fine complex crossed-lamellar microstructure, interrupted by a thin, organic-rich layer, and occasionally clusters of untypically highly elongated BMUs.
3.2.1 Ventral margin
The HOM of the oOSL of the ventral margin was nearly identical at both localities; i.e., the size and elongation of individual BMUs were virtually indistinguishable (Figures 5D, J). Likewise, irrespective of the habitat, the annual growth lines in the oOSL were composed of ISP microstructure (Figures 5D–F, H, I). However, the annual growth “lines” of the oOSL were much broader in specimens from the western Baltic Sea than in specimens from NE Iceland, especially underneath the periostracum, and are thus better ascribed as annual growth “bands” rather than “lines”. The width of these bands decreased gradually from the outer shell surface toward the oOSL/iOSL transition where they attained nearly the same width as in specimens from NE Iceland (from here toward the myostracum referred to as “annual growth lines”; Figures 5E, F, H, I).
Shells from the western Baltic Sea and NE Iceland differed more distinctly by the microstructures of the iOSL of the ventral margin than the oOSL (Figures 5B, C, K, L). At both localities, the outer part of the iOSL (i.e., near the transition to the oOSL) was composed of CA microstructure (Figures 5B, K), whereas FCCL dominated the innermost parts (near the myostracum; Figures 5C, L). The appearance of these microstructures, however, differed between the two localities, as did their relative abundance. In specimens from the western Baltic Sea, CA BMUs were typically arranged in layers parallel to the growth front. Adjacent layers were separated from each other by a thin spacing or numerous voids arranged like a string of pearls (Figure 5K). Prior to etching, the latter may have been filled with organic components. This layered arrangement also occurred in shells from Iceland, but it was largely constrained to regions near annual growth lines (Figures 5E, F). Furthermore, specimens from the Baltic Sea contained much more voids within the iOSL than specimens from Iceland.
Locality-specific microstructural differences were also observed in the appearance of the annual growth lines of the iOSL. In Baltic Sea shells, the vicinity of annual growth lines was strongly enriched in organics as indicated by the broad, dark gray shadings in the SEM images (Figures 5H, I), whereas only thin, distinct organic-rich lines developed in specimens from Iceland (Figures 5E, F). The recognition of annual growth lines was greatly facilitated in Islandic shells for two more reasons. First, BMU sizes differed significantly before and after the annual growth lines, whereas nearly identical BMU sizes were observed in specimens from the Baltic Sea (Figures 5E, F, H, I). Second, the annual growth lines in the iOSL of specimens from Iceland were composed of ISP microstructure (as within the oOSL) and thus deviated distinctly from the shell architecture in adjacent shell portions (Figures 5E, F). In contrast, annual growth lines were much less prominent in specimens from the Baltic Sea because they consisted of the same CA microstructure as the surrounding regions (Figures 5H, I).
Furthermore, specimens from the Baltic Sea contained a large number of disturbance lines, which were missing in specimens from Iceland (and less well developed in the better oxygenated Fehmarn Belt site; Figures 3–5). These disturbance lines (Figure 5L) were easily distinguishable from the annual growth lines (Figures 5E, F, H, I) by the presence of FCCL microstructure, i.e., small, elongated BMUs, which were arranged in two predominant dipping angles (Figure 5L). Disturbance lines exclusively developed in shell portions that were strongly enriched in manganese (Figure 3) (Schöne et al., 2021), i.e., shell portions that formed in the summer months during which dissolved oxygen in the water dropped markedly (Figure 2).
3.2.2 Hinge plate
Regardless of locality, in the hinge plate (oOSL), the annual growth lines consisted of irregular simple prisms (Figures 6A–C, E, F, G, I, K), while annual increments were predominantly composed of CA and FCCL microstructures (Figures 6D, J). However, shells from NE Iceland and the western Baltic Sea differed by the relative proportion of these two microstructure types. In specimens from NE Iceland, FCCL microstructure was typically limited to regions adjacent to annual growth lines (Figures 6B, E), whereas in shells from the Baltic Sea, this microstructure also occurred within the annual increments (Figures 6G-K).
Although the annual growth lines of the hinge plate of all studied specimens consisted of the same microstructure type (ISP), site-specific differences were observed at higher magnification (Figures 6A–C, E, F, G, I, K). In Icelandic specimens, the irregular simple prisms were broader and much smaller, and their boundaries were less well-defined than in specimens from the Baltic Sea (Figures 6B, C, E, F). In the latter, the annual growth lines consisted only of one layer of irregular simple prisms with clearly defined boundaries (Figure 6I). Occasionally, the ISP layer was completely missing in specimens from the Baltic Sea and replaced by a thin organic layer (Figure 6K). In addition, specimens from the Baltic Sea sometimes exhibited an extreme form of FCCL microstructure near the annual growth lines of the hinge. This unusual form consisted of highly elongated blocks of acute BMUs, arranged in alternating dipping directions (Figure 6H), closely resembling the appearance of simple crossed-lamellar microstructures.
3.3 Quantitative assessment of microstructural differences between localities
The morphology of BMUs was quantitatively assessed in a total of 1,875 SEM images taken in six shells (Table 1). In the following, the relationships between different BMU shape parameters will be described. Then, the BMU shape data of the two localities will be contrasted with each other, and finally, for specimens from the Baltic Sea, data of shell regions formed under low and high DO will be compared with each other.
3.3.1 Relationship between morphological parameters of BMUs
The size of BMUs of A. islandica shells of both localities was weakly but significantly positively correlated to the coverage of BMUs in the SEM images (0.25 < r < 0.37, p < 0.05); i.e., larger BMUs were associated with narrower interstitial spaces between them and thus less intercrystalline organic matrix (Figure 6A). In addition, the BMU size was antiproportional to BMU elongation (−0.20 < r < −0.37, p < 0.05); i.e., larger BMUs were more rounded, and smaller BMUs were more elongated (Figure 6B). The strongest inverse correlation was found between the size and the perimeter-to-size ratio of BMUs (−0.90 < r < −0.91, p < 0.05), a parameter that has not yet been studied in the context of bivalve shell microstructures (Figure 7C). Larger BMUs came with smaller perimeter-to-size ratios (Figure 7C). The second newly studied microstructural parameter, the BMU solidity, was also negatively linked to BMU size (−0.46 < r < −0.47, p < 0.05), meaning that larger BMUs contained larger and more numerous notches and crevices. Larger BMUs thus appeared as less ideally shaped grains than smaller BMUs. All the above-mentioned relationships occurred at both sites without obvious site-specific differences.
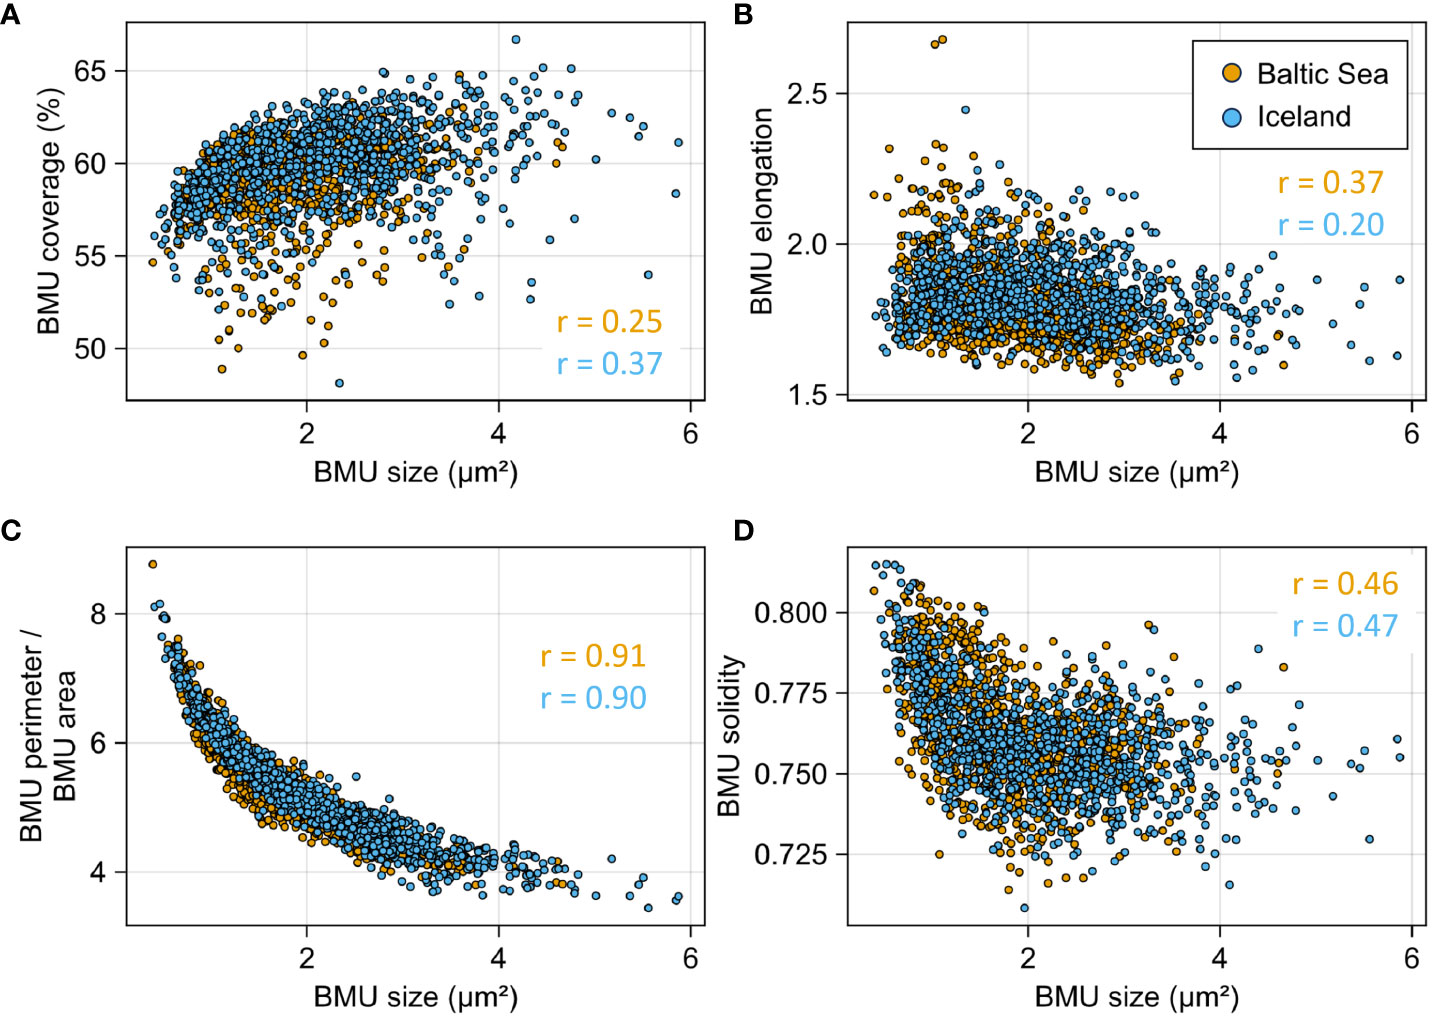
Figure 7 Microstructural parameters of six Arctica islandica shells (three from Mecklenburg Bight, orange; three from NE Iceland, blue) plotted against each other. (A) Coverage of the biomineral units (BMUs) in the SEM images was positively correlated with the BMU size. (B) BMU elongation, (C) the perimeter-to-area ratio of the BMUs, and (D) the BMU solidity were all negatively correlated with BMU size. All correlations are statistically significant (p < 0.05).
3.3.2 Site-specific differences in BMU morphology
Typically, BMUs of shells from NE Iceland were significantly larger than those of shells from the Baltic Sea (average of 2.18 versus 1.79 µm2; Mann–Whitney U-test, p < 0.05), particularly in the ventral margin (Figure 8A). The elongation of the BMUs of the ventral margin exhibited no significant difference between sites and equaled, on average, approx. 1.8 for both sites (Figure 8B). In the hinge, however, the elongation of BMUs differed significantly (p < 0.05) between sites. BMUs of specimens from the Baltic Sea were, on average, more elongated (2.0) than in shells from Iceland (1.8; Figure 8B). The average BMU solidity, however, returned statistically indistinguishable values for both sites, i.e., 0.76 (Figure 8C). The perimeter-to-size ratio of the BMUs (= two-dimensional surface area-to-volume ratio) was generally larger in the hinge than in the ventral margin. In both shell portions, perimeter-to-size ratios of BMUs of specimens from the Baltic Sea were significantly larger than those of specimens from Iceland (p < 0.05; 5.2 vs. 4.5 in the ventral margin and 5.7 vs. 5.3 in the hinge; Figure 8D).
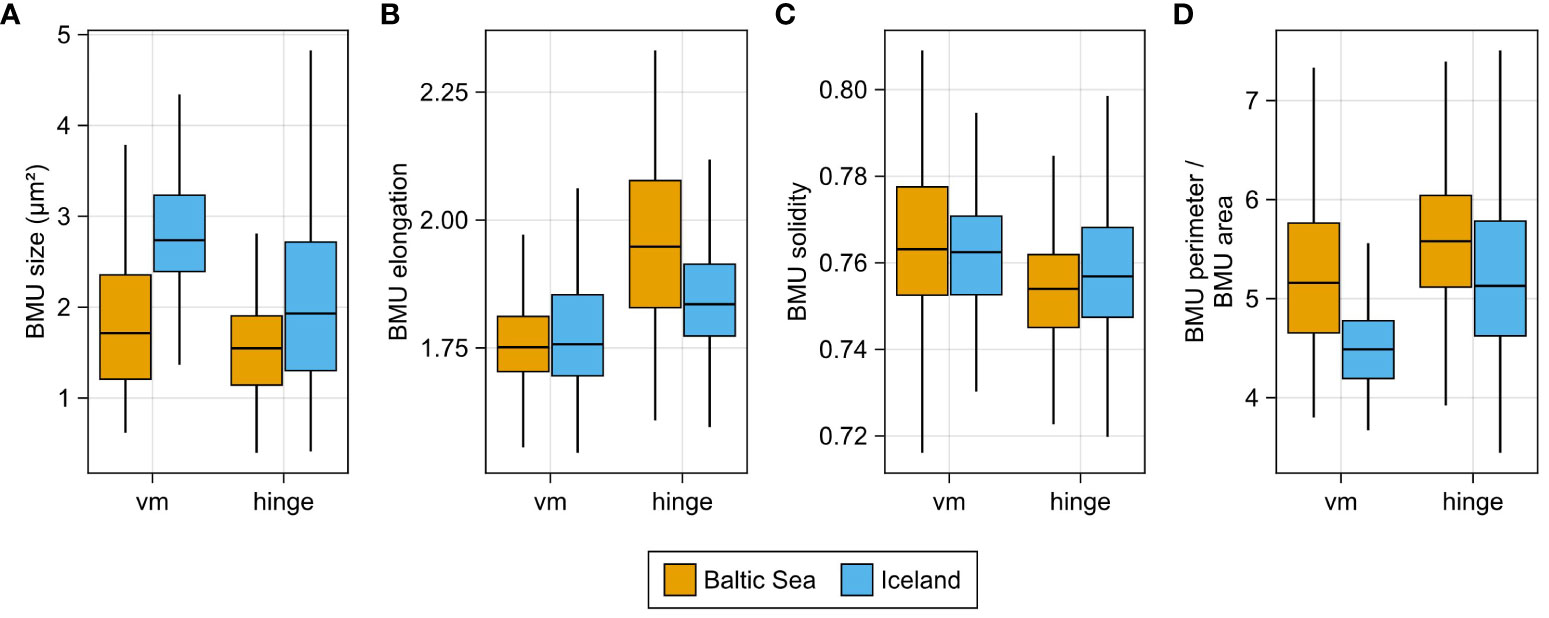
Figure 8 Morphological parameters of biomineral units (BMUs) in different shell portions of Arctica islandica. (A) BMU size, (B) elongation (C) solidity, and (D) perimeter-to-area ratio.
3.3.3 Correlation between BMU morphology and environmental parameters as well as shell growth rate
In specimens from the Mecklenburg Bight, BMU elongation and solidity were weakly but statistically significantly anticorrelated to DO concentration (r = −0.11 and −0.08, respectively; p < 0.05; Figure 9). In addition, the BMU solidity was weakly but significantly negatively correlated to salinity (r = −0.09, p < 0.05), while the opposite applied to BMU elongation and salinity (r = 0.12, p < 0.05). All other parameters, i.e., the BMU size, perimeter-to-area ratio, and solidity, were significantly linked with neither DO nor salinity. Both BMU size and coverage were inversely coupled with temperature, while the BMU elongation revealed a positive correlation (r = −0.07, −0.11, and 0.16, respectively; p < 0.05). The BMU size was also significantly positively linked with the shell growth rate (r = 0.11, p < 0.05), whereas the opposite applied to BMU elongation and perimeter-to-area ratio (r = −0.15 and −0.11, respectively; p < 0.05).
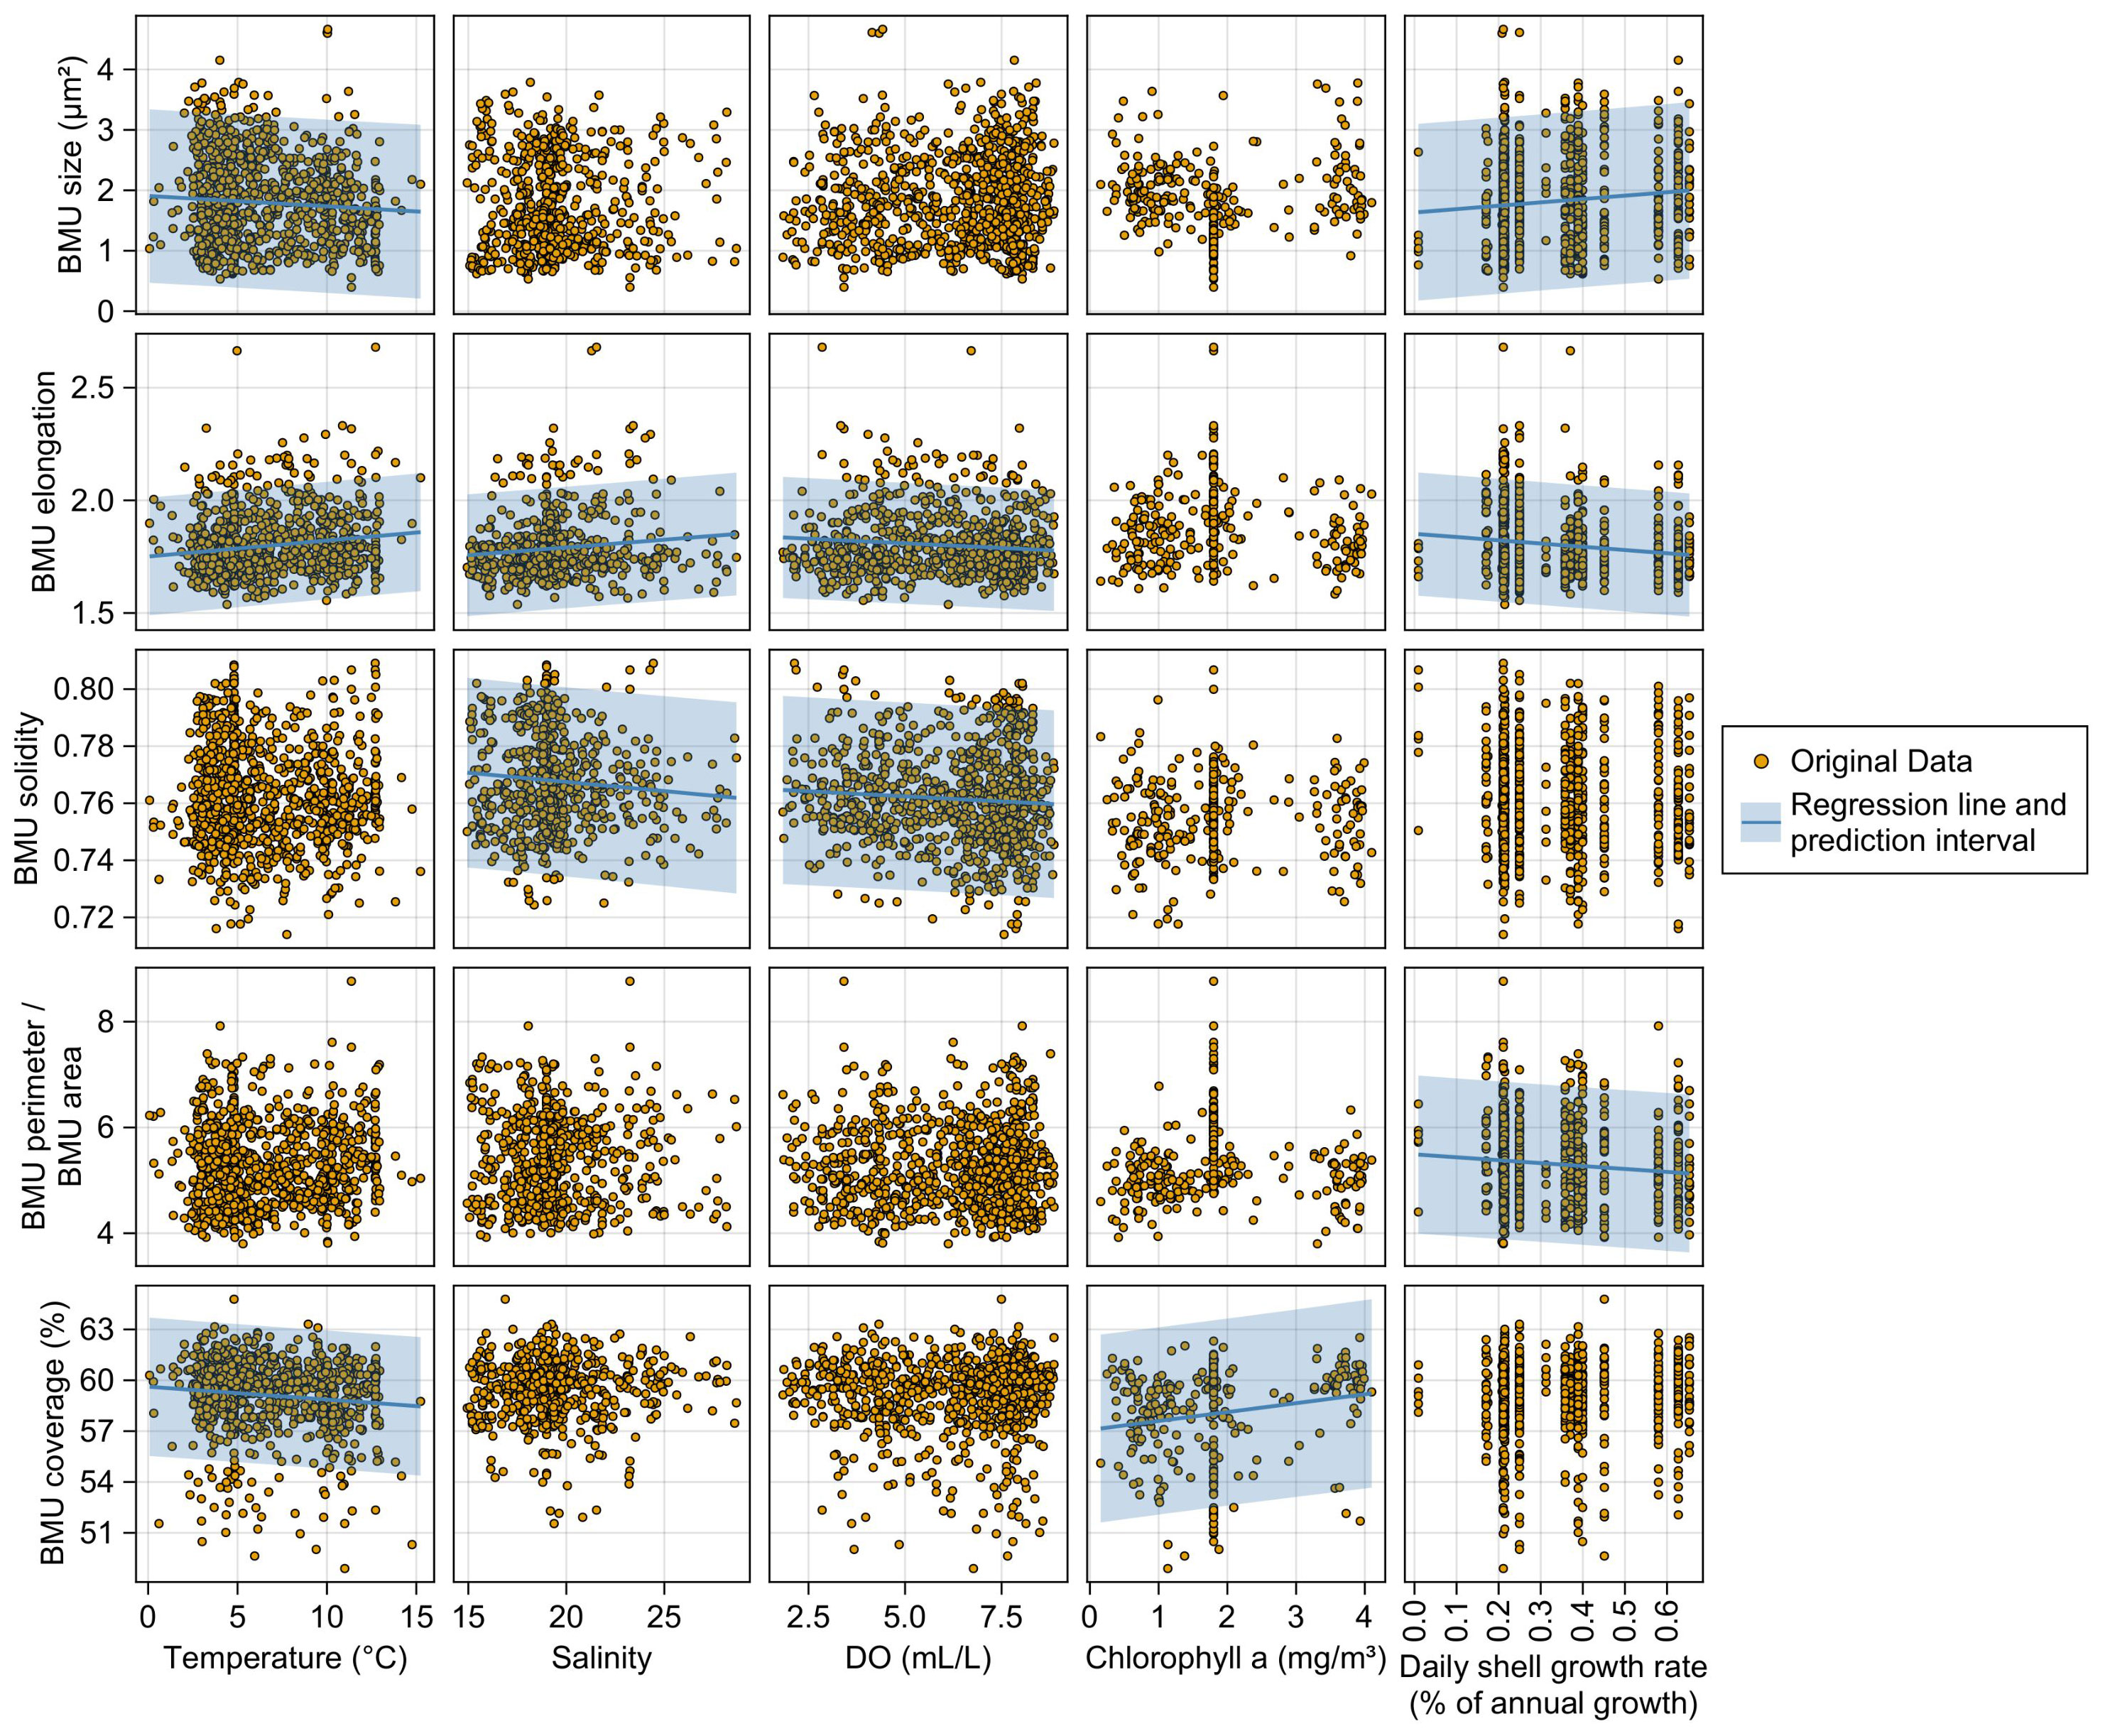
Figure 9 Scatterplots illustrating correlations between biomineral unit (BMU) morphology of Arctica islandica shells and environmental parameters. Only data of specimens from the Baltic Sea are shown. In the case of statistically significant correlations between parameters, lines and shaded areas are shown, which represent linear regression models and their prediction intervals, respectively.
3.3.4 Variations in BMU morphology over time
BMU parameters of specimens from the Baltic Sea exhibited substantial variability through ontogeny (Figure 10). Data from the ventral margin showed similar patterns over time as data from the hinge, but the levels of change in the two shell portions did not always match. BMUs in the hinge were smaller and more elongated and had larger perimeter-to-area ratios and a lower BMU coverage (Figures 7A, 9). In the ventral margin, however, the BMU morphology of different specimens exhibited similar levels and highly synchronous variation through time, except for specimen MLZ-St12-A7L, which had approx. 1.0–1.5 µm2 smaller and approx. 0.02 (i.e., 2%) more solid BMUs than the remaining specimens (Figure 10B). Typically, BMUs were largest in winter (~2.8 µm2 during December and January) and smaller in summer (~1–2 µm2). However, in 1994, the annual BMU size maximum already occurred in the fall, while from 1997 to 2000, it occurred later (ca. spring to summer). BMUs were more rounded at the annual boundaries and more elongated during summer, i.e., nearly contemporaneously with the seasonal hypoxia. Exceptions from this pattern occurred during 1994 and 1996 when BMUs remained rounded even during summer. In the case of the BMU solidity, perimeter-to-area ratio, and coverage, no pronounced seasonal patterns could be identified, and values exhibited much more variation between specimens than for the remaining parameters.
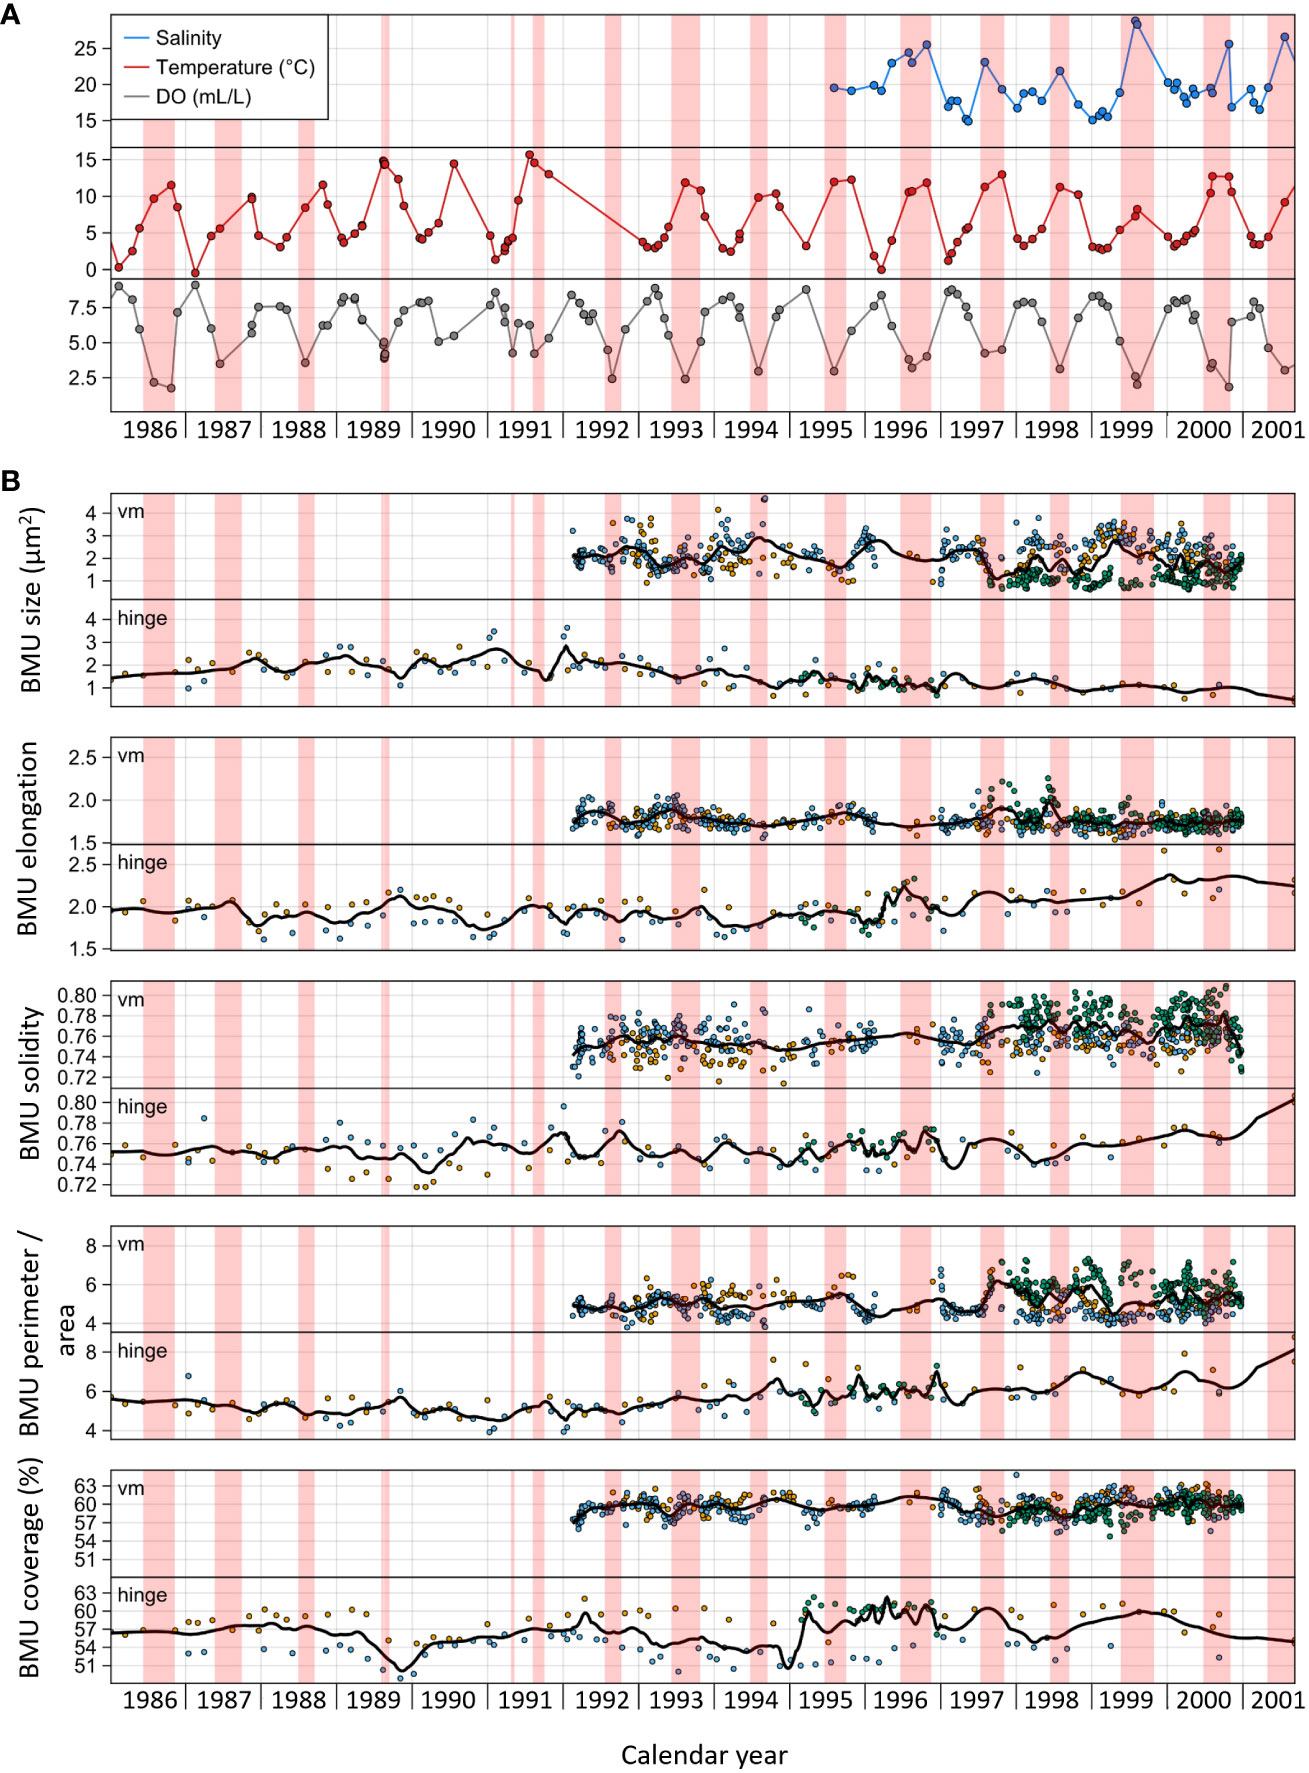
Figure 10 Temporal variability of (A) environmental parameters (temperature, salinity, and dissolved oxygen) and (B) microstructural parameters of Arctica islandica. Only data of specimens from the Baltic Sea are shown. (A) Circles represent in situ measured data, and lines represent daily interpolations. (B) For biomineral unit (BMU) size, elongation, solidity, and perimeter-to-area, each data point represents the median of all BMUs within one SEM image. Data from different specimens are shown in different colors (blue, orange, and green). Curves represent LOESS models computed using a smoothing factor of 0.3 and representing changes in each parameter over time. Solid markers and black curves represent data from the ventral margin, whereas transparent markers and gray curves represent hinge plate data. Areas shaded in red represent time intervals with dissolved oxygen (DO) concentrations below 5 mL/L.
In specimens from the Baltic Sea, several significant morphological differences were observed between BMUs precipitated below and above 5 mL/L DO (Figure 11). In the ventral margin, BMUs formed at low DO were significantly (Mann–Whitney U-test, p < 0.05) more solid (0.765 versus 0.762), whereas all other morphological parameters were unrelated to oxygenation status. In the hinge plate, in contrast, BMUs formed below 5 mL/L DO were significantly smaller (1.3 versus 1.7 µm2) and more elongated (2.06 versus 1.93) and had a higher perimeter-to-area ratio (5.95 vs. 5.57 µm/µm2) than BMUs formed at higher DO concentration.
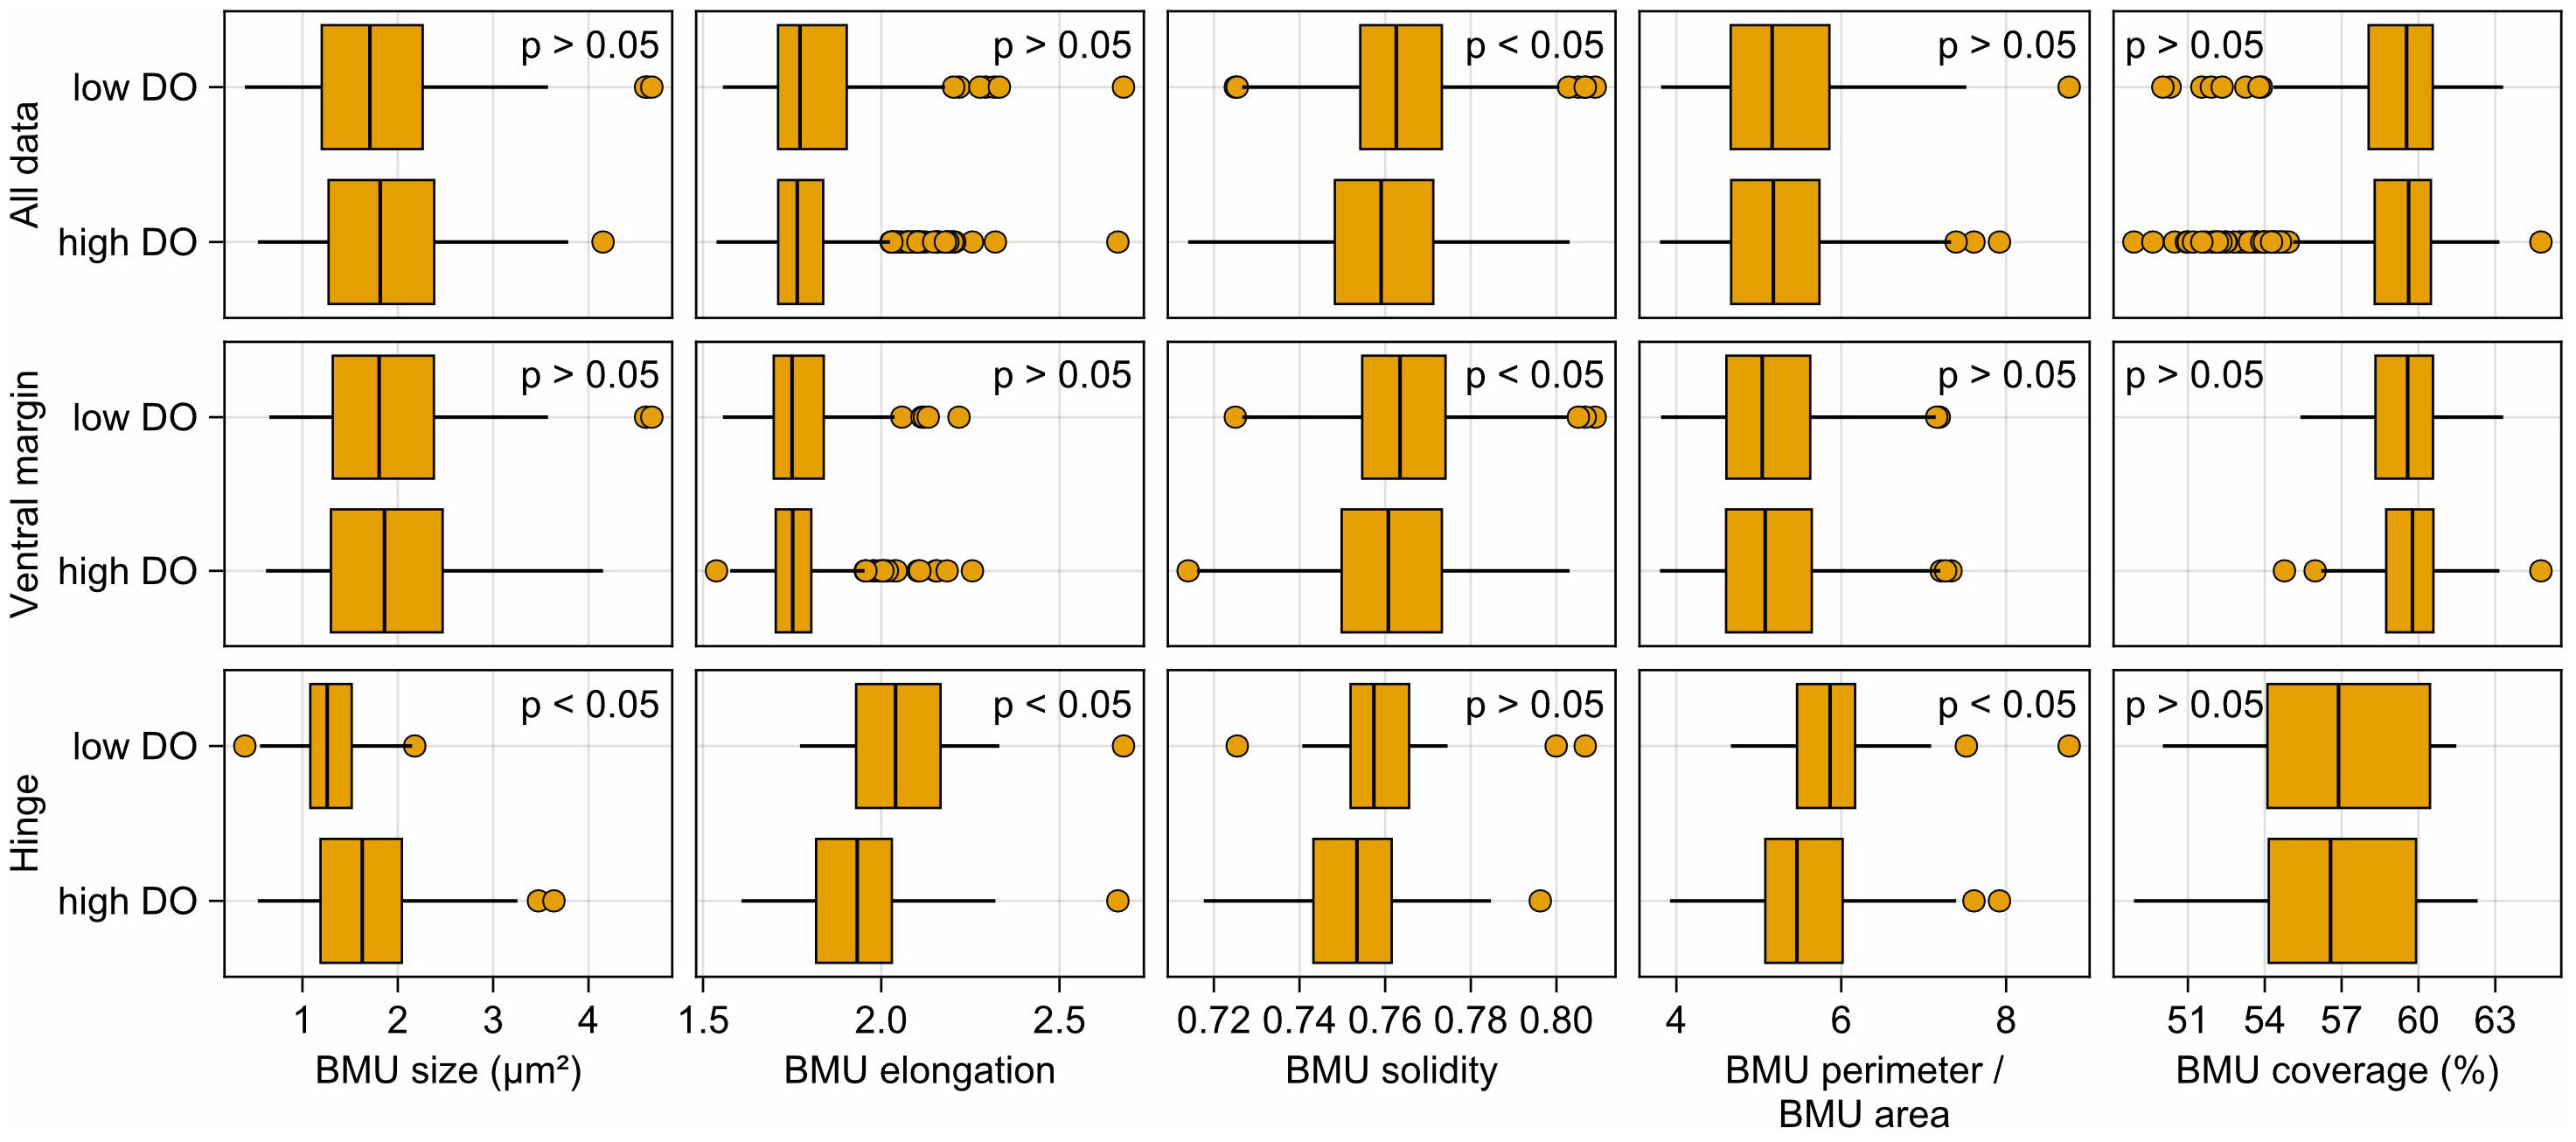
Figure 11 Biomineral unit (BMU) morphology of Arctica islandica at different dissolved oxygen concentrations. Only data of specimens from the Baltic Sea are shown. A threshold of 7 mL/L dissolved oxygen at the time of formation (≡ 743 µmol/L) was used for classification of BMU data into low- and high-dissolved oxygen categories.
4 Discussion
As indicated by the results of this study, strongly reduced dissolved oxygen availability leads to the formation of disturbance lines in shells of A. islandica (Figure 3), associated with a significant enrichment in manganese (Figure 2). Disturbance lines were missing in shells of specimens from well-oxygenated sites at NE Iceland. Note that, at this locality, shell manganese concentration remained below the detection limit (Schöne et al., 2023). Disturbance lines can be microstructurally distinguished from periodic annual growth lines because disturbance lines consist of fine complex crossed-lamellar microstructure, whereas annual growth lines are made of irregular simple prisms (Figures 5, 6). As demonstrated by previous studies, the two types of growth lines can also be distinguished by means of trace element analysis because disturbance lines occur in shell portions that are strongly enriched in manganese, whereas the annual growth lines fall together with sharp Mg/Cashell peaks (Schöne et al., 2022).
With decreasing oxygen content in the ambient water, the disturbance lines seem to become more prominent (Figures 5, 6) and contain increasingly smaller and more elongated individual biomineral units with a larger perimeter-to-area ratio (Figures 8–10). However, it was not possible to provide a quantitative relationship between the prominence of disturbance lines and DO values, largely because the oxygen levels in the water were measured too infrequently (see Figure 2). The actual seasonal low-oxygen minima may thus have been missed. Future studies under controlled laboratory experiments and constant monitoring of environmental parameters would be very useful to further explore the relationship between the prominence and microstructural features of disturbance lines in relation to varying DO levels. Such experiments should also be conducted with a larger number of specimens to assess potential individual differences between bivalves. Also, due to a lack of detailed descriptions of the microstructure at disturbance lines (micrometer to nanometer scale) in previous studies (Pannella and MacClintock, 1968; Clark, 1974; Gaspar et al., 1994; Dunca et al., 2009; Cardoso et al., 2013; Vihtakari et al., 2016), it currently remains unknown if strong oxygen depletion leads to microstructurally distinct disturbance lines that differ from those caused by other environmental stressors (something that controlled rearing experiments could likewise tackle). Unless combined with high-resolution element chemical analyses, disturbance lines can currently not be employed as an independent proxy for oxygen deficiency. Therefore, it is strongly recommended to verify at least in one specimen of a selected study site that the shell portions containing disturbance lines are enriched in manganese (= a chemical DO proxy in bivalve shells; Schöne et al., 2021; Schöne et al., 2022).
4.1 Disturbance lines as deoxygenation proxies, verification by Mn/Cashell
Disturbance lines were exclusively found in specimens from the Baltic Sea, specifically in shell portions formed under severe oxygen depletion during summer (Figures 2, 3). None of the other environmental variables for which instrumental data were available caused comparable shell growth patterns at any other study locality. For example, the study site at NE Iceland is episodically strongly influenced by nutrient-poor polar waters (Marali and Schöne, 2015). Despite that, the bivalves did not form disturbance lines (Supplementary Figure 5) but just grew slower (Marali and Schöne, 2015). Likewise, no disturbance lines were formed in the present study at temperatures close to 0°C or salinities as low as 14.6 (Figure 10), conditions which are well-known to cause physiological stress and slow growth in ocean quahogs (Witbaard et al., 1998; Hiebenthal et al., 2012). In shells from the western Baltic Sea, disturbance lines formed in summer despite water temperatures (−0.5°C to 15.9°C; Figure 10) were near the species-specific optimum (6°C to 16°C; Merril et al., 1969; Witbaard et al., 1998; Cargnelli, 1999) and salinities (16.7–28.9 between June and August; Figure 10) well above values that exceed the species-specific tolerance (approx. 10–12: von Oertzen and Schulz, 1973; Zettler et al., 2007; Darr et al., 2014). Given that the Baltic Sea is eutrophicated, the bivalves should also not have experienced any lack of food supply that could have led to disturbed shell growth in summer. While high algal densities were reported to negatively affect the feeding behavior of A. islandica (Winter, 1970), this effect is probably negligible in comparison to the effects of an actual lack of food supply. It is also unlikely that the disturbance lines resulted from predatory attacks. First, growth distortions related to predation are typically associated with distinct notches and damages on the outer shell surface (e.g., Kennish and Loveland, 1980; Gaspar et al., 1994; Ramsay et al., 2001), which were not observed. Second, predatory attacks should not be limited to low-DO times but occur year-round. Third, predation, for instance, by predatory fish (Arntz and Weber, 1970; Rumohr and Krost, 1991), is also common in other localities outside the Baltic Sea as well. The only reasonable remaining environmental factor that could have triggered the formation of the regularly developed disturbance lines in Baltic Sea shells is severe oxygen deficiency. This conclusion is supported by the concurrent enrichment of manganese in the shells as well as an inverse relationship between the prominence of disturbance lines and DO concentration (and the height of Mn/Cashell peaks).
The rationale for using Mn/Ca ratios of bivalve shells as a surrogate for DO is as follows. Under reducing conditions (e.g., within the sediment), manganese becomes dissolved in the water column (Hem, 1963; Balzer, 1982; Rue et al., 1997) and is biologically available as Mn2+. Sedimentary porewater diffuses out of anoxic sediments (Ben-Yaakov, 1973; Kremling et al., 1997), mixes with water above the substrate, and may be inhaled by A. islandica (and other filter-feeding benthos). Dissolved manganese and other redox-sensitive elements can then reach the body fluids of the bivalves and eventually be incorporated into the shell. In the case of Mn2+, this occurs swiftly after uptake from the water (Langlet et al., 2007). Mn2+ concentrations are highest near the sediment–water interface and gradually decline with increasing distance from the seafloor as well as rising DO concentration in the free water column (Kremling and Petersen, 1978). The correlation between shell Mn/Ca values and DO measured at some distance from the sediment surface (e.g., approx. 5 m above the substrate in the case of Mecklenburg Bight) indicates that the bioavailability of Mn2+ near the seafloor is proportional to DO concentrations in the free water column. This relationship was previously evoked to suggest that Mn/Cashell serves as a semiquantitative DO proxy in Astarte spp. and A. islandica (Schöne et al., 2021; Schöne et al., 2022).
Due to the lack of direct measurements of DO concentration at the very sites at which the bivalves lived and inhaled water (i.e., the fluffy layer), or even better, the DO content of the coelomic fluid, we can only provide the average DO value that prevailed 5 m above the sediment surface when the disturbance lines were formed (below approx. 5 mL/L ≡ 516 µmol/L at 2.43 atm and 7.5°C). The water inhaled by the bivalves at the seafloor, however, most certainly contained much less oxygen than indicated by the instrumental DO data because of sedimentary porewater efflux. Presumably, DO concentration was less than 45 µmol/L (≡ 5 kPa, 0.43 mL/L ≡ 1.62 mg/L), i.e., the threshold at which the metabolic rate depression of A. islandica starts (Strahl et al., 2011). Controlled rearing experiments in future studies would be very useful to constrain and quantify the relationship between the prominence of disturbance lines and actual DO levels close to the seafloor where the bivalves live.
4.2 Microstructural characteristics of disturbance lines
Disturbance lines were associated with a strong reduction in shell growth rate (Figure 4) and a concomitant formation of FCCL microstructure (Figures 4, 5). FCCL BMUs became increasingly smaller, more elongated, and less convoluted (= lower surface roughness, higher solidity) as DO levels dropped. The correlation between BMU size and DO fits well with the observation that A. islandica strongly reduces the metabolic rate under low-oxygen conditions (Theede et al., 1969; Taylor and Brand, 1975; Strahl et al., 2011). As a consequence, much less energy would be available to transport Ca2+ and HCO3– toward the site of biomineralization and H+ ions away from it as well as to enzymatically convert metabolic CO2 into bicarbonate ions. This would inevitably lead to a reduction of the BMU size because an active ion transport is crucial to form abundant CaCO3 (Wilbur and Saleuddin, 1983; Carré et al., 2006). Furthermore, based on the observation that low-DO-induced stress changes the expression of certain genes (Philipp et al., 2012), it is speculated here that low-DO-induced physiological stress also influences the synthesis of proteins responsible for the formation of a specific BMU habit. A change in the type and composition of shell-forming proteins may have been responsible for the production of increasingly smooth biominerals as DO supply dropped. If that hypothesis holds true, there may be scope to detect oxygen deficiency in the past solely by detailed BMU morphometry or even to quantify the DO depletion based on BMU habit. Future work should thus further explore the diagnostic potential of the morphological properties of the BMUs. As shown here, the relationship between DO and BMU size or elongation was statistically significant, but the explained variability was too small and the error too large to be used to reconstruct DO concentration from morphometric data of the BMUs (Figure 9). Perhaps, the surface roughness, size, shape, or other parameters reveal a closer relationship with DO concentration if studied in three dimensions (e.g., Howes et al., 2021; Mehra et al., 2022).
4.3 Anaerobiosis and shell stability
As demonstrated by many controlled laboratory experiments (Oeschger, 1990), under the persistent absence of oxygen (anoxia) or the presence of H2S (euxinia), A. islandica closes its valves for extended periods of time, ceases biomineralization, and switches to an anaerobic metabolism once all entrapped oxygen is consumed (Crenshaw and Neff, 1969). Acidic metabolites generated by this type of adenosine triphosphate production (i.e., anaerobic glycolysis) are neutralized by the dissolution of inner shell surfaces (Crenshaw and Neff, 1969; Crenshaw, 1972; Oeschger, 1990). This process can readily explain the thinness (ca. 1 mm-tick; Supplementary Figure 1) of ocean quahog shells from the western Baltic Sea as formerly hypothesized by Weigelt (cited as a personal communication in Oeschger, 1990).
The shells from the Baltic Sea were not only very thin but also overall enriched in organic matrix compared to specimens inhabiting permanently normal marine, well-oxygenated settings (Figures 4, 5) (see also Li et al., 2015). Presumably, this is attributed to their lower BMU coverage values (Figure 7A) and to the fact that smaller BMUs come with a proportionally larger surface area (Figure 7C), which is occupied by an organic matrix (Figure 7). The surplus of organics demonstrably increases the elastic properties of shells (cf. Li et al., 2015), which results in higher toughness and strength (Chen et al., 2008; Meyers et al., 2008). Given that the shells were very thin, this may have served as an effective strategy to withstand predatory attacks. Toward the outer shell surface, the organic content increased as indicated by broader inter-crystalline organic sheets (Figure 5J) and the gradual broadening of the organic-rich annual growth bands (Figure 5J). This organic enrichment at the shell periphery may have further contributed to the toughness of the shell and could also have provided better protection against shell dissolution. However, porewaters of anoxic sediments are demonstrably buffered, and the pH value rarely drops below 7 (Ben-Yaakov, 1973; Bonaglia et al., 2019). An alternative explanation for higher organic content in shell portions closer to the periostracum is improved resistance against microbial attack. While increased amounts of organics can attract microorganisms resulting in even stronger bioerosion of the shell, in dys/anoxic sediments—which exist at Mecklenburg Bight—the rate of microbial decomposition of organic compounds is strongly reduced relative to a setting where the upper few centimeters of the sediment are well-oxygenated (cf. Hedges and Keil, 1995; Hartnett et al., 1998; Jessen et al., 2017) like at the study site at NE Iceland so that an organic-rich outer rim may still have fulfilled its task as an efficient physical barrier against predation.
The larger proportion of organic matrix relative to CaCO3 in ocean quahogs from the Baltic Sea can be explained by generally smaller BMUs resulting from overall slower shell growth rates and lower metabolic rates (Strahl et al., 2011). A. islandica from localities outside the Baltic Sea not only grew considerably faster (Supplementary Figure 6; Supplementary Table 1) but also produced larger BMUs, specifically in warmer, food-rich water (Höche et al., 2021; Höche et al., 2022a). In the Baltic Sea, however, the positive correlation between BMU size and temperature or food supply seems to have been offset by the negative effects of persistently reduced salinity (and episodically recurring severe oxygen depletion) on shell growth rate. For the stenohaline A. islandica, lowered salinity (in particular below 15) exerts physiological stress that demonstrably leads to slower shell growth (Hiebenthal et al., 2012). While salinity at the study site (approx. 15 to 25) remained within the physiological tolerance of that species (Oeschger and Storey, 1993; Cargnelli, 1999), the osmotic stress may have triggered the rerouting of energy to maintain cellular homeostasis (e.g., osmoregulation; Hiebenthal et al., 2012) instead of supporting shell formation. Alternatively or in addition to that, low salinity demonstrably limits calcification due to increasing energetic requirements (Sanders et al., 2018) for the uptake and transport of calcium and bicarbonate ions across mantle epithelia toward the site of biomineralization and proton removal from the biomineralization front, as well as the catalytic conversion of metabolic CO2 into HCO3– by means of carbonic anhydrase (Marin et al., 2012; Sanders et al., 2018). Furthermore, with declining salinity, HCO3– and, more importantly, the Ca2+ concentration decrease, which can impede calcification. For Mytilus spp., a lower salinity threshold of 11 has been reported for calcification (Sanders et al., 2021). Assuming that the production of organic matrices proceeded at nearly similar rates, the reduced production of the mineral phase led to smaller BMUs and a higher proportion of organics vs. CaCO3 in A. islandica.
5 Summary and conclusions
Manganese-rich disturbance lines in shells of A. islandica can serve as a proxy to track past deoxygenation events. Based on their distinctive microstructure (fine complex crossed lamellae instead of irregular simple prisms), these growth patterns can be confidently distinguished from periodic annual growth lines. While the regular occurrence during times of seasonal oxygen depletion and eventually hypoxia in bottom waters and the concomitant increase in Mn/Cashell values suggest a causal link between disturbed shell growth and limited oxygen availability, it currently remains unknown if strong oxygen depletion leads to microstructurally distinct disturbance lines that differ from those caused by other environmental stressors. At least in the studied specimens, extremely low temperature, salinity close to the lower physiological tolerance, and food scarcity did not cause the formation of disturbance lines.
With increasing oxygen deficiency, the disturbance lines became more prominent, contained more manganese, and consisted of increasingly smaller and more elongated individual biomineral units with a larger perimeter-to-area ratio. Although the relationship between DO and BMU size or elongation was statistically significant, the explained variability (<1.5%) was too small and the error too large to reconstruct absolute DO values. BMU parameters may reveal a closer relationship with DO concentration if studied in three dimensions, something that future work should address. For a quantitative reconstruction of dissolved oxygen, it will also be necessary to measure the DO content directly at the sediment–water interface, i.e., the very position at which the bivalves lived and inhaled water. In the present study, we compared BMU parameters to DO measurements completed 5 m above the substrate assuming that disturbance lines started to form as soon as the lower DO threshold was reached at which the metabolic rate (as well as the biomineralization rate) of A. islandica decreases sharply, i.e., below 45 µmol/L (≡ 5 kPa, 0.43 mL/L or 1.62 mg/L; Strahl et al., 2011). Under anoxic and euxinic conditions (Oeschger, 1990), the bivalves demonstrably cease shell formation, close their valves, and switch to anaerobic metabolism (Crenshaw and Neff, 1969) that eventually results in the dissolution of inner shell surfaces (Crenshaw and Neff, 1969; Crenshaw, 1972; Oeschger, 1990) and extremely thin shells (Schöne, 2013). Baltic Sea bivalves still have tough and resistant shells because they contain a much larger proportion of organics than specimens from normal marine and well-oxygenated sites. This surplus of organics increases the elastic modulus and presumably relates at large to limited access to Ca2+ in the hyposaline environment (Sanders et al., 2021).
Future studies should further explore the potential of BMU analyses to obtain quantitative data on DO or other environmental parameters.
Data availability statement
The datasets presented in this study can be found in online repositories. The names of the repository/repositories and accession number(s) can be found below: http://doi.org/10.5281/zenodo.7404135.
Ethics statement
Ethical review and approval were not required for the study on non-cephalopod mollusks in accordance with the local legislation in Germany and institutional requirements.
Author contributions
Conceptualization: BS. Data curation: NH. Formal analysis: NH, XH, and BS. Funding acquisition: BS. Investigation: NH and BS. Methodology: NH and BS. Project administration: BS. Resources: MZ and BS. Supervision: BS. Validation: NH and BS. Visualization: NH and BS. Writing – original draft: NH and BS. Writing – review & editing: NH, XH, MZ, and BS. All authors contributed to the article and approved the submitted version.
Funding
BRS, SCHO793/22-1 and SCHO793/23-1, German Research Foundation, https://www.dfg.de/; The funders had no role in study design, data collection and analysis, decision to publish, or preparation of the manuscript.
Acknowledgments
We are indebted to Heye Rumohr (†), Wolfgang Dreyer (†), Alda Möller, and Ronald Janssen for providing additional samples used to assess locality-specific differences in shell growth rate. We thank Alexander Darr for leading the research cruise during which Baltic Sea shells were collected. We gratefully acknowledge the help of Siggeir Stefánsson and Þorgrímur Kjartansson during fieldwork in Iceland and the acquisition of living bivalves.
Conflict of interest
The authors declare that the research was conducted in the absence of any commercial or financial relationships that could be construed as a potential conflict of interest.
Publisher’s note
All claims expressed in this article are solely those of the authors and do not necessarily represent those of their affiliated organizations, or those of the publisher, the editors and the reviewers. Any product that may be evaluated in this article, or claim that may be made by its manufacturer, is not guaranteed or endorsed by the publisher.
Supplementary material
The Supplementary Material for this article can be found online at: https://www.frontiersin.org/articles/10.3389/fmars.2023.1219716/full#supplementary-material
References
Andrén E., Andrén T., Kunzendorf H. (2000). Holocene history of the Baltic Sea as a background for assessing records of human impact in the sediments of the Gotland Basin. Holocene 10, 687–702. doi: 10.1191/09596830094944
Arntz W. E., Weber W. (1970). Cyprina islandica L. (Mollusca, Bivalvia) als Nahrung von Dorsch und Kliesche in der Kieler Bucht. Ber. Dt. Wiss. Komm. Meeresforsch. 21, 193–209.
Ballesta-Artero I., Zhao L., Milano S., Mertz-Kraus R., Schöne B. R., van der Meer J., et al. (2018). Environmental and biological factors influencing trace elemental and microstructural properties of Arctica islandica shells. Sci. Total Environ. 645, 913–923. doi: 10.1016/j.scitotenv.2018.07.116
Balzer W. (1982). On the distribution of iron and manganese at the sediment/water interface: thermodynamic versus kinetic control. Geochim. Cosmochim. Acta 46, 1153–1161. doi: 10.1016/0016-7037(82)90001-1
Belding D. L. (1910). A report upon the scallop fishery of Massachusetts: Including the habits, life history of Pecten irradians, its rate of growth, and other facts of economic value (Boston, MA, USA: Wright & Potter), 155 pp.
Ben-Yaakov S. (1973). pH buffering of pore water of recent anoxic marine sediments. Limnol. Oceanogr. 18, 86–94. doi: 10.4319/lo.1973.18.1.0086
Berg S., Kutra D., Kroeger T., Straehle C. N., Kausler B. X., Haubold C., et al. (2019). ilastik: interactive machine learning for (bio)image analysis. Nat. Meth. 16, 1226–1232. doi: 10.1038/s41592-019-0582-9
Bevelander G., Nakahara H. (1980). “Compartment and envelope formation in the process of biological mineralization,” in The mechanisms of biomineralization in animals and plants. Eds. Ōmori M., Watabe N. (Kanagawa, Japan: Tokai University Press), 19–27.
Bonaglia S., Marzocchi U., Ekeroth N., Brüchert V., Blomqvist S., Hall P. O. (2019). Sulfide oxidation in deep Baltic Sea sediments upon oxygenation and colonization by macrofauna. Mar. Biol. 166, 1–12. doi: 10.1007/s00227-019-3597-y
Butler P. G., Wanamaker A. D., Scourse J. D., Richardson C. A., Reynolds D. J. (2013). Variability of marine climate on the North Icelandic Shelf in a 1357-year proxy archive based on growth increments in the bivalve Arctica islandica. Palaeogeogr. Palaeoclimatol. Palaeoecol. 373, 141–151. doi: 10.1016/j.palaeo.2012.01.016
Caballero-Alfonso A. M., Carstensen J., Conley D. J. (2015). Biogeochemical and environmental drivers of coastal hypoxia. J. Mar. Syst. 141, 190–199. doi: 10.1016/j.jmarsys.2014.04.008
Cardoso J. F. M. F., Nieuwland G., Witbaard R., van der Veer H. W., MaChado J. P. (2013). Growth increment periodicity in the shell of the razor clam Ensis directus using stable isotopes as a method to validate age. Biogeosci 10, 4741–4750. doi: 10.5194/bg-10-4741-2013
Cargnelli L. M. (1999). Essential fish habitat source document. Ocean quahog, Arctica islandica, life history and habitat characteristic. NOAA Technical Memorandum NMFS-NE 148, 1–12. Available at: https://repository.library.noaa.gov/view/noaa/3153.
Carré M., Bentaleb I., Bruguier O., Ordinola E., Barrett N. T., Fontugne M. (2006). Calcification rate influence on trace element concentrations in aragonitic bivalve shells: evidences and mechanisms. Geochim. Cosmochim. Acta 70, 4906–4920. doi: 10.1016/j.gca.2006.07.019
Carstensen J., Andersen J. H., Gustafsson B. G., Conley D. J. (2014a). Deoxygenation of the Baltic Sea during the last century. Proc. Natl. Acad. Sci. 111, 5628–5633. doi: 10.1073/pnas.1323156111
Carstensen J., Conley D. J. (2019). Baltic Sea hypoxia takes many shapes and sizes. Limnol. Oceanogr. Bull. 28, 125–129. doi: 10.1002/lob.10350
Carstensen J., Conley D. J., Bonsdorff E., Gustafsson B. G., Hietanen S., Janas, et al. (2014b). Hypoxia in the Baltic Sea: biogeochemical cycles, benthic fauna, and management. Ambio 43, 26–36. doi: 10.1007/s13280-013-0474-7
Checa A. G. (2018). Physical and biological determinants of the fabrication of molluscan shell microstructures. Front. Mar. Sci. 5. doi: 10.3389/fmars.2018.00353
Chen P.-Y., Lin A. Y. M., Lin Y.-S., Seki Y., Stokes A. G., Peyras J., et al. (2008). Structure and mechanical properties of selected biological materials. J. Mech. Behav. Biomed. Mater. 1, 208–226. doi: 10.1016/j.jmbbm.2008.02.003
Clark G. R. (1974). Growth lines in invertebrate skeletons. Annu. Rev. Earth Planet. Sci. 2, 77–99. doi: 10.1146/annurev.ea.02.050174.000453
Conley D. J., Björck S., Bonsdorff E., Carstensen J., Destouni G., Gustafsson B. G., et al. (2009). Hypoxia-related processes in the Baltic sea. Environ. Sci. Technol. 43, 3412–3420. doi: 10.1021/es802762a
Conley D. J., Carstensen J., Ærtebjerg G., Christensen P. B., Dalsgaard T., Hansen J. L., et al. (2007). Long-term changes and impacts of hypoxia in Danish coastal waters. Ecol. Appl. 17, S165–S184. doi: 10.1890/05-0766.1
Crenshaw M. A. (1972). The inorganic composition of molluscan extrapallial fluid. Biol. Bull. 143, 506–512. doi: 10.2307/1540180
Crenshaw M. A. (1980). “Mechanisms of shell formation and dissolution,” in Skeletal growth of aquatic organisms. Eds. Rhoads D. C., Lutz R. A. (New York + London: Plenum Press), 115–132. doi: 10.1007/978-1-4899-4995-0_4
Crenshaw M. A., Neff J. M. (1969). Decalcification at the mantle-shell interface in molluscs. Am. Zool. 9, 881–885. doi: 10.1093/icb/9.3.881
Darr A., Gogina M., Zettler M. L. (2014). Detecting hot-spots of bivalve biomass in the south-western Baltic Sea. J. Mar. Syst. 134, 69–80. doi: 10.1016/j.jmarsys.2014.03.003
Dries R. R., Theede H. (1974). Resistance to oxygen deficiency in marine bottom invertebrates of western Baltic Sea. Mar. Biol. 25, 327–333. doi: 10.1007/BF00404975
Dunca E., Mutvei H., Goransson P., Morth C.-M., Schöne B. R., Whitehouse M. J., et al. (2009). Using ocean quahog (Arctica islandica) shells to reconstruct palaeoenvironment in Öresund, Kattegat and Skagerrak, Sweden. Int. J. Earth Sci. 98, 3–17. doi: 10.1007/s00531-008-0348-6
Edge D. C., Reynolds D. J., Wanamaker A. D., Griffin D., Bureau D., Outridge C., et al. (2021). A multicentennial proxy record of Northeast Pacific sea surface temperatures from the annual growth increments of Panopea generosa. Paleoceanogr. Paleoclimatol. 36, e2021PA004291. doi: 10.1029/2021PA004291
Epstein S., Lowenstam H. A. (1953). Temperature-shell-growth relations of recent and interglacial Pleistocene shoal-water biota from Bermuda. J. Geol. 61, 424–438. doi: 10.1086/626110
Fennel K., Testa J. M. (2019). Biogeochemical controls on coastal hypoxia. Annu. Rev. Mar. Sci. 11, 105–130. doi: 10.1146/annurev-marine-010318-095138
Filipsson H. L., Nordberg K. (2004). A 200-year environmental record of a low-oxygen fjord, Sweden, elucidated by benthic foraminifera, sediment characteristics and hydrographic data. J. Foraminifer. Res. 34, 277–293. doi: 10.2113/34.4.277
Gaillard F., Reynaud T., Thierry V., Kolodziejczyk N., von Schuckmann K. (2016). In situ–based reanalysis of the global ocean temperature and salinity with ISAS: variability of the heat content and steric height. J. Clim. 29, 1305–1323. doi: 10.1175/JCLI-D-15-0028.1
Gaspar M. B., Richardson C. A., Monteiro C. C. (1994). The effects of dredging on shell formation in the razor clam Ensis siliqua from Barrinha, southern Portugal. J. Mar. Biol. Assoc. U. K. 74, 927–938. doi: 10.1017/S0025315400090159
Hanna E., Jónsson T., Ólafsson J., Valdimarsson H. (2006). Icelandic coastal sea surface temperature records constructed: putting the pulse on air–sea–climate interactions in the northern North Atlantic. Part I: comparison with HadISST1 open-ocean surface temperatures and preliminary analysis of long-term patterns and anomalies of SSTs around Iceland. J. Clim. 19, 5652–5666. doi: 10.1175/JCLI3933.1
Hartnett H. E., Keil R. G., Hedges J. I., Devol A. H. (1998). Influence of oxygen exposure time on organic carbon preservation in continental margin sediments. Nature 391, 572–575. doi: 10.1038/35351
Hedges J. I., Keil R. G. (1995). Sedimentary organic matter preservation: an assessment and speculative synthesis. Mar. Chem. 49, 81–115. doi: 10.1016/0304-4203(95)00008-F
Hem J. D. (1963). Chemical equilibria and rates of manganese oxidation. US Geol. Surv. Water Supply Pap. 1667, A1–A64. doi: 10.3133/wsp1667A
Herreid C. F. (1980). Hypoxia in invertebrates. Comp. Biochem. Physiol. A Physiol. 67, 311–320. doi: 10.1016/S0300-9629(80)80002-8
Hiebenthal C., Philipp E. E. R., Eisenhauer A., Wahl M. (2012). Interactive effects of temperature and salinity on shell formation and general condition in Baltic Sea Mytilus edulis and Arctica islandica. Aquat. Biol. 14, 289–298. doi: 10.3354/ab00405
Höche N., Walliser E. O., Schöne B. R. (2022a). Microstructural mapping of Arctica islandica shells reveals environmental and physiological controls on biomineral size. Front. Earth Sci. 9. doi: 10.3389/feart.2021.781305
Höche N., Walliser E. O., Winter N. J., Witbaard R., Schöne B. R. (2021). Temperature-induced microstructural changes in shells of laboratory-grown Arctica islandica (Bivalvia). PloS One 16, e0247968. doi: 10.1371/journal.pone.0247968
Höche N., Zettler M. L., Huang X., Schöne B. R. (2022b). Data for “Shell microstructures (disturbance lines) of Arctica islandica – A potential proxy for severe oxygen depletion” (Meyrin, Switzerland: CERN & Society Foundation). doi: 10.5281/zenodo.7404135
Howes B., Mehra A., Maloof A. (2021). Three-dimensional morphometry of ooids in oolites: a new tool for more accurate and precise paleoenvironmental interpretation. J. Geophys. Res. Earth Surf 126, e2020JF005601. doi: 10.1029/2020JF005601
Jessen G. L., Lichtschlag A., Ramette A., Pantoja S., Rossel P. E., Schubert C. J., et al. (2017). Hypoxia causes preservation of labile organic matter and changes seafloor microbial community composition (Black Sea). Sci. Adv. 3, e1601897. doi: 10.1126/sciadv.1601897
Jilbert T., Slomp C. P. (2013). Rapid high-amplitude variability in Baltic Sea hypoxia during the Holocene. Geology 41, 1183–1186. doi: 10.1130/G34804.1
Jones D. S. (1980). Annual cycle of shell growth increment formation in two continental shelf bivalves and its paleoecologic significance. Paleobiol. 6, 331–340. doi: 10.1017/S0094837300006837
Jones D. S., Arthur M. A., Allard D. J. (1989). Sclerochronological records of temperature and growth from shells of Mercenaria mercenaria from Narragansett Bay, Rhode Island. Mar. Biol. 102, 225–234. doi: 10.1007/BF00428284
Karlson K., Rosenberg R., Bonsdorff E. (2002). Temporal and spatial large-scale effects of eutrophication and oxygen deficiency on benthic fauna in Scandinavian and Baltic waters: a review. Oceanogr. Mar. Biol. Annu. Rev. 40, 427–489. doi: 10.1201/9780203180594
Karney G. B., Butler P. H., Speller S., Scourse J. D., Richardson C. A., Schröder M., et al. (2012). Characterizing the microstructure of Arctica islandica shells using NanoSIMS and EBSD. Geochem. Geophys. Geosyst. 13, Q04002. doi: 10.1029/2011GC003961
Kennish M. J., Loveland R. E. (1980). Growth models of the northern quahog, Mercenaria mercenaria (Linné). Proc. Natl. Shellfish. Assoc. 70, 230–239. Available at: https://www.biodiversitylibrary.org/item/41037#page/3/mode/1up.
Kennish M. J., Olsson R. K. (1975). Effects of thermal discharges on the microstructural growth of Mercenaria mercenaria. Environ. Geol 1, 44–64. doi: 10.1007/BF02426940
Kremling K., Petersen H. (1978). The distribution of Mn, Fe, Zn, Cd and Cu in Baltic seawater; a study on the basis of one anchor station. Mar. Chem. 6, 155–170. doi: 10.1016/0304-4203(78)90025-7
Kremling K., Tokos J. J. S., Brügmann L., Hansen H.-P. (1997). Variability of dissolved and particulate trace metals in the Kiel and Mecklenburg bights of the Baltic Sea 1990–1992. Mar. Pollut. Bull. 34, 112–122. doi: 10.1016/S0025-326X(96)00060-4
Langlet D., Alleman L. Y., Plisnier P.-D., Hughes H., André L. (2007). Manganese content records seasonal upwelling in Lake Tanganyika mussels. Biogeosci. 4, 195–203. doi: 10.5194/bg-4-195-2007
Leibnitz-Institut für Ostseeforschung Warnemünde. (2021). ODIN 2. Available at: https://odin2.io-warnemuende.de/ (Accessed October 18, 2022).
Li L., Weaver J. C., Ortiz C. (2015). Hierarchical structural design for fracture resistance in the shell of the pteropod Clio pyramidata. Nat. Commun. 6, 6216. doi: 10.1038/ncomms7216
Limburg K. E., Olson C., Walther Y., Dale D., Slomp C. P., Høie H. (2011). Tracking Baltic hypoxia and cod migration over millennia with natural tags. Proc. Natl. Acad. Sci. 108, E177–E182. doi: 10.1073/pnas.1100684108
Lohmann G., Schöne B. R. (2013). Climate signatures on decadal to interdecadal time scales as obtained from mollusk shells (Arctica islandica) from Iceland. Palaeogeogr. Palaeoclimatol. Palaeoecol. 373, 152–162. doi: 10.1016/j.palaeo.2012.08.006
Marali S., Schöne B. R. (2015). Oceanographic control on shell growth of Arctica islandica (Bivalvia) in surface waters of Northeast Iceland — Implications for paleoclimate reconstructions. Palaeogeogr. Palaeoclimatol. Palaeoecol. 420, 138–149. doi: 10.1016/j.palaeo.2014.12.016
Marin F., Le Roy N., Marie B. (2012). The formation and mineralization of mollusk shell. Front. Biosci. S4, 1099–1125. doi: 10.2741/s321
Mehra A., Howes B., Manzuk R., Spatzier A., Samuels B. M., Maloof A. C. (2022). A novel technique for producing three-dimensional data using serial sectioning and semi-automatic image classification. Microsc. Microanal. 28, 2020–2035. doi: 10.1017/S1431927622012442
Merril A. S., Chamberlin J. L., Ropes J. W. (1969). “Ocean quahog fishery,” in The encyclopedia of marine resources, vol. 125–129 . Ed. Firth F. E. (New York, USA: Van Nostrand Reinhold Co).
Meyers M. A., Lin A. Y.-M., Chen P.-Y., Muyco J. (2008). Mechanical strength of abalone nacre: role of the soft organic layer. J. Mech. Behav. Biomed. Mater. 1, 76–85. doi: 10.1016/j.jmbbm.2007.03.001
Milano S., Schöne B. R., Witbaard R. (2017). Changes of shell microstructural characteristics of Cerastoderma edule (Bivalvia) — A novel proxy for water temperature. Palaeogeogr. Palaeoclimatol. Palaeoecol. 465, 395–406. doi: 10.1016/j.palaeo.2015.09.051
Oeschger R. (1990). Long-term anaerobiosis in sublittoral marine invertebrates from the Western Baltic Sea: Halicryptus spinulosus (Priapulida), Astarte borealis and Arctica islandica (Bivalvia). Mar. Ecol. Prog. Ser. 59, 133–143. doi: 10.1016/0022-0981(93)90153-F
Oeschger R., Storey K. B. (1993). Impact of anoxia and hydrogen sulphide on the metabolism of Arctica islandica L. (Bivalvia). J. Exp. Mar. Biol. Ecol. 170, 213–226. doi: 10.1016/0022-0981(93)90153-F
Österblom H., Hansson S., Larsson U., Hjerne O., Wulff F., Elmgren R., et al. (2007). Human-induced trophic cascades and ecological regime shifts in the Baltic Sea. Ecosystems 10, 877–889. doi: 10.1007/s10021-007-9069-0
Osterman L. E., Poore R. Z., Swarzenski P. W., Turner R. E. (2005). Reconstructing a 180 yr record of natural and anthropogenic induced low-oxygen conditions from Louisiana continental shelf sediments. Geology 33, 329–332. doi: 10.1130/G21341.1
Pannella G., MacClintock C. (1968). Biological and environmental rhythms reflected in molluscan shell growth. Mem. Paleontol. Soc 2, 64–80. doi: 10.1017/S0022336000061655
Philipp E. E. R., Wessels W., Gruber H., Strahl J., Wagner A. E., Ernst I. M. A., et al. (2012). Gene expression and physiological changes of different populations of the long-lived bivalve Arctica islandica under low oxygen conditions. PloS One 7, e44621. doi: 10.1371/journal.pone.0044621
Ramsay K., Richardson C. A., Kaiser M. J. (2001). Causes of shell scarring in dog cockles Glycymeris glycymeris L. J. Sea Res. 45, 131–139. doi: 10.1016/S1385-1101(01)00050-8
Reynolds D. J., Hall I. R., Slater S. M., Scourse J. D., Halloran P. R., Sayer M. D. J. (2017). Reconstructing past seasonal to multicentennial-scale variability in the NE Atlantic Ocean using the long-lived marine bivalve mollusk Glycymeris glycymeris. Paleoceanogr 32, 1153–1173. doi: 10.1002/2017PA003154
Rue E. L., Smith G. J., Cutter G. A., Bruland K. W. (1997). The response of trace element redox couples to suboxic conditions in the water column. Deep-Sea Res. 44, 113–134. doi: 10.1016/S0967-0637(96)00088-X
Rueden C. T., Schindelin J., Hiner M. C., DeZonia B. E., Walter A. E., Arena E. T., et al. (2017). ImageJ2: ImageJ for the next generation of scientific image data. BMC Bioinf. 18, 529. doi: 10.1186/s12859-017-1934-z
Rumohr H., Krost P. (1991). Experimental evidence of damage to benthos by bottom trawling with special reference to Arctica islandica. Meeresforschung 33, 340–345.
Sanders T., Schmittmann L., Nascimento-Schulze J. C., Melzner F. (2018). High calcification costs limit mussel growth at low salinity. Front. Mar. Sci. 5. doi: 10.3389/fmars.2018.00352
Sanders T., Thomsen J., Müller J. D., Rehder G., Melzner F. (2021). Decoupling salinity and carbonate chemistry: low calcium ion concentration rather than salinity limits calcification in Baltic Sea mussels. Biogeosci 18, 2573–2590. doi: 10.5194/bg-18-2573-2021
Schindelin J., Rueden C. T., Hiner M. C., Eliceiri K. W. (2015). The ImageJ ecosystem: An open platform for biomedical image analysis. Mol. Reprod. Dev. 82, 518–529. doi: 10.1002/mrd.22489
Schneider C. A., Rasband W. S., Eliceiri K. W. (2012). NIH Image to ImageJ: 25 years of image analysis. Nat. Methods 9, 671–675. doi: 10.1038/nmeth.2089
Schöne B. R. (2013). Arctica islandica (Bivalvia): A unique paleoenvironmental archive of the northern North Atlantic Ocean. Glob. Planet. Change 111, 199–225. doi: 10.1016/j.gloplacha.2013.09.013
Schöne B. R., Dunca E., Fiebig J., Pfeiffer M. (2005a). Mutvei’s solution: An ideal agent for resolving microgrowth structures of biogenic carbonates. Palaeogeogr. Palaeoclimatol. Palaeoecol. 228, 149–166. doi: 10.1016/j.palaeo.2005.03.054
Schöne B. R., Fiebig J., Pfeiffer M., Gleβ R., Hickson J., Johnson A. L. A., et al. (2005b). Climate records from a bivalved Methuselah (Arctica islandica, Mollusca; Iceland). Palaeogeogr. Palaeoclimatol. Palaeoecol. 228, 130–148. doi: 10.1016/j.palaeo.2005.03.049
Schöne B. R., Huang X., Jantschke A., Mertz-Kraus R., Zettler M. L. (2022). High-resolution reconstruction of dissolved oxygen levels in the Baltic Sea with bivalves–a multi-species comparison (Arctica islandica, Astarte borealis, Astarte elliptica). Front. Mar. Sci. 442. doi: 10.3389/fmars.2022.820731
Schöne B. R., Huang X., Zettler M. L., Zhao L., Mertz-Kraus R., Jochum K. P., et al. (2021). Mn/Ca in shells of Arctica islandica (Baltic Sea) – A potential proxy for ocean hypoxia? Estuar. Coast. Shelf Sci. 251, 107257. doi: 10.1016/j.ecss.2021.107257
Schöne B. R., Marali S., Jantschke A., Mertz-Kraus R., Butler P. G., Fröhlich L. (2023). Can element chemical impurities in aragonitic shells of marine bivalves serve as proxies for environmental variability? Chem. Geol. 616, 121215. doi: 10.1016/j.chemgeo.2022.121215
Sohlenius G., Emeis K.-C., Andrén E., Andrén T., Kohly A. (2001). Development of anoxia during the Holocene fresh–brackish water transition in the Baltic Sea. Mar. Geol. 177, 221–242. doi: 10.1016/S0025-3227(01)00174-8
Strahl J., Dringen R., Schmidt M. M., Hardenberg S., Abele D. (2011). Metabolic and physiological responses in tissues of the long-lived bivalve Arctica islandica to oxygen deficiency. Comp. Biochem. Physiol. A. Mol. Integr. Physiol. 158, 513–519. doi: 10.1016/j.cbpa.2010.12.015
Taylor A. C., Brand A. R. (1975). Effects of hypoxia and body size on the oxygen consumption of the bivalve Arctica islandica (L.). J. Exp. Mar. Biol. Ecol. 19, 187–196. doi: 10.1016/0022-0981(75)90046-5
Theede H., Ponat A., Hiroki K., Schlieper C. (1969). Studies on the resistance of marine bottom invertebrates to oxygen-deficiency and hydrogen sulphide. Mar. Biol. 2, 325–337. doi: 10.1007/BF00355712
Vaquer-Sunyer R., Duarte C. M. (2008). Thresholds of hypoxia for marine biodiversity. Proc. Natl. Acad. Sci. 105, 15452–15457. doi: 10.1073/pnas.0803833105
Vihtakari M., Renaud P. E., Clarke L. J., Whitehouse M. J., Hop H., Carroll M. L., et al. (2016). Decoding the oxygen isotope signal for seasonal growth patterns in Arctic bivalves. Palaeogeogr. Palaeoclimatol. Palaeoecol. 446, 263–283. doi: 10.1016/j.palaeo.2016.01.008
von Oertzen J. A., Schulz S. (1973). Beitrag zur geographischen Verbreitung und ökologischen Existenz von Bivalviern in der Ostsee. Beitr Meereskd. 32, 75–88.
Wanamaker J. A.D., Butler P. G., Scourse J. D., Heinemeier J., Eiríksson J., Knudsen K. L., et al. (2012). Surface changes in the North Atlantic meridional overturning circulation during the last millennium. Nat. Commun. 3, 1–7. doi: 10.1038/ncomms1901
Wanamaker J. A.D., Heinemeier J., Scourse J. D., Richardson C. A., Butler P. G., Eiríksson J., et al. (2008). Very long-lived mollusks confirm 17th century AD tephra-based radiocarbon reservoir ages for North Icelandic shelf waters. Radiocarbon 50, 399–412. doi: 10.1017/S0033822200053510
Weidman C., Jones G., Lohmann K. C. (1994). The long-lived mollusk Arctica islandica: a new paleoceanographic tool for the reconstruction of bottom temperatures for the continental shelves of the northern-North Atlantic Ocean. J. Geophys. Res. 99, 18305–18314. doi: 10.1029/94JC01882
Westman P., Sohlenius G. (1999). Diatom stratigraphy in five offshore sediment cores from the northwestern Baltic proper implying large scale circulation changes during the last 8500 years. J. Paleolimnol. 22, 53–69. doi: 10.1023/A:1008011511101
Wilbur K. M., Saleuddin A. S. M. (1983). ““Shell Formation,”,” in The Mollusca. Eds. Saleuddin A. S. M., Wilbur K. M. (Toronto, Canada: Academic Press), 235–287. doi: 10.1016/B978-0-12-751404-8.50014-1
Winter J. E. (1970). Filter feeding and food utilization in Arctica islandica L. and Modiolus modiolus L. at different food concentrations. in Marine Food Chains Ed. Steele J. H.. (Edinburgh: Oliver and Boyd), 196–206.
Witbaard R., Duineveld G. C. A., De Wilde P. (1997). A long-term growth record derived from Arctica islandica (Mollusca, Bivalvia) from the Fladen Ground (northern North Sea). J. Mar. Biol. Assoc. U. K. 77, 801–816. doi: 10.1017/S0025315400036201
Witbaard R., Franken R., Visser B. (1998). Growth of juvenile Arctica islandica under experimental conditions. Helgoländer Meeresunters. 51, 417–431. doi: 10.1007/BF02908724
Zettler M. L., Friedland R., Gogina M., Darr A. (2017). Variation in benthic long-term data of transitional waters: Is interpretation more than speculation? PloS One 12, e0175746. doi: 10.1371/journal.pone.0175746
Zettler M. L., Schiedek D., Bobertz B. (2007). Benthic biodiversity indices versus salinity gradient in the southern Baltic Sea. Mar. Pollut. Bull. 55, 258–270. doi: 10.1016/j.marpolbul.2006.08.024
Zhao L., Walliser E. O., Mertz-Kraus R., Schöne B. R. (2017). Unionid shells (Hyriopsis cumingii) record manganese cycling at the sediment-water interface in a shallow eutrophic lake in China (Lake Taihu). Palaeogeogr. Palaeoclimatol. Palaeoecol. 484, 97–108. doi: 10.1016/j.palaeo.2017.03.010
Keywords: ocean quahog, bivalve sclerochronology, disturbance lines, physiological stress, hypoxia, Baltic Sea
Citation: Höche N, Zettler ML, Huang X and Schöne BR (2023) Shell microstructures (disturbance lines) of Arctica islandica (Bivalvia): a potential proxy for severe oxygen depletion. Front. Mar. Sci. 10:1219716. doi: 10.3389/fmars.2023.1219716
Received: 09 May 2023; Accepted: 17 November 2023;
Published: 05 December 2023.
Edited by:
Paul E. Renaud, Akvaplan niva AS, NorwayReviewed by:
Gernot Nehrke, Alfred Wegener Institute Helmholtz Centre for Polar and Marine Research (AWI), GermanyKozue Nishida, University of Tsukuba, Japan
Copyright © 2023 Höche, Zettler, Huang and Schöne. This is an open-access article distributed under the terms of the Creative Commons Attribution License (CC BY). The use, distribution or reproduction in other forums is permitted, provided the original author(s) and the copyright owner(s) are credited and that the original publication in this journal is cited, in accordance with accepted academic practice. No use, distribution or reproduction is permitted which does not comply with these terms.
*Correspondence: Bernd R. Schöne, bernd.schoene@uni-mainz.de; Nils Höche, nhoeche@icloud.com
†These authors have contributed equally to this work