Temporal uncoupling between demographic and genetic metrics in fisheries assessment: the European hake case study
 María Fernández-Míguez
 Alfonso Pita
 Antonio Gómez2‡
  Pablo Presa
- 1Laboratory of Marine Genetic Resources (ReXenMar) Centro de Investigación Mariña (CIM)-Universidade de Vigo, Vigo, Spain
- 2Centro Oceanográfico de Vigo, Instituto Español de Oceanografía - Consejo Superior de Investigaciones Científicas (CSIC), Vigo, Spain
An authentic ecological transition for fisheries sustainability requires the integration of all relevant biological criteria in assessment models. Current analyses aim to dissect the evolution of some demographic and genetic metrics in the overharvested Southern European hake fishery in the last four decades. Demographic data were drawn from the official records of ICES, while genetic data were obtained from a lustrum-based sampling series between 1975 and 2014. Opposite to Non-Adaptive Polymorphic Systems (NAPS) microsatellites, Adaptive Polymorphic Systems (APS) microsatellites succeeded at detecting genetic erosion at the maximum population overharvest in lustrum 1996–2000, a phenomenon also confirmed with the molecular variation of the mtDNA cytochrome b gene. We show that the maximum demographic mortality Z_NSSB (1986–1990) predated both the maximum genetic effective mortality Z_LDNe (1991–1995) as well as the maximum cohort-based mortality (1996–2000). Such temporal uncoupling between demographic and genetic metrics suggests that official cohort analyses are far from assessing the real biological status of the Southern European hake fishery to achieve its sustainability-oriented advice.
Introduction
An authentic ecological transition for fisheries sustainability requires the integration of all relevant biological criteria in assessment models. Irrespective of what the population census size might be, maintaining the maximum amount of genetic variation needs to become a central goal of long-term management plans for fisheries (McNeely et al., 1990). In this regard, the genetic background of a fishery should be assessed at the same level of relevance as biomass, acting as a guarantee of its biological sustainability. Theoretically, a low census size can bear the same amount of genetic variation as a large census size, thus allowing population rebound from a reduced population size, and vice versa, a large census size can bear an extremely low genetic variation after overharvest or natural bottlenecks (Pinsky and Palumbi, 2014; Gurgel et al., 2020). The erosion of genetic diversity in exploited fisheries can be addressed with population metrics drawn from genotyping approaches, such as the genetically effective population size (Ne). The Ne was defined by Wright (1931) to approach the amount of genetic drift in populations with a binomial distribution of progeny numbers, segregated sexes, or fluctuations in population size, and was later extended to populations with overlapping generations. The genetic assessment of a fishery in terms of Ne should comprise measuring the erosion of genetic diversity caused by overfishing and random drift over several generations. In addition, Ne becomes a critical parameter in fishery management for its relationship to fitness risk. While predictions based on Ne equations may prove inaccurate for a number of reasons, e.g., estimates with a large variance and error and approximate formulation for neutral loci (Lande and Barrowclough, 1987), an insufficient number of SNP markers (Barbato et al., 2015), or small samples not covering the whole range of large populations (Santos-del-Blanco et al., 2022), in-silico trials have shown that a loss trend in temporal estimates of Ne is a warning flag of fishing-induced drift (Waples et al., 2008). That drift can bring about collateral effects such as the lack of both adaptive responses to stressful conditions (Bijlsma and Loeschcke, 2012) and low resilience to human pressure (Lopes et al., 2009; Munsch et al., 2022).
Coastal fisheries of the European hake (Merluccius merluccius, Linnaeus, 1758) extend from Mauritania to Iceland and Norway and from the western Mediterranean Sea to the Southern coast of the Black Sea (Lloris et al., 2005). This hake has been exploited since the 18th century and has been heavily harvested over the last three decades (Casey and Pereiro, 1995; ICES, 2009a; ICES, 2009b), which makes one suspect an erosion of its genetic background as well as a rarefaction of its population genetic structure. Namely, the Southern hake stock spanning the Cantabrian Sea and the Atlantic Iberian Peninsula (ICES management Divisions VIIIc and IXa, respectively) is devoid of genetic structuring, as shown by several genetic and geochemical marker types (e.g., Pita et al., 2011; Tanner et al., 2014). Nowadays, the population genetic challenge in this fishery is to manage the post-overharvesting genetic diversity as a precious asset for the sustainability of this fishery. Previous genetic studies on that fishery using microsatellites have shown postharvest erosion in both the genetically effective population size (Ne) (43-fold reduction) and the spawning stock biomass (NSSB, 80% loss) (Pita et al., 2017). Such genetic evaluation pointed out that this stock passed through a genetic bottleneck of Ne ≈ 300 in the early 2000s and rebounded to Ne ≈ 3,200 in 2007. Letting alone the hypothesis of environmental facilitation to explain population growth (Díez et al., 2012), the EU regulatory measures adopted on this fishery seem to have succeeded (EC Reg. No. 2166/2005). However, for Ne to rebound from its historical minimum, both the demographic and genetic enrichment from the neighboring Northern stock, as well as the maintenance of the genetic status above a minimum evolutionary Ne threshold, have presumably played a synergic role in protecting the overfishing resilience of this species (Pita et al., 2017).
A general concern exists about the need for a deeper analytical horizon in fisheries assessment, comprising multiple data sources, long-term data sets, and the incorporation of genetic metrics (Cuéllar-Pinzón et al., 2016). Such an approach should allow us to distinguish meaningful genetic changes from sampling errors and environmental variability (Shapiro and Hofreiter, 2012). For instance, the short-term unpredictability of Ne following the post-overharvesting SSB plateau (Pita et al., 2017) might be reduced by increasing time-point estimates of Ne before and after the postharvesting SSB plateau. The adequate dissection of marker sets such as bulks of microsatellites or SNPs into distinct functional categories, prevents the enforcement of marker types not reflecting the extent of population dynamics processes, i.e., Fossil Adaptive Polymorphic Systems (FAPS) sensu Pita et al. (2022). Provided that the number of alleles per locus markedly outperformed other indicators across multiple in-silico situations, increasing the number of neutral microsatellites and sample number and size seems to dramatically increase power (Hoban et al., 2014). This study aimed to provide a less biased estimation of Ne from the Southern hake stock over four decades (1975–2014) as compared to a previous 7-year sample frame. This timely collection was screened with microsatellite types expected to provide a differential erosion signal caused by overharvesting (Pita et al., 2022). Also, historical records of molecular variation in the mtDNA cytochrome b gene (cyt b) were used as a conservative control under purifying selection (Lundy et al., 1999; Pita et al., 2014). The null hypothesis states that the temporal point where the minimum records of demographic and genetic metrics meet should be roughly the same, e.g., the mortality rate upon the global reproductive census (Z_NSSB), the mortality rate of exploited cohort strata (), and the population genetic effective mortality (Z_LDNe). Because the three metrics are definitively influenced by overfishing, alternate hypotheses suggest that their temporal uncoupling would be due either to methodological constraints or to their sequential interdependence in the time period comprised.
Materials and methods
Sampling and DNA extraction
The sample collection consisted of 295 individuals of Merluccius merluccius from the Southern hake stock, which spans the Cantabrian Sea in northern Iberia (Supplementary TableS1). The sampling range comprised from ICES Subarea VIIIc (San Sebastián, 43°27′00″N–2°00′00″W) to ICES Subarea IXa (La Guardia, 41°55′36.72″N–09°13′53.52″W). Samples were collected during research surveys carried out by the Spanish Institute of Oceanography (IEO) as well as by the authors onboard commercial fishing vessels. Samples from the period 1975 to 1999 consisted of dry-preserved otoliths and samples from the period 2000 to 2014 consisted of gill or muscle tissues preserved in 96% ethanol. DNA extraction from tissue was carried out following the method FENOSALT (Pérez and Presa, 2011), and DNA extraction from otoliths followed protocols previously described (Pita et al., 2016). DNA was stored upon extraction at −20°C in 50 µL TE 1× buffer.
DNA amplification and genotyping
Two microsatellite pentaplexes were PCR-amplified on DNA samples. One pentaplex consisted of five anonymous hake microsatellites, i.e., Mmer-hk3b, Mmer-hk9b, Mmer-hk20, Mmer-hk29, and Mmer-hk34b (Morán et al., 1999), which were coamplified at 55°C and 1.5 mM MgCl2 using 5 pmol of each primer (Supplementary TableS2). The second pentaplex was formed by five EST microsatellites (Mmer-EST_6.3, Mmer-EST_8.1, Mmer-EST_9.4, Mmer-EST_13.1, and Mmer-EST_13.3) as characterized from an Expressed Sequence Tag (ESTs) library of the European hake (Milano et al., 2011; Pita et al., 2022) and coamplified at 59°C and 1.5 mM MgCl2 using 3 pmol per primer. The first pentaplex was mostly (three out of five) composed of Adaptive Polymorphic Systems (APS) microsatellites while the second pentaplex comprised EST microsatellites mostly (four out of five) belonging to the Non-Adaptive Polymorphic Systems (NAPS) type (Pita et al., 2022).
The PCR reaction of 15 µL consisted of 0.2 mM dNTPS, 1× reaction buffer, 0.75 U Taq DNA polymerase (Biotaq, Bioline, Meridian Bioscience, Germany), and 50 ng DNA. The PCR routine set in a Mastercycler Gradient Thermocycler [Eppendorf SE (Germany)] consisted of 5 min at 95°C followed by 40 cycles of 70 s at 95°C, 70 s at the specific annealing temperature, and 80 s at 72°C. A final extension step was held for 20 min at 72°C. Genotyping was performed in an automatic sequencer (Applied Biosystems (USA), ABI PRISM 3130) from the Centre for Scientific and Technological Support to Research [CACTI, Universidade de Vigo (Vigo, Spain)] using 9.5 µL deionized formamide, 0.25 µL DNA from PCR amplicons, and 0.25 µL GeneScan 500 ROX Size Standard. Amplicons were sized with GeneMarker v2.6.0 [SoftGenetics LLC (USA)] and cross-checked in two independent readings.
Statistical analyses of microsatellite markers
Annual samples were grouped per lustrum as well as per decade to allow for a sufficient sample size to achieve meaningful results (Supplementary Table S1). The presence of null alleles was estimated with FreeNA (Chapuis and Estoup, 2007) and with Micro-Checker v2.2.3 (Van Oosterhout et al., 2004) (Supplementary TableS2). The existence of selection signatures on marker polymorphism was tested with BayeScan v2.1 (Foll and Gaggiotti, 2008). Allele frequencies were calculated with GenAlEx v6.5 (Peakall and Smouse, 2006). The Hardy–Weinberg equilibrium (HWE) per sample was tested with Genepop v4.3 (Rousset, 2008) through a Markov chain (MC) algorithm of 20 batches of 5,000 iterations each. The heterozygosity observed (HO) and the one expected (HE) were estimated with Genepop. The program FSTAT v2.9.3 (Goudet, 1995) was applied to estimate basic genetic diversity parameters such as the allelic richness (RS) and the fixation index within samples (FIS) as well as to compare the scores of those parameters among lustrums and among decades using 1,500 permutations. The temporal integrity of the genetic pool under study was assessed with BAPS 6 (Corander et al., 2004), assuming either a mixture model or an admixture model following the recommendations of the manual. The analysis of molecular variance (AMOVA) among hierarchical levels was carried out with Arlequin v3.5 (Excoffier and Lischer, 2010). The FST distance between samples was estimated with FSTAT v2.9.3. and the differentiation parameter DEST (Jost, 2008) was calculated with the R-package DEMEtics v0.8-7 (Gerlach et al., 2010) upon 10,000 iterations. The false discovery rate approach (FDR, Benjamini and Hochberg, 1995) was applied to correct for type I error in multiple test comparisons.
Demographic data from the Southern hake stock was taken from ICES annual reports starting from 1982 (ICES Advice, 2019). The spawning stock biomass (SSB) for lustrum 1976–1980 was replicated from the SSB of 1982, and the SSB for lustrum 1981–1985 was averaged from the period 1982–1985. The population effective genetic size (Ne) was calculated using the linkage disequilibrium method (LDNe) implemented in NeESTIMATOR v2.1 (Do et al., 2014) as a highly sensitive indicator of recent bottlenecks (England et al., 2010). An Approximate Bayesian Computation was used to assess the potential effects of overharvesting pressure on the genetic diversity of the Southern hake stock. Two scenarios were implemented in DIYABC 2.1 (Cornuet et al., 2014), the first one settled a population with equal Ne intervals at times t1 to t8 (10–10,000; lower and upper limits, respectively) and led the algorithm to decide its fluctuation upon observed diversity values; the second one implemented a reduction of Ne from time t3 to time t5 (i.e., between lustrums 1986–1990 and 1996–2000) with an algorithm decision on the maintenance or decrease of Ne along the four decades. The scenarios were evaluated using 100,000 simulated data sets on the prior distribution of parameters. Significant deviations from mutation-drift equilibrium were explored with program BOTTLENECK v1.2.02 (Piry et al., 1999). A linear interpolation of LDNe estimates was applied to the open intervals associated with lustrums 1996–2000 and 2001–2005. The calculation of the census size of the SSB (NSSB) was afforded on both the length-age analytical assessment (GADGET) (ICES, 2014) and the average weight of hakes landed in the sampled years (≈ 2 kg). This latter was calculated as the average of the fresh body weight range 372–4,587 g inferred after the size-weight relationship W = 0.00733L2.981 and the observed range of landing lengths (37.9–88.0 cm) (Piñeiro and Saínza, 2003). The NSSB declined per lustrum (t = 1 time unit) with a variable mortality rate () comprising a constant natural mortality rate (M) and a variable per year fishing mortality rate (F). Thereafter, the total demographic mortality per lustrum () was estimated upon the SSB biomass estimated in the first year of the lustrum () and the SSB biomass estimated in the first year of the subsequent lustrum (), i.e.,
The instantaneous rate of change of the effective population size due to effective mortality is negative and proportional to Ne at a given time point:
and
and integrating between moments t1 and t2 where Ne1 and Ne2 were estimated, respectively,
we have
or
In our case study, a straightforward way to compute the population effective genetic mortality rate (Z_LDNe) from current data employed as the Ne from the previous lustrum and as the Ne from the proper lustrum ), i.e.,
Z_LDNe is defined as the instantaneous rate of effective mortality, i.e., the instantaneous reduction of the dispersion of allele frequencies under random genetic drift as observed in the population under consideration. Intuitively, it measures the reduction of the population effective genetic size LDNe in period t, i.e., between two infinitesimal LDNe moments.
Official annual fishing mortality estimates (F) and the natural mortality rate (M) of 0.4 were taken from ICES (ICES Advice, 2019) as based on the inter-annual analyses of landed cohorts in order to calculate the per lustrum mortality average (). Mortality rates (Z_LDNe, , and ) could not be calculated for the first lustrum (1976-1980) as being dependent on unavailable SSB and Ne from the previous lustrum.
Cytochrome b analyses
The PCR reaction mix for the cyt b gene was prepared in a volume of 25 µL using final concentrations of 2.5 mM MgCl2, 0.3 mM dNTPs, 0.5 mM of each primer, 1.5 U Taq polymerase (Bioline), and 5% BSA. The volume of the DNA template varied on the sample tissue, i.e., 1 µL DNA from gill or muscle and 3 µL DNA from otoliths. The PCR amplification was performed in a 2720 Thermal Cycler (Applied Biosystems) as described in Pérez and Presa (2008) with subtle modifications, i.e., 3 min at 95°C, 40 cycles of 40 s at 94°C, 50 s at 61°C, and 80 s at 72°C, and a final extension step of 10 min at 72°C. The PCR products were purified with Exonuclease I [Thermo Fisher Scientific (USA)] before sequencing in an ABI PRISM 3130 from CACTI facilities (Universidade de Vigo). The sequences of cyt b were first visualized in CHROMAS Version 2.5.1 (http://www.technelysium.com.au/chromas.html) to discard potential errors and subsequently aligned with BioEdit v7.2.5 (Hall, 1999) using the 3′-end of the tRNA-Glu gen. Nucleotide frequencies were estimated in MEGA v6.0 (Tamura et al., 2013). The number of haplotypes, haplotypes, and nucleotide diversities (Nd and Hd), and the number of variable sites were calculated with DnaSP v5.10.01 (Librado and Rozas, 2009).
The temporal homogeneity of the haplotype distribution across lustrum was tested using a Spearman correlation test implemented in IBM SPSS version 23.0 (IBM Corporation). A hierarchical AMOVA was performed on cyt b variation using Arlequin. The molecular relationships between haplotypes were inferred after NETWORK 5.0.0.0 (Bandelt et al., 1999). The demographic history upon cyt b variation was explored using the mismatch distribution on pooled samples per lustrum, using observed versus simulated values under demographic expansion in Arlequin, e.g., unimodal distribution is expected in a population with rapid demographic growth in the recent past (Rogers and Harpending, 1992). In addition, Harpending’s (Harpending, 1994) raggedness index (Hri) and the sum of squared deviations (SSD) as implemented in Arlequin, were used to evaluate Rogers’ (Rogers, 1995) sudden expansion model (Rogers and Harpending, 1992). Further testing for population expansion was assessed through the Fu’s FS test (Fu, 1997) implemented in DnaSP and its statistical significance was calculated after 10,000 replicates of coalescent simulations.
Results
Genetic diversity of microsatellites
No genetic structuring was detected with BAPS within the Southern hake stock between 1975 and 2014 (data not shown). The polymorphism of the anonymous pentaplexed microsatellite set consisted of three APS (Mmer-hk9b, Mmer-hk20, and Mmer-hk34b), one FAPS (Mmer-hk3b), and one NAPS (Mmer-hk29b), therefore mostly composed of highly polymorphic adaptive polymorphisms. Markers Mmer-hk29 and Mmer-EST_9.4 showed signals of null alleles at frequencies higher than 10%, and further analyses were assayed with or without them (Supplementary TableS2). The polymorphism of the EST-microsatellite pentaplex consisted of four NAPS (Mmer-EST_8.1, Mmer-EST_9.4, Mmer-EST_13.1, and Mmer-EST_13.3) and one APS (Mmer-EST_6.3), therefore mostly composed of nonadaptive or neutral polymorphisms.
A total of 186 alleles were observed in the 295 individuals genotyped. The average number of alleles per locus varied between 6.500 ± 0.756 of locus Mmer-EST_8.1 and 28.500 ± 5.014 of locus Mmer-hk9b (Supplementary Table S3). The number of alleles per lustrum was higher (t-student = −7.41, one-tailed p = 2.02 × 10⁻⁵) in the anonymous maker set (77.00 ± 12.35) than in the EST marker set (42.75 ± 4.27). Likewise, the average number of alleles per locus was higher (t-student = −2.18, one-tailed p = 0.047) in the anonymous maker set (17.25 ± 7.64, excluding Mmer-hk3b, which showed signals of non-neutrality) than in the EST marker set (8.55 ± 2.51).
No correlation was observed between the allelic series of both marker sets across lustrums (R2 = 0.0095, F = 0.058, p = 0.818). The highest and lowest average allelic richness (RS) per locus were observed in lustrums 1986–1990 (RS = 7.18 ± 2.40) and 1991–1995 (RS = 6.38 ± 1.74), respectively. The main inflection points were highly influenced by the anonymous marker set whose trend did not correlate with that of EST microsatellites (R2 = 0.017, F = 0.104, p = 0.758) (Figure 1). A significant deficit of heterozygotes was observed in 70% and 60% of loci in lustrums 2001–2005 and 2006–2010, respectively. The two loci showing signals of null alleles (Mmer-hk29 and Mmer-EST_9.4) also showed a deficit of heterozygotes across lustrums.
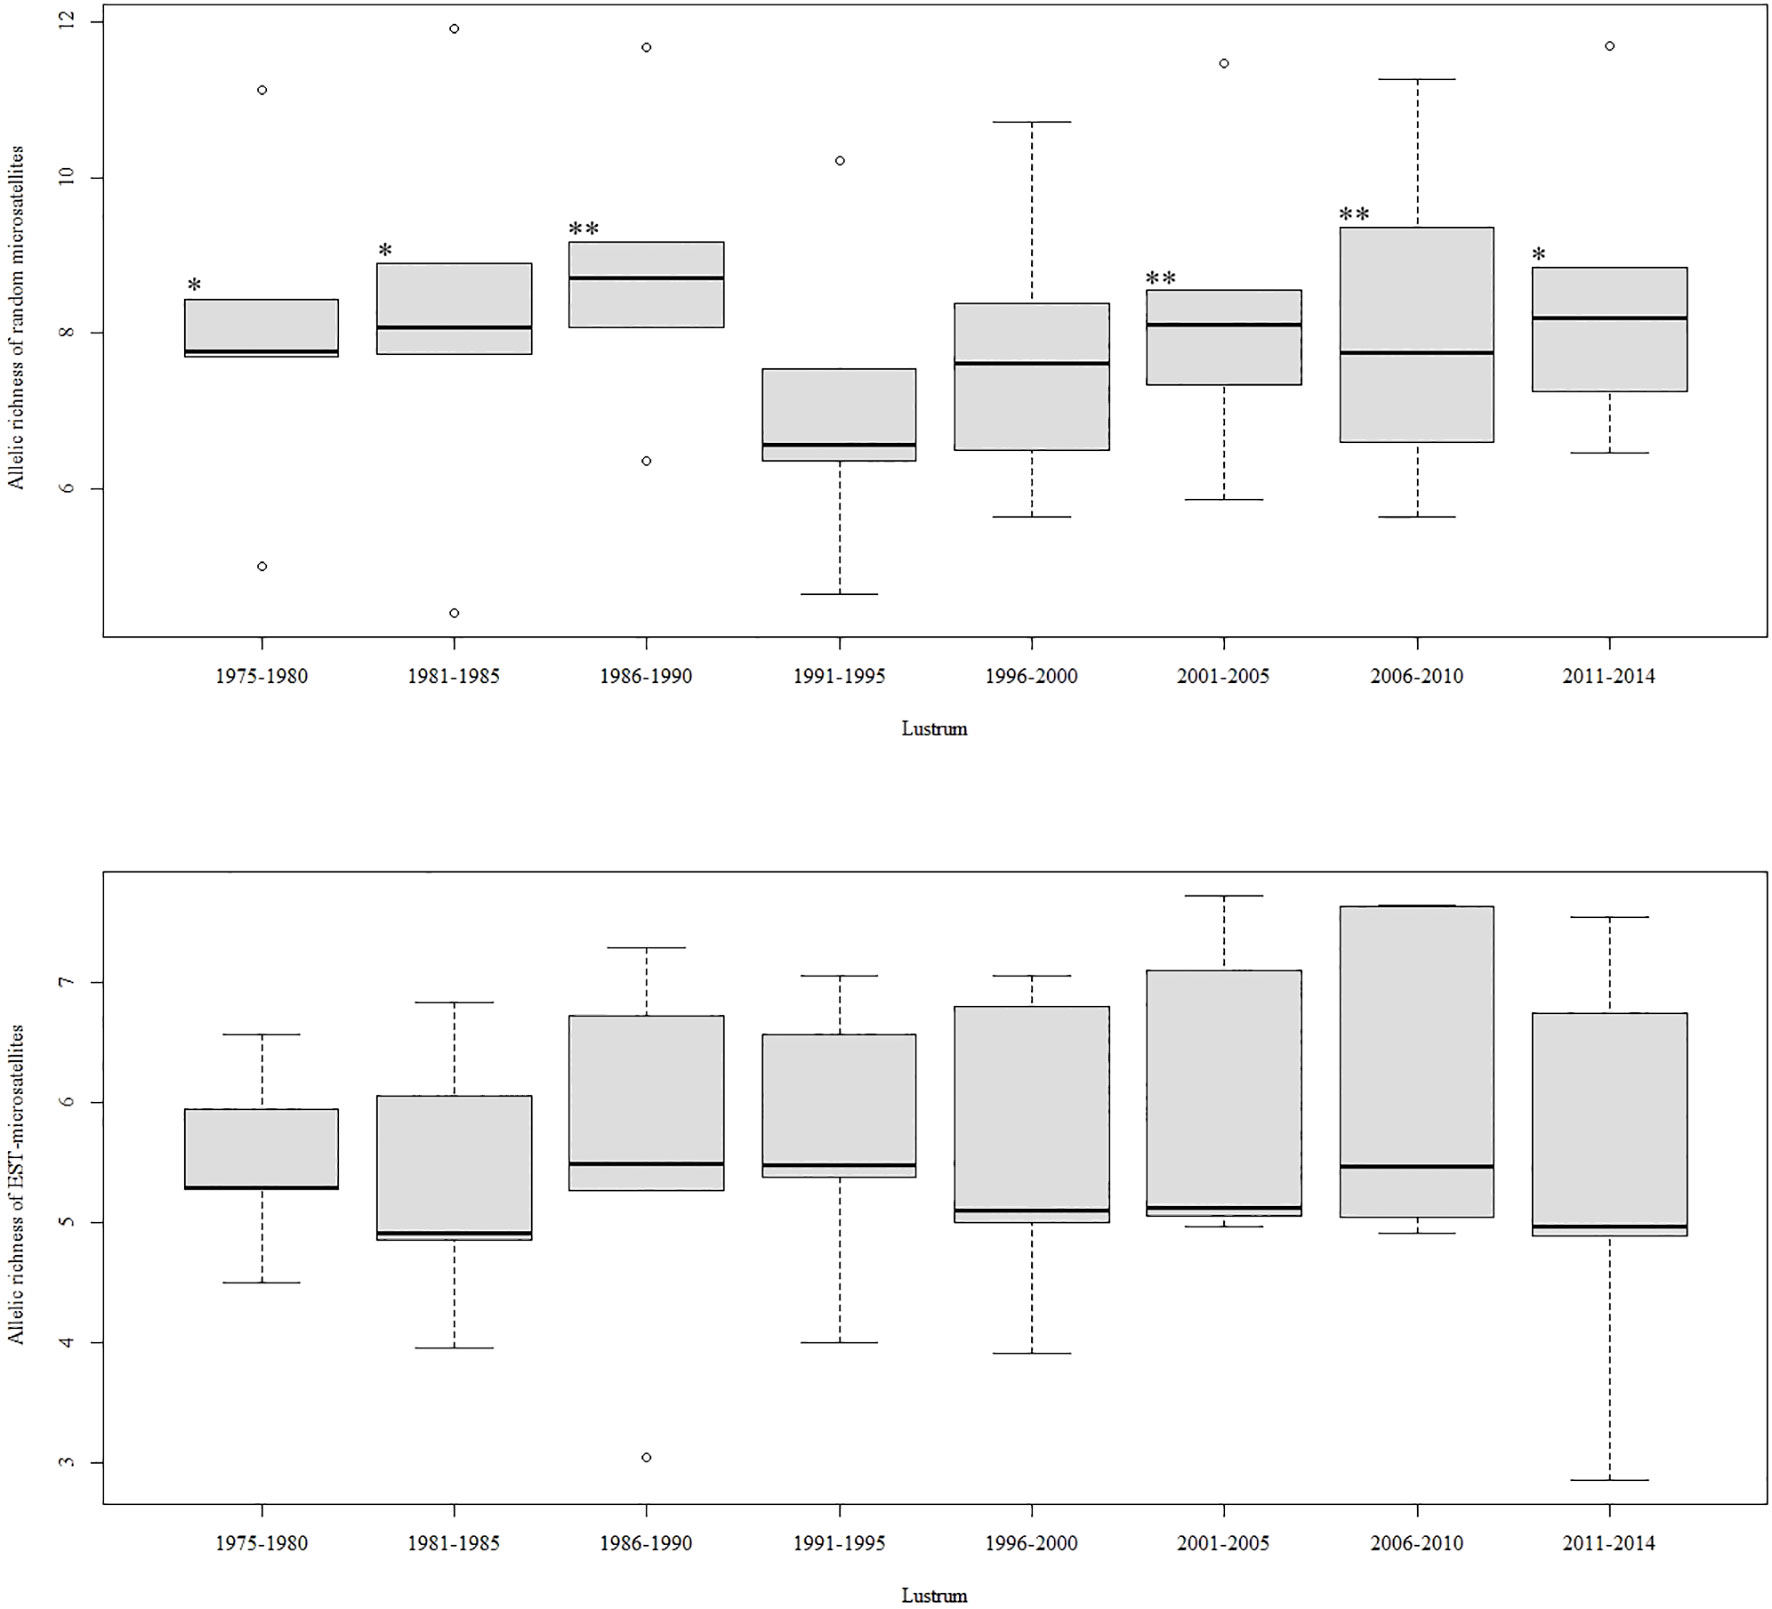
Figure 1 Pairwise comparison of allele richness (Rs) among lustrums for anonymous microsatellites (top) and EST microsatellites (bottom). Significant differences within marker type, between lustrums 1991 and 1995, and the rest are indicated with asterisks (*p< 0.05; **p< 0.01).
Genetic differentiation of microsatellites
The molecular variation of microsatellites was low but significantly distributed among lustrums within decades (Table 1). The genetic distance FST was low (range, 0.000–0.016) and nonsignificant between lustrums (Table 2). The genetic differentiation DEST differed significantly in all pairwise comparisons involving lustrum 1991–1995 as well as in three pairs involving lustrum 2011–2014. The accumulated estimate of the fixation index (FST) differed by one order of magnitude from the genetic differentiation per lustrum DEST (Supplementary FigureS1). Both estimates showed quasi-parallel distributions and a maximum divergence among lustrums in 1991–1995. The correlation between both statistics was significant as per lustrum basis (Y = 5.002X + 0.032; R2 = 0.706; F = 62.582; p< 0.001) but not significant as per decade basis (Y = 2.7961X + 0.0192; R2 = 0.799; F = 15.907; p = 0.016).
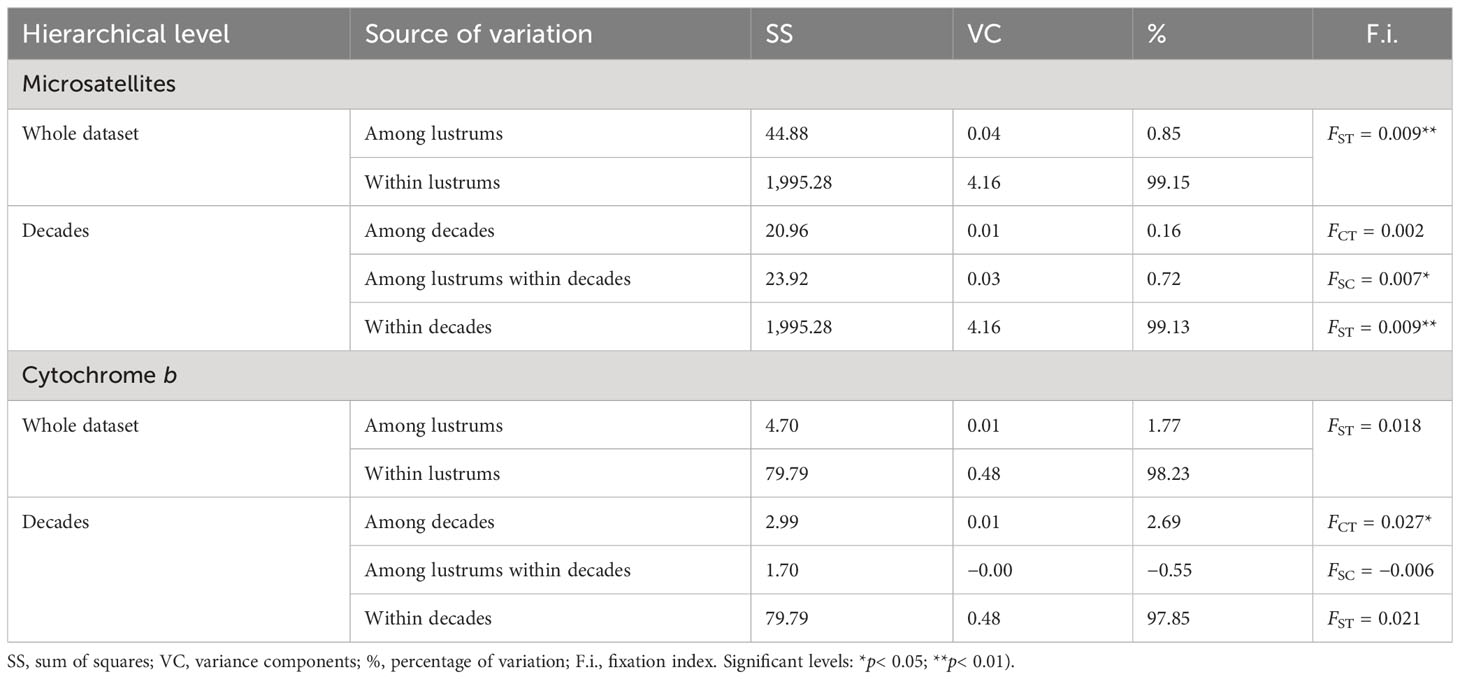
Table 1 Hierarchical locus by locus analysis of molecular variance (AMOVA) on 295 individuals from eight lustrums of the Southern hake stock.
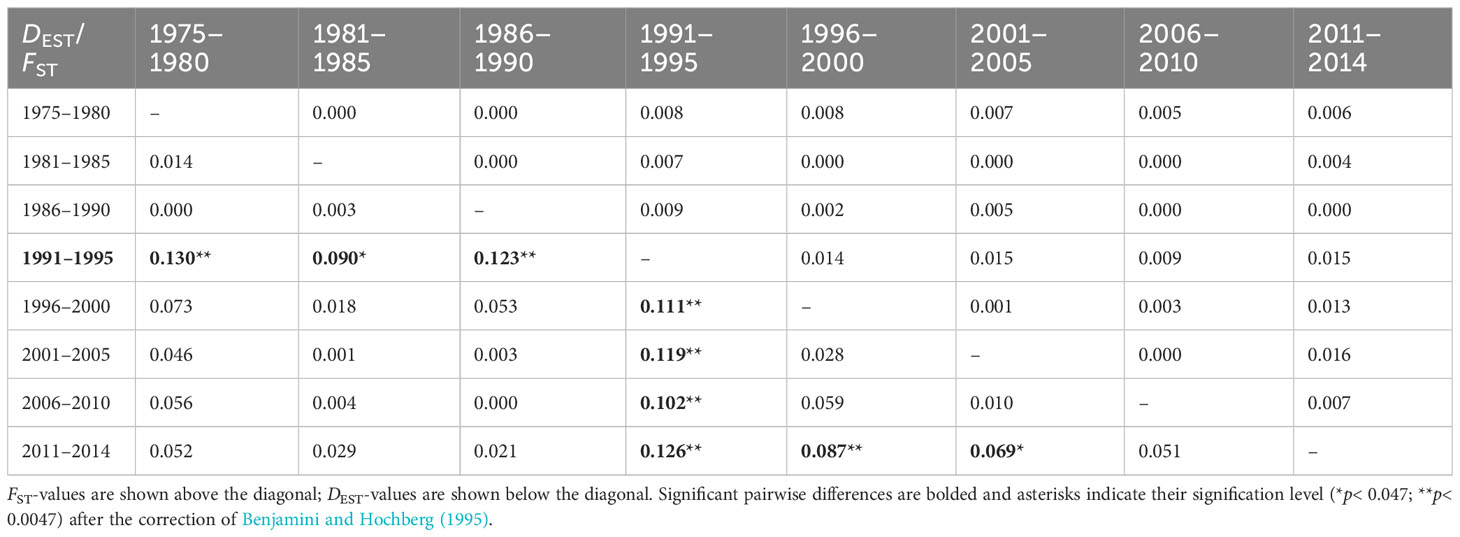
Table 2 Pairwise values of genetic differentiation among lustrums.
Effective population genetic size and demography
Estimates of demographic parameters per lustrum upon official SSB data (ICES Advice, 2019) showed a minimum NSSB in lustrum 1996–2000, when the official mortality rate per lustrum was maximal (Table 3). The relative LDNe size and the ratio LDNe/ were minimal in lustrum 1991–1995 when the estimated population effective genetic mortality rate Z_LDNe was maximal. The highest mortality rate calculated after the survival equation occurred in lustrum 1986–1990. The SSB curve adjusted significantly to a polynomic regression (R2 = 0.9027, F = 23.1870, p = 0.003), and the temporal trends of NSSB and LDNe did not correlate to each other, e.g., the minimum LDNe was in lustrum 1991–1995 and predated the minimum NSSB in 1996–2000 (Figure 2). The three mortality rates were temporarily uncoupled, e.g., was maximal in lustrum 1996–2000 when Z_NSSB was null and Z_LDNe reached its minimum (Figure 3). The global mortality rate of the population as well as the population effective genetic mortality rate Z_LDNe were negative from 1996 to 2010, while cohort-based mortality was always above 0.82. The approximate Bayesian computation observed in both scenarios, but mainly in the second one (i.e., using the inferior limit of observed Ne intervals) suggested a population contraction between lustrum 3 (1986–1990, Ne = 5,270) and lustrum 4 (1991–1995, Ne = 994) and a population expansion flanking such an interval (Figure 4).
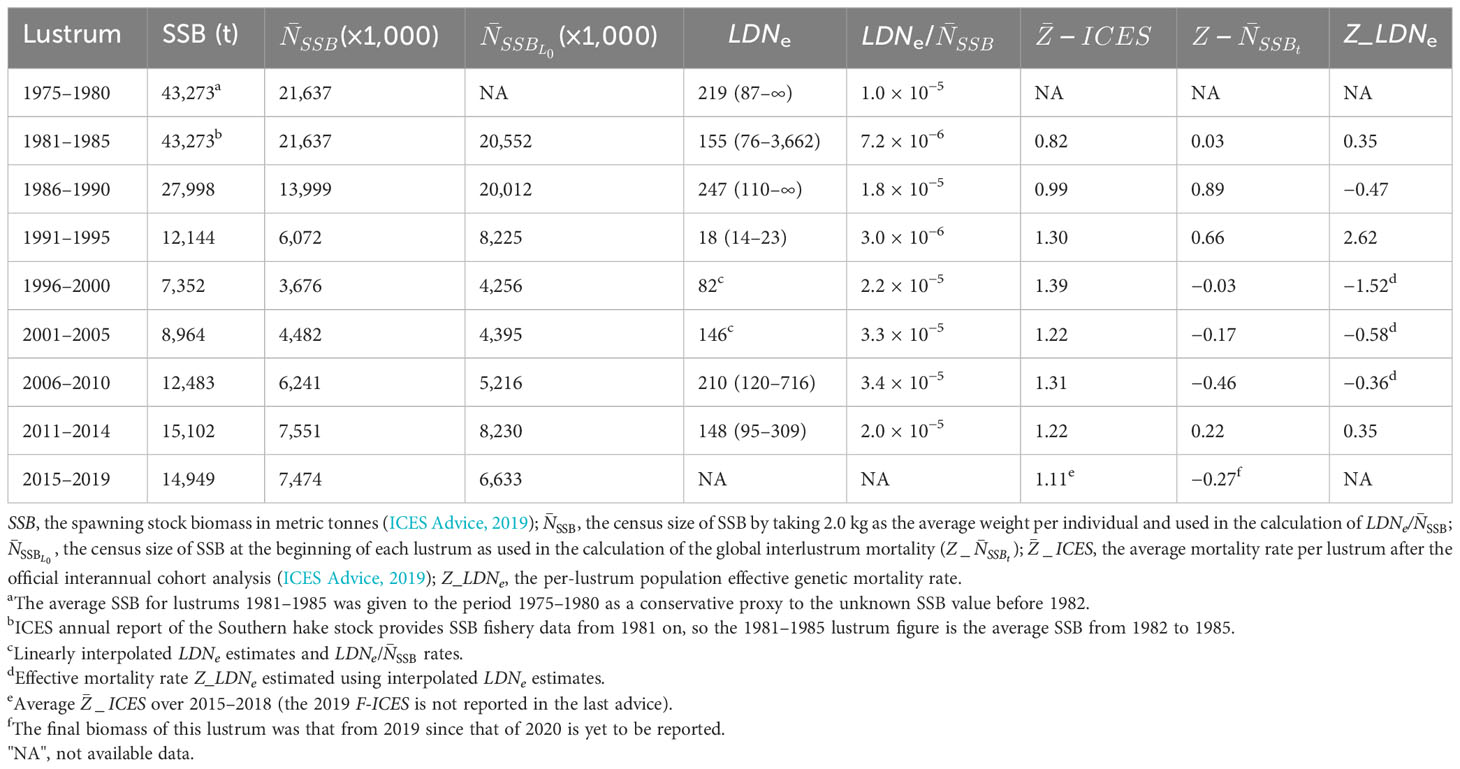
Table 3 Estimates of the population effective genetic size LDNe per lustrum using the linkage disequilibrium method (Waples and Do, 2010) and several mortality rates of the Southern hake stock.
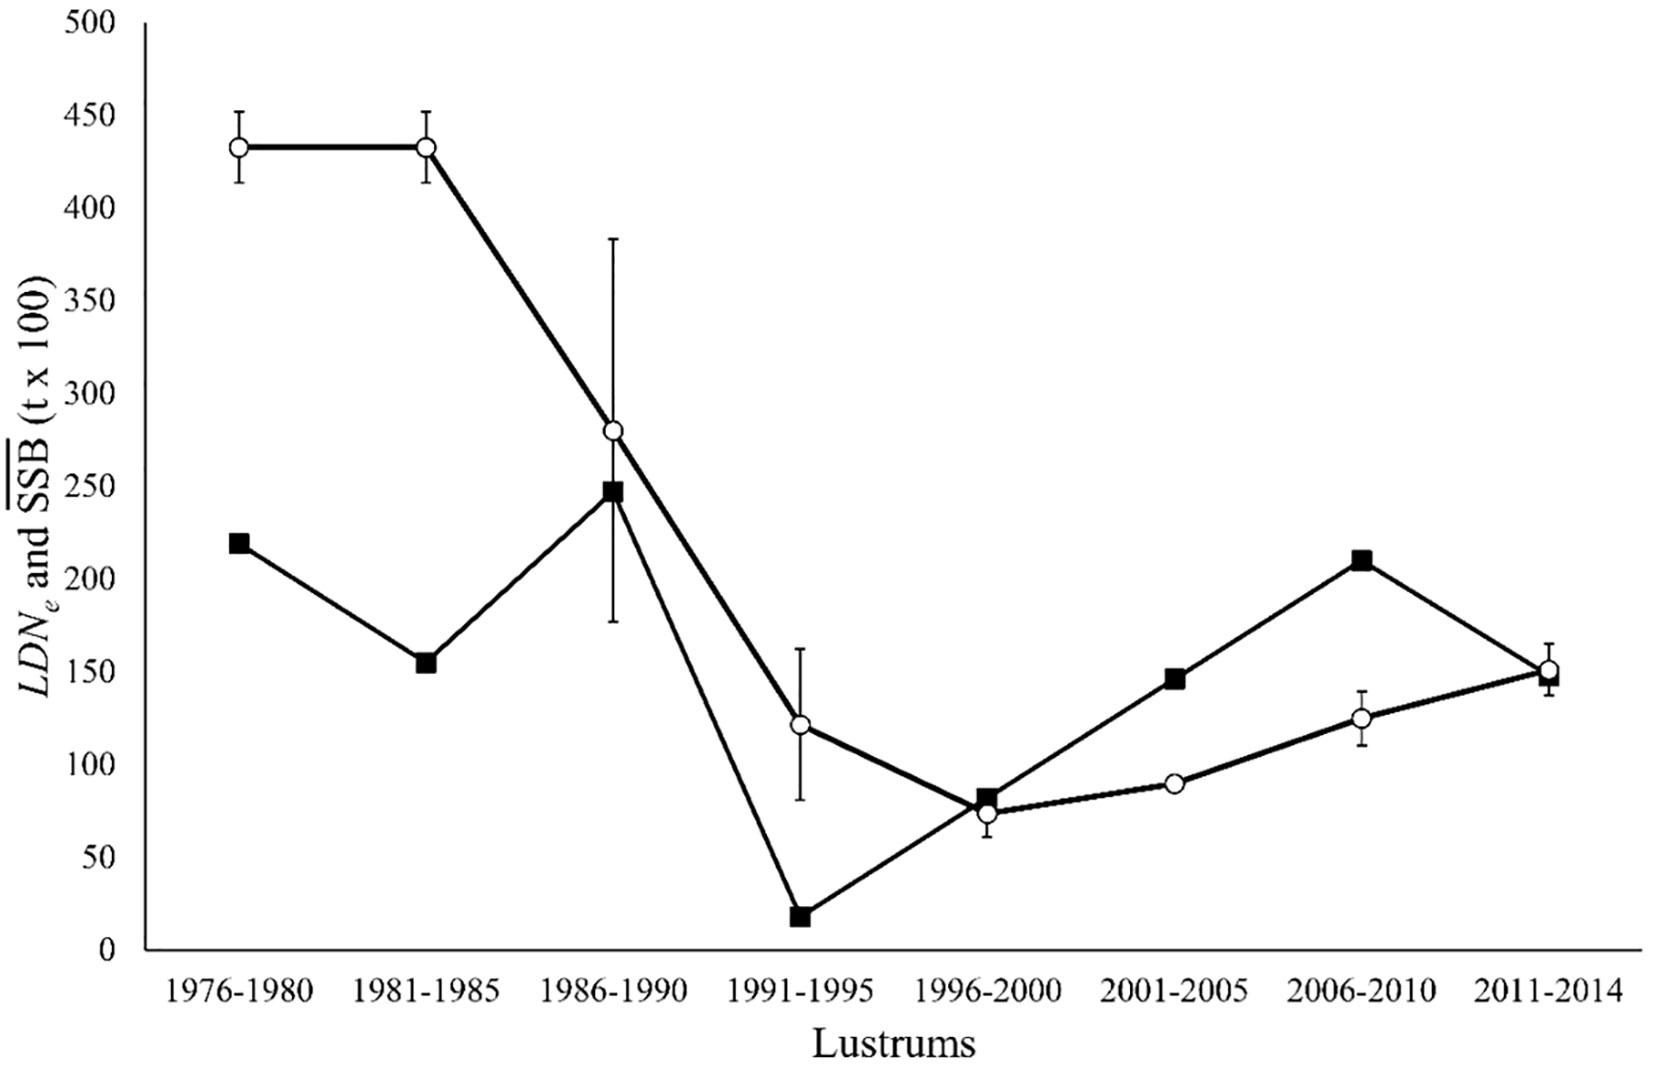
Figure 2 Temporal distribution of the spawning stock biomass (SSB, open circles) and the genetic effective size (LDNe, closed squares) of the Atlantic European hake Merluccius merluccius in the period 1974–2014. The error bars of the trend indicates its standard deviation within lustrum.
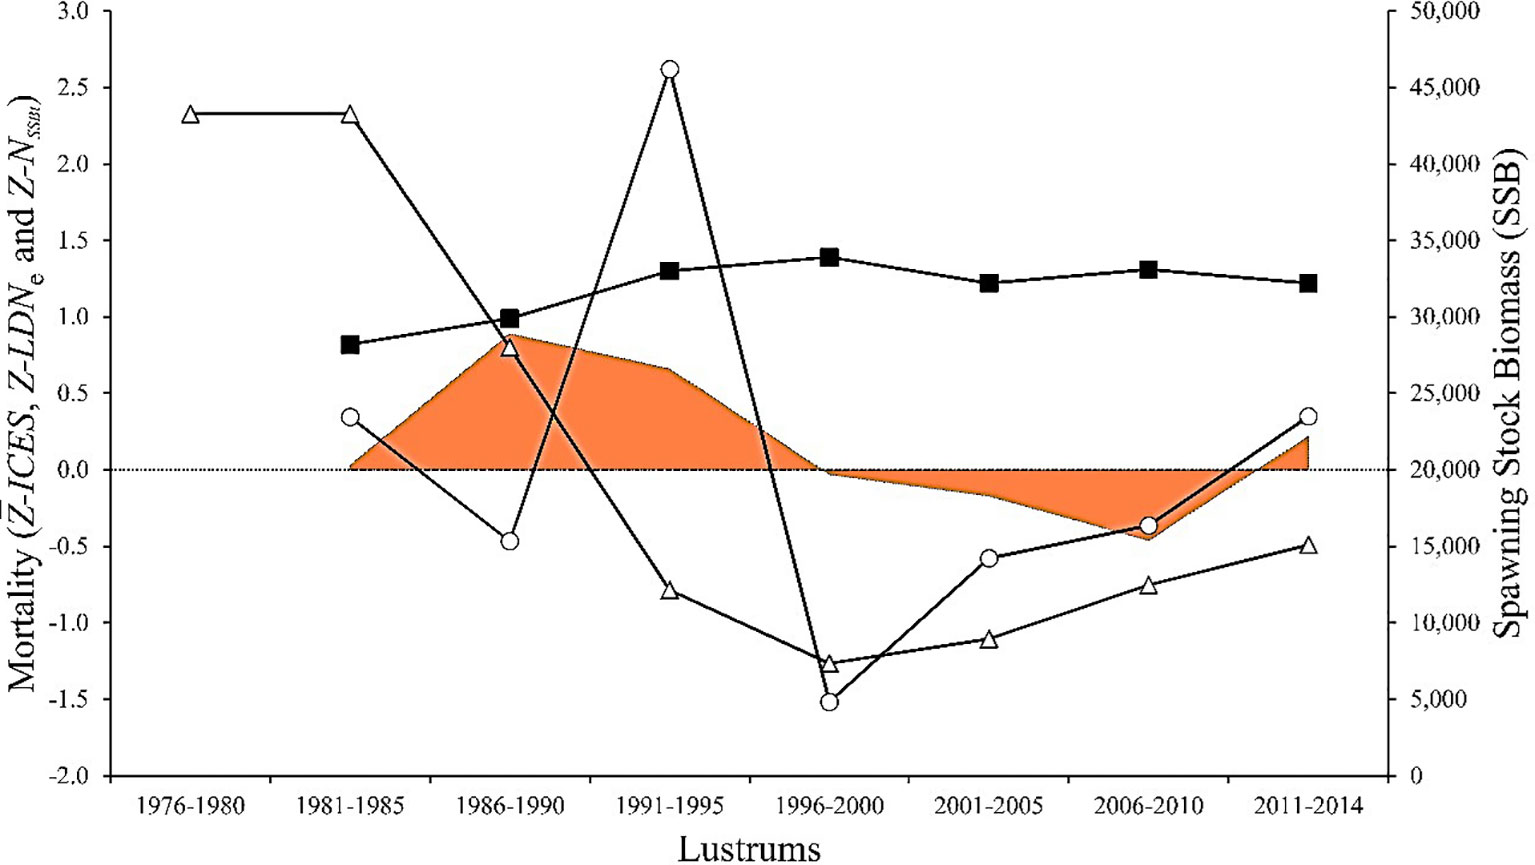
Figure 3 Temporal trends of mortality rates exerted on the Southern Atlantic European hake stock. , total mortality estimated by ICES (closed squares); Z_LDNe, global population effective genetic mortality (open circles); , global demographic mortality rate calculated after SSB estimates (shaded area); estimated SSB (tons; open triangles).
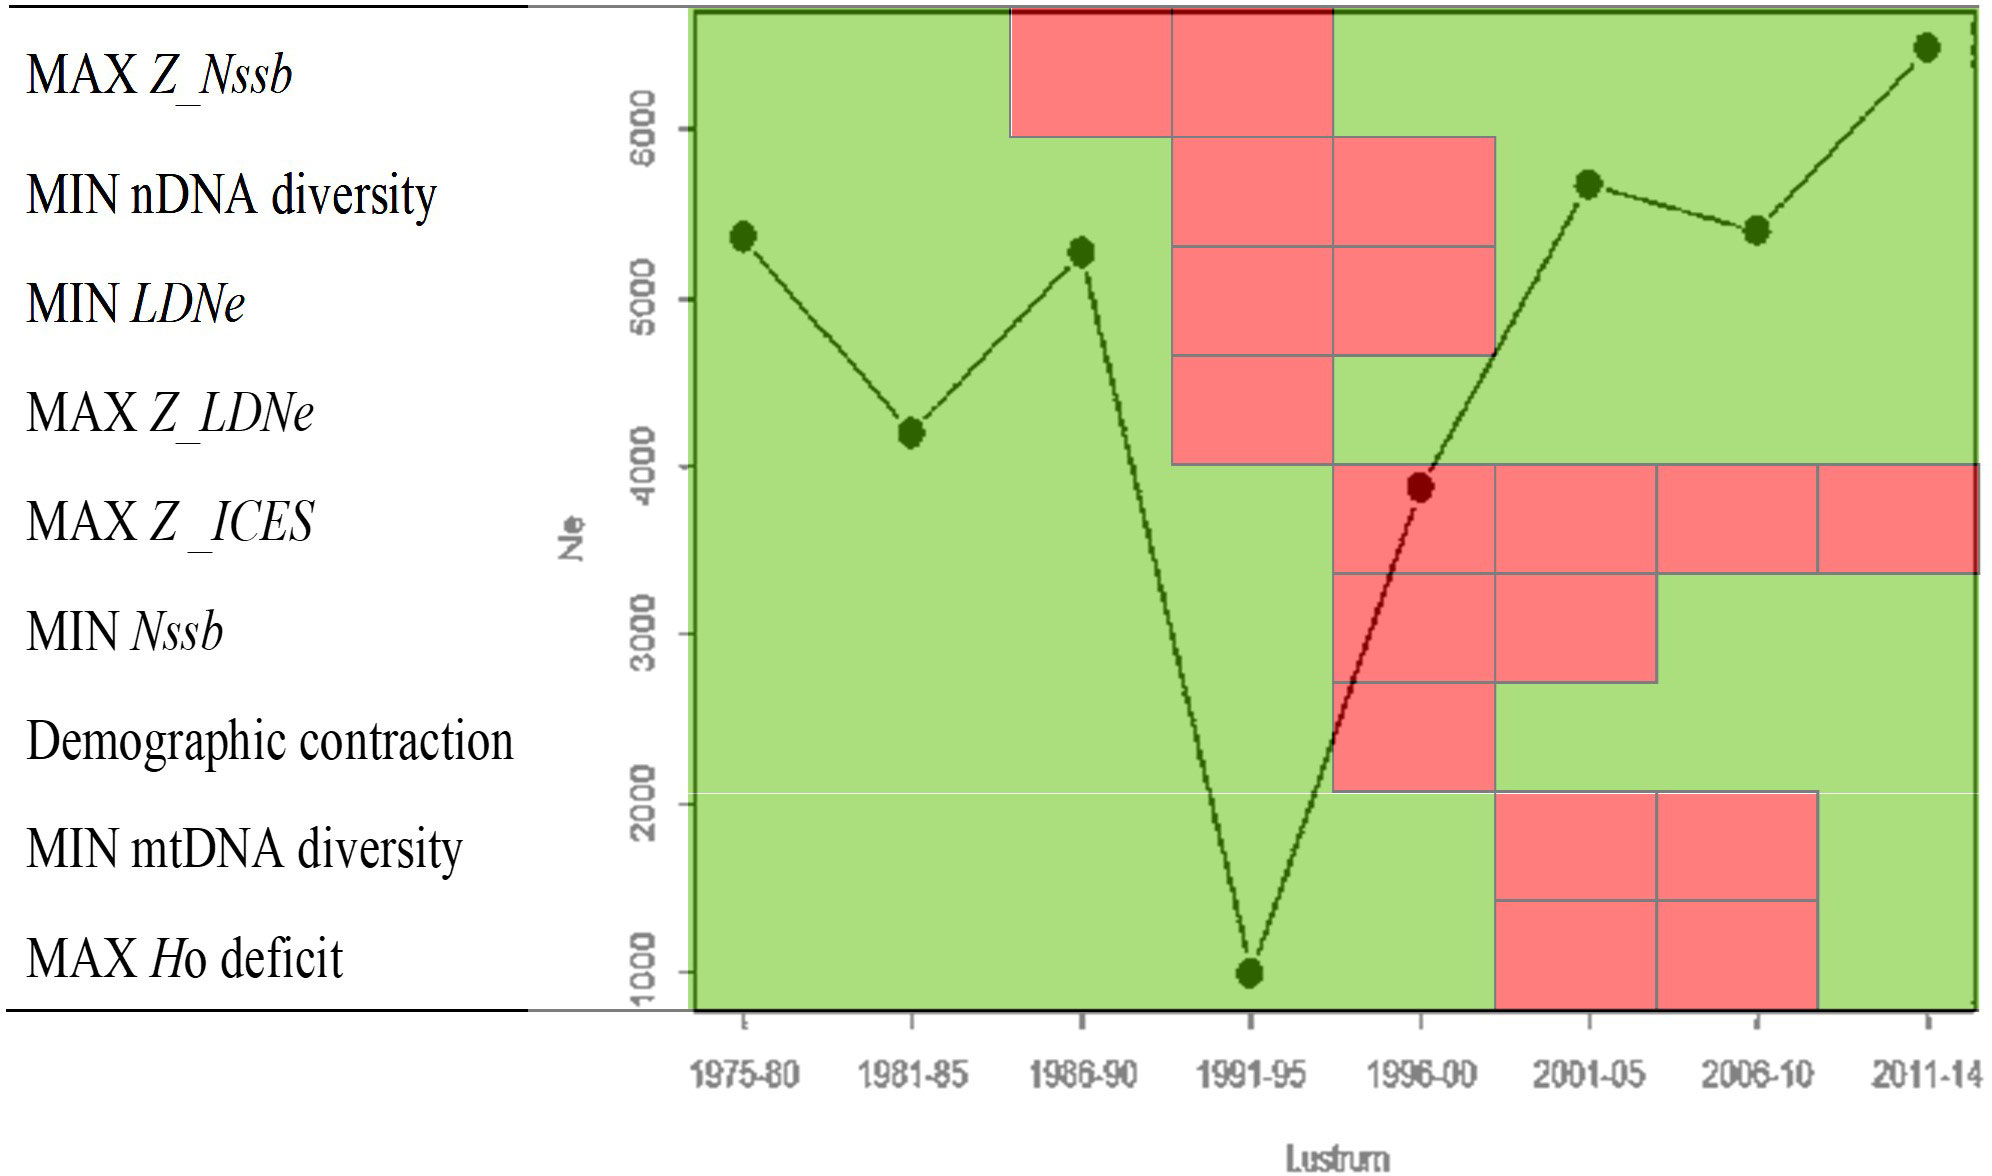
Figure 4 Main temporal milestones of demographic and genetic parameters estimated on the Southern hake stock from 1975 to 2014. Red cells and green cells indicate the maximum erosion and the minimum erosion intervals of each parameter on the left, respectively (see Table 1). The superimposed trend line shows the summarized posterior median values obtained from DIYABC as implementing the observed Ne population contraction in lustrum 1991–1995 (10–10,000; lower and upper limits, respectively) and the temporal flanking expansions down to lustrum 1975–1980 (10–10,000) and up to lustrum 2011–2014 (10–10,000) with maintenance or decrease of Ne during the last four decades.
The population effective genetic mortality Z_LDNe comprises the natural effective genetic mortality (Me) and the fishing effective genetic mortality (Fe). The simulation plot shows the expected behavior of Z_LDNe as calculated after formula (2) against the ratio between two Ne moments Net/Net0 (Figure 5), i.e., positive genetic mortalities occur when Ne at moment t decays with respect to Ne at the initial moment t0 and vice versa. The inflection point where Net = Net0 implies the conservation of Ne between moments, i.e., zero genetic mortality.
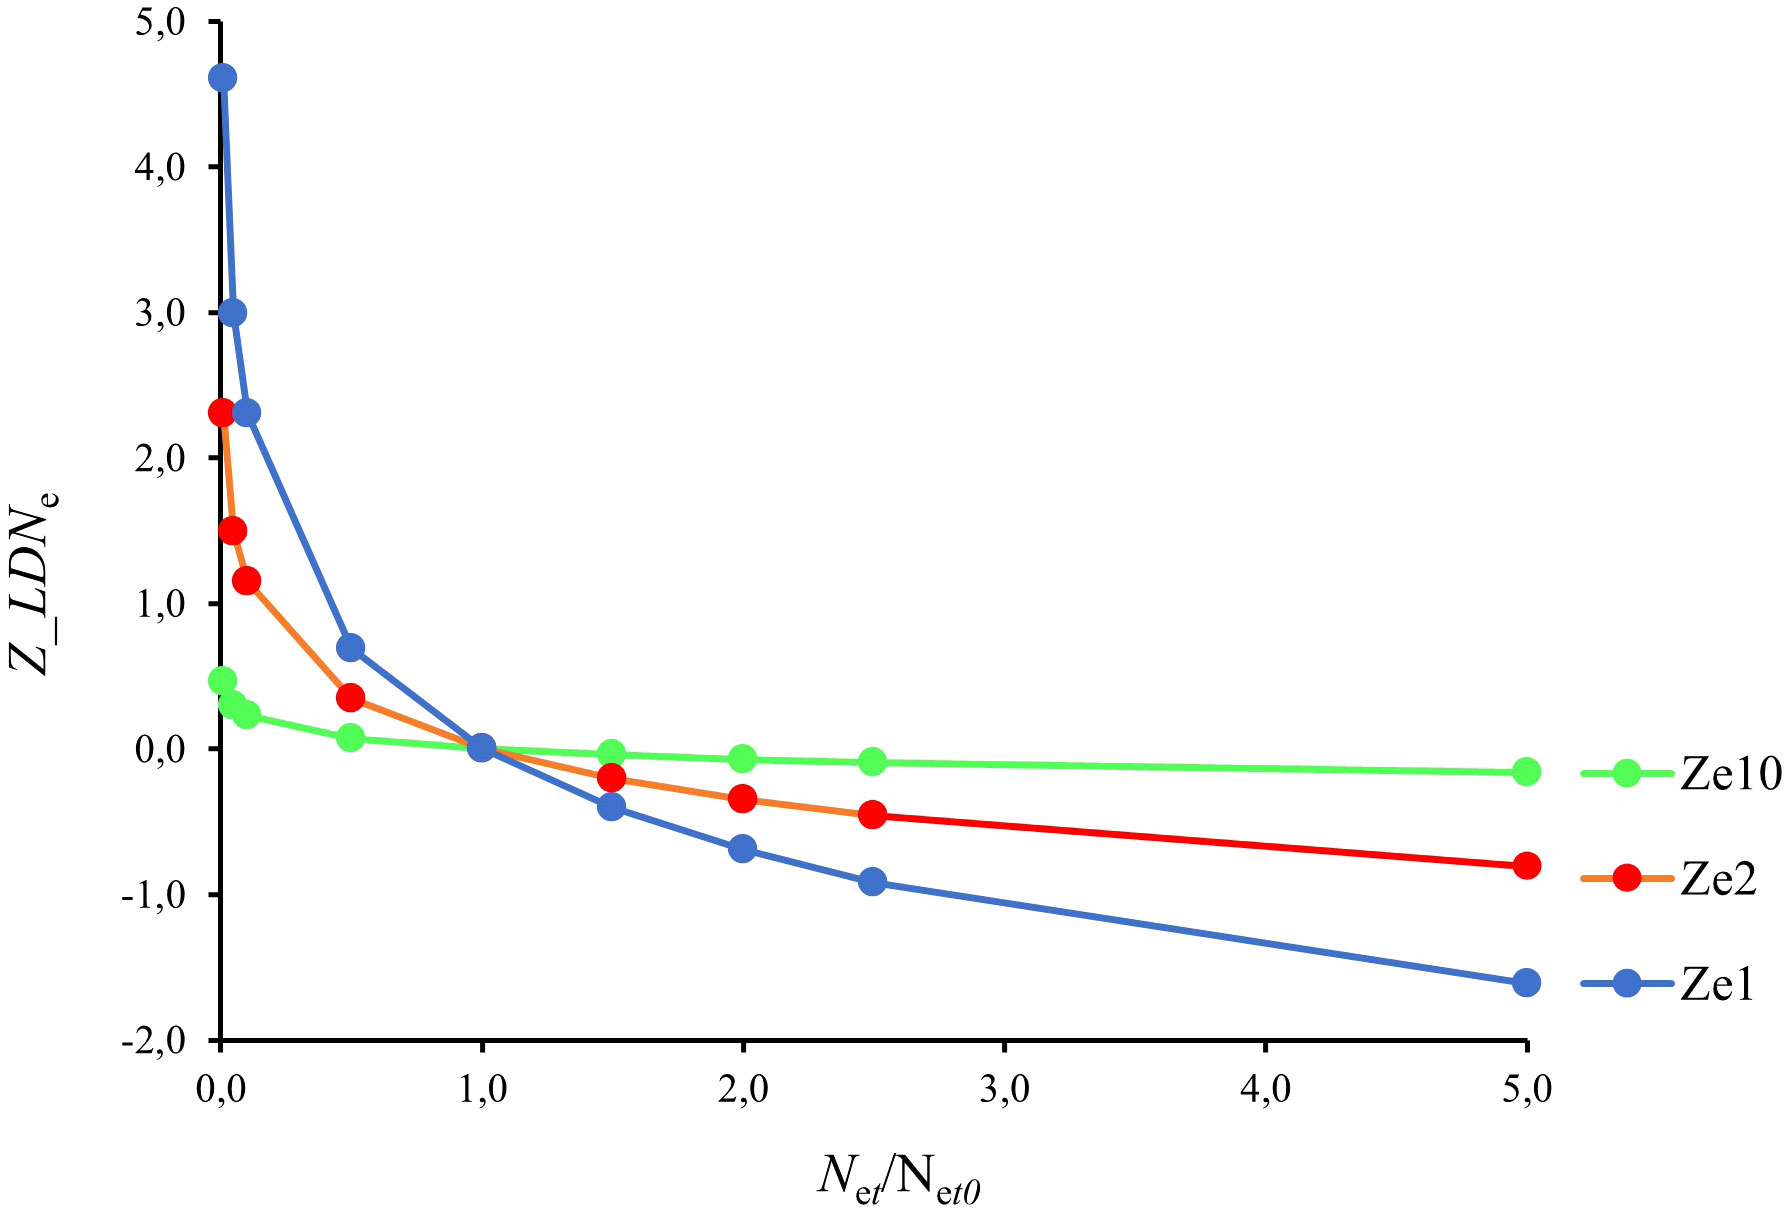
Figure 5 Relationship between the effective population genetic mortality Z_LDNe (the natural effective genetic mortality (Me) plus the fishing effective genetic mortality (Fe)) as integrated in moments t = 1, 2, 10, and the ratio Net/Net0 between Ne moments (Net0, initial moment; Net, final moment).
Genetic diversity of cytochrome b
The 465 bp fragment of the cyt b gene from 173 specimens presented 15 variable sites, which consisted of six unique substitutions and nine parsimonious substitutions, defining 22 haplotypes (Supplementary Table S4). The haplotypes Mmcytb.1, Mmcytb.2, and Mmcytb.3 were the most frequent ones across studies and years. The haplotypic diversity (Hd ± SD) was 0.569 ± 0.040, and the nucleotide diversity (Pi ± SD) was 0.0023 ± 0.00026. The mismatch distribution used to explore the demographic history of the Southern hake stock showed a global adjustment of observed values to simulated values under a recent past demographic expansion in the period 1975–2014 (Supplementary Figure S2A). The sum of squared deviations (SSD) and the Harpending’s raggedness index (Hri) used to evaluate Rogers’ sudden expansion model were low (< 0.10) and nonsignificant across lustrums. Global Fu’s FS parameter was significant under the hypothesis of nonexpansion (FS = −20.817, p< 0.00001). The mismatch distribution for lustrum 1996–2000 deviated from its expected values under demographic expansion, i.e., SSD = 0.40121, p = 0.002 (Supplementary Figure S2B). The global mutational network of cyt b showed a large number of low-frequency haplotypes in the period 1975–2014 (Figure 6).
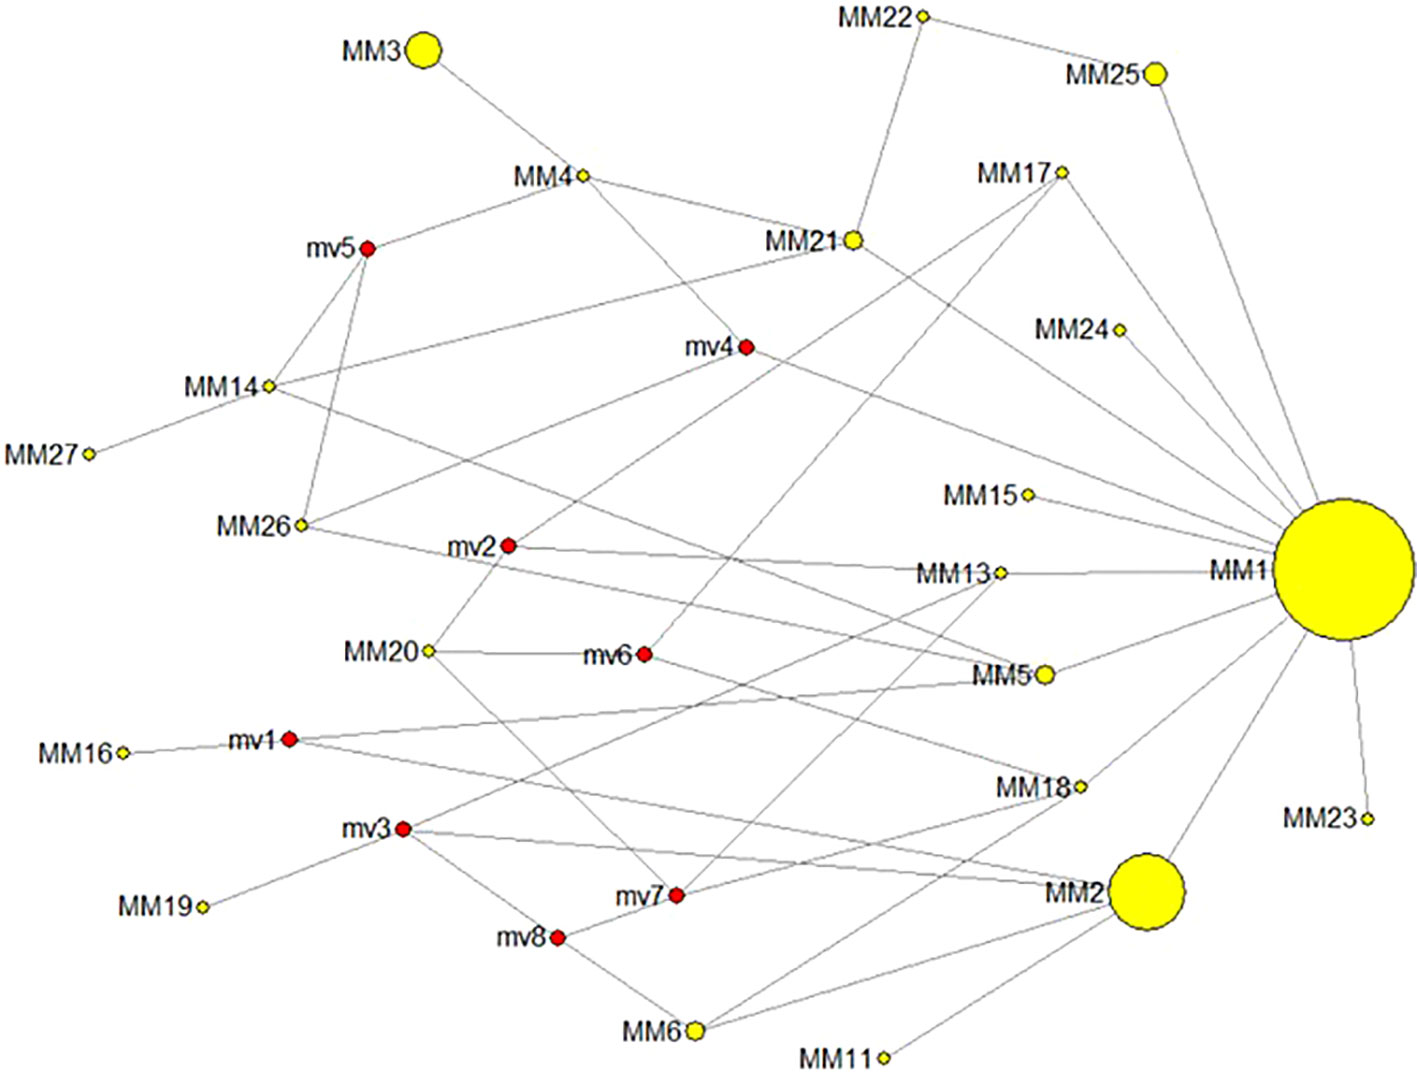
Figure 6 Molecular network for cyt b haplotypes as built with NETWORK v10.2.0.0 (http://www.fluxusengineering.com). MM1-27 is the code for observed haplotypes, while code mv1–8 is for haplotypes inferred under sampling drift.
Discussion
Current analyses aim to dissect the evolution of demographic and genetic metrics in the Southern hake fishery from the last 40 years. Demographic data were drawn from official records of ICES, while genetic data were generated in the laboratory on a lustrum-based sampling series between 1975 and 2014. Despite the uncertainty on the upper limit of some confidence intervals, the LDNe method requires a single population sample and incorporates a correction for the downward Ne bias caused by low sample sizes (Waples and Gaggiotti, 2006; Waples and Do, 2010). We show that type APS microsatellites (most microsatellites of the anonymous pentaplex) were superior to those of type NAPS (most microsatellites of the EST-pentaplex) to detect genetic erosion at the maximum population decline in lustrum 1996–2000. That contraction point was also made patent with the molecular variation of the cyt b. We also show that the maximum demographic mortality Z_NSSB (1986–1990) predated both the maximum genetic effective mortality Z_LDNe (1991–1995) and the maximum cohort-based mortality (1996–2000). That lack of temporal congruence between demographic and genetic parameters suggests that official methods based on cohort analyses are insufficient to assess both the real biological status of fish stocks and the genetic consequences of sustained fishing pressure.
Genetic diversity
The single gene pool (k = 1) inferred after Bayesian methods in the period 1975–2014 is congruent with independent data on dispersal patterns of hake juveniles along the Cantabrian shelf (Sánchez and Gil, 2000). Those data indicate that high connectivity exists over the main ground of the Southern hake stock, which spans 1,000 km coast from La Guardia to San Sebastian (northern Iberian coast) (e.g., Pita et al., 2011). Such a structural property is very basic before allowing us to assess shifts in the background gene pool of this stock. A previous genetic study on a 7-year sampling body reported a nonapparent erosion of polymorphism in anonymous microsatellite loci (Pita et al., 2017). The stability of elemental genetic metrics (Na, HE, and RS) was counterintuitive, facing evidence of the historical overharvesting of this fishery (ICES, 2014). The apparent lack of erosion can result from the insensitivity of highly variable microsatellites to biomass reduction due to sampling drift (Pita et al., 2017). Moreover, a change in population size following a moderate bottleneck can have half the power to detect such a bottleneck (Hoban et al., 2013). Here, we show that the capacity to detect erosion depends not only on those two factors but also on both: a saturated sample design along the 40-year period comprising time point estimates of Ne before and after the postharvesting SSB plateau and an adequate selection of the genetic marker set.
The minimum allelic richness (RS) per locus in lustrum 1991–1995 was due to erosion of polymorphism in the anonymous microsatellite pentaplex (APS marker type), whose amount of variation across lustrums did not correlate with that of the EST-microsatellite pentaplex (NAPS marker type). Moreover, despite genetic parameters showing range values consistent with previous studies in Atlantic hake, e.g., FST = 0.008 (Tanner et al., 2014), the systemic low polymorphism of EST microsatellites as compared to APS markers suggests that only these latter are adequate to score useful variation to assess population dynamic processes within fisheries (Pita et al., 2022). The analytical trials showed little sensibility to the inclusion or exclusion of markers Mmer-hk29 and Mmer-EST_9.4, which exhibited a high heterozygote deficit across lustrums. That deficit was putatively caused by null alleles, as suggested in previous studies using those loci, e.g., Mmer-hk29 (Lundy et al., 2000). However, the major deficit of heterozygotes in the temporal series observed in lustrums 2001–2005 and 2006–2010 not only ascribes to the null-allele hypothesis but also to a global deficit of heterozygotes following a postoverharvest population expansion, i.e., an opposite effect to the general excess of heterozygotes expected after a recent bottleneck (Maruyama and Fuerst, 1985; Cornuet and Luikart, 1996; Luikart and Cornuet, 1998). Regarding the temporal landmarks of the genetic markers used to measure overexploitation (see Figure 4), we observed that (1) the molecular erosion of neutral microsatellites predated that of cyt b and that (2) a deficit of heterozygotes could only be detected after the big population contraction. Those results suggest that neither the conservative molecular variation of cyt b nor heterozygosity are useful as immediacy indexes of overharvesting. However, allele diversity and genetic effective size from APS microsatellites seem to be adequate to detect postharvesting genetic erosion in real time (e.g., Yorisue et al., 2020).
Temporal genetic differentiation
Occasionally, the coefficient FST on microsatellite data has revealed a significant differentiation between samples over decades, e.g., snappers (Hauser et al., 2002). However, an ocean-wide genetic homogeneity is the scenario currently reported for many marine fishes (Poulsen et al., 2006). The tiny but significant distance (FSC = 0.007*) among lustrums within this hake stock can be explained by sudden shifts in its genotypic background as a by-product of randomness and overharvesting. Such lustrum-based occasional divergence disappeared upon biomass rebound in successive years, making the temporal genetic divergence unnoticed over decades (FCT = 0.002). That result highlights the need for long-term fine-grain sampling to detect population sinks that are buffered on a wide temporal scale (Cuéllar-Pinzón et al., 2016). The significant regression between FST and DEST indicates the suitability of both indexes to identify the higher divergence in pairwise comparisons involving lustrums 1991–1995 and 2011–2014. Nevertheless, the statistical significance of DEST makes it more adequate than FST to depict subtle genetic divergence among temporal samples (Jost, 2008) as has also been observed in other marine taxa (e.g., Faria et al., 2018). The genetic divergence between lustrum 1991–1995 and the rest of lustrums was due to a significant allele reduction in that period, likely caused by the maximum overharvesting pressure on this stock (ICES, 2014). Opposite, the cumulative divergence between lustrum 2011–2014 and period 1990–2005 was likely caused by the rebound of the stock due to technical and political EU measures adopted to protect this fishery (Council Reg. No 1162/2001, 2602/2001, and 2166/2005) and putatively helped by migration from the neighboring northern hake stock (Pita et al., 2011).
Despite the observed temporal stability of molecular variation in wide temporal frameworks of exploited marine fishes, e.g., Gadus morhua (Ruzzante et al., 2001; Poulsen et al., 2006; Therkildsen et al., 2010), Raja clavata (Chevolot et al., 2008), Clupea harengus (Larsson et al., 2010), and Solea solea (Cuveliers, 2011), current fishery metrics reflect the demographic erosion as well as the genetic erosion that overharvesting brought about on this hake stock. From the genetic viewpoint, the erosion was patent from nuclear DNA markers as much as from the mitochondrial DNA markers. For instance, the mismatch distribution in the cyt b variation indicates a steady demographic expansion in the period 1975–2014 with a strong population contraction in lustrum 1996–2000 (see Supplementary Figure S2). Such population expansion flanking the contraction is patent in the mutational network of cyt b, where a large bulk of low-frequency haplotypes appeared in that period (Figure 6).
The effective reproductive size
SSB is a demographic metrics used to assess the population status and its reproductive potential. Estimates of SSB are dependent on the algorithm adopted, which is permanently under revision (http://www.ices.dk). Therefore, current SSB data represent a rough approach to the status of the Southern hake biomass. SSB data ranged from ≈ 21.5 mill. (1975–1980) to a minimum of ≈ 3.5 mill. (1996–2000) and slowly rebounded thereafter up to ≈ 7.5 mill. fish (2015–2019). A biomass rebound is good news for this stock and indicates it still holds reproductive plasticity (Pita et al., 2017). However, in absolute biomass terms, the recovery pace was slow under continued exploitation, suggesting the erosion of its reproductive potential by overharvesting. Noteworthy, the SSB rebound up to 15,102 t or ~7.5 mill. fish by 2014 (ICES, 2015) was about one-third of the historical size of this stock as scored in the 1970s. That situation agrees with the outcome of demographic simulations on Atlantic cod, in which one should not be too optimistic about reaching preharvest biomass levels after episodes of sustained overharvest (Kuparinen et al., 2016).
The biomass rebounding potential is not only a property of the census size but also of the genetic background variation aimed at being mirrored by LDNe. This latter was relatively high until 1990, was down-eroded to its minimum in lustrum 1991–1995, when the effective genetic mortality rate Z_LDNe approached its historical maximum and rebounded under relaxed fishing intensity from 2000 on. As fishing intensity decreased, LDNe also increased, likely due to a lower reproductive variance and a higher probability of survival of immigrants from the Northern hake stock, making the ratio Ne/NSSB rebound very rapidly. Theoretically, the low LDNe observed at the overharvest maximum in 1991–1995 could be limiting for subsequent generations (Vucetich et al., 1997). Nevertheless, the genetic erosion caused by fishing drift can be partially compensated by gene flow (Fraser et al., 2004; Palstra and Ruzzante, 2008), as previously shown in this species (Pita et al., 2016). Indeed, all Bayesian simulations support each other in rebuilding the evolutionary history of the effective size of this stock and highlight the maximum Ne contraction in the decade 1990–2000 followed by a rapid expansion (see Figure 4) that is fully congruent with other genetic metrics discussed above.
The uncorrelated measures of mortality
The maximum demographic mortality rate (Z_NSSB) in 1986–1990 predated the minimum of both, the genetic richness RS and the effective size Ne in lustrum 1991–1995. However, the cohort-based mortality ) was maximal only from 1996–2000 on, when the other two mortality rates were negative or low and other lower-pace genetic effects were scored. Namely, the minimum molecular diversity of cyt b and the general deficit of heterozygotes of microsatellites were the latest genetic effects observed after the overharvest maximum (see Figure 4).
The temporal uncoupling of demographic and genetic metrics suggests that they depend causally on each other, i.e., the maximum demographic mortality (1986–1990) predated the overharvesting-mediated genetic erosion in the consecutive lustrum (1991–1995), while this latter predated both the official cohort-based SSB minimum (1996–2000) as well as the population inability to reach preharvest biomass levels (2011–2014). Alternatively, the temporal uncoupling between those population metrics could simply be due to their calculation on distinct population fractions, i.e., a random genetic screening vs. a cohort-based SSB demographic assessment. The global scenario suggests that (1) the large fishing pressure exerted on this stock in 1986–1990 was detected in real time using the classic survival equation approach on Z_NSSB, (2) the most drastic genetic consequences of fishing pressure were detected in the following lustrum 1991–1995, and (3) the official method applied in to infer fishing mortality on age classes provides biased estimates of the real impact exerted by fishing pressure on the whole population. Provided that only detected deep overharvesting one decade later than other methods (Z_NSSB), its methodology seems to largely underestimate overfishing consequences for age classes other than the fishing target cohorts. Therefore, a more comprehensive incorporation of meaningful biological data in fisheries stock assessment (e.g., Scott et al., 2016) seems badly needed.
The population effective genetic mortality Z_LDNe is the theoretical addition of the natural effective genetic mortality (Me) and the fishing effective genetic mortality (Fe). The simulation plot (Figure 5) shows that positive genetic mortalities occur when Net decays with respect to Net0 and that the inflection point at which Net = Net0 implies the conservation of Ne between moments, i.e., zero genetic mortality. However, Z_LDNe = 0 does not preclude that a positive Z_LDNe is compensated by other factors, such as the effective migration me. In turn, negative genetic mortality rates are allowed, implying either a significant effective migration exceeding the genetic erosion or a reduction of the reproductive variance by natural o sampling causes. Noteworthy, a null Z_LDNe score tells nothing about the quality of the genetic variation, i.e., the substitution of polymorphisms between temporal estimates.
The ratio Ne/NSSB
The metrics NSSB is a proxy to the effective reproductive size, and Ne/NSSB becomes a critical parameter to analyze trends in the genetic effective size of the breeding fraction under population fluctuations. Because of the large uncertainty on population size, overlapping generations, sex ratios, nonrandom mating, variation in family size, and habitat-related productivity (Nunney, 1999; Hare et al., 2011), empirical Ne/NSSB is much less than expected from demography (Frankham, 1995; Vucetich et al., 1997). That ratio in hake is orders of magnitude less than current estimates of NSSB, i.e., Ne/NSSB< (10−05–10−04), as also reported in diverse teleosts (10−02–10−06, Hauser and Carvalho, 2008), Cuplea harengus (10−07–10−08, Larsson et al., 2010), Gadus morhua (10−05, Hutchinson et al., 2003), Pagrus auratus (10−05, Hauser et al., 2002), Raja clavata (10−05–10−06, Chevolot et al., 2008), Sciaenops ocellatus (10−04, Turner et al., 2002), and Solea solea (10−05, Cuveliers, 2011). We assume the population equilibrium of this hake stock at its pre-overharvest status (1975), i.e., with Ne maximal, NSSB constant, and Ne/NSSB at a relative maximum. Massive fishing mortality in 1986–1990 rapidly eroded LDNe, and Ne/ reached its minimum in 1991–1995 well before the official SSB minimum in the following lustrum. These data confirm that a stock does not need to be demographically exhausted to exhibit very low levels of genetic diversity (Pinsky and Palumbi, 2014). The LDNe minimum in 1991–1995 lets us believe that this hake stock traversed a genetic bottleneck in that period due to a drastic increment of the reproductive variance in both sexes. Therefore, fading transient population structures are likely structural sweepstake artifacts (Hedgecock, 1994) that become more pronounced at overharvest (Pita et al., 2017). The absence of correlation between Ne and SSB in the period 1975–2014 denotes the genetic insensitiveness of SSB as affected by compensatory recruitment (Anderson, 1988), as well as the Ne fluctuation with reproductive variance and unequal sex ratios (Waples, 2002). Despite such a lack of correlation, current data suggest that management warnings could have been triggered if the minimum Ne/NSSB ratio scored on lustrum 1991–1995 (Ne/NSSB = 3.0 × 10⁻⁶) were taken into consideration.
Conclusions
The population genetic analysis of the Southern hake stock in the period 1975–2014 indicates that its gene pool has been eroded at the overharvest maximum in 1991–1995. Such molecular erosion could be early detected with the large polymorphism of APS microsatellites as opposed to the less within-stock polymorphic NAPS markers. Just-on-time EU fishing policies, the maintenance of a minimum Ne threshold that prevented collapse by genetic factors, and a compensatory effect of gene flow from the Northern hake stock (Pita et al., 2016) likely played synergically on this firm-stock recovery after 2005. However, such recovery is not expected to regain preharvesting levels after episodes of sustained overharvest (Kuparinen et al., 2016). Stock assessment based solely on demographic models or their subrogations (e.g., ) underestimates the genetic erosion that overfishing exerts on the reproductive potential of a fish stock. The incorporation of different data sources and temporal genetic controls would bring about a more realistic and integral biological assessment (see Basset et al., 2001) and allow for the assessment of the risks of extinction by genetic factors. Long-term, spatially comprehensive, and systematic sampling designs are required to assess the predictability and usefulness of Ze, Ne, and Ne/NSSB. Those metrics are promising candidates to assess genetic sustainability under a blue transition agenda for fisheries.
Data availability statement
The data presented in the study are deposited in the Figshare repository, https:/doi.org/10.6084/m9.figshare.22761986.v1.
Ethics statement
Ethical approval was not required for the study involving animals in accordance with the local legislation and institutional requirements because samples were taken from fishing campaigns.
Author contributions
PP designed and conceived the study. AG organized and executed field sampling and tissue preservation of fish samples during CSIC-IEO fishing campaigns. AP conducted the development of EST microsatellites starting from 454 and GAII sequence data. MF-M performed the preliminary in-silico calibration of multiplex assemblages. AP and MF-M genotyped the sample set. PP drafted the manuscript with contributions from the coauthors. All authors contributed to the article and approved the submitted version.
Funding
The author(s) declare financial support was received for the research, authorship, and/or publication of this article. This work was financed with contract TED2021–132258BI00 from MCIN/AEI/10.13039/501100011033 and The European Union NextGenerationEU/PRTR. The Regional Government of Xunta de Galicia supported the Ph.D. grant (ED481A-2017/362) of MF-M.
Acknowledgments
The authors warmly thank Angie Maribeth Santafé-Muñoz and José Andrés Cuéllar-Pinzón for their technical help in the laboratory.
Conflict of interest
The authors declare that the research was conducted in the absence of any commercial or financial relationships that could be construed as a potential conflict of interest.
Publisher’s note
All claims expressed in this article are solely those of the authors and do not necessarily represent those of their affiliated organizations, or those of the publisher, the editors and the reviewers. Any product that may be evaluated in this article, or claim that may be made by its manufacturer, is not guaranteed or endorsed by the publisher.
Supplementary material
The Supplementary Material for this article can be found online at: https://www.frontiersin.org/articles/10.3389/fmars.2023.1214469/full#supplementary-material
References
Anderson J. T. (1988). A review of size dependent survival during pre-recruit stages of fishes in relation to recruitment. J. Northwest Atl. Fish. Sci. 8, 55–66. doi: 10.2960/J.v8.a6
Bandelt H. J., Forster P., Röhl A. (1999). Median-joining networks for inferring intraspecific phylogenies. Mol. Biol. Evol. 16 (1), 37–48. doi: 10.1093/oxfordjournals.molbev.a026036
Barbato M., Orozco-terWengel P., Tapio M., Bruford M. W. (2015). SNeP: a tool to estimate trends in recent effective population size trajectories using genome-wide SNP data. Front. Genet. 6. doi: 10.3389/fgene.2015.00109
Basset P., Ballouxf F., Perrin N. (2001). Testing demographic models of effective population size. Proc. R. Soc. London. Ser. B: Biol. Sci. 268 (1464), 311–317. doi: 10.1098/rspb.2000.1359
Benjamini Y., Hochberg Y. (1995). Controlling the false discovery rate: a practical and powerful approach to multiple testing. J. R. Stat. Soc.: Ser. B (Methodol.) 57 (1), 289–300. doi: 10.1111/j.2517-6161.1995.tb02031.x
Bijlsma R., Loeschcke V. (2012). Genetic erosion impedes adaptive responses to stressful environments. Evol. Appl. 5 (2), 117–129. doi: 10.1111/j.1752-4571.2011.00214.x
Casey J., Pereiro J. (1995). “European hake (M. merluccius) in the North-east Atlantic,” in Hake (Dordrech: Springer), 125–147.
Chapuis M. P., Estoup A. (2007). Microsatellite null alleles and estimation of population differentiation. Mol. Biol. Evol. 24 (3), 621–631. doi: 10.1093/molbev/msl191
Chevolot M., Ellis J. R., Rijnsdorp A. D., Stam W. T., Olsen J. L. (2008). Temporal changes in allele frequencies but stable genetic diversity over the past 40 years in the Irish Sea population of thornback ray, Raja clavata. Heredity 101 (2), 120–126. doi: 10.1038/hdy.2008.36
Corander J., Waldmann P., Marttinen P., Sillanpää M. J. (2004). BAPS 2: enhanced possibilities for the analysis of genetic population structure. Bioinformatics 20 (15), 2363–2369. doi: 10.1093/bioinformatics/bth250
Cornuet J. M., Luikart G. (1996). Description and power analysis of two tests for detecting recent population bottlenecks from allele frequency data. Genetics 144 (4), 2001–2014. doi: 10.1093/genetics/144.4.2001
Cornuet J. M., Pudlo P., Veyssier J., Dehne-Garcia A., Gautier M., Leblois R., Marin J. M., Estoup A. (2014). DIYABC v2. 0: a software to make approximate Bayesian computation inferences about population history using single nucleotide polymorphism, DNA sequence and microsatellite data. Bioinformatics 30 (8), 1187–1189. doi: 10.1093/bioinformatics/btt763
Cuéllar-Pinzón J., Presa P., Hawkins S. J., Pita A. (2016). Genetic markers in marine fisheries: Types, tasks and trends. Fish. Res. 173, 194–205. doi: 10.1016/j.fishres.2015.10.019
Cuveliers E. (2011) Connectivity and genetic stability in sole (Solea solea). Available at: https://lirias.kuleuven.be/1705220?limo=0.
Díez I., Muguerza N., Santolaria A., Ganzedo U., Gorostiaga J. M. (2012). Seaweed assemblage changes in the eastern Cantabrian Sea and their potential relationship to climate change. Estuar. Coast. Shelf Sci. 99, 108–120. doi: 10.1016/j.ecss.2011.12.027
Do C., Waples R. S., Peel D., Macbeth G. M., Tillett B. J., Ovenden J. R. (2014). NeEstimator V2: re-implementation of software for the estimation of contemporary effective population size (Ne) from genetic data. Mol. Ecol. Res. 14, 209–214. doi: 10.1111/1755-0998.12157
England P. R., Luikart G., Waples R. S. (2010). Early detection of population fragmentation using linkage disequilibrium estimation of effective population size. Conserv. Genet. 11, 2425–2430. doi: 10.1007/s10592-010-0112-x
Excoffier L., Lischer H. E. (2010). Arlequin suite ver 3.5: a new series of programs to perform population genetics analyses under Linux and Windows. Mol. Ecol. Res. 10 (3), 564–567. doi: 10.1111/j.1755-0998.2010.02847.x
Faria J., Pita A., Martins G. M., Ribeiro P. A., Hawkins S. J., Presa P., et al. (2018). Inbreeding in the exploited limpet Patella aspera across the Macaronesia archipelagos (NE Atlantic): implications for conservation. Fish. Res. 198, 180–188. doi: 10.1016/j.fishres.2017.09.003
Foll M., Gaggiotti O. (2008). A genome-scan method to identify selected loci appropriate for both dominant and codominant markers: a Bayesian perspective. Genetics 180 (2), 977–993. doi: 10.1534/genetics.108.092221
Frankham R. (1995). Effective population size/adult population size ratios in wildlife: a review. Genet. Res. 66 (2), 95–107. doi: 10.1017/S0016672300034455
Fraser D. J., Lippé C., Bernatchez L. (2004). Consequences of unequal population size, asymmetric gene flow and sex-biased dispersal on population structure in brook charr (Salvelinus fontinalis). Mol. Ecol. 13 (1), 67–80. doi: 10.1046/j.1365-294X.2003.02038.x
Fu Y. X. (1997). Statistical tests of neutrality of mutations against population growth, hitchhiking and background selection. Genetics 147 (2), 915–925. doi: 10.1093/genetics/147.2.915
Gerlach G., Jueterbock A., Kraemer P., Deppermann J., Harmand P. (2010). Calculations of population differentiation based on GST and D: forget GST but not all of statistics! Mol. Ecol. 19, 3845–3852. doi: 10.1111/j.1365-294X.2010.04784.x
Goudet J. (1995). FSTAT (v. 1.2): A computer program to calculate F-statistics. J. Heredity 86 (6), 485–486. doi: 10.1093/oxfordjournals.jhered.a111627
Gurgel C. F. D., Camacho O., Minne A. J. P., Wernberg T., Coleman M. A. (2020). Marine heatwave drives cryptic loss of genetic diversity in underwater forests. Curr. Biol. 30 (7), 1199–1206.e2. doi: 10.1016/j.cub.2020.01.051
Hall T. A. (1999). BioEdit: A user-friendly biological sequence alignment editor and analysis program for windows 95/98/NT. Nucleic Acids Symposium Ser. 41, 95–98. doi: 10.14601/Phytopathol_Mediterr-14998u1.29
Hare M. P., Nunney L., Schwartz M. K., Ruzzante D. E., Burford M., Waples R. S., ruegg K., Palstra F., et al. (2011). Understanding and estimating effective population size for practical application in marine species management. Conserv. Biol. 25 (3), 438–449. doi: 10.1111/j.1523-1739.2010.01637.x
Harpending H. C. (1994). Signature of ancient population growth in a low-resolution mitochondrial DNA mismatch distribution. Hum. Biol. 66, 591–600. Available at: https://www.jstor.org/stable/41465371
Hauser L., Adcock G. J., Smith P. J., Ramírez J. H. B., Carvalho G. R. (2002). Loss of microsatellite diversity and low effective population size in an overexploited population of New Zealand snapper (Pagrus auratus). Proc. Nat. Acad. Sci. 99 (18), 11742–11747. doi: 10.1073/pnas.172242899
Hauser L., Carvalho G. R. (2008). Paradigm shifts in marine fisheries genetics: ugly hypotheses slain by beautiful facts. Fish Fish. 9 (4), 333–362. doi: 10.1111/j.1467-2979.2008.00299.x
Hedgecock D. (1994). “Does variance in reproductive success limit effective population sizes of marine organisms?,” in Genetics and evolution of aquatic organisms (The Netherlands: Springer Netherlands), 122–134.
Hoban S., Arntzen J. A., Bruford M. W., Godoy J. A., Rus Hoelzel A., Segelbacher G., et al. (2014). Comparative evaluation of potential indicators and temporal sampling protocols for monitoring genetic erosion. Evol. Appl. 7 (9), 984–998. doi: 10.1111/eva.12197
Hoban S., Gaggiotti O., ConGRESS Consortium, Bertorelle G. (2013). Sample Planning Optimisation Tool for conservation and population Genetics (SPOTG): a software for choosing the appropriate number of markers and samples. Methods Ecol. Evol. 4 (3), 299–303. doi: 10.1111/2041-210x.12025
Hutchinson W. F., Oosterhout C. V., Rogers S. I., Carvalho G. R. (2003). Temporal analysis of archived samples indicates marked genetic changes in declining North Sea cod (Gadus morhua). Proc. R. Soc B. P. R. Soc B-Biol Sci. 270 (1529), 2125–2132. doi: 10.1098/rspb.2003.2493
ICES. (2009a). Book 9.9.4 Widely distributed and migratory stocks. 9.4.1 (Northern Stock: Hake in division IIIa, subareas IV, VI, and Divisions VIIIa, b, d).
ICES. (2014). Report of the ICES Advisory Committee 2014. ICES Advice 2014, Book 7, Section 3.7. 16. (Copenhagen: ICES Headquarters)
ICES. (2015). Report of the ICES Advisory Committee 2015. ICES Advice 2015, Book 7, Section 3.12. 9. (Copenhagen: ICES Headquarters)
ICES Advice. (2019). “Hake (Merluccius merluccius) in divisions 8.c and 9.a, Southern stock (Cantabrian Sea and Atlantic Iberian waters),” in Report of the ICES Advisory Committee, 2019. ICES Advice 2019, hke.27.8c9a. (Copenhagen: ICES Headquarters). doi: 10.17895/ices.advice.4760
Jost L. (2008). GST and its relatives do not measure differentiation. Mol. Ecol. 17 (18), 4015–4026. doi: 10.1111/j.1365-294X.2008.03887.x
Kuparinen A., Boit A., Valdovinos F. S., Lassaux H., Martinez N. D. (2016). Fishing-induced life-history changes degrade and destabilize harvested ecosystems. Sci. Rep. 6 (1), 1–9. doi: 10.1038/srep22245
Lande R., Barrowclough G. (1987). “Effective population size, genetic variation, and their use in population,” in Viable populations for conservation, vol. 87. (Cambridge: Cambridge University Press).
Larsson L. C., Laikre L., André C., Dahlgren T. G., Ryman N. (2010). Temporally stable genetic structure of heavily exploited Atlantic herring (Clupea harengus) in Swedish waters. Heredity 104 (1), 40–51. doi: 10.1038/hdy.2009.98
Librado P., Rozas J. (2009). DnaSP v5: a software for comprehensive analysis of DNA polymorphism data. Bioinformatics 25 (11), 1451–1452. doi: 10.1093/bioinformatics/btp187
Lloris D., Matallanas J., Oliver P. (2005). “Hakes of the world (Family Merlucciidae). An annotated and illustrated catalogue of hake species known to date,” in FAO Species Catalogue for Fishery Purposes, vol. 2. (Rome: FAO), 57. Available at: https://digital.csic.es/bitstream/10261/32166/9/Lloris_et_al_2005.pdf.
Lopes I., Martins N., Baird D. J., Ribeiro R. (2009). Genetic erosion and population resilience in Daphnia longispina O.F. Müller under simulated predation and metal pressures. Environ. Toxicol. Chem. 28 (9), 1912–1919. doi: 10.1897/08-359.1
Luikart G., Cornuet J. M. (1998). Empirical evaluation of a test for identifying recently bottlenecked populations from allele frequency data. Conserv. Biol. 12 (1), 228–237. doi: 10.1111/j.1523-1739.1998.96388.x
Lundy C. J., Moran P., Rico C., Milner R. S., Hewitt G. M. (1999). Macrogeographical population differentiation in oceanic environments: a case study of European hake (Merluccius merluccius), a commercially important fish. Mol. Ecol. 8 (11), 1889–1898. doi: 10.1046/j.1365-294x.1999.00789.x
Lundy C. J., Rico C., Hewitt G. M. (2000). Temporal and spatial genetic variation in spawning grounds of European hake (Merluccius merluccius) in the Bay of Biscay. Mol. Ecol. 9 (12), 2067–2079. doi: 10.1046/j.1365-294X.2000.01120.x
Maruyama T., Fuerst P. A. (1985). Population bottlenecks and nonequilibrium models in population genetics. III. Genic homozygosity in populations which experience periodic bottlenecks. Genetics 111 (3), 691–703. doi: 10.1093/genetics/111.3.691
McNeely J. A., Miller K. R., Reid W. V., Mittermeier R. A., Werner T. B. (1990). “Conserving the world’s biological diversity,” in International Union for conservation of nature and natural resources. (Gland: International Union for Conservation of Nature and Natural Resources)
Milano I., Babbucci M., Panitz F., Ogden R., Nielsen R. O., Taylor M. I., et al. (2011). Novel tools for conservation genomics: comparing two high-throughput approaches for SNP discovery in the transcriptome of the European hake. PloS One 6 (11), e28008. doi: 10.1371/journal.pone.0028008
Morán P., Lundy C., Rico C., Hewitt G. M. (1999). Isolation and characterisation of microsatellite loci in European hake, Merlucius merlucius (Merlucidae, Teleostei). Mol. Ecol. 8 (8), 1357–1358. doi: 10.1046/j.1365-294x.1999.00701_4.x
Munsch S. H., Greene C. M., Mantua N. J., Satterthwaite W. H. (2022). One hundred-seventy years of stressors erode salmon fishery climate resilience in California’s warming landscape. Global Change Biol. 28, 2183–2201. doi: 10.1111/gcb.16029
Nunney L. (1999). The effective size of a hierarchically structured population. Evolution 53 (1), 1–10. doi: 10.1111/j.1558-5646.1999.tb05328.x
Palstra F. P., Ruzzante D. E. (2008). Genetic estimates of contemporary effective population size: what can they tell us about the importance of genetic stochasticity for wild population persistence? Mol. Ecol. 17 (15), 3428–3447. doi: 10.1111/j.1365-294X.2008.03842.x
Peakall R. O. D., Smouse P. E. (2006). GENALEX 6: genetic analysis in Excel. Population genetic software for teaching and research. Mol. Ecol. Notes 6 (1), 288–295. doi: 10.1111/j.1471-8286.2005.01155.x
Pérez M., Presa P. (2008). Validation of a tRNA-Glu-cytochrome b key for the molecular identification of 12 hake species (Merluccius spp.) and Atlantic Cod (Gadus morhua) using PCR-RFLPs, FINS, and BLAST. J. Agric. Food Chem. 56 (22), 10865–10871. doi: 10.1021/jf801700x
Pérez M., Presa P. (2011). “FENOSALT: un método sintético para la extracción de ADN de peces y moluscos,” in Métodos y Técnicas en investigación marina (Madrid: Editorial Tecnos), 79–87.
Piñeiro C., Saínza M. (2003). Age estimation, growth and maturity of European hake (Merluccius merluccius Linnaeus 1758) from the Iberian Atlantic waters. ICES J. Mar. Sci. 60, 1086–1101. doi: 10.1016/S1054-3139(03)00086-9
Pinsky M. L., Palumbi S. R. (2014). Meta-analysis reveals lower genetic diversity in overfished populations. Mol. Ecol. 23 (1), 29–39. doi: 10.1111/mec.12509
Piry S., Luikart G., Cornuet J.-M. (1999). BOTTLENECK: a computer program for detecting recent reductions in the effective size using allele frequency data. J. Heredity 90 (4), 502–503. doi: 10.1093/jhered/90.4.502
Pita A., Fernández-Míguez M., Presa P. (2022). EST-microsatellite types and structural scenarios in European hake fisheries. Animals 12 (11), 1462. doi: 10.3390/ani12111462
Pita A., Leal A., Santafé-Muñoz A., Piñeiro C., Presa P. (2016). Genetic inference of demographic connectivity in the Atlantic European hake metapopulation (Merluccius merluccius) over a spatio-temporal framework. Fish. Res. 179, 291–301. doi: 10.1016/j.fishres.2016.03.017
Pita A., Pérez M., Balado M., Presa P. (2014). Out of the Celtic cradle: The genetic signature of European hake connectivity in South-western Europe. J. Sea Res. 93, 90–100. doi: 10.1016/j.seares.2013.11.003
Pita A., Perez M., Cerviño S., Presa P. (2011). What can gene flow and recruitment dynamics tell us about connectivity between European hake stocks in the Eastern North Atlantic? Cont. Shelf Res. 31 (5), 376–387. doi: 10.1016/j.csr.2010.09.010
Pita A., Pérez M., Velasco F., Presa P. (2017). Trends of the genetic effective population size in the Southern stock of the European hake. Fish. Res. 191, 108–119. doi: 10.1016/j.fishres.2017.02.022
Poulsen N. A., Nielsen E. E., Schierup M. H., Loeschcke V., Grønkjaer P. (2006). Long-term stability and effective population size in North Sea and Baltic Sea cod (Gadus morhua). Mol. Ecol. 15 (2), 321–331. doi: 10.1111/j.1365-294X.2005.02777.x
Rogers A. R. (1995). Genetic evidence for a Pleistocene population explosion. Evolution 49 (4), 608–615. doi: 10.1111/j.1558-5646.1995.tb02297.x
Rogers A. R., Harpending H. (1992). Population growth makes waves in the distribution of pairwise genetic differences. Mol. Biol. Evol. 9 (3), 552–569. doi: 10.1093/oxfordjournals.molbev.a040727
Rousset F. (2008). Genepop’007: a complete re-implementation of the Genepop software for Windows and Linux. Mol. Ecol. Res. 8 (1), 103–106. doi: 10.1111/j.1471-8286.2007.01931.x
Ruzzante D. E., Taggart C. T., Doyle R. W., Cook D. (2001). Stability in the historical pattern of genetic structure of Newfoundland cod (Gadus morhua) despite the catastrophic decline in population size from 1964 to 1994. Conserv. Genet. 2 (3), 257–269. doi: 10.1023/A:1012247213644
Sánchez F., Gil J. (2000). Hydrographic mesoscale structures and Poleward Current as a determinant of hake (Merluccius merluccius) recruitment in southern Bay of Biscay. ICES J. Mar. Sci. 57 (1), 152–170. doi: 10.1006/jmsc.1999.0566
Santos-del-Blanco L., Olsson S., Budde K. B., Grivet D., González-Martínez S. C., Alía R., et al. (2022). On the feasibility of estimating contemporary effective population size (Ne) for genetic conservation and monitoring of forest trees. Biol. Conserv. 273, 109704. doi: 10.1016/j.biocon.2022.109704
Scott F., Jardim E., Millar C. P., Cerviño S. (2016). An applied framework for incorporating multiple sources of uncertainty in fisheries stock assessments. PloS One 11 (5), e0154922. doi: 10.1371/journal.pone.0154922
Shapiro B., Hofreiter M. (2012). “Ancient DNA: methods and protocols,” in Springer Link book series Methods in Molecular Biology, MIMB. Eds. Shapiro B., Barlow A., Heintzman P. D., Hofreiter M., Paijmans J. L. A., Soares A. E. R., 163. (New York: Humana Press)
Tamura K., Stecher G., Peterson D., Filipski A., Kumar S. (2013). MEGA6: molecular evolutionary genetics analysis version 6.0. Mol. Biol. Evol. 30 (12), 2725–2729. doi: 10.1093/molbev/mst197
Tanner S. E., Pérez M., Presa P., Thorrold S. R., Cabral H. N. (2014). Integrating microsatellite DNA markers and otolith geochemistry to assess population structure of European hake (Merluccius merluccius). Estuar. Coast. Shelf Sci. 142, 68–75. doi: 10.1016/j.ecss.2014.03.010
Therkildsen N. O., Nielsen E. E., Swain D. P., Pedersen J. S. (2010). Large effective population size and temporal genetic stability in Atlantic cod (Gadus morhua) in the southern Gulf of St. Lawrence. Can. J. Fish. Aquat. Sci. 67 (10), 1585–1595. doi: 10.1139/F10-084
Turner T. F., Wares J. P., Gold J. R. (2002). Genetic effective size is three orders of magnitude smaller than adult census size in an abundant, estuarine-dependent marine fish (Sciaenops ocellatus). Genetics 162 (3), 1329–1339. doi: 10.1093/genetics/162.3.1329
Van Oosterhout C., Hutchinson W. F., Wills D. P., Shipley P. (2004). MICRO-CHECKER: software for identifying and correcting genotyping errors in microsatellite data. Mol. Ecol. Notes 4 (3), 535–538. doi: 10.1111/j.1471-8286.2004.00684.x
Vucetich J. A., Waite T. A., Nunney L. (1997). Fluctuating population size and the ratio of effective to census population size. Evolution 2017-2021. doi: 10.2307/2411022
Waples R. S. (2002). Evaluating the effect of stage-specific survivorship on the Ne/N ratio. Mol. Ecol. 11 (6), 1029–1037. doi: 10.1046/j.1365-294X.2002.01504.x
Waples R. S., Do C. H. I. (2010). Linkage disequilibrium estimates of contemporary Ne using highly variable genetic markers: a largely untapped resource for applied conservation and evolution. Evol. Appl. 3 (3), 244–262. doi: 10.1111/j.1752-4571.2009.00104.x
Waples R. S., Gaggiotti O. (2006). INVITED REVIEW: What is a population? An empirical evaluation of some genetic methods for identifying the number of gene pools and their degree of connectivity. Mol. Ecol. 15 (6), 1419–1439. doi: 10.1111/j.1365-294X.2006.02890.x
Waples R. S., Punt A. E., Cope J. M. (2008). Integrating genetic data into management of marine resources: how can we do it better? Fish Fish. 9 (4), 423–449. doi: 10.1111/j.1467-2979.2008.00303.x
Wright S. (1931). Evolution in mendelian populations. Genetics 16 (2), 97. doi: 10.1093/genetics/16.2.97
Keywords: APS-, NAPS-, FAPS-microsatellites, effective genetic mortality, European Hake, genetic assessment, fisheries sustainability, Merluccius merluccius
Citation: Fernández-Míguez M, Pita A, Gómez A and Presa P (2023) Temporal uncoupling between demographic and genetic metrics in fisheries assessment: the European hake case study. Front. Mar. Sci. 10:1214469. doi: 10.3389/fmars.2023.1214469
Received: 29 April 2023; Accepted: 10 November 2023;
Published: 13 December 2023.
Edited by:
Kim J. N. Scherrer, University of Bergen, NorwayReviewed by:
Simo Njabulo Maduna, Norwegian Institute of Bioeconomy Research (NIBIO), NorwayNatalia Lam, University of Chile, Chile
Carlos Vergara-Chen, Universidad Tecnológica de Panamá, Panama
Copyright © 2023 Fernández-Míguez, Pita, Gómez and Presa. This is an open-access article distributed under the terms of the Creative Commons Attribution License (CC BY). The use, distribution or reproduction in other forums is permitted, provided the original author(s) and the copyright owner(s) are credited and that the original publication in this journal is cited, in accordance with accepted academic practice. No use, distribution or reproduction is permitted which does not comply with these terms.
*Correspondence: Pablo Presa, pressa@uvigo.gal
†These authors have contributed equally to this work
‡ORCID: María Fernández-Míguez, orcid.org/0000-0002-9465-5467
Alfonso Pita, orcid.org/0000-0001-7608-5782
Antonio Gómez, orcid.org/0009-0005-6824-775X
Pablo Presa, orcid.org/0000-0001-7141-3652