Eukaryotic algal community composition in tropical environments from solar salterns to the open sea
 Charlotte A. Eckmann1,2
  Jessica S. Eberle1
  Fabian Wittmers1
  Susanne Wilken3
  Kristin Bergauer1
  Camille Poirier1
  Marguerite Blum4
  Kriste Makareviciute-Fichtner1
  Valeria Jimenez1
  Charles Bachy1,5
  Mark J. A. Vermeij3,6
  Alexandra Z. Worden1,2,7*
- 1Ocean Ecosystems Biology, GEOMAR Helmholtz Centre for Ocean Research, Kiel, Germany
- 2Ocean Sciences Department, University of California Santa Cruz, Santa Cruz, CA, United States
- 3Department of Freshwater and Marine Ecology, Institute for Biodiversity and Ecosystem Dynamics, University of Amsterdam, Amsterdam, Netherlands
- 4Monterey Bay Aquarium Research Institute, Moss Landing, CA, United States
- 5Sorbonne Université, Centre National de la Recherche Scientifique (CNRS), FR2424, Station Biologique de Roscoff, Roscoff, France
- 6Caribbean Research and Management of Biodiversity Foundation (CARMABI), Willemstad, Curaçao
- 7Josephine Bay Paul Center for Comparative Molecular Biology and Evolution, Marine Biological Laboratory, Woods Hole, MA, United States
Tropical environments with unique abiotic and biotic factors—such as salt ponds, mangroves, and coral reefs—are often in close proximity. The heterogeneity of these environments is reflected in community shifts over short distances, resulting in high biodiversity. While phytoplankton assemblages physically associated with corals, particularly their symbionts, are well studied, less is known about phytoplankton diversity across tropical aquatic environments. We assess shifts in phytoplankton community composition along inshore to offshore gradients by sequencing and analyzing 16S rRNA gene amplicons using primers targeting the V1-V2 region that capture plastids from eukaryotic phytoplankton and cyanobacteria, as well as heterotrophic bacteria. Microbial alpha diversity computed from 16S V1-V2 amplicon sequence variant (ASV) data from 282 samples collected in and around Curaçao, in the Southern Caribbean Sea, varied more within the dynamic salt ponds, salterns, and mangroves, compared to the seemingly stable above-reef, off-reef, and open sea environments. Among eukaryotic phytoplankton, stramenopiles often exhibited the highest relative abundances in mangrove, above-reef, off-reef, and open sea environments, where cyanobacteria also showed high relative abundances. Within stramenopiles, diatom amplicons dominated in salt ponds and mangroves, while dictyochophytes and pelagophytes prevailed above reefs and offshore. Green algae and cryptophytes were also present, and the former exhibited transitions following the gradient from inland to offshore. Chlorophytes and prasinophyte Class IV dominated in salt ponds, while prasinophyte Class II, including Micromonas commoda and Ostreococcus Clade OII, had the highest relative abundances of green algae in mangroves, above-reef, off-reef, and the open sea. To improve Class II prasinophyte classification, we sequenced 18S rRNA gene amplicons from the V4 region in 41 samples which were used to interrelate plastid-based results with information on uncultured prasinophyte species from prior 18S rRNA gene-based studies. This highlighted the presence of newly described Ostreococcus bengalensis and two Micromonas candidate species. Network analyses identified co-occurrence patterns between individual phytoplankton groups, including cyanobacteria, and heterotrophic bacteria. Our study reveals multiple uncultured and novel lineages within green algae and dictyochophytes in tropical marine habitats. Collectively, the algal diversity patterns and potential co-occurrence relationships observed in connection to physicochemical and spatial influences help provide a baseline against which future change can be assessed.
Introduction
Aquatic environments in the tropics comprise areas of high biodiversity (Jablonski et al., 2006) and primary productivity (Behrenfeld et al., 2006). Large environmental gradients occur over short geographic distances, with disparate ecosystems such as salt ponds, mangrove forests, and coral reefs existing in close proximity and hosting unique biota (Nagelkerken and van der Velde, 2002; Hunting et al., 2008). Much of the research concerning phytoplankton in these environments address epiphytic and benthic diatoms, dinoflagellates, and cyanobacteria (Lefrançois et al., 2011; Desrosiers et al., 2014; Alvarenga et al., 2015; Vidal et al., 2015), whereas less is known about free-living eukaryotic phytoplankton that reside in the water column. With respect to molecular diversity surveys, reefs are the best represented of these environments, while mangroves (Samanta and Bhadury, 2014; Hossain et al., 2022), salt ponds (Filker et al., 2015), and comparative studies across environments (Bakker et al., 2019; Becker et al., 2020) are scarcer. Additionally, in many cases different methodologies have been employed making comparison difficult. More generally, recently concerns have been raised that few studies focus on different habitats within close proximity, and how habitat change in one type of aquatic environment might influence connected aquatic habitats (Qin et al., 2019).
Among the more ‘coastal/inland’ tropical island habitats are salt ponds and mangroves. Salt ponds are known for their halophilic phytoplankton, such as the green alga Dunaliella which has been observed in these habitats worldwide using culturing, microscopy, and other methods (Oren, 2005; Ben-Amotz et al., 2019). Ponds with lower but still hypersaline salinity levels exhibit a greater diversity of eukaryotic phytoplankton, including cryptophytes and stramenopiles, as observed in Portugal (Filker et al., 2015). These hypersaline habitats can occur when seawater is totally or partially separated from the open sea, whether by natural mechanisms or human intervention (e.g., for salt production); in the latter case, they are also referred to as solar salterns (Benlloch et al., 2002). Due to their typically large surface to volume ratio these habitats are subject to considerable salinity fluctuations over short timescales, and the cost of osmotic compensation to these fluctuations appears to constrain the biotic community composition (Yang et al., 2016).
Mangroves have their own unique attributes, being prominent features of tropical and subtropical coastlines and formed by salt-tolerant trees and shrubs. They also undergo large daily fluctuations driven by tidal influences on factors such as temperature, salinity, and light availability, among others. They are considered to be among the world’s most productive ecosystems while also being often nutrient-limited (Reef et al., 2010). Multiple studies of phytoplankton in mangroves have been conducted in India and Malaysia, especially focused on diatoms typically using microscopy but also marker gene cloning (Samanta and Bhadury, 2014; Saifullah et al., 2016). Cyanobacteria have also been reported as important to nutrient cycling in mangroves, as well as contributing to nitrogen fixation in African, Indian, Central and South American mangrove habitats (Toledo et al., 1995; Alvarenga et al., 2015). In addition to primary production that occurs in these habitats, including that by benthic microalgae, much of the organic carbon input comes from leaf litter (Saifullah et al., 2016). In general, phytoplankton in mangroves are less well characterized than benthic microalgae (Saifullah et al., 2016) and their overall contributions to photosynthetic carbon fixation is considered highly variable (Kristensen et al., 2008).
As noted above, the tropical aquatic habitats that have been best characterized are coral reefs, which are both oligotrophic and highly productive (Fong and Paul, 2011). The main sources of organic carbon in these ecosystems are considered to be primary production by coralline red algae and the symbioses of corals with dinoflagellates of the family Symbiodiniaceae (Haas et al., 2016; LaJeunesse et al., 2018). Degradation of coral reefs due to anthropogenic influences has led to a shift from calcifying corals and algae to fleshy macroalgae, resulting in increased bacterial abundances in reefs and decreased carbon transfer to higher trophic levels based on data collected from reefs in the Caribbean Sea, Indian, and Pacific Oceans (Haas et al., 2016). While the Symbiodiniaceae-coral association is well-known, the dynamics of free-living phytoplankton in the water column above reefs are less well characterized, but likely important to understanding changes in the system and potential consequences.
Salt ponds, solar salterns, mangroves, and coral reefs can be found in or near the tropical island Curaçao, in the southern Caribbean Sea (~65 km north of South America). Aquatic environments around the island undergo varied influences, with the north shore exposed to the trade winds and therefore largely barren while the southern leeward coast contains salt ponds, mangroves, and fringing reefs (van Duyl et al., 2002). As seen elsewhere, benthic cyanobacterial mats have been observed and reported as performing nitrogen fixation in Curaçao reefs (de Bakker et al., 2017; Brocke et al., 2018). Other research studies have focused on coral-associated microbes (Diekmann et al., 2002; Engelen et al., 2018) and coral feeding, taking into account water column phytoplankton, particularly cyanobacteria, as a food resource (Scheffers et al., 2004; Hoadley et al., 2021). In terms of eukaryotic phytoplankton, stramenopiles, green algae, cryptophytes, and haptophytes have been reported in above-reef Curaçao waters, with stramenopiles and green algae appearing to dominate these groups (Hoadley et al., 2021). To our knowledge, this study is the first multi-year sampling of phytoplankton community composition in Curaçao.
We sought to characterize phytoplankton molecular diversity and community composition from inland environments to the open sea using coherent methods, with additional focus on those groups that appeared to dominate based on amplicon relative abundances. Recently, a number of studies have indicated that the 16S rRNA gene (which is found in the chloroplast genomes of eukaryotic phytoplankton, as well as in bacterial genomes) has a more constrained copy number in eukaryotes than does the nucleus-encoded 18S rRNA gene (Needham and Fuhrman, 2016; Choi et al., 2020). This makes data from the 16S rRNA gene marker potentially closer to representing shifts in cell abundance than the 18S rRNA gene marker. Here, we analyzed the V1-V2 hypervariable region of the 16S rRNA gene (16S V1-V2) from salt pond, saltern, mangrove, above-reef, and farther offshore microbial communities in samples collected annually from 2015 to 2019. In addition to examining microbial diversity and potential co-occurrence of ASVs from different microbial (i.e., including phytoplankton) taxa, ASVs from eukaryotic phytoplankton (plastid-derived) and cyanobacteria were used to characterize the phytoplankton community. A selection of above-reef and off-reef samples was also sequenced for the V4 hypervariable region of the 18S rRNA gene (18S V4) to compare with 16S V1-V2 amplicon data and connect to literature on eukaryotic phytoplankton species that have previously been defined using 18S rRNA gene phylogenies. Collectively, our study provides insights into how phytoplankton diversity and community composition change along the tropical inland – offshore habitat gradient.
Methods
Study sites
Samples were collected in mid-to-late April and early May in the years 2015 (14-23 April), 2016 (19-29 April), 2017 (17-30 April), 2018 (11-18 April), and 2019 (26 April-4 May) at sites spanning the south coast of the island and encompassing salt ponds, salterns, mangrove forests, above-reef, off-reef, and open sea, as detailed hereafter. Salt pond samples were collected from Playa Santa Cruz (~12.307 °N, 69.144 °W) and Spanish Bay/Spaanse (~12.074 °N, 68.862 °W). Saltern samples were collected from Sint Willibrordus (~12.214 °N, 69.054 °W), Sint Michiel (~12.148 °N, 68.998 °W coastal, ~12.156 °N, 68.987 °W inland), and Jan Thiel (~12.089 °N, 68.880 °W). Mangrove samples were collected from within mangrove root systems and in mangrove lagoons (hereafter the entire habitat is referred to as “mangrove”) at Playa Santa Cruz (~12.307 °N, 69.145 °W), the Caribbean Research and Management of Biodiversity foundation (CARMABI)/Piscadera Bay (~12.136 °N, -68.969 °W), and Spanish Bay/Spaanse (~12.136 °N, 68.969 °W) using a sea kayak. More offshore environments were sampled by divers, either swimming from shore or being deposited by boat, and by deploying equipment from a boat. The reefs sampled were located at CARMABI/Piscadera Bay (~12.125 °N, 68.973 °W), Water Factory (~12.109 °N, 68.954 °W), Spanish Bay/Spaanse (~12.136 °N,68.969 °W), and East Point (~12.043 °N, 68.739 °W). Reef water was sampled at both the surface (0-0.5 m) and directly above corals (3-23 m). A shelf of fringing coral reef extends about ~70 m from the shore before sloping down into a ~1000 m deep marine trench. Off-reef samples were collected past the reef above the trench and samples that we characterized as open Caribbean Sea were from ~25 km off the east coast of Curaçao (~12.021 °N, 68.453 °W). Sites were mapped using Google Earth to determine distances relative to the coastline.
Collection of DNA, physico-chemical samples, and initial processing
The general method for collecting water for DNA sequencing varied between habitats. For salt ponds and mangroves, water was collected by submerging 1L amber bottles with care taken to avoid stirring up bottom sediments. For reefs and offshore environments, Niskin bottles or carboys were used. Biomass from ~7 to 515 mL of water (for most samples water volumes were at the upper end of this range, but for some salt ponds and salterns the high particulate load limited the volume that could be filtered) was collected on a sterile 47 mm, 0.2 µm Supor filter (Pall, USA) using a vacuum or peristaltic pump. The filters were stored at -80 °C until DNA extraction. Between samples filtration vessels were rinsed with either reverse osmosis (RO) or 18.2 MΩ water (MilliQ) and left to dry before reuse. In 2017 and 2018, 500 ml volumes of the rinse water were also collected as controls. Also note that DNA filters collected in 2015 and 2016 were flash-frozen in liquid nitrogen before being stored at -80 °C. DNA extractions were performed using the QIAGEN DNeasy Plant kit (QIAGEN, USA) with a modified protocol including a bead-beating step (Cuvelier et al., 2010; Demir-Hilton et al., 2011).
Nutrient samples (silicate, phosphate, nitrate, and nitrite) were collected in 2017, 2018, and 2019 (n=182). For those collected in 2017 and 2018, 40 mL water was filtered through a 0.45 µm polyethersulfone syringe into separate duplicate 50 mL conical tubes and stored at -20 °C until further processing. For nutrient samples collected in 2019, 10 mL of water was collected and stored at -80 °C until further processing. Nutrient samples were measured using an AlpKem autoanalyzer according to protocols from Sakamoto et al., 1990. Salinity was measured using a hand refractometer from 2016-2019. Additionally, the sampling method used in 2019 did not allow for measurements above 100‰; therefore, for the hypersaline samples, the exact value was not measured but was considered above the range in which quantification is possible. Temperature throughout the day was measured for CARMABI/Piscadera Bay mangrove and reef in 2017 and 2019, Spanish Bay salt pond, mangrove, and reef in 2019, Sint Michiel and Sint Willibrordus salterns in 2019, and Water Factory reef in 2019 using a HOBO data logger (Onset Brands, Bourne, Massachusetts). Temperature data for open ocean sites was retrieved from global daily 5 km satellite data from the National Oceanic and Atmospheric Administration Satellite and Information Service.
16S rRNA gene amplicon sequencing, rarefaction, and diversity analyses
DNA from 282 samples coming from the salt pond, saltern, mangrove, above-reef, off-reef, and open sea environments sampled between 2015 and 2019 was PCR amplified using the primers that amplify heterotrophic bacteria, cyanobacteria, and eukaryotic plastid 16S rRNA gene amplicons, specifically the universal primers 27F (5-AGRGTTYGATYMTGGCTCAG-3) and 338R (5-GCWGCCWCCCGTAGGWGT-3) targeting the 16S V1-V2 (Daims et al., 1999; Vergin et al., 2013). Paired-end library sequencing (2×300bp) was performed on PCR products and PCR negative controls using the Illumina MiSeq platform.
Raw sequencing reads were trimmed using cutadapt (v2.6; Martin, 2011) trimming with forward and reverse primers and default settings. Sequence data were trimmed (forward reads to 210 bp and reverse reads to 180 bp for 16S V1-V2), dereplicated, checked for chimeras, and assigned to amplicon sequence variants (ASVs) using the DADA2 R package, version (v1.10.0; Callahan et al., 2016). On average there were 245,708±110,167 resulting 16S V1-V2 amplicons. Note that a Water Factory above-reef sample from 2018 only rendered 430 total amplicons and was excluded from further analyses.
Rarefaction was performed in R using the rareslope function in the vegan package (version 2.5.7) to determine sample saturation (Oksanen et al., 2020). All samples were considered to have reached saturation (final slopes of rarefaction curves less than 0.1). Alpha diversity was calculated based on 16S V1-V2 as the inverse Simpson index using the diversity function in the vegan package. The normality of the alpha diversity distributions was tested using the Shapiro test in the R stats package, and, since not all were normally distributed, the medians between sites and environments were compared using Kruskall-Wallis and Dunn tests (generating the KWDT statistic, herein KWDTS) using the R stats and rstatix packages (Kassambara, 2019). The medians and interquartile ranges of the inverse Simpson indexes were plotted by site and environment using the geom_boxplot function in ggplot2 (Wickham, 2011).
16S V1-V2 rRNA ASV taxonomic assignment
16S V1-V2 ASVs were taxonomically classified using the best node placement mode in the phylogenetic placement pipeline PhyloAssigner (Vergin et al., 2013). ASVs were first placed on a global 16S rRNA gene reference tree (Vergin et al., 2013). Those assigned at the broad level to plastid or cyanobacterial best-node placements were subsequently placed on a more resolved plastid and cyanobacteria reference tree (Choi et al., 2017). Those that were placed with heterotrophic bacteria were then further classified using the SILVA 138 pre-trained Bayesian classifier in QIIME 2 (Quast et al., 2013; Bolyen et al., 2019). Negative (PCR) controls on each plate were also run, appeared negative on gels, and rendered <100 amplicons when sequenced alongside samples. We also ran controls in which 500 ml of RO or 18.2 MΩ water from the research station (used for rinsing filter rigs) was filtered, extracted, and sequenced. One of the latter (2017) rendered amplicons that were assigned to cyanobacteria and eukaryotic algae, and it is unclear whether this derives from well cross contamination or switched samples.
ASVs assigned to the cyanobacterial region of the tree were further classified using a designated phylogeny (Sudek et al., 2015). ASVs assigned to the Viridiplantae, which includes chlorophyte and prasinophyte algae, as well as the newly designated Prasinodermophyta phylum (Li et al., 2020), were then placed on a Viridiplantae reference tree in a second classification step to assign the final taxonomy of these ASVs. ASVs assigned to stramenopiles in the plastid and cyanobacteria placement were re-classified in a multi-step approach using reference trees as described in Choi et al., 2017; Choi et al., 2020.
A subset of green algae could not be placed at terminal nodes using PhyloAssigner, and therefore were manually checked. In the case of salt pond and saltern chlorophyte ASV placements, they were used as blast queries against GenBank nr and found to be Dunaliella. Mangrove, salt pond, and saltern diatom ASV placements were further investigated using them as queries against GenBank nucleotide database. Amplicons from Micromonas clades A and B can be delineated from Clades C, D, and E sensu Šlapeta et al., 2006, but phylogenetic placement of 16S V1-V2 ASVs did not resolve A/B from one another with statistical support; therefore, sequences assigned to the A/B/C lineage as a whole were manually aligned for evaluation of known single nucleotide polymorphisms in the 16S V1-V2 that distinguish them from each other.
Improving Class II classification via connecting 16S (plastid derived) and 18S rRNA gene sequences
Because little information is available connecting 16S rRNA genes and 18S rRNA genes for several uncultured prasinophyte species (which have largely been defined using the 18S rRNA gene), we sequenced the V4 hypervariable region of the 18S rRNA gene for a subset of above-reef and off-reef samples from 2019 (41 in total) so that correlation studies would be possible. Here, DNA was PCR amplified using the primers TAReuk454FWD1 (5’-CCAGCASCYGCGGTAATTCC-3’) and TAReukREV3 (5’-ACTTTCGTTCTTGATYRA-3’) targeting the V4 (Stoeck et al., 2010). Paired-end library sequencing (2×300bp) was performed on PCR products and PCR negative controls using the Illumina MiSeq platform. Sequence data were trimmed (forward reads to 220 bp and reverse reads to 200 bp), dereplicated, checked for chimeras, and assigned to ASVs using the DADA2 R package, version (v1.10.0). Post quality control this rendered 287,092±56,468 18S V4 amplicons per sample. Rarefaction of 18S V4 amplicons was performed as for 16S rRNA gene amplicons.
18S V4 ASVs were initially classified using the sklearn trained classifier and the PR2 database (Guillou et al., 2013). The relevant prasinophyte ASVs were then used to connect 18S rRNA gene derived clade information with the 16S rRNA gene (plastid-derived) ASVs that were the focus of our study. Connections were made by comparing relative contributions of specific amplicons/ASVs to all those from the genus in both 16S V1-V2 and 18S V4 (in the same samples). For example, ASVs determined to be O. bengalensis in the 18S V4 were compared to those predicted to be O. bengalensis in the 16S V1-V2 in samples with both types of sequencing available using Pearson (non-ranked) correlation in the R stats package (R Core Team, 2002). Using this approach, we determined connections between the two types of marker genes for Micromonas candidate species 1 and 2 (again, initially described using 18S rRNA gene sequences (Worden, 2006; Simon et al., 2017) and O. bengalensis (described using molecular phylogenies in Strauss et al., 2023). 16S V1-V2 ASVs were then assigned at the highest taxonomic level possible using manual comparison after initial genus placement using PhyloAssigner as above.
Relative abundances and links to environmental variables
For each sample the relative abundance of eukaryotic algal and cyanobacterial amplicons was computed relative to total phytoplankton amplicons (as the sum of cyanobacterial and plastid-derived 16S V1-V2 amplicons). The percent of each eukaryotic algal group was also computed out of total plastid amplicons in the sample, that is with cyanobacterial and heterotrophic bacterial amplicons removed, or computed at higher taxonomic resolution, for example each prasinophyte group out of all prasinophyte amplicons, or each stramenopile group out of all stramenopile amplicons, or each ASV in the same manner. These relative abundances were plotted as pie charts using ggplot2 (Wickham et al., 2019). Each fraction of the pie represents the relative abundance of the group out of all amplicons in the larger group across the sum of all samples and years per site. The number of individual ASVs per phytoplankton group is specified adjacent to each pie fraction. We also determined the percent of cyanobacterial amplicons out of total amplicons and Prochlorococcus, Synechococcus, and “other cyanobacteria” out of all cyanobacterial amplicons. Heatmaps of relative abundance were generated using the ggplot2 geom_tile function. For the 41 samples that were also sequenced for 18S V4 amplicons, relative abundances of photosynthetic groups (excluding purely heterotrophic groups e.g., stramenopile groups Pseudofungi and Opalozoa) were computed for each sample with alveolates and deep-branching plastid lineages (DPLs) excluded.
Differences in microbial community composition were investigated at the ASV level by site and environment via non-metric multidimensional scaling (NMDS). NMDS plots were generated in R with the vegan and ggplot2 packages using Hellinger-transformed count data of all ASVs (heterotrophic bacteria, cyanobacteria, and plastid-bearing eukaryotes), which in some plots was then subset by ASV type (photosynthetic ASVs, stramenopile ASVs, and green algae ASVs). For the NMDS plot of the entire microbial community, environmental vectors (salinity, nitrate, nitrite, phosphate, and silicate; temperature was not included in this analysis due to too few data points) were superimposed on the plot; note that over the five years nutrients and salinity were not consistently sampled (Table S1), such that in this analysis 182 out of 282 total samples were included.
The possible relationship between silicate and diatom relative abundance out of plastid amplicons was investigated via linear regression initially for all environments and then restricted to samples with salinities <40‰. The potential links between environmental parameters and ASV-level distributions of green algae and chlorarachniophytes were investigated via canonical correspondence analysis (CCA) using the R packages tidyverse, reshape2, and ggplot2 (Wickham et al., 2019). A Variance Inflation Factor (VIF) analysis was performed in order to check for multicollinearity among variables using the car package (Fox et al., 2022). ASV data were normalized using the Hellinger method and both data normalization and CCA were run using the vegan library. The significance of the association of environmental parameters with ASV distribution was determined using the ANOVA-like permutation test for CCA in vegan, anova.cca. Analysis of similarity (ANOSIM) tests were performed on Hellinger-transformed count data of green algal and stramenopile ASVs. This was performed in the vegan package in R to test differences in microbial community composition between environments (Dixon, 2003).
Co-occurrence analyses
In order to contextualize the major photosynthetic groups within the wider microbial community, we conducted a network co-occurrence analysis using the cooccur, igraph, and SpiecEasi packages in R (Csardi and Nepusz, 2005; Kurtz et al., 2015; Griffith et al., 2016). The analysis was performed in two ways. The first involved ASVs that occurred in at least 25% of samples across environments and had a mean relative abundance of at least 0.05%. These cutoff criteria were used to avoid detection of “pseudo” co-occurrence, that occurs when there are a considerable number of rare ASVs found only in a handful of samples, so that those are identified as co-occurrence (although only in a handful of samples) by co-incidence. The second set of criteria, mean relative abundance of at least 0.05% across the top 5 samples in which a given ASV was most abundant, was used in order to detect formation of habitat specific networks in those habitats that made up low proportion of samples and had potentially distinct ASV communities. In both cases significant interactions between photosynthetic ASVs and other photosynthetic or heterotrophic ASVs were plotted in a co-occurrence network with each point representing an ASV and the shape of the point corresponding to the environment type in which it occurs most often.
Results
Microbial diversity across tropical aquatic habitats
To characterize habitats, we evaluated a number of abiotic parameters resulting in five general categories based on local topography and connectivity to the sea: salt ponds (further dividing to salterns and natural salt ponds), mangroves, above-reef, off-reef, and open sea (Figure 1 and Table S1). We then undertook amplicon sequencing for samples from each of these, generating on average 249,603±110,247 (± standard deviation (SD), n=282) 16S V1-V2 amplicons per sample which resulted in 1,554±708 ASVs per sample. By environment, there was an average of 242,637±153,030 amplicons (resulting in 765±502 ASVs) from the 16 salt pond samples, 323,768±124,987 amplicons (resulting in 1,499±810 ASVs) from 41 saltern samples, 241,736±94,365 amplicons (1,685±766 ASVs) from 59 mangrove samples, 233,385±105,086 amplicons (1,628±657 ASVs) from 140 above-reef samples, 236,778±49,835 amplicons (1,302±164 ASVs) from 14 off-reef samples, and finally, 248,352±88,624 amplicons (1,572±598 ASVs) from 12 open Caribbean Sea samples. Rarefaction analysis indicated that saturation was reached for all samples regardless of environment (Figure S1).
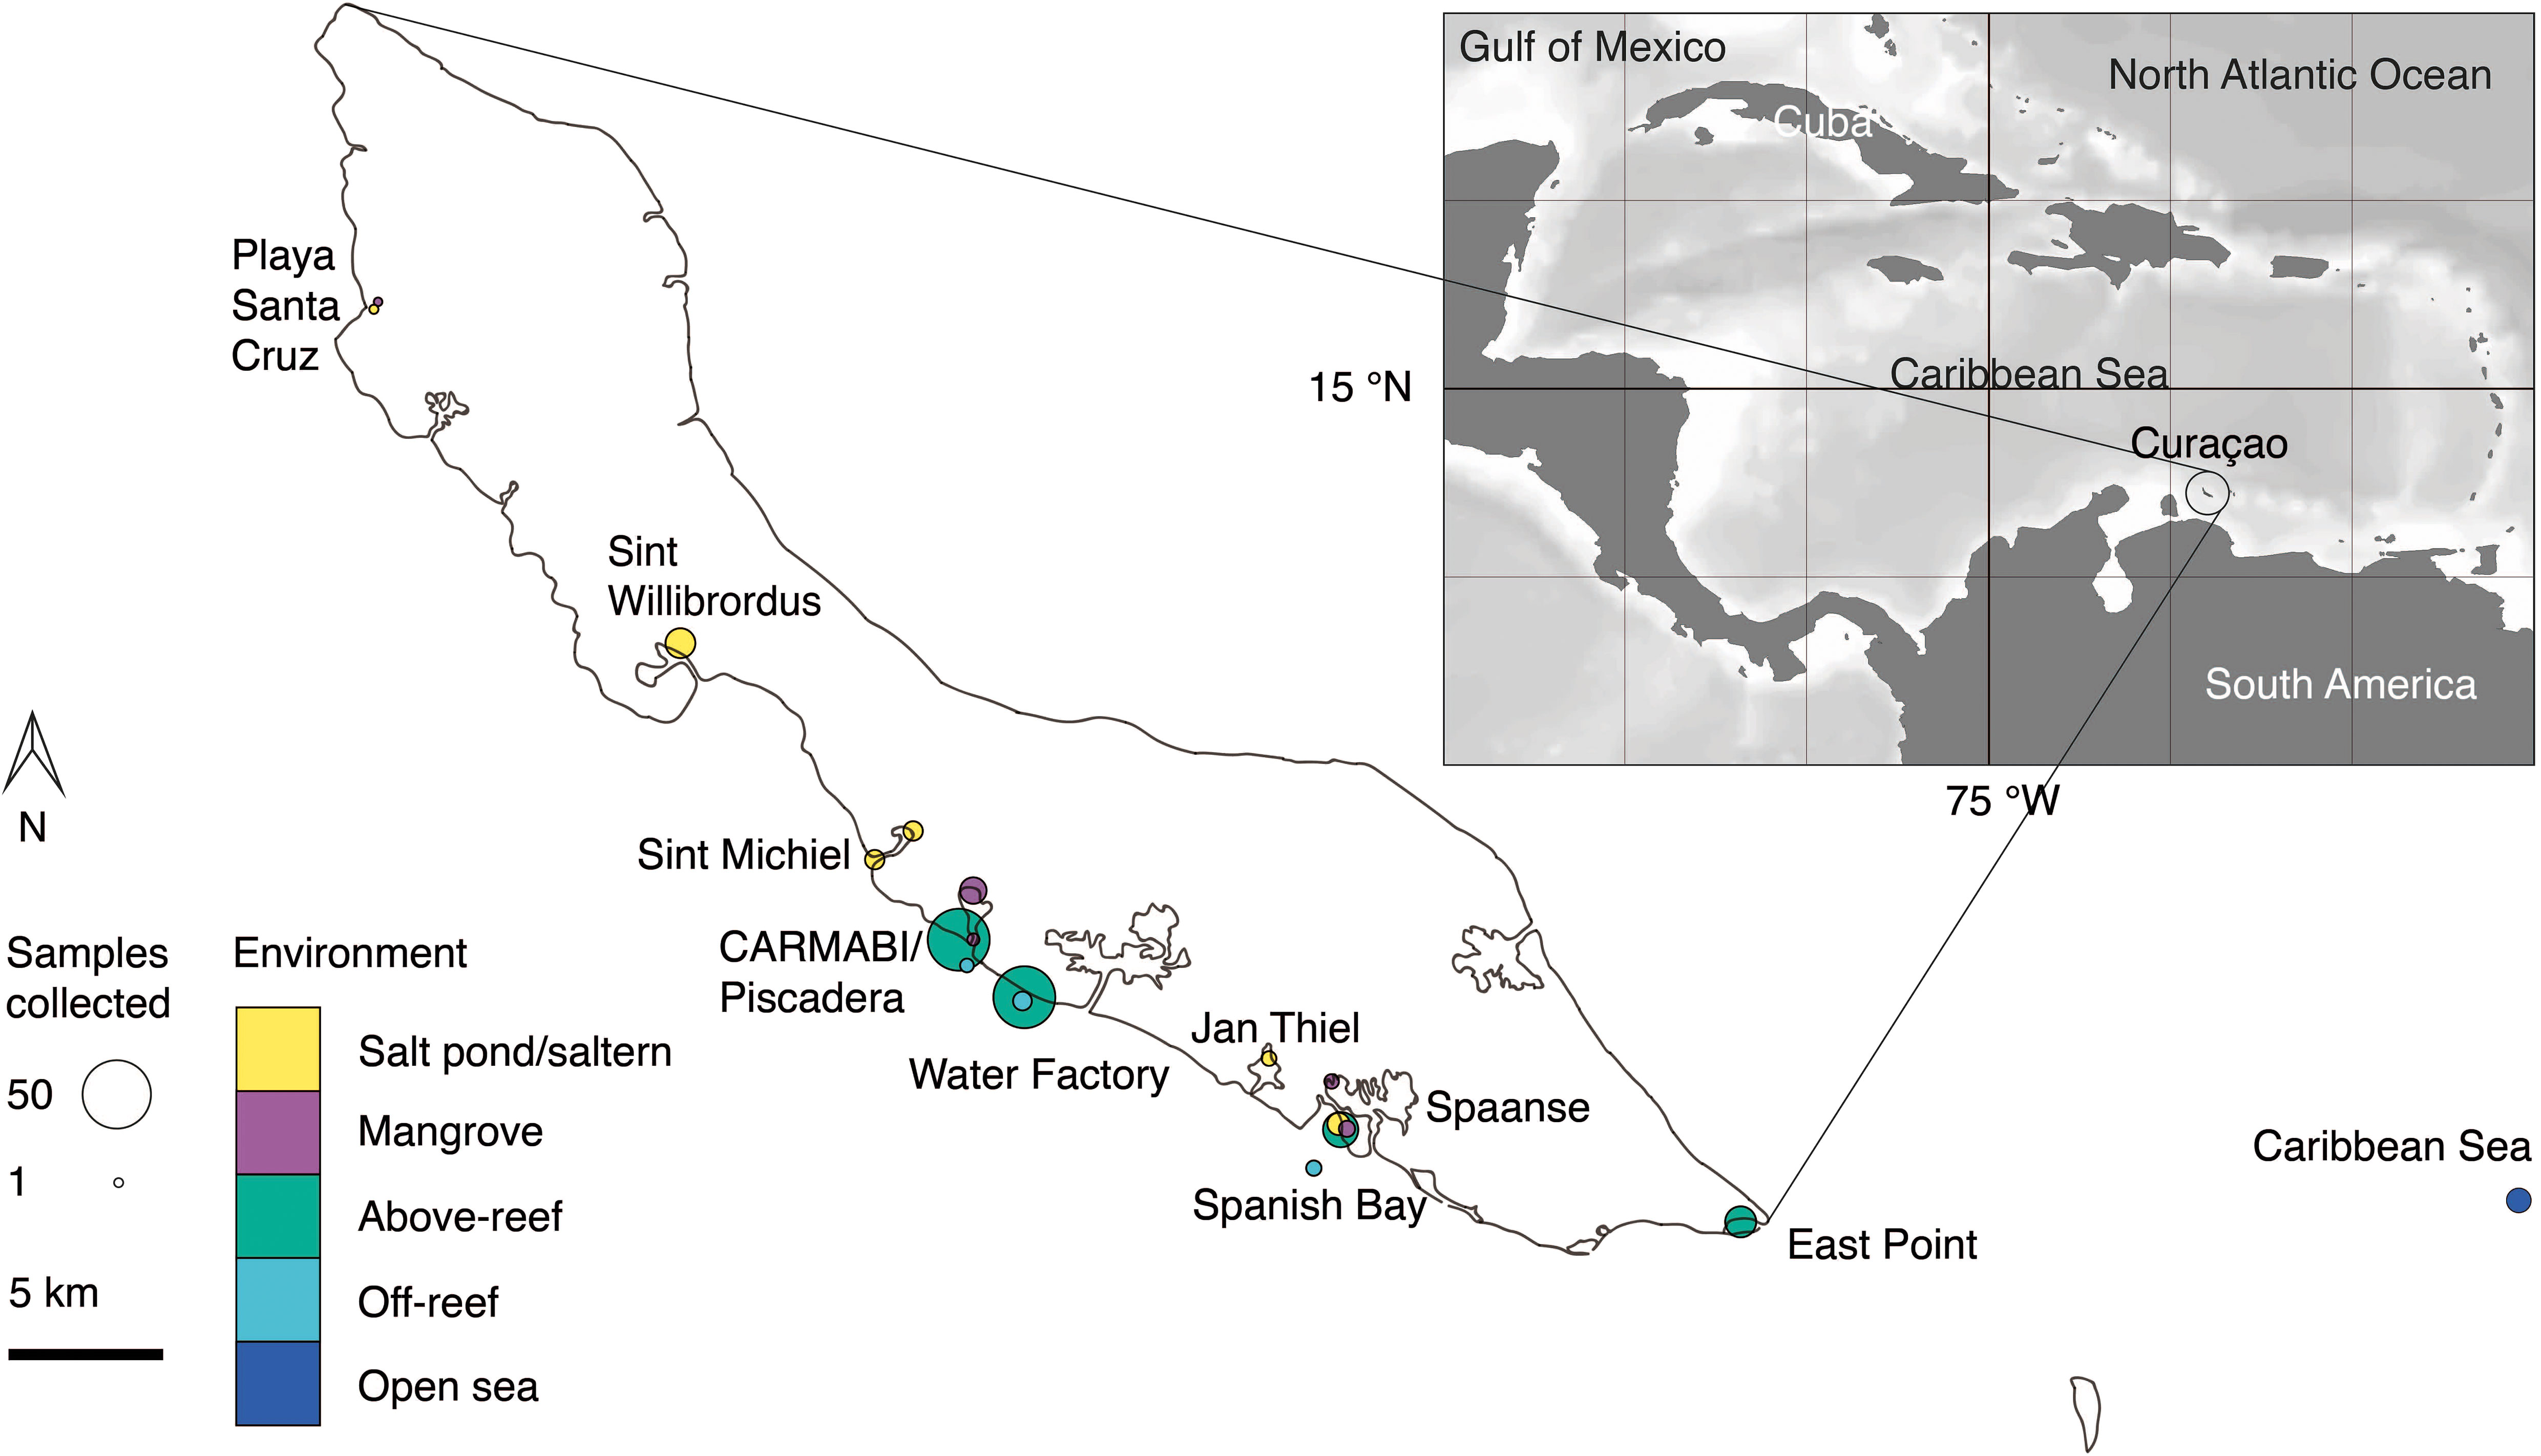
Figure 1 Overview map of sampling sites on or near Curaçao occupied between 2015 and 2019. Environment type is indicated by color and circle radius size indicates the number of samples collected at the site throughout the time series. In total 282 DNA samples were collected, all of which were sequenced for 16S V1-V2 amplicons, and 41 (2019 only) of which were sequenced for 18S V4 amplicons. Inset, location of Curaçao within the Caribbean Sea, with the closest continent being South America.
Microbial alpha diversity was examined by computing the median inverse Simpson index from the ASVs generated from each site and grouped by habitat (Tables S2, S3). Within salt ponds and salterns, Sint Michiel coastal and Sint Willibrordus had the highest median inverse Simpson index, at 38.6±12.9 (± interquartile range) and 27.0±11.0 respectively, followed by Sint Michiel inland (21.0±5.0), Jan Thiel (7.3±1.1), Spanish Bay/Spaanse (6.0± 10.2), and Playa Santa Cruz (3.9) (Figure 2B and Table S2). Significant differences in diversity were found between Sint Willibrordus and Jan Thiel (KWDTS=3.6, p=0.04), Sint Michiel coastal and Jan Thiel (KWDTS=4.6, p<0.001), and Sint Michiel coastal and Spanish Bay/Spaanse (KWDTS=-5.9, p<0.001, Table S3). There were also significant differences in the median inverse Simpson index between Sint Michiel coastal and inshore samples (KWDTS=4.0, p=0.01). Within mangroves, Playa Santa Cruz had the highest average alpha diversity at 39.4, then CARMABI/Piscadera (30.7±13.7), then Spanish Bay/Spaanse (18.8±6.8) (Figure 2B), with significant difference between CARMABI/Piscadera and Spanish Bay/Spaanse (KWDTS=-5.0, p<0.001). There was less variation in above-reef, off-reef, and open sea samples, with no significant differences between sites in those environments (Figure 2B). There was no significant difference between the median inverse Simpson index observed in above-reef samples collected at the surface (25.5±7.1) versus samples taken at depth closer to the corals (25.0±6.6) (KWTS=3.8, p=0.05). Considered together across sites, above-reef, off-reef, and open sea had an overall median inverse Simpson index of 21.9±7.3.
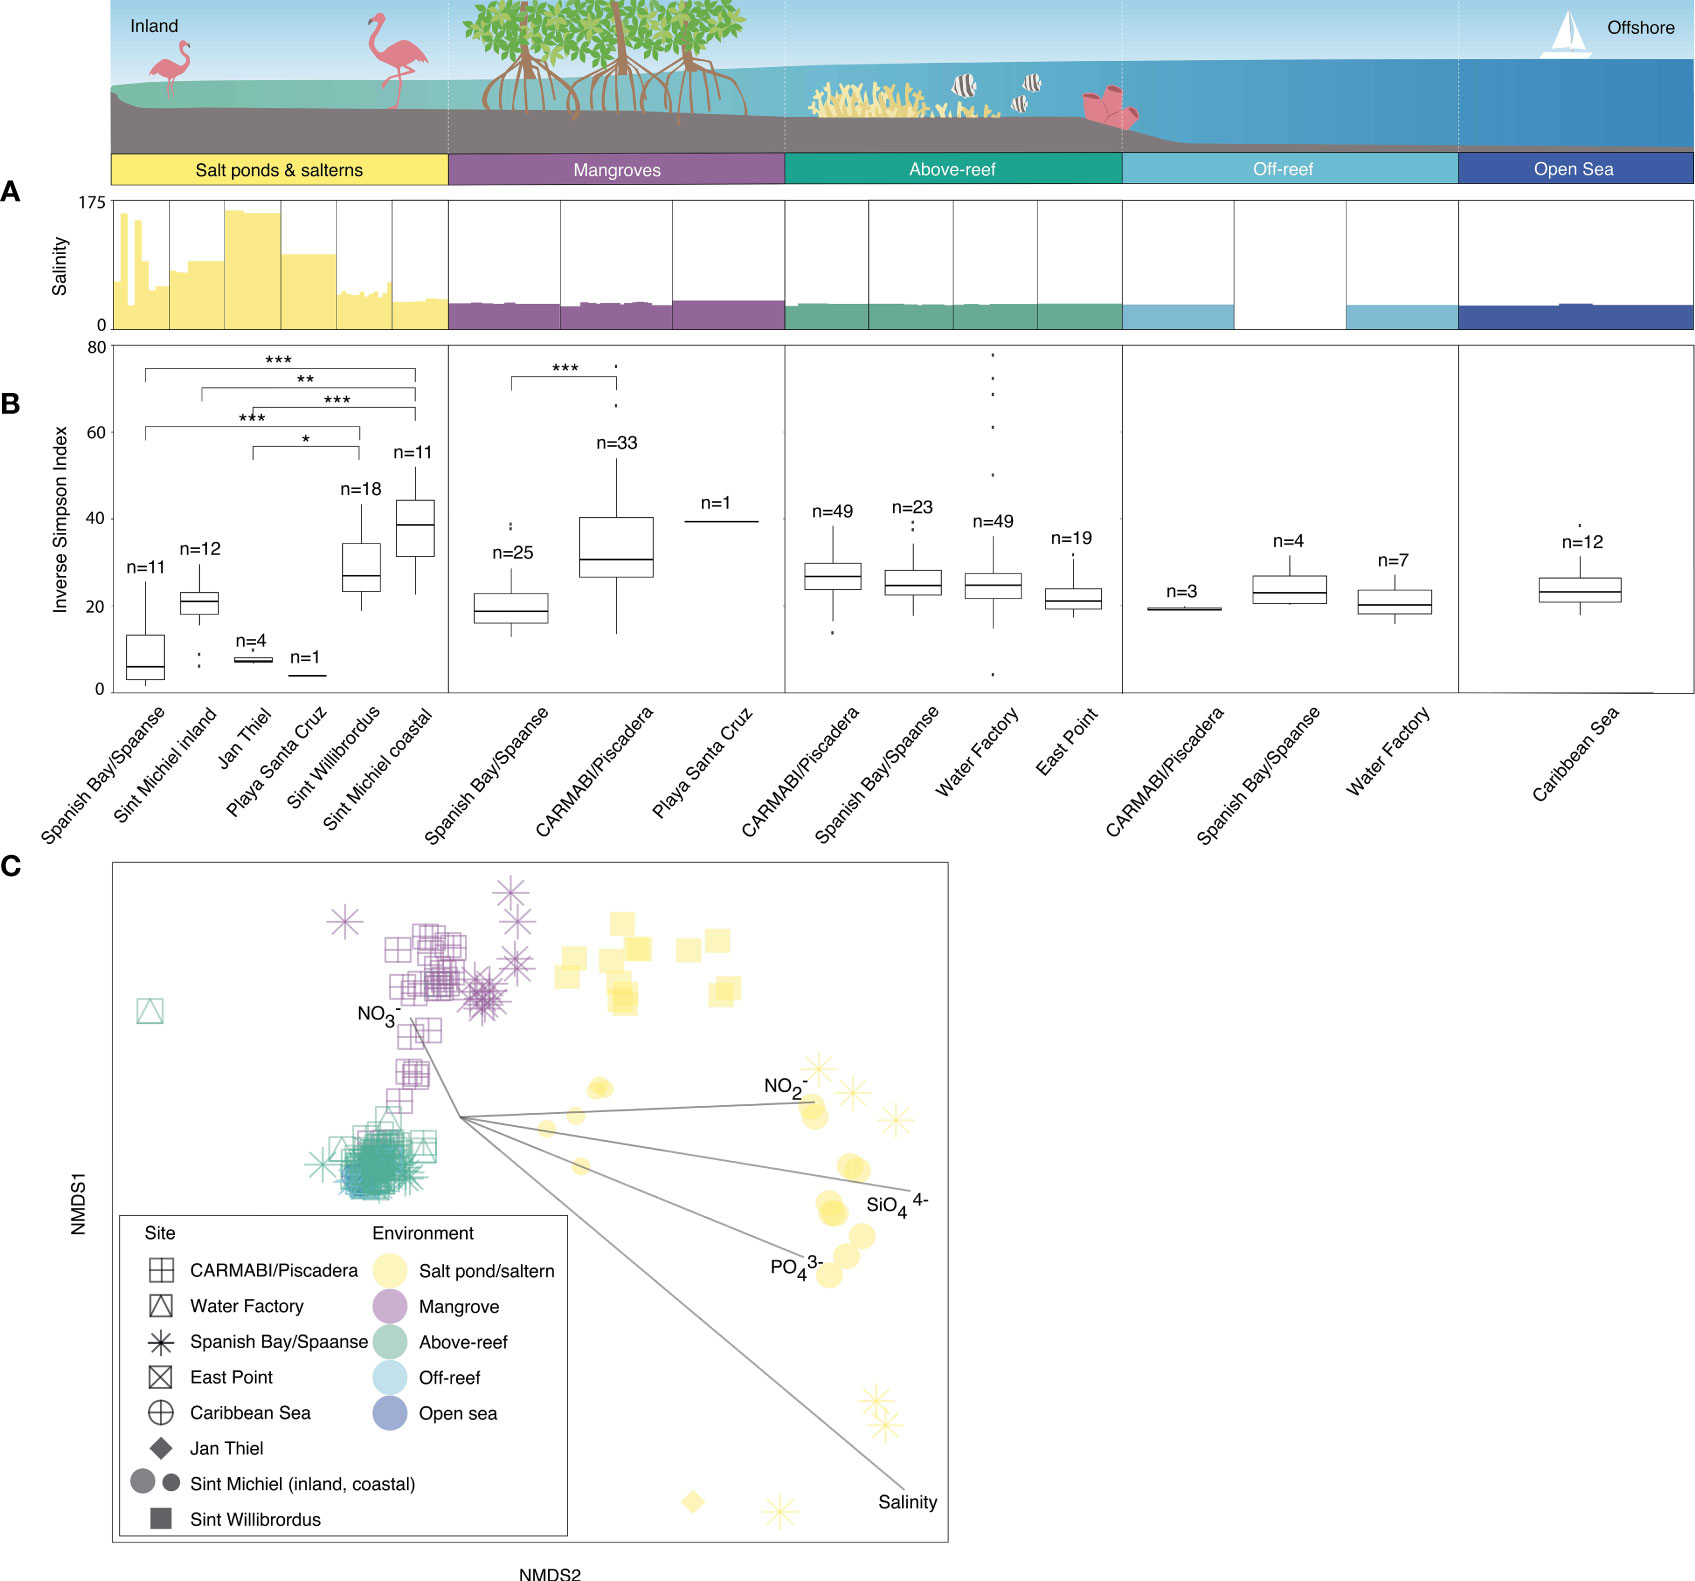
Figure 2 Microbial community diversity based on 16S rRNA V1-V2 amplicons. Variations in salinity (A) and inverse Simpson index (B) as the median and distribution from 2015 to 2019, respectively, from inland to offshore environments. Outliers are shown by individual data points. Significant differences in the median inverse Simpson index between sites are indicated by brackets and asterisks (adjusted p-value of ≤0.05, *; ≤0.01, **; ≤0.001, ***) (Table S3). Note that the Sint Michiel saltern has the highest connectivity to the sea out of the salterns and salt ponds and has one location close to the coastline and the other farther inland. Sint Willibrordus and Jan Thiel, respectively, follow in terms of connectivity to the sea, while the Spanish Bay/Spaanse and Playa Santa Cruz salt ponds have no apparent connection to the sea. (C) NMDS analysis with each point indicating an individual sample, distinguished by site (shape) and environment type (color) and overlain with vectors of environmental parameters (salinity, nitrate, nitrite, phosphate, and silicate) to visualize similarity of the total ASV-level community composition (heterotrophic bacteria, cyanobacteria, and plastid-bearing eukaryotes) among sites and environments. Symbols for open sea and off-reef samples are partially obscured beneath above-reef samples. For off-reef and open sea samples environmental parameter data come from 2017 sampling. Note that the dotted white vertical lines on the cartoon above environments is included to make sure it is clear that the habitats were not necessarily sampled along a linear line, because organization of the natural environment does not necessarily occur in that fashion. Also note that over the five years nutrients and salinity were not consistently sampled (Table S1), such that in this analysis 182 out of 282 total samples were included.
Statistical tests on the diversity indices were also used to compare between environments. These showed for example that the CARMABI/Piscadera mangroves had a significantly higher median inverse Simpson index than the Jan Thiel saltern (KWDTS =-4.2, p=0.004), the Spanish Bay/Spaanse salt pond (KWDTS =-5.9, p<0.001), inshore Sint Michiel (KWDTS =-3.6, p=0.04), and the East Point reef (KWDTS =-3.7, p=0.03). Among other significant differences the Sint Willibrordus and coastal Sint Michiel salterns had significantly higher median inverse Simpson indexes than Spanish Bay/Spaanse mangrove (KWDTS =-3.7, p=0.03 and KWDTS =-4.9, p<0.001, respectively) and likewise, CARMABI/Piscadera reefs had a higher median inverse Simpson index than the Jan Thiel saltern (KWDTS = -3.7, p=0.04), Spanish Bay/Spaanse mangrove (KWDTS = -4.1, p=0.01), and Spanish Bay/Spaanse salt pond (KWDTS = -5.2, p<0.001).
Silicate concentrations were highest in salt ponds (ranging from 18-243 µmol kg-1) and salterns (3-184 µmol kg-1), with the next highest values found in mangroves (0.5-13 µmol kg-1) and the lowest over reefs and farther offshore (overall, 0.2-2 µmol kg-1) (Table S1 and Figure S2). Phosphate and nitrite values followed the same trend, with salt ponds ranging from 0.4-60 µmol phosphate kg-1 and 0.2-6 µmol nitrite kg-1, salterns ranging from 0.1-14 µmol phosphate kg-1 and 0-3 µmol nitrite kg-1, mangroves ranging from 0.1 to 1 µmol phosphate kg-1 and 0-0.7 µmol nitrite kg-1, and reefs and offshore habitats as a whole ranging from 0-0.3 µmol phosphate kg-1 and 0-0.2 µmol nitrite kg-1. Nitrate values were highest above reefs (0.1-6 µmol kg-1) and mangroves (0-3 µmol kg-1) and next highest in salt ponds (0-2 µmol kg-1) and salterns (0-1 µmol kg-1) compared to off-reef and open sea (0-0.1 µmol kg-1) (Table S1 and Figure S2). Salinities ranged from >170‰ at salt ponds to more standard open ocean salinities (e.g., 36‰; Table S1). Water temperatures reached their highest value out of all environments in salterns (ranging from 25.4-36.8 °C), next highest in salt ponds (26.9-31.4 °C), then mangroves (27.0-31.3 °C), and above reefs (24.5-31.1 °C); farther offshore sites do not have temperature data measured in this study, but satellite data indicates temperatures of 26.6-27.2 °C at the time of sampling.
To interrelate microbial ASV diversity to environmental parameters, we performed NMDS analyses that incorporated all samples with available nutrient (nitrite, nitrate, silicate, and phosphate) and salinity data (Table S1). Overall, the environmental vectors in the NMDS plot indicated salterns and salt ponds were associated with higher nitrite, silicate, phosphate, and salinity, while higher nitrate was associated with mangroves and above-reef samples (temperature was not included in this analysis due to too few data points; Figure 2C). Significant differences in microbial community composition were observed among the different environments (Figure 2C; ANOSIM test statistic r=0.72, p<0.001). Microbial communities in above-reef, off-reef, and open sea samples grouped together in an NMDS plot and did not appear significantly different (ANOSIM test statistic r=-0.18, p=0.8, Figure 2C). Additionally, microbial communities from surface and deeper above-reef samples did not exhibit significant differences (ANOSIM test statistic r=0.02, p=0.07; not shown in plot). Mangrove samples also generally grouped together in the NMDS, with more separation based on location, and exhibited some overlap with above-reef and open sea samples (Figure 2C). Within salterns and salt ponds, Sint Willibrordus samples grouped together, Sint Michiel inland and coastal formed two separate groups, and Spanish Bay/Spaanse samples were more varied (Figure 2C). The more coastal saltern samples (Sint Willibrordus and Sint Michiel coastal) grouped closer to other environments than to samples from the inland Sint Michiel, Spanish Bay/Spaanse, and Jan Thiel salt pond/saltern sites (Figure 2C).
Eukaryotic phytoplankton community composition along environmental gradients
To compare the primary producer communities across these habitats, we parsed the photosynthetic component of the microbial community from non-pigmented bacteria and performed taxonomic assignment using previously established phylogenetic approaches (Table S4). Out of all 16S V1-V2 amplicons from photosynthetic taxa (cyanobacterial and plastid-derived amplicons), relative contributions of eukaryotic phytoplankton were variable, with the lowest contributions observed above-reef (8±6%) (Mean ± SD), off-reef (4±2%), and in the open sea (7±7%). Higher contributions were observed in mangroves (33±17%), salt ponds (51±42%), and salterns (44±32%).
Stramenopiles exhibited the highest relative abundances of eukaryotic algal groups except in salt ponds, making up 5±8% of photosynthetic eukaryotic amplicons in salt ponds, 34±23% in salterns, 47±19% in mangroves, 61±16% above-reef, 71±6% off-reef, and 63±20% in the open sea (Figure 3C). Green algae exhibited the next highest relative abundances across environments, comprising 72±39% of photosynthetic eukaryotic amplicons in salt ponds, 31±28% in salterns, 32±15% in mangroves, 31±15% above-reef, 30±17% off-reef, and 24±17% in the open sea (Figure 3C).
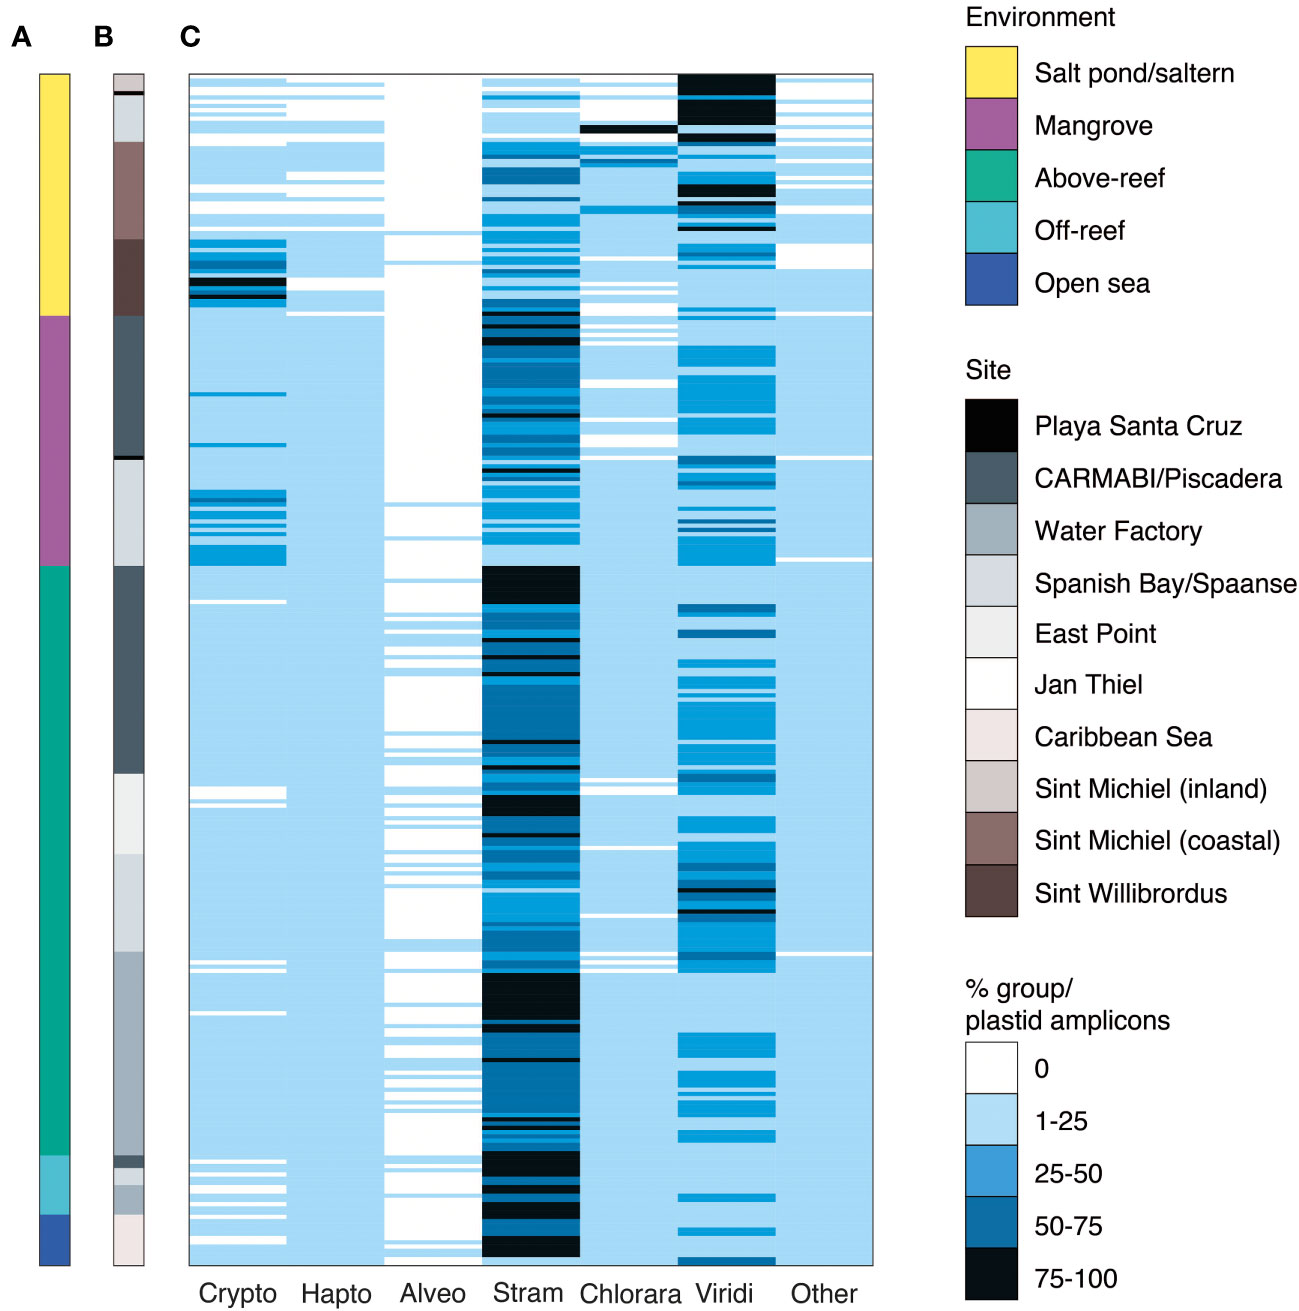
Figure 3 Major phytoplankton groups associated with different Curaçao aquatic environments. Relative abundance of 16S rRNA V1-V2 ASVs assigned to major eukaryotic phytoplankton groups by (A) environment and (B) sampling site. The relative percent abundance of each major photosynthetic eukaryotic group is computed out of all plastid amplicons and is indicated by the heatmap in (C), with each row indicating an individual sample (n=282). Low relative abundance of dinoflagellates may reflect primer biases. Abbreviations are as follows: Crypto, cryptophytes; Hapto, haptophytes; Alveo, alveolates, specifically photosynthetic dinoflagellates; Stram, stramenopiles; Chlorara, chlorarachniophytes; Viridi, Viridiplantae green algae (prasinophytes, chlorophytes and prasinodermophytes); Other, the sum of glaucophytes, rhodophytes, and members of the deep-branching plastid lineages (DPL), averaged 1±2% of plastid-derived sequences and are therefore collapsed for figure simplicity.
Several other major phytoplankton groups exhibited punctuated appearances. For example, cryptophytes had the highest relative abundances among photosynthetic eukaryotes in Sint Willibrordus saltern (43±25%) and had high relative abundances in Spanish Bay/Spaanse mangroves (24±14%) (Figure 3). Likewise, chlorarachniophytes (which contain a green-algal derived plastid) were the major photosynthetic group in some Spanish Bay/Spaanse and Sint Michiel salt pond/saltern samples. Haptophytes and alveolates were also detected, with haptophytes reaching their highest relative abundances above-reef (5±3%), off-reef (10±2%), and in the open sea (7±4%; Figure 3C). Comparison of broad taxonomic distributions for 41 samples in which both 16S V1-V2 and 18S V4 were sequenced indicated similar proportions of photosynthetic groups (Tables S5, S6). Finally, we observed sequences from glaucophytes, rhodophytes, and recently described eukaryotes from the DPLs identified in Choi et al., 2017. These groups had low overall relative abundances (Figure 3C, grouped under “other eukaryotes”). Given the dominance of stramenopiles and green algae over the sampled habitats, and the fact that these groups harbor extensive diversity, we then analyzed them at higher taxonomic resolution.
Variations in stramenopile and green algal diversity
Stramenopiles and green algae represented the two major eukaryotic phytoplankton groups in the ASV data across the habitats (Figure 3C). Each displayed distinct community composition among environments when just considering these two major groups independently (ANOSIM test statistic r=0.64, p<0.001 for each). When analyzing the stramenopile community, those in mangrove habitats, particularly in Spanish Bay/Spaanse, grouped closer to salterns located at Sint Willibrordus than seen for either the whole community NDMS analysis or that for the photosynthetic community (Figure S3). In contrast, above-reef, off-reef, and open sea communities mostly grouped closely, similar to the other NMDS plots (Figure S3). Differences between coastal and inland Sint Michiel samples were observable, but less pronounced than in the NMDS plots with all ASVs (Figures S3A, C).
We next characterized the global averages of different stramenopile groups by averaging the relative amplicon abundances (as percent of total stramenopile amplicons) from each site, using all data collected over the five years regardless of available metadata (e.g., nutrients, etc.). We also determined the total number of ASVs found for each group in those five years.
In salt ponds, the dominant stramenopiles comprised several diatom lineages, but because diatoms were not present in all samples their average contribution across the samples was highly variable (41±44% relative abundance of all stramenopile amplicons). The most abundant stramenopile ASV (ASV7549) was closest to the pennate diatom Synedra hyperborea (98.6% nucleotide (nt) identity). The exception to the overall dominance of diatoms occurred in the Spanish Bay/Spaanse salt pond, which had relatively high but variable contribution of eustigmatophytes (maximum 91%, with an average of 26±40% at this site) (Figure 4A). Salterns were similarly mostly composed of diatoms (84±18%), with ASV308 being the most relatively abundant and closest to the benthic diatom Navicula phyllepta (98.9% nt identity).
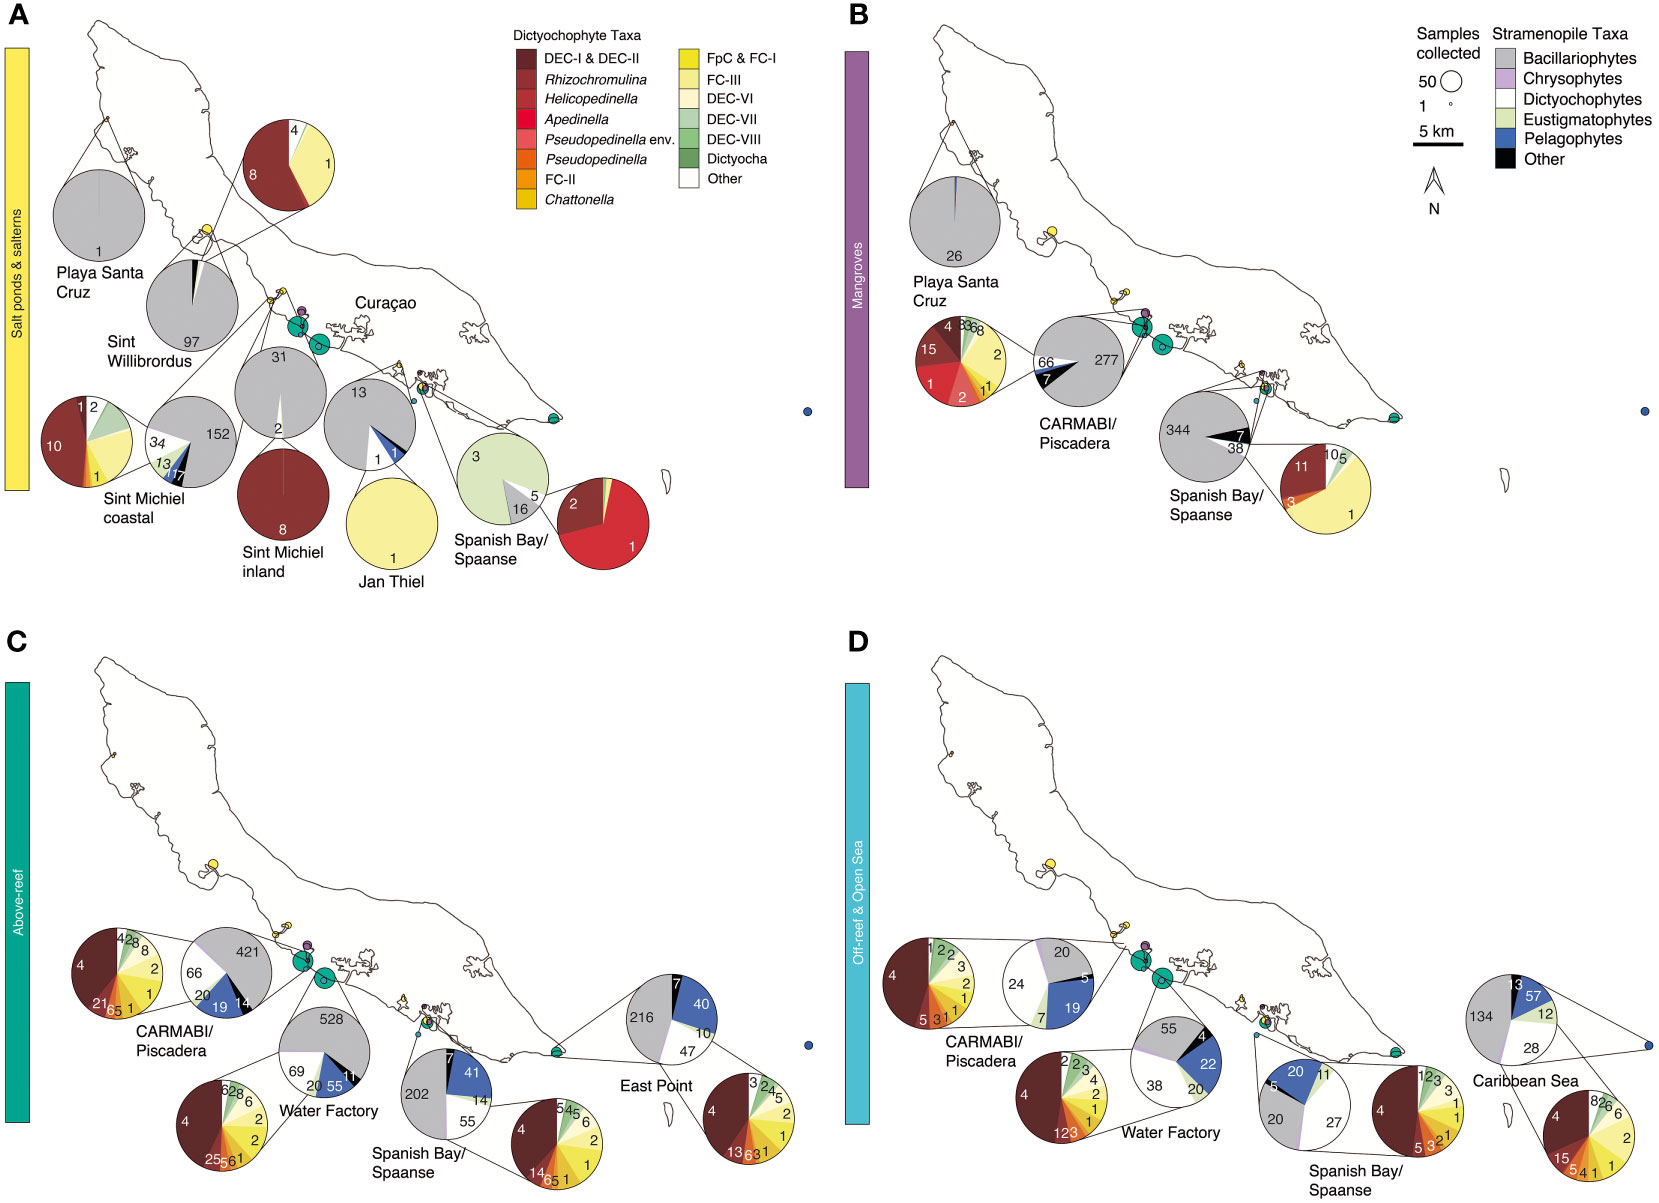
Figure 4 Stramenopile algae and dictyochophytes from salterns to the open sea. Composition of the photosynthetic stramenopile community based on 16S rRNA V1-V2 amplicons out of all stramenopiles and a second, separate and more refined breakdown of dictyochophytes (where present) out of all dictyochophyte amplicons for (A) salt ponds and salterns, (B) mangroves, (C) above-reef, and (D) off-reef and open sea habitats averaged between 2015-2019. Coloring of groups is as indicated in the on-figure color legend. Each pie fraction reflects the relative abundance of the specific group out of all stramenopile amplicons (or out of all dictyochophytes for inset pies), across the sum of all samples (and all years) from that site; the total summed number of ASVs found within each taxonomic group across the 5 sampling years is specified for each pie fraction.
Stramenopile amplicons in mangroves were also dominated by diatoms (82±13%), with ASV97 being the most abundant and closest to members of the Thalassiosirales order (100% nt identity to several species: Thalassiosira profunda, Skeletonema tropicum, Skeletonema costatum, and Skeletonema marinoi). However, moving offshore, diatom contributions declined in terms of relative abundance above-reef (47±17% of stramenopile amplicons), off-reef (27±8%), and in the open sea (40±13%; Figures 4C, D). ASV32, corresponding most closely to Chaetoceros (100% nt identity to C. simplex and C. tenuissimus) was the most relatively abundant diatom ASV across above-reef samples, while in off-reef and open sea samples ASV87 (99.3% nt identity to Tryblionella apiculata) had the highest relative abundances. Above-reef and mangrove diatom taxa overlapped the most, followed by salterns and mangroves (Figure S4A). Just three diatom ASVs were found across all five environment types: ASV32 and ASV87, as above, and ASV620, which corresponds to Rhizosolenia imbricata (100% nt identity). Diatom relative abundance within total plastid amplicons decreased with decreasing silicate concentrations (R=0.55, p<0.001) when saline habitats >40‰ were excluded.
Dictyochophytes and pelagophytes had higher relative abundances in more offshore environments than the other habitats sampled (Figures 4C, D). Dictyochophytes averaged 23±12% of stramenopile amplicon relative abundances above-reef, 40±9% off-reef, and 30±9% in the open sea, and pelagophytes had slightly lower relative abundances among stramenopiles, with relative abundances of 20±9% above-reef, 22±5% off-reef, and 16±8% in the open sea. The major pelagophyte groups across sites and environments based on relative abundances were Pelagomonas calceolata (most relatively abundant ASVs being ASV165 and ASV279) and pelagophyte environmental clade VIII (PEC-VIII, particularly ASV650), apart from Playa Santa Cruz mangroves, which had a majority of pelagophyte environmental clade VI (PEC-VI, especially ASV12487).
Dictyochophytes had higher levels of diversity and distinction among environments than pelagophytes based on phylogenetic analyses. Because of their diversity, and how little is known about dictyochophytes in tropical ecosystems, we analyzed these protists at a higher taxonomic resolution (Figures 4, S4B). Salt ponds and salterns had highly variable dictyochophyte contributions (Figure 4A). Considering only samples that exhibited dictyochophyte amplicons, in Sint Willibrordus and Sint Michiel (n= 28), Rhizochromulina (55±38%) and Florenciella clade (FC) FC-III (22±31%) dominated the dictyochophyte amplicons (Figure 4A), and Sint Michiel coastal samples (n= 10) additionally harbored dictyochophyte environmental (uncultured) clade (DEC) DEC-VII (10±7%) and two environmental clades DEC-I and DEC-II (0.6±0.7%). The most relatively abundant dictyochophytes in Spanish Bay/Spaanse salt pond samples were Rhizochromulina (74±42%) and Apedinella (22±43%), and only Florenciella clade FC-III was detected at one Jan Thiel sample (Figure 4A). Mangroves showed lower relative abundances of dictyochophytes. CARMABI/Piscadera mangroves (n=33) comprised primarily DEC-I and DEC-II (5±11%), Rhizochromulina (21±12%), Apedinella (20±18%), Pseudopedinella environmental clade (15±11%), and Florenciella clade FC-III (27±13%) (Figure 4B). Spanish Bay mangroves were mostly FC-III (46±21%) and Rhizochromulina (30±22%). In above-reef, off-reef, and open sea samples (n=165) the highest relative abundance belonged to DEC-I/DEC-II, which together formed relative abundances of 40±10% out of dictyochophyte amplicons (note these two clades were not resolved from each other), with lesser but consistent contributions from other dictyochophyte groups (Figures 4C, D). Similar to diatoms, above-reef sites had the greatest number of dictyochophyte ASVs that appeared to be unique to that habitat, followed by mangroves and salterns (Figure S4B). Only one dictyochophyte ASV (ASV419) was shared among all environments; however, when salt ponds were excluded this number increased to 19 ASVs (Figure S4B).
The other major supergroup in our study was the Archaeplastida and in particular the Viridiplantae, which in our analyses encompassed three green algal groups, the chlorophytes, prasinophytes, and the prasinodermophytes (Bachy et al., 2022b). NMDS analysis incorporating only green algal ASVs exposed significant differences between above-reef and off-reef samples compared to the open sea (ANOSIM test statistic r= 0.24, p=0.01, and ANOSIM test statistic r= 0.13, p=0.02) (Figure S3D), differing from NMDS results for the total microbial community (Figures 2B and S3A). There was some overlap between mangrove and Sint Willibrordus saltern samples, but not as much as for stramenopiles (Figure S3C). Finally, differences in the more coastal and farther inland Sint Michiel samples were also evident in green algal NMDS analysis (Figure S3D).
The composition of the green algal community also varied across sites and environments. Prasinophyte Class IV (Chlorodendrophyceae) was the only green algal taxon detected at Playa Santa Cruz and also formed a large but variable portion of green algal amplicon abundances in the Sint Michiel inland saltern (35±36%), Spanish Bay/Spaanse salt pond (34±44%), and Sint Willibrordus saltern (48±36%) (Figure 5). The most abundant ASV (ASV27) within this class was phylogenetically placed with Tetraselmis. Chlorophyceae (mostly Dunaliella) reached their highest relative abundance in Spanish Bay/Spaanse salt pond (35±48%) and Jan Thiel saltern (97±6%) (Figure 5). In mangroves, the green algal community shifted almost entirely to Class II prasinophytes (Mamiellophyceae), particularly Ostreococcus and Micromonas, as seen at CARMABI/Piscadera and Spanish Bay/Spaanse (Figure 5B). The major Ostreococcus groups were Ostreococcus Clade OII and an Ostreococcus identical in the 16S V1-V2 to Ostreococcus bengalensis (Strauss et al. 2023; Figures 5B, S5). Here, because this is a newly defined species that has not been cultured, we utilized the 18S V4 ASV data (Table S5) and found that the 18S V4 was also identical to that of O. bengalensis. Major Micromonas groups included Micromonas bravo (Clade E1), Micromonas commoda (Clade A, sensu Simmons et al., 2015), and candidate species 1 and 2 (Worden, 2006; Simon et al., 2017; Figure 5B). The 16S V1-V2 sequences for Micromonas candidate species 1 and 2 were identified based on comparison between 18S V4 amplicons and 16S V1-V2 amplicons analyzed in this paper (Figure S5). In the CARMABI/Piscadera mangroves, 3 out of 28 Micromonas ASVs (3±2% of green algal relative amplicon abundances) could not be assigned at the species or clade level. In the singular Playa Santa Cruz mangrove sample, chlorophytes, specifically members of the class Trebouxiophyceae, including relatives of the halotolerant Picochlorum soloecismus and Chlorella desiccate, as well as an unidentified chlorophyte (phylogenetically closest to the Marsupiomonadales), were the most abundant among green algal amplicons (Figure 5B).
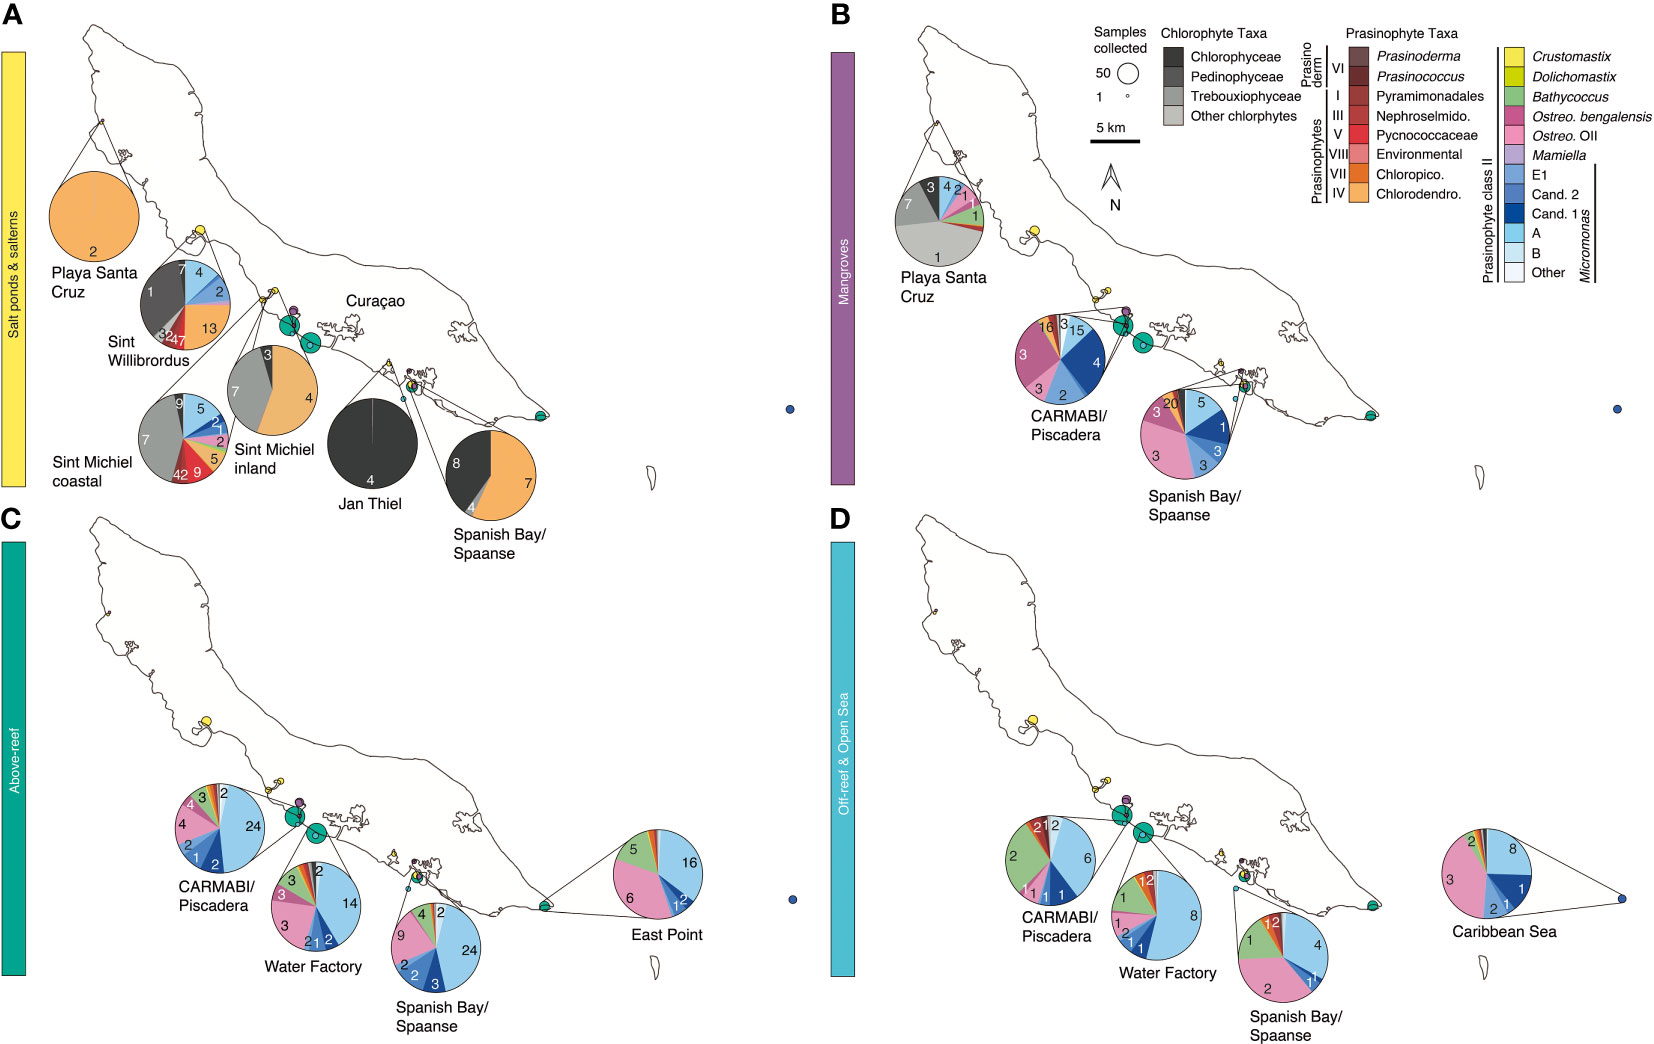
Figure 5 Green algae from salterns to the open sea. Composition of the green algal community by environment and sampling site based on 16S rRNA V1-V2 amplicons for (A) salt ponds and salterns, (B) mangroves, (C) above-reef, and (D) off-reef and open sea habitats spanning from 2015 to 2019. Each pie chart represents relative contributions of the individual taxa within chlorophyte, prasinodermophyte (recently elevated to a separate phylum from prasinophytes), and prasinophyte groups to green algal amplicons, as indicated by colors. The total summed number of ASVs found within each taxonomic group across the 5 sampling years is specified for each pie fraction.
Prasinophytes in above-reef, off-reef, and open sea samples were also dominated by Class II, particularly Micromonas, Bathycoccus, and Ostreococcus. Ostreococcus OII increased in relative importance above reefs and farther offshore compared to mangroves where O. bengalensis rivaled it. Micromonas groups included Clade E1, Clade A, and candidate species 1 and 2, with relatively more Clade A compared to mangrove samples. In above-reef samples two of 33 Micromonas ASVs could not be assigned to a species or clade (<2% of green algal relative amplicon abundances). These two unassigned ASVs were similar to each other (1 nt difference) and otherwise most closely related to members of the Micromonas A/B/C lineage.
A CCA was used to compare green algal distribution and environmental parameters. The VIF analysis showed no multicollinearity among the environmental variables. The CCA showed ASVs from Class II grouped more closely to the nitrate vector in a CCA analysis of green algal ASVs, while other prasinophytes such as Class VII Picocystis, Class V Pycnococcaceae, and Class IV Chlorodendrophyceae grouped closer to the other nutrients and salinity vectors, as did Trebouxiophyceae, Chlorophyceae, and other chlorophyte ASVs (Figure S6). As shown by the permutation test, the CCA ordination was significant (p-value < 0.001) and the environmental variables salinity, phosphate, nitrite, and silicate were significant (p-value < 0.001), explaining most variance.
Green algae and dictyochophytes across habitats
To further tease apart potential differences that might connect to factors not quantified herein, samples were sorted by their proximity to the coast using only the years for which we had the most comprehensive environmental data (2017-2019). This subset of samples exhibited the trends in salinity and nutrients akin to those over the entire sample set. For example, Spanish Bay/Spaanse salt pond (average salinity 71±20‰; 187±80 µmol silicate kg-1) and Sint Michiel inland (96±8‰; 61±27 µmol kg-1) had both higher salinity and silicate than those of Sint Willibrordus (52±3‰; 17±12 µmol kg-1), and Sint Michiel coastal (42±2‰; 4±1 µmol kg-1) (Figures 6A, B and Table S1). Salinities of other environments were less variable, and silicate declined to 4±3 µmol kg-1 in mangroves and was lower above-reef, off-reef, and in the open sea (averaging 0.8±0.3 µmol kg-1; Figure 6B). The highest phosphate concentrations were found in inland salt pond and saltern samples, reaching 3 µmol kg-1 in Spanish Bay/Spaanse and Sint Michiel inland, followed by CARMABI/Piscadera mangroves (reaching 1 µmol kg-1), then declining to <0.3 µmol kg-1 in coastal salterns and other environments (Figure 6C). Nitrate reached a maximum of 3 µmol kg-1 (CARMABI/Piscadera mangroves), followed by 2 µmol kg-1 maximally above-reefs and otherwise <1 µmol kg-1 (Figures 6A–D). Environmental gradients in salinity, silicate, phosphate, and nitrate (Figures 6A–D) corresponded to shifts in the green algal classes present. Specifically, in inland salt ponds (Spanish Bay/Spaanse and inland Sint Michiel) fewer green algal taxa were detected compared to the coastal, sea-connected Sint Michiel saltern, which had more consistent representation of Class II prasinophytes (Figure 6E). O. bengalensis had high relative abundances among green algae in CARMABI/Piscadera mangroves in 2019. Micromonas candidate species 1 dominated green algae relative abundances in 2018 CARMABI/Piscadera and in 2019 Spanish Bay/Spaanse. Micromonas Clade A (sensu Simmons et al., 2015) showed highest relative abundances among green algae in above-reef, off-reef, and open sea environments, across all years and sites, with Ostreococcus OII having similar relative abundances in some samples. Dictyochophytes displayed similar patterns to green algae in that there were fewer dictyochophyte taxa in inland salt pond and saltern samples compared to the coastal Sint Michiel saltern (Figure 6F). Similar to Micromonas Clade A for green algae, DEC-I & DEC-II had the highest relative abundances among dictyochophytes in above-reef, off-reef, and open sea environments.
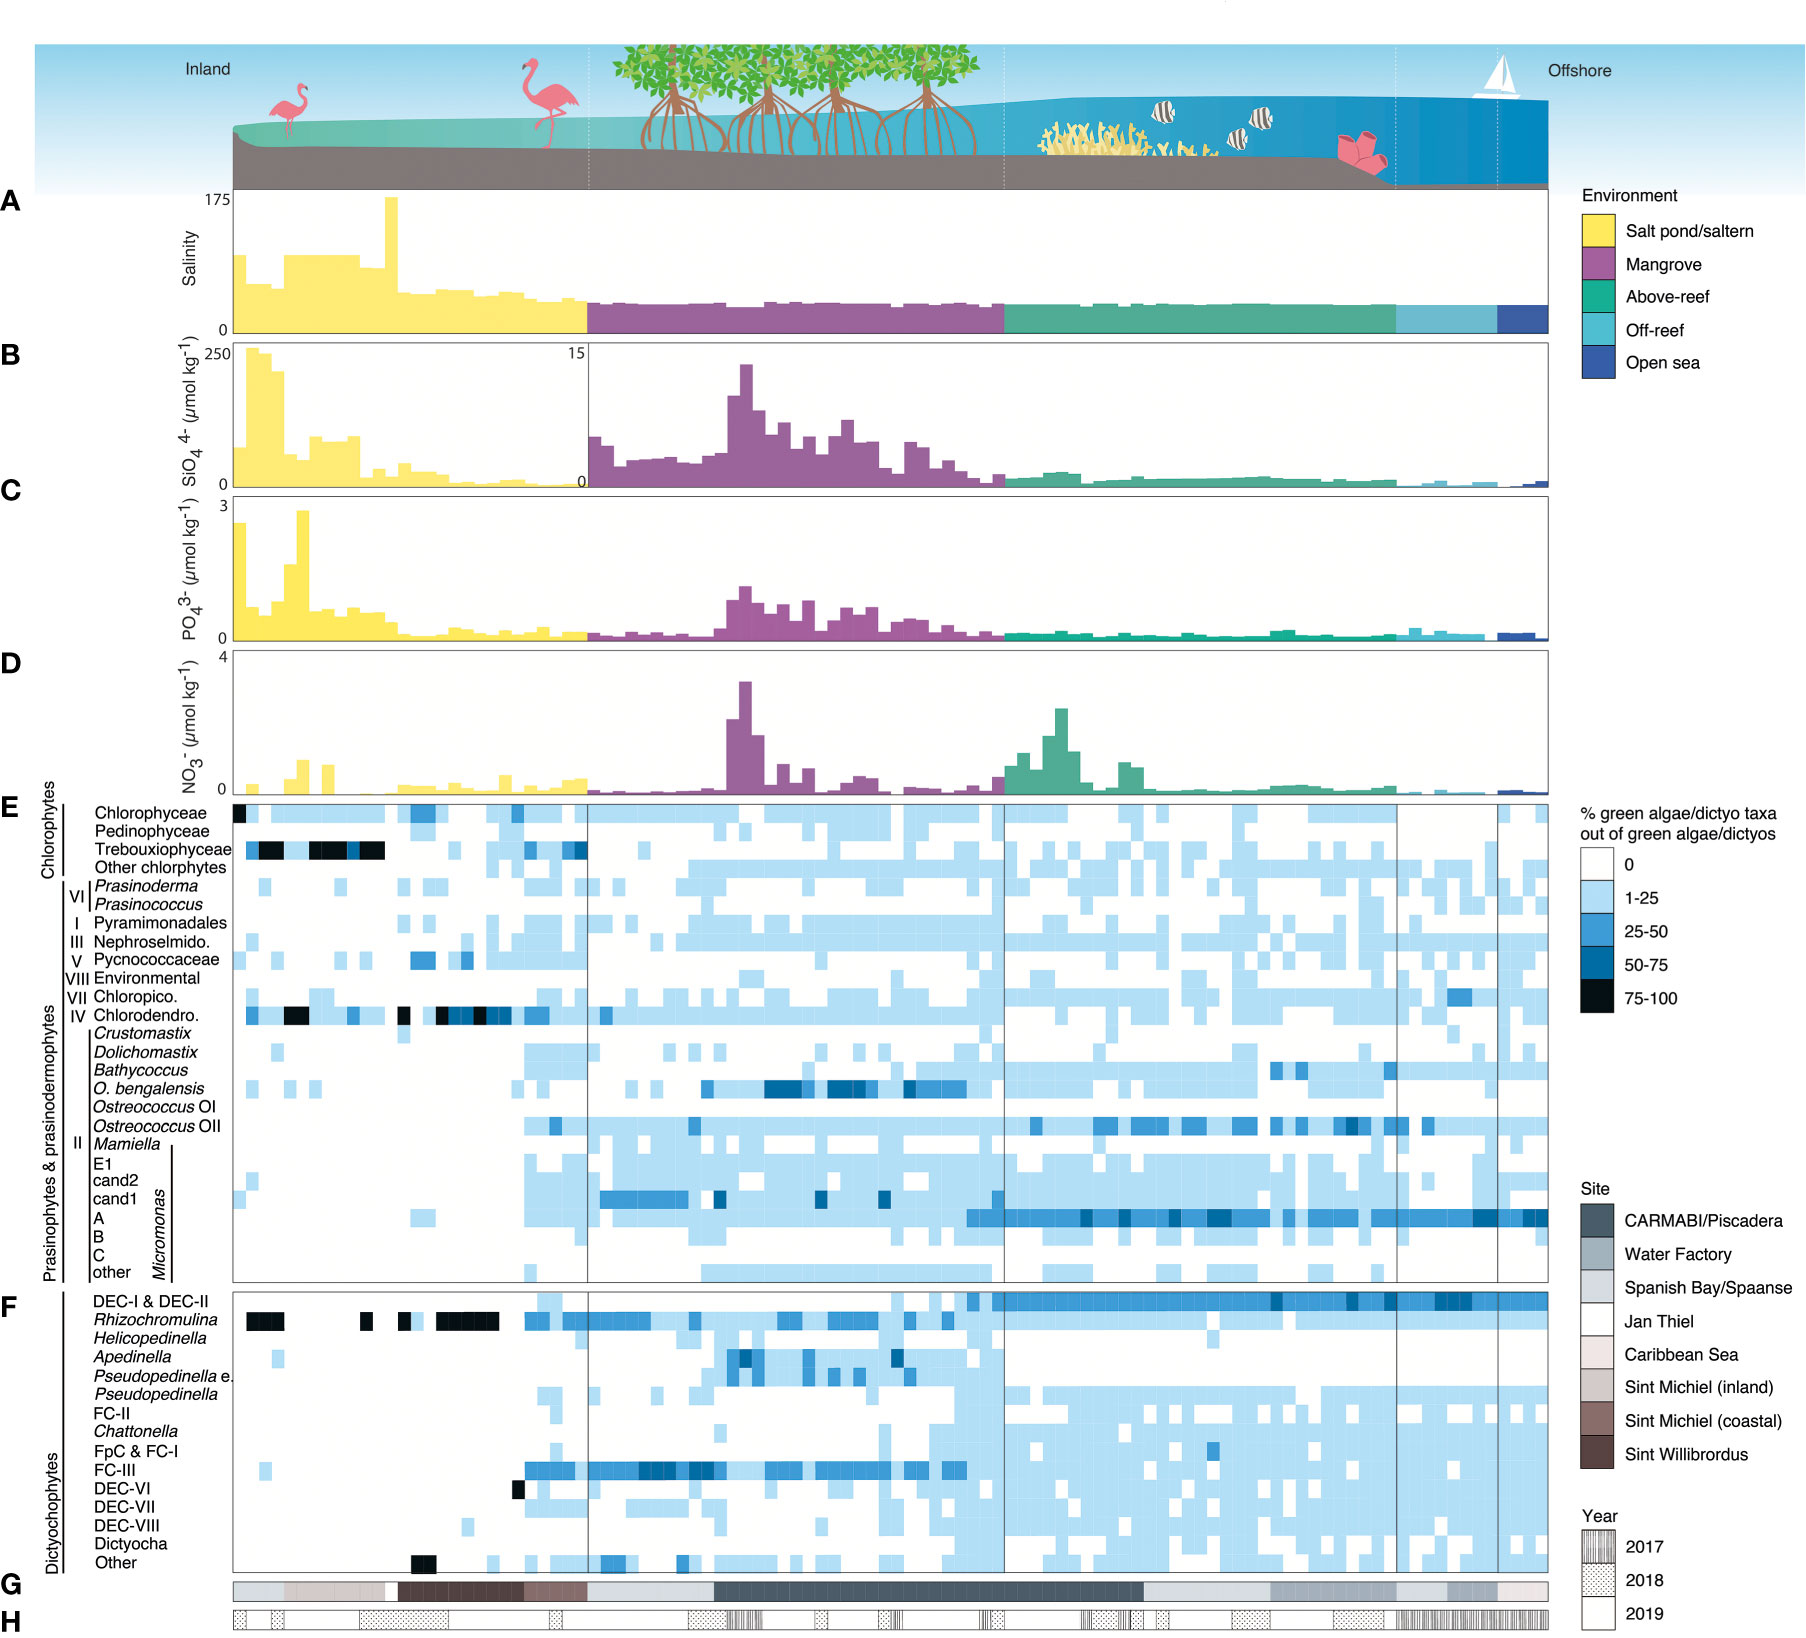
Figure 6 Green algal and dictyochophyte community composition based on 16S rRNA V1-V2 amplicon analyses aligned along a gradient from farthest inland to farthest offshore study sites from 2017 to 2019 (previous years did not have all requisite environmental data). Here relative abundances of ASVs within each group on the Y-axis have been collapsed. Sites were arranged from most inland to most offshore, as determined using the collection site coordinates in Google Earth. Due to the large number of samples ranging over depths above the reef, here only the most surficial samples (0-0.5 m) have been plotted. Salinity (A), silicate (B, note the change in Y-axis scale), phosphate (C), and nitrate (D) are indicated by bar graphs colored according to environment with each bar indicating a single sample. Note that salinity measurements were not available for 2017 off-reef and open sea samples; therefore, average values from 2016 or 2019 were used. In (E) the percent of each green algal group out of all green algal sequences is shown with heat, and in (F) the percent of each dictyochophyte out of all dictyochophyte sequences is shown with heat. The site (G) and year (H) where each sample was collected is also indicated. Dotted vertical white lines on cartoon are as in Figure 2.
Non-eukaryotic phytoplankton community members
Cyanobacteria had higher relative abundances (out of total 16S V1-V2 amplicons including heterotrophic bacteria) above-reef (39±6%), off-reef (41±4%), and in open sea (36±7%) than in mangroves (15±9%) and salt ponds and salterns (11±17%). For salt pond and saltern samples, there were differences by site; groups other than Synechococcus and Prochlorococcus showed highest relative abundances among cyanobacterial amplicons at Jan Thiel, Playa Santa Cruz, Spanish Bay/Spaanse, and the inland Sint Michiel samples. These “other” cyanobacterial amplicons were likely diazotrophic halophiles, with ASV18 having highest nucleotide identity (100-98%) to Cyanothece and Dactylococcopsis salina. Coastal Sint Michiel samples and Sint Willibrordus had higher relative abundances of Synechococcus (70±25%; Figure S7). Mangroves also had Synechococcus as the dominant cyanobacterial group, with average relative abundance of 84±19% out of all cyanobacterial amplicons. In contrast, Prochlorococcus showed the highest relative abundances among cyanobacterial groups in most above-reef (86±13%), off-reef (93±3%), and open sea samples (75±33%; Figure S7).
Co-associations among bacterial and photosynthetic eukaryotic microbial community members
Co-occurrences were assessed between individual phytoplankton taxa (16S V1-V2 ASVs) and within individual habitats when considering the entire microbial community sequenced (Figure 7). At first, analyses were designed to identify co-occurrences that span multiple habitats. Among phytoplankton, cyanobacterial ASVs had the greatest number of network connections, mostly to each other and to heterotrophic bacteria, such as SAR11 and SAR406 (Table S7). The ASV with the overall highest number of connections in this network analysis was Prochlorococcus high light II (HLII) ecotype ASV103, which had 21 connections. Among co-occurrences involving eukaryotes, we found nine diatoms that had significant co-occurrences with other taxa (Figure 7A). For example, Chaetoceros ASV32 was associated with another diatom (ASV245), Synechococcus (ASV73 and ASV186), and various heterotrophic ASVs including Gammaproteobacteria, Alphaproteobacteria (mostly SAR11), and Flavobacteria (NS9 marine group). Diatom Tryblionella apiculata-like ASV87 was likewise associated with Alphaproteobacteria, including SAR86 and SAR11, as well as a Micromonas Clade A ASV126, and pelagophyte ASV165. Pelagophyte P. calceolata ASV165 was additionally associated with Prochlorococcus ASV9, SAR86 ASV48, a Flavobacterium ASV344, Bathycoccus ASV270, and diatom ASV267. Another P. calceolata ASV, ASV279, groups closely with ASV165 and is associated with the same Bathycoccus ASV as above, as well as two alphaproteobacterial ASVs (SAR11 ASV343 and SAR406 ASV320). There were also two dictyochophyte ASVs (DEC-I/DEC-II ASV198 and Florenciella ASV376) that both had significant co-occurrences with diatom ASV267 and planctomycete ASV355. Dichtyochophyte ASV198 was also associated with Prochlorococcus (ASV192), 2 SAR11 ASVs (ASV178 and ASV336) and SAR406 (ASV198). In addition, a number of ASVs from heterotrophic bacteria exhibited co-occurrences, largely from the classes Alphaproteobacteria (particularly clades SAR11, SAR406, and SAR116) and Bacteroidota (particularly the order Flavobacteriales) (Table S7).
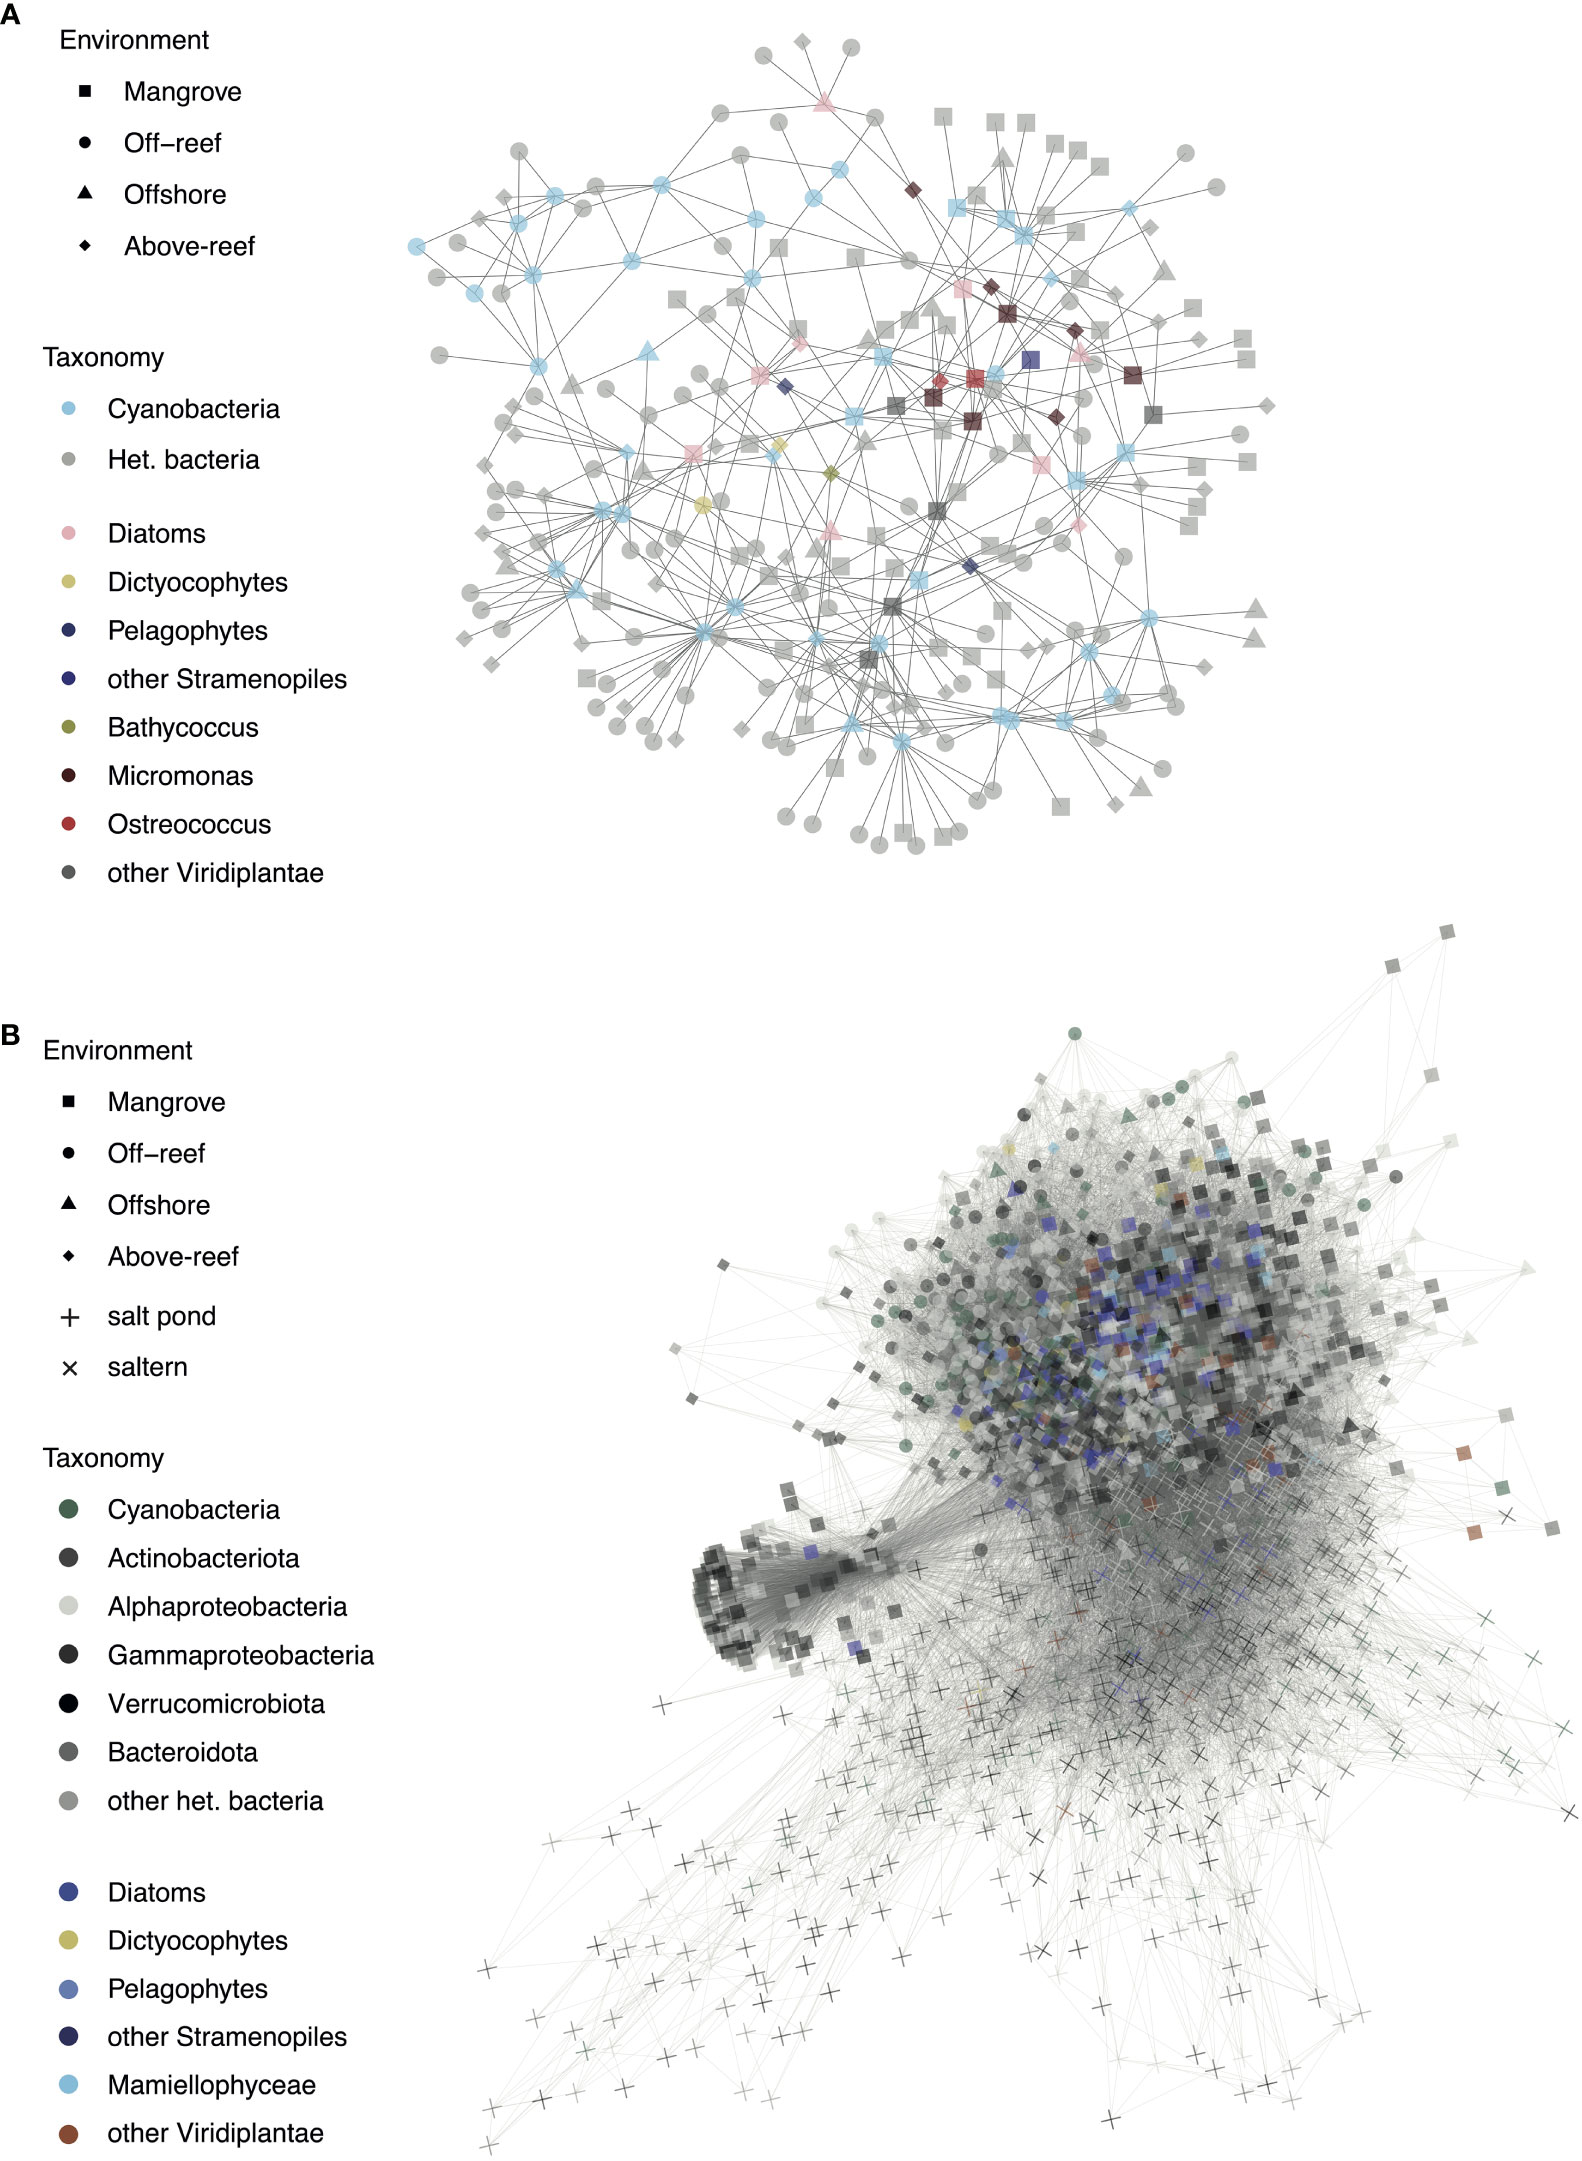
Figure 7 Significant co-occurrences observed in microbial taxa across habitats and habitat specific community members. (A) Network co-occurrence analysis of ASVs that occurred in at least 25% of samples across environments and had a mean relative abundance of at least 0.05% and (B) Network co-occurrence analysis of ASVs with a mean relative abundance of at least 0.05% across the top 5 samples in which a given ASV was most abundant. For both networks, significant interactions between photosynthetic ASVs and other photosynthetic or heterotrophic ASVs are shown with each point representing an ASV and the shape of the point corresponding to the environment type in which it occurs most often.
Green algae tended to group together in the network and had various interconnections (Figure 7A and Table S7). Micromonas Clade A ASV126, mentioned previously, was associated with other Mamiellophyceae: Ostreococcus OII (ASV133) and Micromonas candidate species 2 (ASV235). Micromonas candidate species 1 ASV129 was associated with a cryptophyte (ASV164), Micromonas Clade E1 (ASV187), Micromonas candidate species 2 (ASV235), a diatom (ASV204), Synechococcus (ASV106), SAR116 (ASV105), Flavobacteriales (ASV69), and a gammaproteobacterium (ASV316). Micromonas candidate species 2 ASV235 was also associated with a cryptophyte (ASV164) and two Micromonas clade A, ASV228 and ASV480. Micromonas Clade E1 ASV187 was additionally associated with SAR406 (ASV320), Synechococcus (ASV414 and ASV73), two cryptophytes (ASV164 and ASV524), a diatom (ASV204), Micromonas Clade A (ASV228), Micromonas candidate species 1 (ASV441), and O. bengalensis (ASV144). O. bengalensis ASV144 was itself associated with SAR11 (ASV94, ASV251, ASV172, and ASV199), diatoms (ASV204, ASV207, and ASV245), and Micromonas candidate species 1 (ASV441).
The second analysis has lower stringency for inclusion in that the ASVs did not have to occur in at least 25% of the samples, and thus it grouped the more extreme habitats with lower sampling effort to a great extent. Salt pond and saltern ASVs largely grouped separately from the other environments and had a large proportion of heterotrophic bacteria (Figure 7B). While some mangrove samples grouped with above-reef and farther offshore samples, a subset of mangrove samples, mostly consisting of heterotrophic bacteria including those from the phyla Actinobacteriota and Bacteroidota, formed their own section of the network. Mangroves had the greatest number of photosynthetic eukaryote-heterotrophic bacterial interactions with 2101, followed by above-reef (1027), salterns (702), off-reef (232), open sea (225), and salt ponds (69). Off-reef samples had the greatest number of cyanobacterial-heterotrophic bacterial interactions with 774, followed by above-reef (620), salterns (461), mangroves (438), salt ponds (124), and open sea (121). Of photosynthetic groups, cyanobacteria had the most connections with heterotrophic bacteria with 6512, followed by diatoms (6101), Mamiellophyceae (1678), other Viridiplantae (1665), other stramenopiles (883), and dictyochophytes (854).
Discussion
Our study sites spanned a range of distinct tropical island aquatic habitats. In general, these types of environments are under marked anthropogenic influences, both local (van der Schoot and Hoeksema, 2022) and climatic (Bove et al., 2022), and hence it is important to establish coherent relatable data sets for different regions within tropical ecosystems for benchmarking potential downstream changes. There were differences in the level of connectivity to the sea and/or human impact between sites within the same habitat type. For example, among mangroves, those at Playa Santa Cruz were the most remote, while Spanish Bay/Spaanse had more nearby human development, and CARMABI/Piscadera Bay was near the most developed part of the island (Brocke et al., 2015). We sampled above the shelf of fringing reef corals, which extend about 70 m from the shore, at CARMABI and the Water Factory located toward the midpoint of the island perimeter (again in a more anthropogenically forced area) as well as East Point, which is less impacted. A study of the impact of eutrophication on coral reef fauna around Curaçao found that sewage run-off was high around CARMABI/Piscadera, Water Factory, and Spanish Bay, while Sint Michiel and sites farther north from that had lower sewage output, as determined using δ15N isotope data (van der Schoot and Hoeksema, 2022). Our off-reef samples were collected just past the reef above the 1000 m trench, while the open sea samples were from ~25 km away from shore (Figure 1), both presumably being less impacted by human activities. We also delineated two types of salt ponds based on the level of anthropogenic modification, the first being salterns (Sint Willibrordus, Sint Michiel inland and coastal, and Jan Thiel) which have undergone construction of retaining walls to isolate areas for evaporative salt harvesting – but with the former two sites having inflow of fresh salt water in order to replenish the system. The second type was natural salt ponds (Playa Santa Cruz and Spanish Bay/Spaanse).
In general, our results indicated a number of differences in environmental parameters, with salinity perhaps being the most predictable (Figures 2, 6, and Figure S2). Water temperatures around Curacao remain fairly constant, between ~26–29 °C (Brocke et al., 2015), although they were sometimes much higher in the inland environments we sampled (Table S1). Trend-wise, silicate and phosphate concentrations were higher in salt ponds, salterns, and mangroves compared to above-reef, off-reef, and in the open sea. Nitrate concentrations were highest in mangroves and above reefs, particularly those at CARMABI/Piscadera. However, deconvoluting these results further to degree of impactedness was not within reach without more comprehensive sampling. A study from similar habitats sampled at St. John (also Caribbean) also reported higher phosphate and silicate in mangrove samples than on nearby reefs (Becker et al., 2020). However, in their samples, mangroves had higher nitrite+nitrate concentrations compared to reefs, and hence may not be highly analogous to our study region. Given the upfront differences in organic matter apparent in our samples (not measured, but higher in mangroves and inland settings, as also reflected in filtration rates, than e.g., open sea), our goal was to determine if there were systematic differences in microbial diversity and phytoplankton communities between the sampled sites and habitats. We demonstrated that there is pronounced site-specific divergence in diversity and specific network connections. Moreover, comprehensive evaluation of the phytoplankton communities, with particular attention to the molecular diversity of eukaryotic groups that exhibited the highest relative abundances and/or the broadest distributions, exposed unique aspects of communities residing in each of the sampled habitats.
Microbial diversity across Caribbean Sea and island tropical aquatic habitats
In terms of the microbial community, that is heterotrophic bacteria, cyanobacteria, and eukaryotic phytoplankton (all 16S rRNA V1-V2 ASVs, Figure 2), the highest diversity levels were found at the Sint Michiel coastal and Sint Willibrordus salterns and the CARMABI/Piscadera and Playa Santa Cruz mangroves (Figure 2B). A considerable amount of this diversity was likely contributed by bacterial taxa. Perhaps counterintuitively, the human-made salterns exhibited higher diversity than natural salt ponds, likely due to differences in seawater replenishment and delivery and mixing in of ‘external’ communities via channels from the sea. A relationship between overall salinity levels and diversity was also observed, akin to a 18S V4 rDNA-based study of protists and fungi in Portuguese salt ponds where diversity decreased as salinity increased (Filker et al., 2015). Here in the higher salinity salt pond and saltern samples, specifically Spanish Bay/Spaanse and inland Sint Michiel, had lower diversity than the lower salinity Sint Willibrordus and coastal Sint Michiel salterns (Figures 2A, 6A). Note that higher water volumes (~500 mL) were filtered for mangrove, above-reef, off-reef, and open sea samples, as compared to some salt pond and saltern samples where low volumes were obtained due to high biomass and particulates in the water. This could have influenced diversity indices. However, we found that all salt pond and saltern samples did saturate in rarefaction analysis (Figure S1).
With respect to mangroves, the highest microbial diversity was found in the CARMABI/Piscadera mangroves. It is unexpected, given that these mangroves are closer to a heavily populated location than other areas and our results show that they are exposed to higher nutrient levels (Figures 6B–D; Brocke et al., 2015). As for above-reef sites, those at CARMABI and the Water Factory are similarly located toward the midpoint of the island in a more anthropogenically impacted area, while the East Point reef is farther from human activity (Brocke et al., 2015). However, here statistical differences were not observed in microbial alpha diversity between CARMABI/Piscadera and Water Factory reefs and the less human-impacted reefs at East Point (Figure 2B). There were also no significant differences in median inverse Simpson index or microbial community composition with depth in above-reef samples.
Broad transitions in primary producer groups across habitats
Explicit analyses of the primary producer communities were used to move beyond single group or single environment studies to try to understand the complete community that contributes to tropical primary production across habitats. Prior studies have shown phytoplankton are important primary producers in the tropics (Kristensen et al., 2008); diatoms can be prey for zooplankton (Hu et al., 2020), and picophytoplankton, including cyanobacteria and small eukaryotes, can be consumed by sponges (McMurray et al., 2016) and corals (Hoadley et al., 2021). However, there is much to be learned about overall contributions taking a more agnostic approach. While tentative at best, we found that the eukaryotic phytoplankton community, as determined by 16S V1-V2, exhibited similar proportions of major groups as seen in 18S V4 analyses in the 41 above-reef and off-reef samples that were sequenced for both markers (Table S6). Note that for this analysis DPLs (Choi et al., 2017) were excluded because their 18S rRNA gene sequence is not known, and alveolates were excluded due to issues with partitioning photosynthetic from heterotrophic lineages using 18S rRNA genes sequences, issues which arise from their diversity and complicated evolutionary history (Moreira and López-Garcıía, 2002; Leander and Keeling, 2003). Putative underrepresentation of haptophytes by the 16S V1-V2 primers did not appear to significantly bias the general patterns herein given that higher relative percentages were detected in 16S V1-V2 than 18S V4 (Table S6). The inflation of stramenopiles in 18S V4 data may be due to inclusion of heterotrophic members that are closely related to photosynthetic taxa, and potentially could have been included with them. Sequencing of 18S V4 was undertaken and used to refine knowledge of uncultured lineages for which pairing between 18S V4 and 16S V1-V2 could be constrained using statistical analyses of presence absence patterns.
We found that stramenopiles (but not those within the diatoms) had high relative abundances in nearly all open sea samples and some above-reef samples. Stramenopile presence in salt ponds and salterns was more sporadic and also varied in mangroves, in all of which diatoms were the more relatively abundant stramenopiles (apart from Spanish Bay/Spaanse where eustigmatophytes took this role). Diatom contributions diminished above-reef and were proportionally less than those of dictyochophytes in the off-reef and open sea environments, where pelagophytes also gained in relative abundance values. The dictyochophytes exhibited significant contributions from uncultured environmental clades that are thought to be mixotrophic (Choi et al., 2020) and from multiple Florenciella ASVs, with Florenciella also having recently been shown to be mixotrophic (Li et al., 2021). In contrast, in the more coastal and inland sample sites Rhizochromulina exhibited high relative abundances.
Cryptophytes had punctuated bursts in 16S V1-V2 amplicon relative abundance, specifically at Spanish Bay/Spaanse mangroves and the Sint Willibrordus saltern (Figure 3). In mangroves along the East coast of India near the border to Bangladesh, rbcL gene clone libraries indicated cryptophytes were the most abundant chromophytic phytoplankton (a subset of phytoplankton characterized by a particular form of RuBisCO derived from the red algal lineage) after diatoms (Samanta and Bhadury, 2014). They have been observed in Portuguese salt ponds, where they were relatively more abundant in lower salinity than higher salinity ponds (Filker et al., 2015). Here, the punctuated appearances with higher relative abundances in our study did not correspond to salinity level; Sint Michiel coastal samples were similar in salinity to Sint Willibrordus, but cryptophytes did not play a major role. Moreover, all mangrove samples had similar salinities and yet again the distributions varied considerably. These findings indicate that more complex environmental variables or community interactions underpin changes in cryptophyte relative abundances.
Chlorophytes (particularly Dunaliella) and Trebouxiophyceae were the most relatively abundant green algae in several salt ponds, whereas in others prasinophyte Class IV dominated (Figure 5A), indicating the heterogeneity of these environments. The observed chlorophyte taxa are relatively well known for high salinity environments, with Dunaliella perhaps being the most common (Oren, 2005; Larson and Belovsky, 2013). For Class IV, Tetraselmis had the most relatively abundant ASVs, a genus that is known to have many euryhaline species (Fon-Sing and Borowitzka, 2016), but has not been well studied in the tropics (Arora et al., 2013). The most relatively abundant Trebouxiophyceae ASVs were related to Picochlorum soloecismus and Chlorella desiccata, also known to be halotolerant, but not previously reported from tropical environments (Gonzalez-Esquer et al., 2019; Borovsky et al., 2020).
In habitats other than the salterns and salt ponds, Class II prasinophytes dominated relative abundances of green algae, and in some cases exhibited relative abundances akin to stramenopiles (Figures 3, 5B–D). Surprisingly however, Class II prasinophytes were also observed in the high salinity habitats. Apart from the results herein to our knowledge just one other study has shown Class II members in salt ponds (in Portugal), where they represented more than half of the green algal 18S V4 amplicons in a salt pond with 40 ‰ salinity (Filker et al., 2015). However, it is not straightforward to compare our molecular data with the latter study as it is based on 18S V4 amplicons and reads obtained by pyrosequencing were clustered, potentially resulting in loss of diversity data. Class II prasinophytes reached their highest relative abundances in lower salinity Sint Michiel coastal and/or Sint Willibrordus salterns whereas Dunaliella’s relative abundance was highest in the high salinity Spanish Bay/Spaanse salt pond (Figures 3, 6E). The amplified importance of Class II in the salterns may well reflect renewal of these communities by incoming coastal waters.
With respect to cyanobacteria, Prochlorococcus typically had highest relative abundances above-reefs, off-reef, and in the open sea (Figure S7). This is in agreement with a recent study of waters above CARMABI reefs using flow cytometry and 16S V1-V2 amplicon sequencing to demonstrate that Prochlorococcus was mostly composed of the HLII ecotype, and Synechococcus was largely made up of clade II with notable contributions from clades III, IX, and XVI (Hoadley et al., 2021). Similarly, a study using flow cytometry in St. John reported a higher number of Prochlorococcus cells found over reefs than in mangroves, while distribution patterns were less clear for Synechococcus (Becker et al., 2020). Surveys of other Caribbean reefs found higher abundances of Prochlorococcus in offshore sites compared to reefs based on flow cytometry (Weber et al., 2020). With respect to mangroves, similar to our study, Synechococcus has also been reported in Brazilian (Rigonato et al., 2013; Silva et al., 2014) and Indian (Ganesan et al., 2012; Bhadury and Singh, 2020) mangroves, although typically without clade specific taxonomy. Likewise, the coastal Sint Michiel and Sint Willibrordus salterns were more similar to mangrove samples than to the other salt ponds, with Synechococcus as the major cyanobacterial group (Figure S7). Finally, we found that the more inland salt ponds mostly comprised an ASV most closely related to Cyanothece and Dactylococcopsis salina, both of which have been reported in hypersaline environments (Walsby et al., 1983; Muir and Perissinotto, 2011). These results provide a relatable database for comparison of cyanobacterial groups both across habitats and to other marine locations.
Cultured stramenopile phytoplankton species in relation to prior tropical studies
As previously mentioned, the stramenopile community in most salt ponds contained a large fraction of diatoms, although their absence in some ponds led to high overall variation (Figure 4). The most abundant diatom ASV in salt ponds was closest to the estuarine pennate diatom Synedra hyperborea. In salterns the most abundant ASV was closest to another estuarine benthic pennate diatom, Navicula phyllepta. As observed herein (Figure 4) and in Portuguese salt ponds (Filker et al., 2015), the contribution of diatoms increases with decreasing salinity of the ponds. Moreover, in that study most sequences found were from the Naviculaceae and Bacillariaceae families, and, as far as taxonomic assignments can be consistently overlain from different methodologies, we also found generally high representation from a member of the Naviculaceae, specifically the N. phyllepta ASV mentioned above.
Diatoms have been extensively studied in mangroves, particularly in the Indian/Bangladeshi Sundarbans and Malaysia (Saifullah et al., 2016), with a focus on epibenthic taxa (Bhattacharjee et al., 2013). Planktonic communities and their stability in mangroves are less well understood and only a few studies have addressed them [e.g. in mangroves of Bangladesh (Aziz, 2011)]. We postulate that high relative abundances of planktonic diatoms in the Curaçao mangroves are connected to the dampened tidal range they experience, which leaves them permanently inundated with water. The influence of variations in tidal levels has previously been implicated as a driver for differences in juvenile fish communities and numbers in Caribbean mangrove species compared to other mangrove systems (Igulu et al., 2014). Here, the overall most relatively abundant diatom ASV across mangroves was a member of the Thalassiosirales order, possibly Thalassiosira profunda, Skeletonema tropicum, Skeletonema costatum, or Skeletonema marinoi, all of which are planktonic species for at least part of their life stage (Sakshaug et al., 1989; Gao et al., 2000; Arsenieff et al., 2020). Clear delineation between planktonic and benthic diatoms is challenging because they can have life stages that delineate along these lines and benthic taxa can be uplifted from the sediment into the water column through physical forcing (Godhe and Härnström, 2010). Nevertheless, because the mangroves we studied are permanently inundated with water and were sampled during calm conditions, we take the taxa identified herein as having resided in the water column at this time of year.
In the reef and offshore sites, several groups were important in terms of stramenopile relative abundances. An ASV closest to Chaetoceros was the most relatively abundant diatom ASV among stramenopile amplicons across above-reef samples, while off-reef and in the open sea an ASV closest to Tryblionella apiculata took this position (Table S4). Chaetoceros is common in many oceanic environments while T. apiculata has been reported in Hungarian rivers and coastal South Korea (Kókai et al., 2015; Pandey et al., 2018). The pelagophytes we observed were those from oligotrophic and some mesotrophic environments, instead of well-known coastal species like Aureococcus. For example, Pelagomonas is the key taxon that has been reported in mesotrophic waters and the subtropical open ocean. Indeed, it has been reported to be among the most relatively abundant eukaryotic phytoplankton and/or pelagophytes in the subtropical North Atlantic gyre deep chlorophyll maximum (DCM), eastern North Pacific (Choi et al., 2020), and subtropical Pacific (Dupont et al., 2015) at least during specifical seasonal conditions. We also found that pelagophyte environmental clade VIII (PEC-VIII) has high relative abundances among pelagophytes with a similar distribution to P. calceolata. These two pelagophyte groups exhibited important contributions both above and off reefs, as well as in the open sea samples, while pelagophyte contributions in other habitats were minimal (Table S4).
Distributions of novel uncultured phytoplankton and key groups that are commonly taxonomically misassigned
The above-reef, off-reef, and open sea samples exhibited increasing relative abundances of dictyochophytes. Many dictyochophyte groups observed in oceanic environments are uncultured; for instance, environmental clades DEC-I and DEC-VI dominate dictyochophyte relative abundances in stratified surface waters of the North Atlantic subtropical gyre (Choi et al., 2020). Those with cultured representatives that had high relative abundances, including Florenciella and Rhizochromulina, are demonstrated phagotrophic phytoplankton (mixotrophs) shown to feed on Prochlorococcus (Li et al., 2021; Li et al., 2022). Mixotrophic feeding by eukaryotic phytoplankton is considered advantageous in oligotrophic conditions, where nutrients are scarce (Mitra et al., 2014; Wilken et al., 2019). This observation is consistent with distributions observed herein; however, the most abundant dictyochophyte group belonged to uncultured environmental clades I and II (DEC-I and DEC-II, which could not be resolved herein) which to date have unknown trophic modes. Dictyochophyte diversity in tropical coastal habitats, such as salt ponds and mangroves, to our knowledge, has not yet been investigated in detail. Here, we show that while dictyochophytes are more common and diverse in offshore habitats, they are present in salterns and mangroves and their composition in the latter environments is distinct at the ASV level (Figure 4). Notably, the dictyochophytes observed some salt ponds and some mangroves, where nutrient concentrations were higher than in the offshore environments, were largely Rhizochromulina, Apedinella, and Florenciella-related clade FC-III. While much research remains to be done, including basic demonstration (or exclusion) of mixotrophic capabilities in uncultivated clades, it is possible that differences in feeding along the mixotrophy gradient could influence the dictyochophyte species distributions along habitats with different nutrient availability.
Because there are few reports of the widespread and well-studied prasinophyte class Mamiellophyceae (Bachy et al., 2022b) from repeat sampling of tropical island and reef habitats, and because of high relative abundances at some sites herein, we examined taxonomically resolved data from the habitats. One of the major Mamiellophyceae groups was Ostreococcus (Figure 4B), but the taxa detected here were not O. tauri or O. lucimarinus, but rather the more open ocean Clade OII (also known as Clade B; (Limardo et al., 2017)) and the newly described O. bengalensis (Strauss et al., 2023). The former was previously thought to be deep-adapted, but as first highlighted in Demir-Hilton et al. 2011 is prominent in surface waters especially above- and off-reefs, and is also seen in well-mixed oligotrophic waters (Limardo et al., 2017). Indeed, Ostreococcus OII has been found to be important in the subtropical North Atlantic in well mixed waters during the winter and spring bloom in addition to being present at the DCM in stratified summertime waters (Demir-Hilton et al., 2011; Treusch et al., 2012; Bolaños et al., 2020). Ostreococcus OII has also been detected in tropical regions previously. For example, it has been reported in anthropogenically-impacted bays in the Philippines, where an uncultivated clade, now known to be O. bengalensis (previously Clade E) dominates Ostreococcus variants based on 18S V4 amplicon relative abundances (de la Peña et al., 2021). Here, we found O. bengalensis to have its highest relative importance in mangroves and it was the dominant Ostreococcus species at CARMABI/Piscadera (Figure 5B). Our cursory reevaluation of a study at a coral atoll in the Indian Ocean, which reported Ostreococcus tauri (Jeffries et al., 2015) suggests these sequences are likely more related to Ostreococcus OII and were mislabeled as O. tauri. These results emphasize the importance of phylogenetic approaches to amplicon analyses as well as continued pursuit of uncultured lineages.
A second genus of Class II prasinophytes was also prevalent, specifically Micromonas, with several clades having notable relative abundances in our study. To our knowledge, these results provide the first evidence of Micromonas in mangroves. The clades overlapped to some extent, but with differing importances. For example, in mangroves M. commoda Clade A (sensu Simmons et al., 2015), Micromonas candidate species 1 and 2, and Micromonas Clade E1 (named M. bravo in Simon et al., 2017) had highest relative abundances (Figure 4B). Micromonas candidate species 1, which was overall second in relative abundance after M. commoda Clade A, was first reported in the Pacific Ocean and Mediterranean Sea (Worden, 2006). It has since been found in the Florida Keys (Laas et al., 2021), and herein was especially well-represented in mangroves (Figure 5). Micromonas candidate species 2, here detected across all environments (Figure 5), was first reported in Wu et al., 2014 and then described in Simon et al., 2017 and has been reported in tropical coastal waters (Chénard et al., 2019; de la Peña et al., 2021). Micromonas Clade E1, here found across all habitats except salt ponds, and especially well-represented in mangroves, has been reported in the Florida Keys (Laas et al., 2021) in addition to the eastern North Pacific Ocean and its original site of isolation in the Mediterranean (Worden, 2006) and other temperate coastal waters (Tragin and Vaulot, 2019).
M. commoda Clade A (sensu Simmons et al., 2015) was detected in all but salt ponds, with highest relative abundances at above-reef and off-reef sites (Figures 5C, D) and is considered ubiquitous in tropical and subtropical regions (Simmons et al., 2015; Bakker et al., 2019; Tragin and Vaulot, 2019; Laas et al., 2021). Some mangrove and above-reef samples had unknown Micromonas ASVs that were closest to Micromonas A/B/C clades yet still distinct enough that they could represent novel diversity within this lineage. Micromonas Clade C was not detected in this study, supporting emerging information on distributions that indicate this lineage is adapted to colder environments (i.e., being more abundant in waters <20 °C) (Simon et al., 2017; Bachy et al., 2022a). A two-year time series of coral reefs in a subtropical site with greater seasonality, near Okinawa, based on 16S V1-V2 amplicons reported M. commoda Clade A forming 5-20% of picophytoplankton amplicons, with Bathycoccus in similar proportions in fall, winter, and spring (Nuryadi et al., 2018). Here, Bathycoccus was most relatively abundant above reefs and farther offshore, similar to M. commoda Clade A, although generally not as high in relative abundance as the latter (Figures 5C, D). While we did not resolve seasonality here, such marked seasonally related shifts are unlikely near Curaçao.
Developing understanding of potential community member interconnectedness
As the co-occurrence based on relative abundance data is not simple to interpret, here we looked at amplicon data as indicating presence or ‘absence’ of a taxon. Absence in amplicon data could imply lack of detection instead of true absence, but in the case of our fully rarefied data seemed a reasonable proxy to use. Prochlorococcus overall had the greatest number of connections to other ASVs, including SAR11, which are both highly abundant in the marine environment and can have a commensal relationship (Becker et al., 2019). The singular diatom ASV620 found across all environment types corresponded most closely to R. imbricata, which has been reported in the temperate North Atlantic (Edwards et al., 2022), the North Sea (Buaya et al., 2017), the East China Sea (Ishizaka et al., 2006), the Arabian Sea, Red Sea (Devassy et al., 2019), and South Pacific (Lindao and Ruiz, 2022) – hence exhibiting an exceptionally broad distribution. Despite its ubiquitous distribution, we were not able to reveal co-occurrences for this diatom. Chaetoceros ASV32 and T. apiculata-like ASV87 were found to have significant associations with members of the SAR11 clade, possibly indicating overlapping niches or interactions (Figure 7). A P. calceolata ASV was found to be associated with a Prochlorococcus ASV (Figure 7), which could imply a trophic relationship or niche overlap. There are also associations between Synechococcus and SAR11 and picoplanktonic Mamiellophyceae; however, it is unlikely that the latter can feed on other cells and thus there is probably not a trophic nature to the observed co-association (Wilken et al., 2019).
Conclusions
Molecular diversity and community composition data exposed different phytoplanktonic communities and dominant primary producer taxa (based on relative abundances) among the distinct but often interconnected environments investigated here. The types and distributions of diatoms are in agreement with previous work in similar environments in other tropical regions, while also suggesting presence of a suite of planktonic diatoms in mangroves. While microscopy has contributed to the tremendous knowledge on diatoms in these environments, until now little data has been available on green algae, apart from those in tropical salt ponds, or on dictyochophytes. The dynamics of green algae revealed here provide extensive new information on species distributions that reveal key habitats for several clades, including novel uncultivated lineages. Additionally, our findings on the relative importance of dictyochophytes, again especially for uncultivated lineages, provide new insights into protistan communities of tropical environments. Comprehensive studies on phytoplanktonic composition in coastal island environments are important as these areas are subject to sea rise level. These habitats are also important for spawning and juvenile fish, hence comprehension of the phytoplankton that underpin primary production in these regions will facilitate future modelling studies. Given the paucity of phytoplankton studies that encompass multiple tropical saline habitats (Bakker et al., 2019; Becker et al., 2020), the time series here provides a valuable point of references for future work on similar environments globally, as well as for this particular island and nearby waters in the Caribbean Sea.
Data availability statement
The datasets presented in this study can be found in online repositories. The names of the repository/repositories and accession number(s) can be found below: https://www.ncbi.nlm.nih.gov/bioproject/PRJNA913470.
Author contributions
CE and AZW wrote the manuscript. MV supported all field work in addition to providing logistical assistance and laboratory access. JE, SW, AZW, CP, and FW collected samples. JE and KB extracted DNA, performed PCR, and set up sequencing plates. MB performed chemical analyses. VJ and KM provided expertise to contextualize the findings. CE, JE, AZW, and FW analyzed sequencing data. CE and FW performed statistics, generated figures. All authors contributed to the article and approved the submitted version.
Funding
This research was supported by funding from the National Science Foundation (NSF) DEB-1639033, Gordon and Betty Moore Foundation Marine Investigator Award Grant 3788, and fellowships from the Radcliffe Institute for Advanced Research at Harvard University and the Hanse-Wissenschaftskolleg for Marine and Climate Science, awarded to AZW. FW was supported by Simons Foundation International’s BIOS-SCOPE program. CE was supported in part by a Cota-Robles Fellowship from the University of California Santa Cruz and by DEB-1639033. Contribution to HGF POF-IV 6.1, 6.3, and 6.4.
Acknowledgments
We thank CARMABI and CARMABI staff for providing lab space, residential space and for facilitating field work, as well as P. Keeling and F. Rohwer for stimulating and organizing initial Curaçao field trips. We are grateful to K. Hoadley, J. Grone, R. Spezzano and other Worden lab members for support, as well as the Monterey Bay Aquarium Research Institute (MBARI).
Conflict of interest
The authors declare that the research was conducted in the absence of any commercial or financial relationships that could be construed as a potential conflict of interest.
Publisher’s note
All claims expressed in this article are solely those of the authors and do not necessarily represent those of their affiliated organizations, or those of the publisher, the editors and the reviewers. Any product that may be evaluated in this article, or claim that may be made by its manufacturer, is not guaranteed or endorsed by the publisher.
Supplementary material
The Supplementary Material for this article can be found online at: https://www.frontiersin.org/articles/10.3389/fmars.2023.1131351/full#supplementary-material
Supplementary Figure 1 | Sequencing depth by environments for (A, B) 16S V1-V2 amplicons and (C, D) 18S V4 amplicons. Rarefaction curves (number of ASVs vs. number of amplicons per sample) for (A) 16S V1-V2 and (C) 18S V4 and rarefaction curve final slopes for (B) 16S V1-V2 and (D) 18S V4.
Supplementary Figure 2 | Salinity (A), silicate (D, note the change in Y-axis scale), phosphate (E), nitrate (F), and nitrite (G) are plotted for all samples with each bar indicating a single sample. For salinity, bar (B) indicates the site and bar (C) the year; for the nutrients, bar (H) indicates the site and bar (I) the year. Note that 2019 values for highest salinity environments were compromised because methodological issues did not allow quantification of values >100‰.
Supplementary Figure 3 | NMDS plot of all samples for (A) all 16S V1-V2 ASVs, (B) 16S V1-V2 ASVs classified as being from cyanobacteria or eukaryotic plastids, (C) stramenopile 16S V1-V2 ASVs, and (D) green algae and Chlorarachniophyceae 16S V1-V2 ASVs with each point indicating an individual sample, by site (shape) and environment type (color).
Supplementary Figure 4 | UpSet plots of (A) diatom and (B) dictyochophyte 16S V1-V2 ASVs. Intersection size indicates the number of 16S V1-V2 ASVs in the category, and set size is overall number of ASVs in that group per environment. For example, in (B), there are 5 dictyochophyte ASVs found in both salterns and mangroves that are not detected in any other environment.
Supplementary Figure 5 | Comparisons of Ostreococcus and Micromonas ASVs to amplicons from other studies for purposes of identification – using both 16S and 18S rRNA gene information. (A) Alignment of Ostreococcus 16S V1-V2 ASVs from this study with 16S rRNA V1-V2 ASVs from Strauss et al. 2023. (B) Alignment of Ostreococcus 18S rRNA V4 ASVs from this study with 18S V4 rRNA ASVs from Strauss et al. 2023. (C) Plot of ASV54 (corresponding to O. bengalensis in the 18S V4) percent contribution to all Ostreococcus ASVs in the 18S V4 data versus ASV144 (the ASV corresponding to O. bengalensis in the 16S V1-V2) percent contribution to all Ostreococcus ASVs in the 16S V1-V2. (D) Alignment of Micromonas Clades A, B, and C and candidate species 1 and 2 with ASVs from this study (except for Clade C, which was not detected herein). (E) Plot of ASVs assigned to Micromonas candidate species 1 in the 18S V4 percent contribution to all Micromonas ASVs in the 18S V4 versus ASVs assigned to Micromonas candidate species 1 in the 16S V1-V2 percent contribution to all Micromonas ASVs in the 16S V1-V2.
Supplementary Figure 6 | A CCA plot of distribution of green algal and Chlorarachniophyceae (which have plastids derived from green algae) ASVs along with environmental parameters (salinity, nitrate, nitrite, phosphate, and silicate).
Supplementary Figure 7 | Relative abundances of major cyanobacterial phytoplankton groups by (A) environment and (B) sampling site. The percent cyanobacterial group of total cyanobacterial amplicons is indicated by the heatmap in (C), with each row indicating an individual sample.
References
Alvarenga D. O., Rigonato J., Branco L. H. Z., Fiore M. F. (2015). Cyanobacteria in mangrove ecosystems. Biodivers. Conserv. 24, 799–817. doi: 10.1007/s10531-015-0871-2
Arora M., Anil A. C., Leliaert F., Delany J., Mesbahi E. (2013). Tetraselmis indica (Chlorodendrophyceae, chlorophyta), a new species isolated from salt pans in goa, India. Eur. J. Phycology 48, 61–78. doi: 10.1080/09670262.2013.768357
Arsenieff L., Le Gall F., Rigaut-Jalabert F., Mahé F., Sarno D., Gouhier L., et al. (2020). Diversity and dynamics of relevant nanoplanktonic diatoms in the Western English channel. ISME J. 14, 1966–1981. doi: 10.1038/s41396-020-0659-6
Aziz A. (2011). New record of planktonic diatoms from the Sundarban mangrove forests, Bangladesh. Bangladesh J. Bot. 40, 163–169. doi: 10.3329/bjb.v40i2.9772
Bachy C., Sudek L., Choi C. J., Eckmann C. A., Nöthig E.-M., Metfies K., et al. (2022a). Phytoplankton surveys in the Arctic fram strait demonstrate the tiny eukaryotic alga Micromonas and other picoprasinophytes contribute to deep sea export. Microorganisms 10, 961. doi: 10.3390/microorganisms10050961
Bachy C., Wittmers F., Muschiol J., Hamilton M., Henrissat B., Worden A. Z. (2022b). The land-sea connection: insights into the plant lineage from a green algal perspective. Annu. Rev. Plant Biol. 73:585–616. doi: 10.1146/annurev-arplant-071921-100530
Bakker J., Wangensteen O. S., Baillie C., Buddo D., Chapman D. D., Gallagher A. J., et al. (2019). Biodiversity assessment of tropical shelf eukaryotic communities via pelagic eDNA metabarcoding. Ecol. Evol. 9, 14341–14355. doi: 10.1002/ece3.5871
Becker J. W., Hogle S. L., Rosendo K., Chisholm S. W. (2019). Co-Culture and biogeography of Prochlorococcus and SAR11. ISME J. 13, 1506–1519. doi: 10.1038/s41396-019-0365-4
Becker C. C., Weber L., Suca J. J., Llopiz J. K., Mooney T. A., Apprill A. (2020). Microbial and nutrient dynamics in mangrove, reef, and seagrass waters over tidal and diurnal time scales. Aquat. Microbial. Ecol. 85, 101–119. doi: 10.3354/ame01944
Behrenfeld M. J., O’Malley R. T., Siegel D. A., McClain C. R., Sarmiento J. L., Feldman G. C., et al. (2006). Climate-driven trends in contemporary ocean productivity. Nature 444, 752–755. doi: 10.1038/nature05317
Benlloch S., López-López A., Casamayor E. O., Øvreås L., Goddard V., Daae F. L., et al. (2002). Prokaryotic genetic diversity throughout the salinity gradient of a coastal solar saltern. Environ. Microbiol. 4, 349–360. doi: 10.1046/j.1462-2920.2002.00306.x
Bhadury P., Singh T. (2020). Analysis of marine planktonic cyanobacterial assemblages from Mooriganga estuary, Indian Sundarbans using molecular approaches. Front. Mar. Sci. 7. doi: 10.3389/fmars.2020.00222
Bhattacharjee D., Samanta B., Danda A. A., Bhadury P. (2013). Temporal succession of phytoplankton assemblages in a tidal creek system of the Sundarbans mangroves: an integrated approach. Int. J. Biodiversity 2013, 1–15. doi: 10.1155/2013/824543
Bolaños L. M., Karp-Boss L., Choi C. J., Worden A. Z., Graff J. R., Haëntjens N., et al. (2020). Small phytoplankton dominate western North Atlantic biomass. The ISME J. 14, 1663–1674. doi: 10.1038/s41396-020-0636-0
Bolyen E., Rideout J. R., Dillon M. R., Bokulich N. A., Abnet C. C., Al-Ghalith G. A., et al. (2019). Reproducible, interactive, scalable and extensible microbiome data science using QIIME 2. Nat. Biotechnol. 37, 852–857. doi: 10.1038/s41587-019-0209-9
Borovsky D., Nauwelaers S., Shatters R. (2020). Biochemical and molecular characterization of Pichia pastoris cells expressing multiple TMOF genes (tmfA) for mosquito larval control. Front. Physiol. 11. doi: 10.3389/fphys.2020.00527
Bove C. B., Mudge L., Bruno J. F. (2022). A century of warming on Caribbean reefs. PloS Climate 1, e0000002. doi: 10.1371/journal.pclm.0000002
Brocke H. J., Piltz B., Herz N., Abed R. M. M., Palinska K. A., John U., et al. (2018). Nitrogen fixation and diversity of benthic cyanobacterial mats on coral reefs in curaçao. Coral Reefs 37, 861–874. doi: 10.1007/s00338-018-1713-y
Brocke H. J., Polerecky L., Beer D., de Weber M., Claudet J., Nugues M. M. (2015). Organic Matter Degradation Drives Benthic Cyanobacterial Mat Abundance on Caribbean Coral Reefs. PLOS ONE 10, e0125445. doi: 10.1371/journal.pone.0125445
Buaya A. T., Ploch S., Hanic L., Nam B., Nigrelli L., Kraberg A., et al. (2017). Phylogeny of Miracula helgolandica gen. et sp. nov. and Olpidiopsis drebesii sp. nov., two basal oomycete parasitoids of marine diatoms, with notes on the taxonomy of ectrogella-like species. Mycol. Prog. 16, 1041–1050. doi: 10.1007/s11557-017-1345-6
Callahan B. J., McMurdie P. J., Rosen M. J., Han A. W., Johnson A. J. A., Holmes S. P. (2016). DADA2: high-resolution sample inference from Illumina amplicon data. Nat. Methods 13, 581–583. doi: 10.1038/nmeth.3869
Chénard C., Wijaya W., Vaulot D., Lopes dos Santos A., Martin P., Kaur A., et al. (2019). Temporal and spatial dynamics of bacteria, archaea and protists in equatorial coastal waters. Sci. Rep. 9, 16390. doi: 10.1038/s41598-019-52648-x
Choi C. J., Bachy C., Jaeger G. S., Poirier C., Sudek L., Sarma V. V. S. S., et al. (2017). Newly discovered deep-branching marine plastid lineages are numerically rare but globally distributed. Curr. Biol. 27, R15–R16. doi: 10.1016/j.cub.2016.11.032
Choi C. J., Jimenez V., Needham D. M., Poirier C., Bachy C., Alexander H., et al. (2020). Seasonal and geographical transitions in eukaryotic phytoplankton community structure in the Atlantic and Pacific Oceans. Front. Microbiol. 11. doi: 10.3389/fmicb.2020.542372
Csardi G., Nepusz T. (2005). The igraph software package for complex network research. InterJournal Complex Syst. 1695, 1–9.
Cuvelier M. L., Allen A. E., Monier A., McCrow J. P., Messie M., Tringe S. G., et al. (2010). Targeted metagenomics and ecology of globally important uncultured eukaryotic phytoplankton. Proc. Natl. Acad. Sci. 107, 14679–14684. doi: 10.1073/pnas.1001665107
Daims H., Brühl A., Amann R., Schleifer K.-H., Wagner M. (1999). The domain-specific probe EUB338 is insufficient for the detection of all bacteria: development and evaluation of a more comprehensive probe set. Systematic Appl. Microbiol. 22, 434–444. doi: 10.1016/S0723-2020(99)80053-8
de Bakker D. M., van Duyl F. C., Bak R. P. M., Nugues M. M., Nieuwland G., Meesters E. H. (2017). 40 years of benthic community change on the Caribbean reefs of Curaçao and Bonaire: the rise of slimy cyanobacterial mats. Coral Reefs 36, 355–367. doi: 10.1007/s00338-016-1534-9
de la Peña L. B. R., Tejada A. J., Quijano J. B., Alonzo K., Gernato E. G., Caril A., et al. (2021). Diversity of marine eukaryotic picophytoplankton communities with emphasis on mamiellophyceae in northwestern Philippines. Philippine J. Sci. 150, 27–42. doi: 10.56899/150.01.03
Demir-Hilton E., Sudek S., Cuvelier M. L., Gentemann C. L., Zehr J. P., Worden A. Z. (2011). Global distribution patterns of distinct clades of the photosynthetic picoeukaryote Ostreococcus. ISME J. 5, 1095–1107. doi: 10.1038/ismej.2010.209
Desrosiers C., Witkowski A., Riaux-Gobin C., Zgłobicka I., Kurzydłowski K. J., Eulin A., et al. (2014). Madinithidium gen. nov. (Bacillariophyceae), a new monoraphid diatom genus from the tropical marine coastal zone. Phycologia 53, 583–592. doi: 10.2216/14-21R2
Devassy R. P., El-Sherbiny M. M., Al-Sofyani A. A., Crosby M. P., Al-Aidaroos A. M. (2019). Seasonality and latitudinal variability in the diatom-cyanobacteria symbiotic relationships in the coastal waters of the red Sea, Saudi Arabia. Symbiosis 78, 215–227. doi: 10.1007/s13199-019-00610-w
Diekmann O. E., Bak R. P. M., Tonk L., Stam W. T., Olsen J. L. (2002). No habitat correlation of zooxanthellae in the coral genus Madracis on a Curaçao reef. Mar. Ecol. Prog. Ser. 227, 221–232. doi: 10.3354/meps227221
Dixon P. (2003). VEGAN, a package of r functions for community ecology. J. Vegetation Sci. 14, 927–930. doi: 10.1111/j.1654-1103.2003.tb02228.x
Dupont C. L., McCrow J. P., Valas R., Moustafa A., Walworth N., Goodenough U., et al. (2015). Genomes and gene expression across light and productivity gradients in eastern subtropical Pacific microbial communities. ISME J. 9, 1076–1092. doi: 10.1038/ismej.2014.198
Edwards M., Beaugrand G., Kléparski L., Hélaouët P., Reid P. C. (2022). Climate variability and multi-decadal diatom abundance in the northeast Atlantic. Commun. Earth Environ. 3, 1–8. doi: 10.1038/s43247-022-00492-9
Engelen A. H., Aires T., Vermeij M. J. A., Herndl G. J., Serrão E. A., Frade P. R. (2018). Host differentiation and compartmentalization of microbial communities in the azooxanthellate cupcorals Tubastrea coccinea and Rhizopsammia goesi in the Caribbean. Front. Mar. Sci. 5. doi: 10.3389/fmars.2018.00391
Filker S., Gimmler A., Dunthorn M., Mahé F., Stoeck T. (2015). Deep sequencing uncovers protistan plankton diversity in the Portuguese Ria Formosa solar saltern ponds. Extremophiles 19, 283–295. doi: 10.1007/s00792-014-0713-2
Fong P., Paul V. J. (2011). “Coral reef algae,” in Coral reefs: an ecosystem in transition. Eds. Dubinsky Z., Stambler N. (Dordrecht: Springer Netherlands), 241–272. doi: 10.1007/978-94-007-0114-4_17
Fon-Sing S., Borowitzka M. A. (2016). Isolation and screening of euryhaline tetraselmis spp. suitable for large-scale outdoor culture in hypersaline media for biofuels. J. Appl. Phycol. 28, 1–14. doi: 10.1007/s10811-015-0560-2
Ganesan S., Ramanathan, Kandasamy K. (2012). Diversity of marine cyanobacteria from three mangrove environment in Tamil Nadu coast, south East coast of India. Curr. Res. J. Biol. Sci. 4, 235–238.
Gao Y., Smith G. J., Alberte R. S. (2000). Temperature dependence of nitrate reductase activity in marine phytoplankton: biochemical analysis and ecological implications. J. Phycology 36, 304–313. doi: 10.1046/j.1529-8817.2000.99195.x
Godhe A., Härnström K. (2010). Linking the planktonic and benthic habitat: genetic structure of the marine diatom Skeletonema marinoi. Mol. Ecol. 19, 4478–4490. doi: 10.1111/j.1365-294X.2010.04841.x
Gonzalez-Esquer C. R., Wright K. T., Sudasinghe N., Carr C. K., Sanders C. K., Turmo A., et al. (2019). Demonstration of the potential of Picochlorum soloecismus as a microalgal platform for the production of renewable fuels. Algal. Res. 43, 101658. doi: 10.1016/j.algal.2019.101658
Griffith D. M., Veech J. A., Marsh C. J. (2016). Cooccur: probabilistic species Co-occurrence analysis in r. J. Stat. Software 69, 1–17. doi: 10.18637/jss.v069.c02
Guillou L., Bachar D., Audic S., Bass D., Berney C., Bittner L., et al. (2013). The protist ribosomal reference database (PR2): a catalog of unicellular eukaryote small Sub-unit rRNA sequences with curated taxonomy. Nucleic Acids Res. 41, D597–D604. doi: 10.1093/nar/gks1160
Haas A. F., Fairoz M. F. M., Kelly L. W., Nelson C. E., Dinsdale E. A., Edwards R. A., et al. (2016). Global microbialization of coral reefs. Nat. Microbiol. 1, 1–7. doi: 10.1038/nmicrobiol.2016.42
Hoadley K. D., Hamilton M., Poirier C. L., Choi C. J., Yung C.-M., Worden A. Z. (2021). Selective uptake of pelagic microbial community members by Caribbean reef corals. Appl. Environ. Microbiol. 87, e03175–e03120. doi: 10.1128/AEM.03175-20
Hossain M. M. M., Mojumdar S., Farjana N., Islam M. S., Raihan M. A., Aminur M. (2022). 16S rRNA genes developed a baseline of the microbial community associated with soil, water, fish and shellfishes in the sundarbans of Bangladesh. J. Biol. Stud. 5, 571–584.
Hu S., Li T., Liu S., Huang H. (2020). Dietary separation between co-occurring copepods in a food-limited tropical coral reef of the Sanya Bay. Acta Oceanol. Sin. 39, 65–72. doi: 10.1007/s13131-020-1583-3
Hunting E. R., Soest R. W. M., van Geest H. G., van der Vos A., Debrot A. O. (2008). Diversity and spatial heterogeneity of mangrove associated sponges of curaçao and Aruba. Contributions to Zoology 77, 205–215. doi: 10.1163/18759866-07704001
Igulu M. M., Nagelkerken I., Dorenbosch M., Grol M. G. G., Harborne A. R., Kimirei I. A., et al. (2014). Mangrove habitat use by juvenile reef fish: meta-analysis reveals that tidal regime matters more than biogeographic region. PloS One 9, e114715. doi: 10.1371/journal.pone.0114715
Ishizaka J., Kitaura Y., Touke Y., Sasaki H., Tanaka A., Murakami H., et al. (2006). Satellite detection of red tide in Ariake Sound 1998–2001. J. Oceanogr. 62, 37–45. doi: 10.1007/s10872-006-0030-1
Jablonski D., Roy K., Valentine J. W. (2006). Out of the tropics: evolutionary dynamics of the latitudinal diversity gradient. Science 314, 102–106. doi: 10.1126/science.1130880
Jeffries T. C., Ostrowski M., Williams R. B., Xie C., Jensen R. M., Grzymski J. J., et al. (2015). Spatially extensive microbial biogeography of the Indian Ocean provides insights into the unique community structure of a pristine coral atoll. Sci. Rep. 5, 15383. doi: 10.1038/srep15383
Kassambara A. (2019). Practical statistics in R II - comparing groups: numerical variables. 1st ed (Sydney, Australia: Datanovia).
Kókai Z., Bácsi I., Török P., Buczkó K., T-Krasznai E., Balogh C., et al. (2015). Halophilic diatom taxa are sensitive indicators of even short term changes in lowland lotic systems. Acta Botanica Croatica 74, 287–302. doi: 10.1515/botcro-2015-0025
Kristensen E., Bouillon S., Dittmar T., Marchand C. (2008). Organic carbon dynamics in mangrove ecosystems: a review. Aquat. Botany Mangrove Ecol. – Appl. Forestry Costal Zone Manage. 89, 201–219. doi: 10.1016/j.aquabot.2007.12.005
Kurtz Z. D., Müller C. L., Miraldi E. R., Littman D. R., Blaser M. J., Bonneau R. A. (2015). Sparse and compositionally robust inference of microbial ecological networks. PloS Comput. Biol. 11, e1004226. doi: 10.1371/journal.pcbi.1004226
Laas P., Ugarelli K., Absten M., Boyer B., Briceño H., Stingl U. (2021). Composition of prokaryotic and eukaryotic microbial communities in waters around the Florida reef tract. Microorganisms 9, 1120. doi: 10.3390/microorganisms9061120
LaJeunesse T. C., Parkinson J. E., Gabrielson P. W., Jeong H. J., Reimer J. D., Voolstra C. R., et al. (2018). Systematic revision of Symbiodiniaceae highlights the antiquity and diversity of coral endosymbionts. Curr. Biol. 28, 2570–2580.e6. doi: 10.1016/j.cub.2018.07.008
Larson C. A., Belovsky G. E. (2013). Salinity and nutrients influence species richness and evenness of phytoplankton communities in microcosm experiments from great salt lake, Utah, USA. J. Plankton Res. 35, 1154–1166. doi: 10.1093/plankt/fbt053
Leander B. S., Keeling P. J. (2003). Morphostasis in alveolate evolution. Trends Ecol. Evol. 18, 395–402. doi: 10.1016/S0169-5347(03)00152-6
Lefrançois E., Coat S., Lepoint G., Vachiéry N., Gros O., Monti D. (2011). Epilithic biofilm as a key factor for small-scale river fisheries on Caribbean islands. Fisheries Manage. Ecol. 18, 211–220. doi: 10.1111/j.1365-2400.2010.00767.x
Li Q., Edwards K. F., Schvarcz C. R., Selph K. E., Steward G. F. (2021). Plasticity in the grazing ecophysiology of Florenciella (Dichtyochophyceae), a mixotrophic nanoflagellate that consumes Prochlorococcus and other bacteria. Limnology Oceanography 66, 47–60. doi: 10.1002/lno.11585
Li Q., Edwards K. F., Schvarcz C. R., Steward G. F. (2022). Broad phylogenetic and functional diversity among mixotrophic consumers of Prochlorococcus. ISME J. 16, 1557–1569. doi: 10.1038/s41396-022-01204-z
Li L., Wang S., Wang H., Sahu S. K., Marin B., Li H., et al. (2020). The genome of Prasinoderma coloniale unveils the existence of a third phylum within green plants. Nat. Ecol. Evol. 4, 1220–1231. doi: 10.1038/s41559-020-1221-7
Limardo A. J., Sudek S., Choi C. J., Poirier C., Rii Y. M., Blum M., et al. (2017). Quantitative biogeography of picoprasinophytes establishes ecotype distributions and significant contributions to marine phytoplankton. Environ. Microbiol. 19, 3219–3234. doi: 10.1111/1462-2920.13812
Lindao M. R., Ruiz C. A. (2022). Phytoplankton distribution in marine-coastal waters in three sectors of Santa Elena peninsula. Rev. Acta Oceanográfica del Pacífico 4, 46–62. doi: 10.54140/raop.v4i1.51
Martin M. (2011). Cutadapt removes adapter sequences from high-throughput sequencing reads. EMBnet.journal 17, 10–12. doi: 10.14806/ej.17.1.200
McMurray S. E., Johnson Z. I., Hunt D. E., Pawlik J. R., Finelli C. M. (2016). Selective feeding by the giant barrel sponge enhances foraging efficiency. Limnology Oceanography 61, 1271–1286. doi: 10.1002/lno.10287
Mitra A., Flynn K. J., Burkholder J. M., Berge T., Calbet A., Raven J. A., et al. (2014). The role of mixotrophic protists in the biological carbon pump. Biogeosciences 11, 995–1005. doi: 10.5194/bg-11-995-2014
Moreira D., López-Garcıía P. (2002). The molecular ecology of microbial eukaryotes unveils a hidden world. Trends Microbiol. 10, 31–38. doi: 10.1016/S0966-842X(01)02257-0
Muir D. G., Perissinotto R. (2011). Persistent phytoplankton bloom in Lake St. Lucia (iSimangaliso Wetland Park, South Africa) caused by a cyanobacterium closely associated with the genus Cyanothece (Synechococcaceae, chroococcales). Appl. Environ. Microbiol. 77, 5888–5896. doi: 10.1128/AEM.00460-11
Nagelkerken I., van der Velde G. (2002). Do non-estuarine mangroves harbour higher densities of juvenile fish than adjacent shallow-water and coral reef habitats in Curaçao (Netherlands antilles)? Mar. Ecol. Prog. Ser. 245, 191–204. doi: 10.3354/meps245191
Needham D. M., Fuhrman J. A. (2016). Pronounced daily succession of phytoplankton, archaea and bacteria following a spring bloom. Nat. Microbiol. 1, 1–7. doi: 10.1038/nmicrobiol.2016.5
Nuryadi H., Nguyen T. T. M., Ito M., Okada N., Wakaoji S., Maruyama T., et al. (2018). A metabarcoding survey for seasonal picophytoplankton composition in two coral reefs around Sesoko Island, Okinawa, Japan. J. Appl. Phycol. 30, 3179–3186. doi: 10.1007/s10811-018-1544-9
Oksanen J., Blanchet F. G., Friendly M., Kindt R., Legendre P., McGlinn D. (2020). Vegan: community ecology package (R package version 2), 5–7.
Oren A. (2005). A hundred years of dunaliella research: 1905–2005. Aquat. Biosyst. 1, 2. doi: 10.1186/1746-1448-1-2
Pandey L. K., Sharma Y. C., Park J., Choi S., Lee H., Lyu J., et al. (2018). Evaluating features of periphytic diatom communities as biomonitoring tools in fresh, brackish and marine waters. Aquat. Toxicol. 194, 67–77. doi: 10.1016/j.aquatox.2017.11.003
Qin C., Zhu W., Ma H., Duan D., Zuo T., Xi S., et al. (2019). Are habitat changes driving protist community shifts? A Case study Daya Bay China. Estuarine Coast. Shelf Sci. 227, 106356. doi: 10.1016/j.ecss.2019.106356
Quast C., Pruesse E., Yilmaz P., Gerken J., Schweer T., Yarza P., et al. (2013). The SILVA ribosomal RNA gene database project: improved data processing and web-based tools. Nucleic Acids Res. 41, D590–D596. doi: 10.1093/nar/gks1219
Reef R., Feller I. C., Lovelock C. E. (2010). Nutrition of mangroves. Tree Physiol. 30, 1148–1160. doi: 10.1093/treephys/tpq048
Rigonato J., Kent A. D., Alvarenga D. O., Andreote F. D., Beirigo R. M., Vidal-Torrado P., et al. (2013). Drivers of cyanobacterial diversity and community composition in mangrove soils in south-east Brazil. Environ. Microbiol. 15, 1103–1114. doi: 10.1111/j.1462-2920.2012.02830.x
Rodríguez F., Derelle E., Guillou L., Gall F. L., Vaulot D., Moreau H. (2005). Ecotype diversity in the marine picoeukaryote Ostreococcus (Chlorophyta, prasinophyceae). Environ. Microbiol. 7, 853–859. doi: 10.1111/j.1462-2920.2005.00758.x
Saifullah A. S. M., Kamal A. H. M., Idris M. H., Rajaee A. H., Bhuiyan M. (2016). Phytoplankton in tropical mangrove estuaries: role and interdependency. For. Sci. Technol. 12, 104–113. doi: 10.1080/21580103.2015.1077479
Sakamoto C. M., Friederich G. E., Codispoti L. A. (1990) MBARI procedures for automated nutrient analyses using a modified alpkem series 300 rapid flow analyzer. Available at: http://aquaticcommons.org/id/eprint/1971.
Sakshaug E., Andresen K., Kiefer D. A. (1989). A steady state description of growth and light absorption in the marine planktonic diatom Skeletonema costatum. Limnology Oceanography 34, 198–205. doi: 10.4319/lo.1989.34.1.0198
Samanta B., Bhadury P. (2014). Analysis of diversity of chromophytic phytoplankton in a mangrove ecosystem using rbcL gene sequencing. J. Phycology 50, 328–340. doi: 10.1111/jpy.12163
Scheffers S. R., Nieuwland G., Bak R. P. M., van Duyl F. C. (2004). Removal of bacteria and nutrient dynamics within the coral reef framework of curaçao (Netherlands antilles). Coral Reefs 23, 413–422. doi: 10.1007/s00338-004-0400-3
Silva C. S. P., Genuário D. B., Vaz M. G. M. V., Fiore M. F. (2014). Phylogeny of culturable cyanobacteria from Brazilian mangroves. Systematic Appl. Microbiol. 37, 100–112. doi: 10.1016/j.syapm.2013.12.003
Simmons M. P., Bachy C., Sudek S., van Baren M. J., Sudek L., Ares M., et al. (2015). Intron invasions trace algal speciation and reveal nearly identical Arctic and Antarctic Micromonas populations. Mol. Biol. Evol. 32, 2219–2235. doi: 10.1093/molbev/msv122
Simon N., Foulon E., Grulois D., Six C., Desdevises Y., Latimier M., et al. (2017). Revision of the genus Micromonas Manton et parke (Chlorophyta, mamiellophyceae), of the type species M. pusilla (Butcher) Manton & parke and of the species M. commoda van Baren, Bachy and Worden and description of two new species based on the genetic and phenotypic characterization of cultured isolates. Protist 168, 612–635. doi: 10.1016/j.protis.2017.09.002
Šlapeta J., López-García P., Moreira D. (2006). Global dispersal and ancient cryptic species in the smallest marine eukaryotes. Mol. Biol. Evol. 23, 23–29. doi: 10.1093/molbev/msj001
Stoeck T., Bass D., Nebel M., Christen R., Jones M. D. M., Breiner H.-W., et al. (2010). Multiple marker parallel tag environmental DNA sequencing reveals a highly complex eukaryotic community in marine anoxic water. Mol. Ecol. 19, 21–31. doi: 10.1111/j.1365-294X.2009.04480.x
Strauss J., Choi C. J., Grone J., Wittmers F., Jimenez V., Makareviciute-Fichtner K., et al. (2023). The Bay of Bengal exposes abundant photosynthetic picoplankton and newfound diversity along salinity-driven gradients. Environ. Microbiol. doi: 10.1111/1462-2920.16431
Sudek S., Everroad R. C., Gehman A.-L. M., Smith J. M., Poirier C. L., Chavez F. P., et al. (2015). Cyanobacterial distributions along a physico-chemical gradient in the northeastern pacific ocean. Environ. Microbiol. 17, 3692–3707. doi: 10.1111/1462-2920.12742
Toledo G., Bashan Y., Soeldner A. (1995). Cyanobacteria and black mangroves in northwestern Mexico: colonization, and diurnal and seasonal nitrogen fixation on aerial roots. Can. J. Microbiol. 41, 999–1011. doi: 10.1139/m95-139
Tragin M., Vaulot D. (2019). Novel diversity within marine mamiellophyceae (Chlorophyta) unveiled by metabarcoding. Sci. Rep. 9, 1–14. doi: 10.1038/s41598-019-41680-6
Treusch A. H., Demir-Hilton E., Vergin K. L., Worden A. Z., Carlson C. A., Donatz M. G., et al. (2012). Phytoplankton distribution patterns in the northwestern Sargasso Sea revealed by small subunit rRNA genes from plastids. ISME J. 6, 481–492. doi: 10.1038/ismej.2011.117
van der Schoot R. J., Hoeksema B. W. (2022). Abundance of coral-associated fauna in relation to depth and eutrophication along the leeward side of curaçao, southern Caribbean. Mar. Environ. Res. 181, 105738. doi: 10.1016/j.marenvres.2022.105738
van Duyl F., Gast G., Steinhoff W., Kloff S., Veldhuis M., Bak R. (2002). Factors influencing the short-term variation in phytoplankton composition and biomass in coral reef waters. Coral Reefs 21, 293–306. doi: 10.1007/s00338-002-0248-3
Vergin K. L., Beszteri B., Monier A., Cameron Thrash J., Temperton B., Treusch A. H., et al. (2013). High-resolution SAR11 ecotype dynamics at the Bermuda Atlantic Time-Series study site by phylogenetic placement of pyrosequences. ISME J. 7, 1322–1332. doi: 10.1038/ismej.2013.32
Vidal L. A., Quiroga S., Urueña R. G. (2015). First record of the diatom Chrysanthemodiscus floriatus Mann 1925, (Chrysanthemodiscaceae) in the Caribbean coast of Colombia. Intropica: Rev. del Instituto Investigaciones Tropicales 10, 100–102. doi: 10.21676/23897864.1652
Walsby A. E., Van Rijn J., Cohen Y., Fogg G. E. (1983). The biology of a new gas-vacuolate cyanobacterium, Dactylococcopsis salina sp. nov., in solar lake. Proc. R. Soc. London. Ser. B. Biol. Sci. 217, 417–447. doi: 10.1098/rspb.1983.0019
Weber L., González-Díaz P., Armenteros M., Ferrer V. M., Bretos F., Bartels E., et al. (2020). Microbial signatures of protected and impacted northern Caribbean reefs: changes from Cuba to the Florida keys. Environ. Microbiol. 22, 499–519. doi: 10.1111/1462-2920.14870
Wickham H., Averick M., Bryan J., Chang W., McGowan L. D., François R., et al. (2019). Welcome to the tidyverse. J. Open Source Software 4, 1686. doi: 10.21105/joss.01686
Wilken S., Yung C. C. M., Hamilton M., Hoadley K., Nzongo J., Eckmann C., et al. (2019). The need to account for cell biology in characterizing predatory mixotrophs in aquatic environments. Philos. Trans. R. Soc. B: Biol. Sci. 374, 20190090. doi: 10.1098/rstb.2019.0090
Worden A. Z. (2006). Picoeukaryote diversity in coastal waters of the Pacific Ocean. Aquat. Microbial Ecol. 43, 165–175. doi: 10.3354/ame043165
Wu W., Huang B., Zhong C. (2014). Photosynthetic picoeukaryote assemblages in the south China Sea from the Pearl River Estuary to the SEATS station. Aquat. Microbial Ecol. 71, 271–284. doi: 10.3354/ame01681
Keywords: prasinophyte, green algae, chlorophyte, tropical ecosystems, dictyochophyte
Citation: Eckmann CA, Eberle JS, Wittmers F, Wilken S, Bergauer K, Poirier C, Blum M, Makareviciute-Fichtner K, Jimenez V, Bachy C, Vermeij MJA and Worden AZ (2023) Eukaryotic algal community composition in tropical environments from solar salterns to the open sea. Front. Mar. Sci. 10:1131351. doi: 10.3389/fmars.2023.1131351
Received: 24 December 2022; Accepted: 13 April 2023;
Published: 30 June 2023.
Edited by:
Yong Wang, Tsinghua University, ChinaReviewed by:
Wenxue Wu, Hainan University, ChinaDaniele De Luca, University of Naples Federico II, Italy
Nicole Trefault, Universidad Mayor, Chile
Copyright © 2023 Eckmann, Eberle, Wittmers, Wilken, Bergauer, Poirier, Blum, Makareviciute-Fichtner, Jimenez, Bachy, Vermeij and Worden. This is an open-access article distributed under the terms of the Creative Commons Attribution License (CC BY). The use, distribution or reproduction in other forums is permitted, provided the original author(s) and the copyright owner(s) are credited and that the original publication in this journal is cited, in accordance with accepted academic practice. No use, distribution or reproduction is permitted which does not comply with these terms.
*Correspondence: Alexandra Z. Worden, azworden@mbl.edu