A review of new and existing non-extractive techniques for monitoring marine protected areas
 Ryan McGeady1,2*
  Robert M. Runya1
  James S. G. Dooley3 John A. Howe4
  Clive J. Fox4
  Andrew J. Wheeler5,6,7
  Gerard Summers5
  Alexander Callaway8
  Suzanne Beck8 Louise S. Brown8 Gerard Dooly9
  Chris McGonigle1
- 1School of Geography and Environmental Sciences, Ulster University, Coleraine, United Kingdom
- 2Flood Forecasting Division, Met Éireann, Dublin, Ireland
- 3School of Biomedical Science, Ulster University, Coleraine, United Kingdom
- 4Scottish Association for Marine Science, Oban, United Kingdom
- 5School of Biological, Earth and Environmental Sciences, University College Cork, Cork, Ireland
- 6Science Foundation Ireland Centre for Research in Applied Geosciences, University College Cork, Cork, Ireland
- 7Science Foundation Ireland (SFI) Centre for Climate, Energy and Marine, University College Cork, Cork, Ireland
- 8Fisheries and Aquatic Ecosystems Branch, Agri-Food and Biosciences Institute, Belfast, United Kingdom
- 9Centre for Robotics and Intelligent Systems, University of Limerick, Limerick, Ireland
Ocean biodiversity loss is being driven by several anthropogenic threats and significant efforts are required to halt losses and promote healthy marine ecosystems. The establishment of a network of Marine Protected Areas (MPAs) can help restrict damaging activities and have been recognised as a potential solution to aid marine conservation. When managed correctly they can deliver both ecological and socio-economic benefits. In recent times, MPA designations have increased rapidly while many countries have set future MPA targets for the decades ahead. An integral element of MPA management is adequate monitoring that collects data to assess if conservation objectives are being achieved. Data acquired by monitoring can vary widely as can the techniques employed to collect such data. Ideally, non-destructive and non-invasive methods are preferred to prevent damage to habitats and species, though this may rule out a number of traditional extractive sampling approaches such as dredges and trawls. Moreover, advances in ocean observation technologies enable the collection of large amounts of data at high resolutions, while automated data processing is beginning to make analyses more logistically feasible and less time-consuming. Therefore, developments to existing marine monitoring techniques and new emerging technologies have led to a diverse array of options when choosing to implement an MPA monitoring programme. Here, we present a review of new and existing non-extractive techniques which can be applied to MPA monitoring. We summarise their capabilities, applications, advantages, limitations and possible future developments. The review is intended to aid MPA managers and researchers in determining the suitability of available monitoring techniques based on data requirements and site conditions.
Introduction
Marine Protected Areas (MPAs) can be an effective tool to protect and conserve marine biodiversity. Typically, MPAs restrict anthropogenic activities in a defined geographical area through legal means. Numerous instances of significant conservation benefits as a result of MPA designation have been reported (Halpern and Warner, 2002; Pande et al., 2008; Lester et al., 2009; Davies et al., 2022a). A growing realisation of the potential benefits of MPAs has led to an increasing willingness among nations to expand MPA coverage throughout global oceans. For example, in 2010, the Convention on Biological Diversity’s Aichi Biodiversity Target 11 set a goal that at least 10% of coastal and marine areas, especially areas of particular importance for biodiversity and ecosystem services, are conserved through effectively and equitably managed, ecologically representative and well connected systems of protected areas and other effective area-based conservation measures (CBD, 2010). Underlining their importance, MPAs have also been added to the recent United Nations Treaty for the High Seas which creates a legal mechanism for their establishment in areas outside of national boundaries.
A vital component of MPA management is an effective monitoring programme that provides data-based information to enable quantification of MPA effects and an evaluation of benefits. There may also be a legal obligation to conduct monitoring through regular assessments of site conditions. Data collected in monitoring surveys can vary widely (e.g., species presence, species density, benthic cover and biomass) and numerous techniques have been employed to collect such data. The rapid advancement of ocean observation technologies has enabled the collection of increasing amounts of data at higher spatial and temporal resolutions than was previously possible (Qian et al., 2021). Added to this, developments in high performance computing, big data analytics and artificial intelligence can make processing and analysis of large datasets logistically feasible and less time consuming (Gonzalez-Rivero et al., 2020; Ditria et al., 2022). Developments to existing underwater monitoring techniques and new emerging technologies are leading to a more diverse array of options when choosing how to implement an MPA monitoring programme. Despite our increasing technological ability to collect and process large volumes of data, it is imperative that MPA monitoring avoids a ‘data-rich, information poor’ situation (Wilding et al., 2017). Ongoing monitoring programmes must be targeted to enable standardized assessments of site conditions and also suitable to inform whether management approaches should be adapted to achieve long-term conservation objectives (Nichols and Williams, 2006).
Although the adoption of emerging and novel monitoring techniques can improve data collection, where existing timeseries are in place it is important that data collection continues in a coherent manner. For this reason, many monitoring programs have retained older technologies, such as towed nets and trawls. Where a transition in monitoring technique is proposed, a long period of temporal overlap will normally be required to allow inter-calibration of the methods. However, in some cases it may be possible to supplement the older technology with modern instrumentation whilst retaining the essential original sampling characteristics (Reid et al., 2003). Where new monitoring programs are proposed then maintaining historical consistency may be less critical, although it may still be desirable to be able to compare new data with results from surrounding locations.
Often when monitoring MPAs, a non-extractive or non-invasive sampling approach is preferred in order to prevent further damage to protected sites and species so many traditional sampling techniques such as dredges, trawls and biopsy sampling are less desirable. However, the suitability of a monitoring technique depends on the conditions in which it is deployed, and the data required to address monitoring objectives. Therefore, monitoring techniques must be evaluated to determine which is the most suitable for a given objective. As a result, potential monitoring techniques should be assessed to determine which is most suitable given the monitoring scenario. Here, we present a timely overview of existing and emerging data collection techniques which can be applied to effective MPA monitoring, including applications, advantages, disadvantages and future developments (Table 1). The review is separated into three main sections, the first outlines certain platforms which can be used to carry data sensors, the second discusses observational techniques which collect data for more specified purposes and finally some processing and analytical techniques are examined to investigate methods of extracting information from collected data. It is important to note that the following review of monitoring techniques is not exhaustive and in many scenarios, it will be necessary to use different approaches which complement one another.
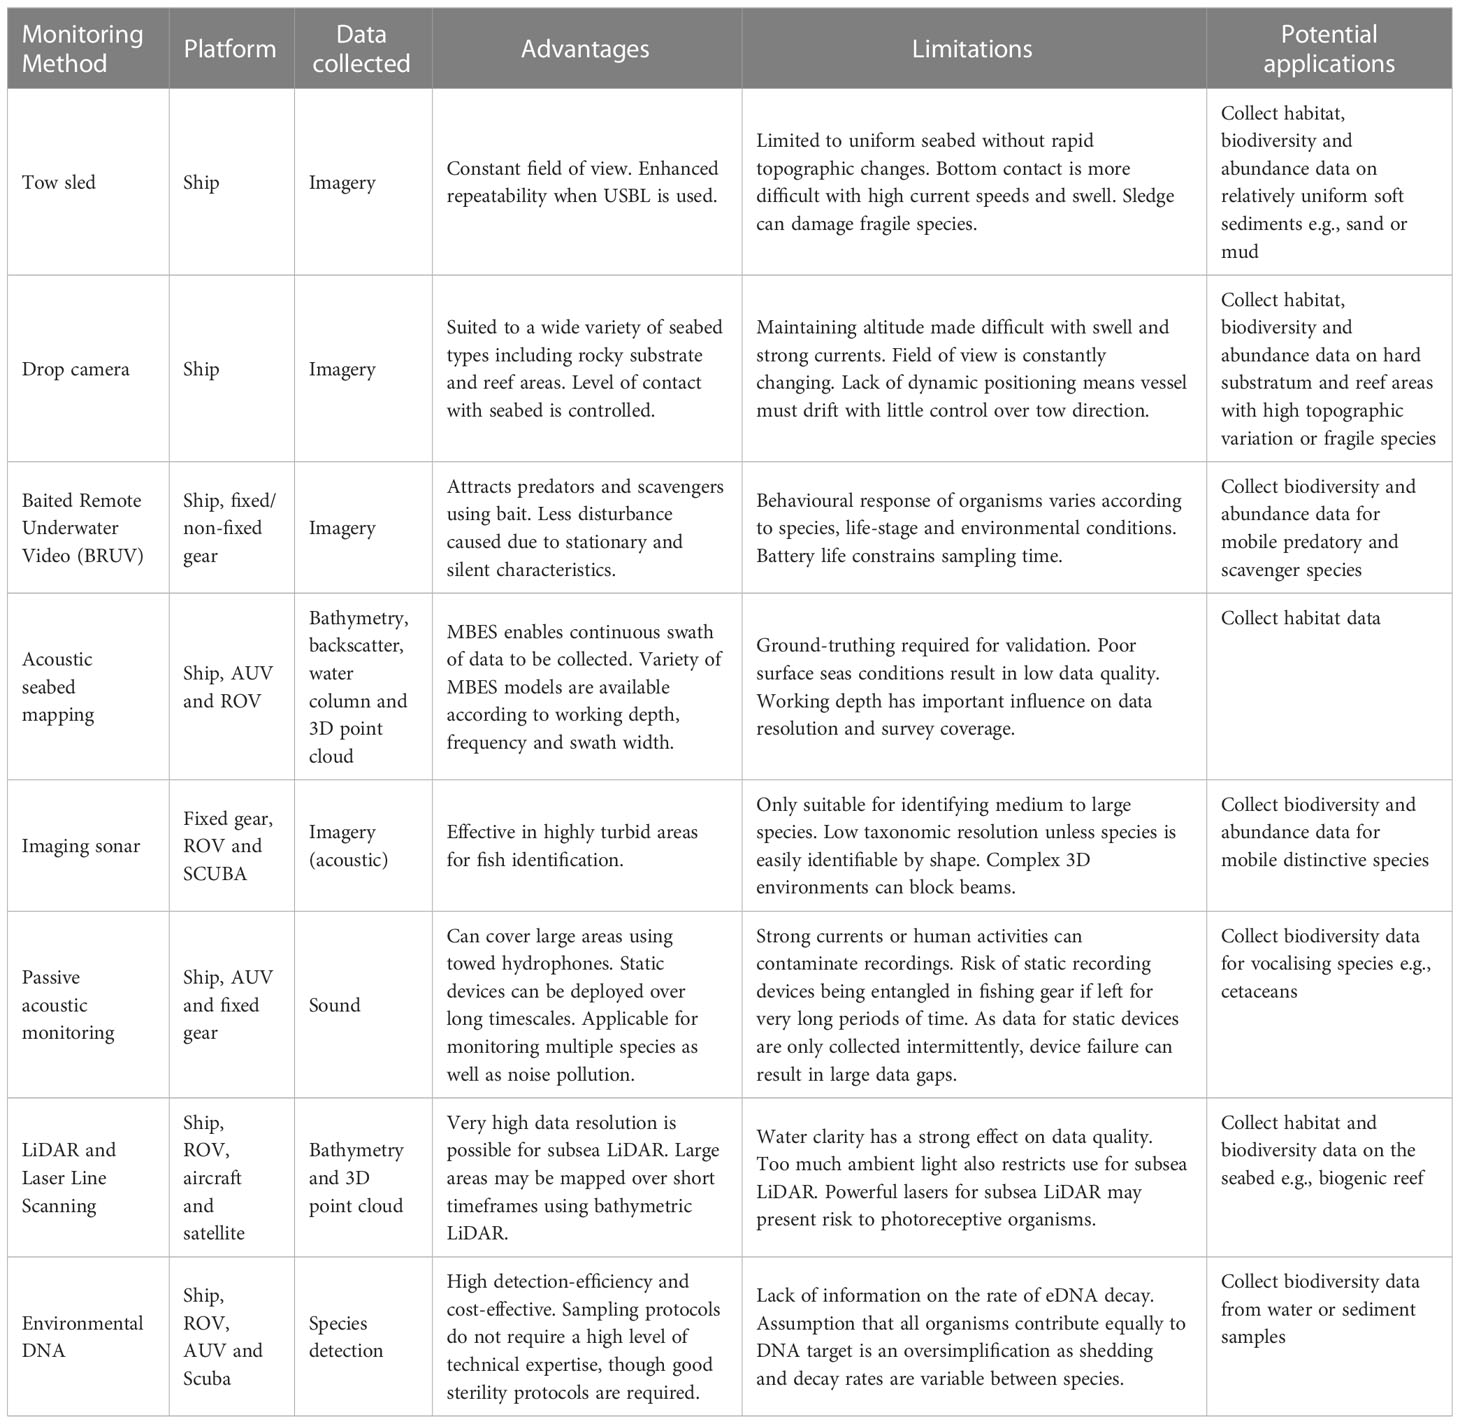
Table 1 Overview of non-extractive techniques for use in Marine Protected Area (MPA) monitoring including capabilities, advantages and limitations.
Platforms
Scientific diving
Since the 1970s, the use of SCUBA diving (Figure 1) and snorkeling in scientific research has progressively become more widespread and is now commonly conducted in shallow (<40 m) coastal areas (Witman et al., 2013). SCUBA has improved in recent decades due to better training and safety standards, enhanced understanding and treatment of SCUBA related injuries and developments to equipment such that the activity is more accessible and affordable than in the past (Wilks and Davis, 2000). Many survey techniques can be employed using SCUBA, for example, Underwater Visual Census (UVC) is used to collect abundance, species richness, size, biomass and behavioural data for target organisms. To conduct UVC, a suite of techniques can be employed (Caldwell et al., 2016), these include: the strip transect survey which involves a diver moving along a defined strip and recording the occurrence of target species and the line transect which has a diver swimming along a transect line and measuring the distance of organisms from the line. The Rapid Visual Technique is also used to record species in order of encounter in a predetermined period of time (Jones and Thompson, 1978). In addition, quadrat surveys are used to record sessile organisms and habitat data in high resolution with all features within a quadrat being recorded. Diver-operated video can also create a permanent visual record of observations and be analysed in closer detail after the dive survey is completed (Grane-Feliu et al., 2019). Video censuses are commonly applied in assessing MPA community structure, and biomass quantification with stereo-video techniques capable of allowing the user to measure the size of organisms and detect changes in morphometrics, for example (Cappo et al., 2003). However, stereo-video techniques may also require calibration procedures prior to survey work that require specific tools which can add an additional cost in time and money (Neuswanger et al., 2015; Goetze et al., 2019). Video and still imagery data can also be applied in photogrammetry and structure from motion (Nocerino et al., 2020). Recent advances in annotation software (e.g., Biigle, Squidle, Viame and FathomNet) allow collected imagery data to be annotated using taxonomic label trees which creates a lasting record of species identification and enumeration in video and still imagery data (Gomes-Pereira et al., 2016).
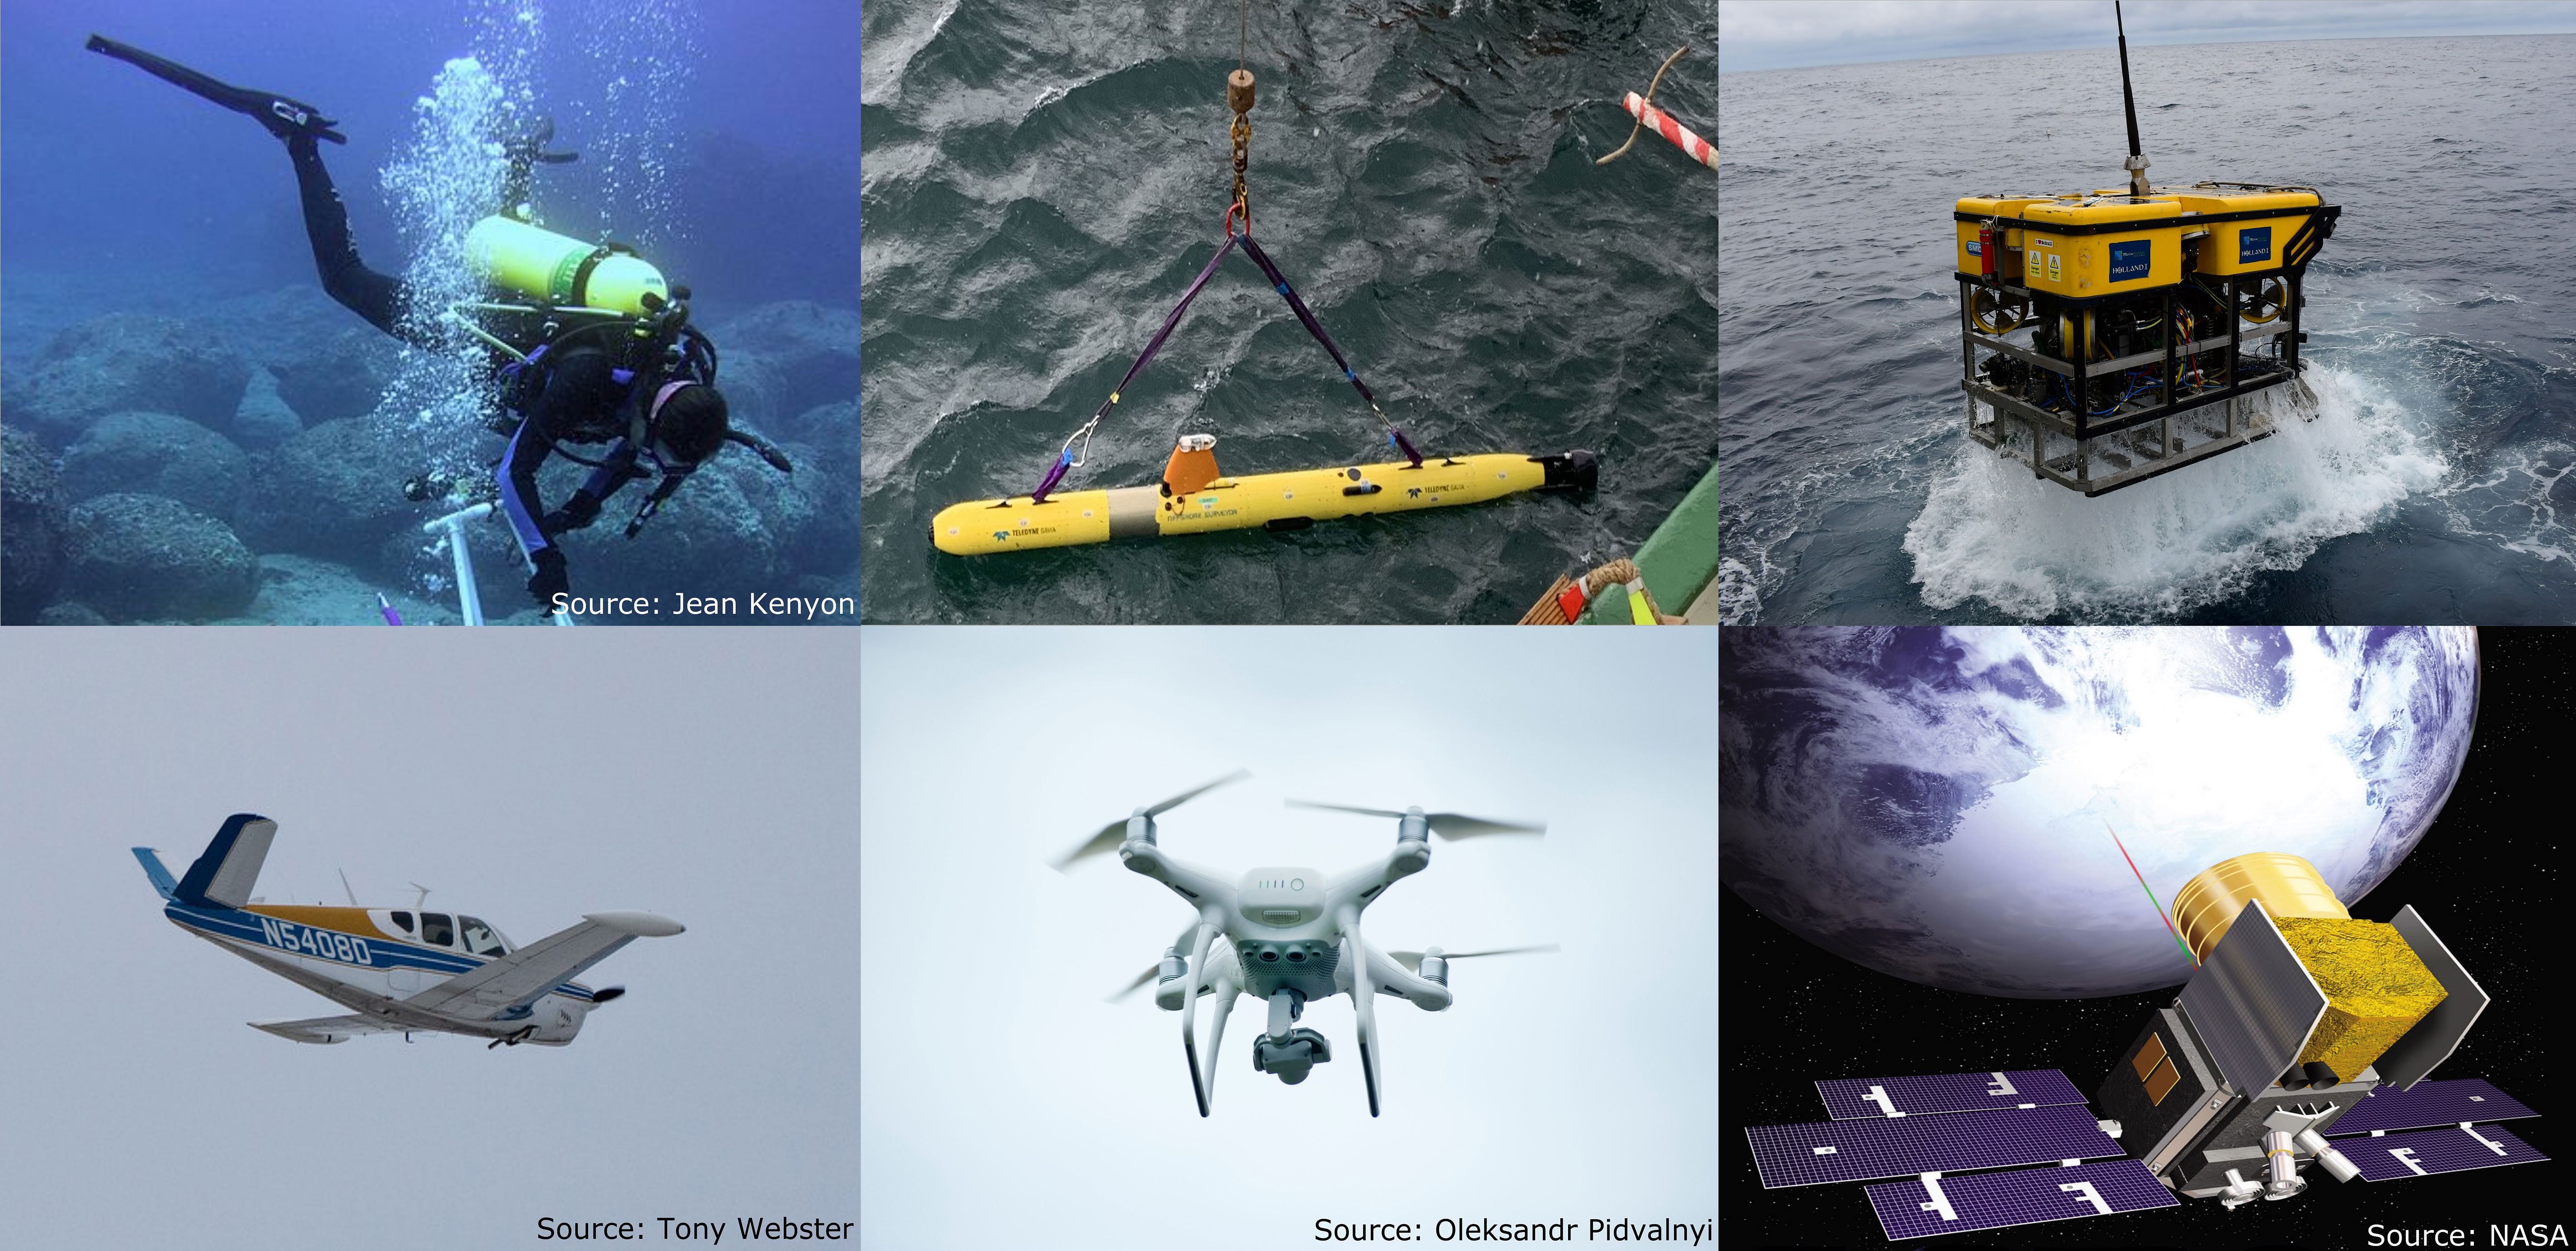
Figure 1 Top left: scientific diving, top centre: Autonomous Underwater Vehicle (AUV), top right: Remotely Operated Vehicle (ROV), bottom left: fixed-wing aircraft, bottom centre: Unoccupied Aerial Vehicle (UAV) and bottom right: satellite.
Applications of SCUBA diving techniques vary from monitoring trends of shark abundance to quantifying epibenthic communities in MPAs (van Rein et al., 2011; White et al., 2015). Diving is also used to survey shallow reef areas and rocky substrates (MacNeil et al., 2008; van Rein et al., 2009; Wartenberg and Booth, 2015). Diver-based surveys can be relatively cost-effective with equipment and training constituting the primary expenses, although specialised equipment, scientific diving qualifications and annual medical checks for multiple divers may be costly. Diving can be more accessible as a monitoring technique when compared to certain remote technologies which require the use of dedicated research vessels and specialised equipment. Scientific diving also enables in-situ observation and measurement of the environment, which is often lacking with remote techniques. The ability to record in-situ measurements mean that it is not necessary to remove target organisms, this is important in MPA monitoring where non-extractive sampling is often preferred. In addition, SCUBA diving enables access to habitats inside submarine caves and underneath polar ice which otherwise would be difficult to access by surface vessels and tethered systems.
SCUBA surveys can cause disturbance due to bubbles from open circuit systems which can result in avoidance behaviour in mobile organisms and consequently, all species not being sampled equally (Lindfield et al., 2014; Emslie et al., 2018; Raoult et al., 2020b). Moreover, diver-based methods have constraints relating to human physiological limits of depth and time underwater, currents, maneuverability, and water clarity. Maximum depth and time underwater will vary depending on whether open-circuit, closed-circuit, surface-supply or saturation diving is employed, and the type of breathing gas used (air, oxygen, nitrox, trimix etc.). Use of technical diving techniques can allow divers to reach greater depths and has been used to assess mesophotic sponges down to a depth of 91 m (Pawlik et al., 2022). In addition, mesophotic corals have been surveyed to a depth of 120 m with the use of closed-circuit rebreathers (Pérez-Rosales et al., 2022). Though, typically with increasing depth, time on the bottom is reduced while safety risk and equipment costs are higher (Lang et al., 2013). Therefore, remote technologies may be preferred in environments deeper than 40 m.
Unfortunately, health and safety restrictions have increased the costs of professional scientific diving globally, so an important development is the increasing prevalence of citizen science programmes (e.g. Seasearch, seasearch.org.uk, Reef Life Survey, reeflifesurvey.com) which use volunteer divers to collect data for marine monitoring. Such programmes can also help to improve public awareness, appreciation, and involvement in marine conservation. Moreover, valuable long-term data may be collected at a relatively low cost. Citizen science diving programmes have most commonly been used in areas that attract a large volume of recreational divers such as tropical coral reefs (Branchini et al., 2015). Furthermore, recreational dive computers can be used to collect depth profiles for in-situ temperature data (Wright et al., 2016). Volunteer divers can also complement traditional surveying methods by collecting presence and abundance data for easily recognised species (Vieira et al., 2020). However, caution must be exercised when interpreting observational data as participants may have varying levels of diving or data collection experience (Hermoso et al., 2021). Appropriate training and collection of imagery data may offset these challenges.
Autonomous underwater vehicle
Autonomous Underwater Vehicles (AUV; Figure 1) are self-propelled, untethered underwater vehicles powered by batteries. AUV missions can be pre-programmed to run accurate transect lines so that depth and track are highly repeatable. Navigational accuracy is dependent on the technique used from simple speed over ground (metre accuracy) or by sophisticated inertial finger-laser guidance systems (centimetre accuracy; (Sahoo et al., 2019)). Without an updated navigational signal, accuracy can degrade during mission duration. A typical navigational error with an inertial navigational system can be around 0.1m per kilometre travelled. AUV’s are usually deployed from a surface vessel and operate autonomously for periods ranging from a few hours up to several days. Long-range AUVs (such as buoyancy-driven ocean gliders) are capable of missions lasting up to 6 months and 6000 km, but the costs of such vehicles prevents their widespread and routine use (Furlong et al., 2012). However, single glider deployments for periods of days are a highly economic way to obtain observations at a reasonable cost. AUVs are increasingly being used in marine research due to their capabilities of collecting high resolution geophysical, biological and oceanographic data over large spatial scales (Wynn et al., 2014; Verfuss et al., 2019). Typical instrument packages include side-scan sonar, sub-bottom profilers, Conductivity Temperature and Depth (CTD) profilers and environmental sensors as well as cameras to collect underway synchronous imagery data.
AUVs have been applied to assess and monitor biotopes within MPAs with the collection of imagery to determine species density, faunal composition and identify indicator species for distinct habitats (Benoist et al., 2019). They have also been used to map benthic communities in MPAs with and without fishing activity to determine the effect of management on biota (Ferrari et al., 2018). AUVs are suitable for collecting baseline data but are also ideal for repeated surveys due to their navigational accuracy. Both imagery and sonar data may be collected in tandem, therefore, producing high quality ground-truthed maps resulting from visual and acoustic data (Wynn et al., 2014). Data resolution is highly dependent on the pre-planned mission, for bathymetry, horizontal resolutions of up to ~0.1 m at 10 m altitude are possible (Batchelor et al., 2020). For a 4-hour mission, a total distance travelled can be up to 20 km and approximately 40,000 seabed photographs may be collected with a frame rate of 4 frames per second. Photograph resolution is variable depending on the camera system used but can range from 2-12 megapixels, providing very detailed seabed photographs in either colour of black and white low light (Wynn et al., 2014). Coverage is dependent on vehicle height above seabed but an altitude of 2m provides coverage of approximately 3m x 1.5m. The ability of the AUV to provide overlapping photographic mosaics of the seafloor can enable surveys of extent and biodiversity to be obtained followed by subsequent repeat surveys to evaluate seabed change to a habitat (Wynn et al., 2014; Benoist et al., 2019).
Maximum operating depth depends on the AUV model but can be up to 6000 m (Wynn et al., 2014). Since deep water AUVs can operate close to the seabed, they can collect significantly higher resolution data for seabed mapping compared to a research vessel. Typical AUV speeds are 1.5–2.0 ms-1 (Wynn et al., 2014) so currents above 1.5 ms-1 can introduce navigational errors. As stated earlier, navigational error can be problematic with some AUV’s as duration of survey will increase the positioning error. Compared to vessel-mounted systems however the error is <10m on position, perhaps less than half the length of a typical offshore vessel. Given the position of the ship’s GPS receiver and the deployment of equipment off a ship’s stern, the error from an AUV on position is still better than that provided by most basic-equipped surface vessels. Battery endurance tends to vary with power usage, sensor operation and environmental conditions. Obstacle avoidance sonar will prevent collisions, however, with operations close to the seabed, collisions are inevitably difficult to avoid. Areas with high military, fishing or shipping activity may be less suitable for AUV deployment due to the risk of acoustic interference, entanglement with nets and collisions with underwater obstructions (Wynn et al., 2014). Challenging terrain such as cliffs and boulder-covered seabed may also present hazards and data quality issues.
Recent advances have led to the use of swarm AUV’s where multiple vehicles work together to achieve a common objective (Lin et al., 2017). This approach offers advantages such as greater spatio-temporal resolution, enhanced robustness to sensor errors and reduced survey time. Smaller, low cost AUVs have also been deployed in coral reef monitoring and compared favourably to diver-operated video (Maslin et al., 2021). In addition, resident AUV systems have been developed which involve the AUV docking at a seafloor station for battery charging in between missions (Matsuda et al., 2019). The use of resident AUVs can enable prolonged and continuous monitoring of an area and reduces reliance on research support vessels which may be prohibitively costly (Matsuda et al., 2019).
Remotely operated vehicle
Remotely Operated Vehicles (ROVs; Figure 1) are tethered platforms that can be equipped with a range of sensors and manipulative arms capable of sampling and handling. ROVs are generally controlled from a surface vessel by means of a tether which provides real-time control functionality and, for larger ROVs, power also. As such, they are dynamic, high endurance platforms providing versatile capabilities to meet survey requirements (Capocci et al., 2017). ROVs come in a wide range of sizes and capabilities from small battery operated models to large work class designs which require a dedicated operator vessel (Wheeler et al., 2013). Given their low relative costs with the hobbyists price range, small battery powered ROVs are useful for citizen science projects but because of their limited thruster power they can have the same limitation as SCUBA divers and snorkelers in that they cannot navigate effectively in higher current speed regimes(Buscher et al., 2020). However, with respect to divers who have a practical depth limitation of 30 to 50m, ROVs routinely exceed diver depth capabilities, do not require decompression time and can be depth rated to thousands of metres although costs of doing so become exponential. Large work-class ROVs have adequate power to carry hydraulic manipulators and other high-powered payload systems to operate in high flow environments and at significant depths. Common sensor packages include video and still imagery cameras, a multibeam echosounder (MBES), water chemical sensors and sediment and biological samplers, thereby providing a versatile multifunctional survey platform exceeding the capabilities of divers and other platforms (with the exception perhaps of AUVs). However, certain data types may not be compatible with one another and require different configurations and hence, separate deployments. For example, to extend swath width MBES is normally flown at 10s to 100s of metres above the seabed, but cameras typically need to be within a few meters of the seabed.
ROVs have previously been used to survey and assess the status of a deep-sea cold-water coral MPA which had undergone a fisheries closure (Huvenne et al., 2016). As flexible platforms, several ROV survey designs are possible. They can be used in ‘search and explore’ mode with real-time camera feeds allowing users to look for features of interest that may be overlooked in gridded surveys. Nevertheless, with accurate Ultra-short Baseline (USBL) navigation, gridded surveys are also possible and enable systematic surveying and mosaics of video or MBES coverage (Marsh et al., 2013; Lim et al., 2018). Transect surveys (strip or multi-stage) can also be adopted, and with no limitations on power supply, it is possible to follow transects for days if required. Finally, because ROV launch and recovery can often be time consuming, the vehicle can be towed using the umbilical to enable several locations to be explored in detail using so called ‘blue water hops’. ROVs can also be used to precisely deploy, position or recover instruments or platforms used in marine monitoring at water depths and payloads exceeding those capable by divers (Wheeler et al., 2021).
ROVs offer clear advantages in surveying complex and extreme terrain such as gullies and submarine canyons, areas which towed equipment or AUVs are less effective or too risky to deploy (Ayma et al., 2016; Price et al., 2019). Another advantage is their ability to vary survey speeds and slow down on-the-fly to increase survey resolution and observe features of interest, comparable to pre-programmed AUVs, but also in a real-time mode with direct control by operators on the surface. If enough free tether is used, perhaps aided by a tether management system, surface weather conditions do not interfere with data quality as the ROV is not jerked by the tether when the vessel is pitching. However, comparable with AUVs and divers weather conditions pose important constraints during launch and recovery. Significant movement of the vessel relative to the sea surface can lead to heightened risk of the umbilical snapping as well as risks from the ROV swinging during launch or recovery. In addition, ROVs have been shown to compare favourably to snorkelers and Agassiz trawling methods in terms of the diversity and abundance of species recorded (Ayma et al., 2016; Raoult et al., 2020b).
Despite the advantages, large ROVs can be very expensive to buy and operate (costing several million euros), and often require their own Launch and Recovery System (LARS) and technical team. Large ROVs can only be operated with vessels which can accommodate the LARS, control and maintenance workshop containers and technical crew. This has budgetary implications but may also restrict space and number of personnel for other operations. In terms of potential biases, the lights and noise emanating from a ROV which disturb some organisms, cause avoidance and bias assessments (Trenkel et al., 2004). Conversely, lights on the ROV may attract other organisms which can obscure the field of view and bias counts as the same individual may be repeatedly counted and may also follow the ROV if the lights are attracting prey (Robison, 1995; Trenkel et al., 2004). Flash still photography can avoid this on BRUV, AUV and diver surveys although ROVs need permanent lighting to navigate.
Underwater robotics is a rapidly evolving field and many of the advances in AUV navigation tools can be adapted to ROVs enabling them to work on an autopilot setting or for pilot alarms. Hybrid-ROVs that can operate as AUVs for part of a survey may also become more common (Li et al., 2013).
Aerial
Crewed aerial surveys have been used to monitor coastal areas for decades (Finley and Renaud, 1980; Marsh and Saalfeld, 1989). Applications include surveys for large fauna near the surface (Rowat et al., 2009), but the technique has also been applied to jellyfish in open sea conditions (Houghton et al., 2006). Aircraft (Figure 1) may also be used to collect imagery or LiDAR data which can be analysed post-flight (Wedding et al., 2008; Bröker et al., 2019). Flight altitude and speed will depend on observability of the target as well as safety considerations. Although crewed aircraft can cover large distances (26.3 – 990 km) for long durations (30 – 480 min; Colefax et al., 2018), operations may be limited by cost and weather conditions. Observability will be limited by depth, water clarity, sun glare, sea state and cloud cover which can also depend on flight altitude.
Unoccupied Aerial Vehicles (UAV; Figure 1) or drones are increasingly being used in marine ecology studies (Colefax et al., 2018; Butcher et al., 2021). They involve an unoccupied aircraft, ground controller and wireless communications between the two. Two main types of UAV exist: fixed-wing and multi-rotor. Fixed-wing UAVs can survey larger distances for longer durations and are used for speed and efficiency and they often require assistance with take-off and a clear area for landing. On the other hand, multi-rotor UAVs are smaller, have hovering capabilities and are more dynamic. They take-off and land vertically and can be launched and recovered from a moving vessel. However, small multi-rotor UAVs are less stable in poor weather conditions and have shorter flight times. The use of UAVs has led to many applications which include tracking sharks, photo-identification of individual killer whales, assessing coral health and surveying mangrove forests and rocky shores (Durban et al., 2015; Levy et al., 2018; Schaub et al., 2018; Castellanos-Galindo et al., 2019; Butcher et al., 2021). There has been less attention on potential disturbance from such vehicles, but this aspect needs to be considered during survey planning (Dunn et al., 2021). For example, foraging sea turtles have shown no evasive behaviour to UAVs at 20-30m altitude while conversely crocodiles have shown a range of behavioural reactions to UAVs flown below 50m (Bevan et al., 2018). Flight pattern, engine size and UAV size will contribute to the level of disturbance on wildlife (Mulero-Pazmany et al., 2017).
UAVs are more cost effective, ranging from €100-10,000, and accessible in comparison to crewed aircraft and are more suitable for collecting high resolution data for smaller areas. They are also useful when cloudy conditions prevent the use of airborne or satellite imagery. UAVs are also a better option when difficult terrains present safety issues for crewed aircraft. However, like other airborne techniques they are also dependent on weather conditions with sea state, sun reflection, water clarity and depth significantly affecting data quality and most sensors penetrating to 30m depth at best. In addition, many countries have regulations which restrict UAV use to within the line-of-sight of the operator (Colefax et al., 2018). Nevertheless, UAVs are becoming increasingly more compact, cost-effective and autonomous with enhanced visualisation capabilities, greater payloads and range improvements (Chirayath and Earle, 2016; Johnston, 2019). Further technological improvements, alongside standardised operational protocols to reduce disturbance and ensure comparability across studies (e.g. Raoult et al., 2020a) will likely make UAVs an increasingly attractive option to conduct marine monitoring and expand their use in coastal environments.
Satellite
Many satellites (Figure 1) launched into earth’s orbit are fitted with sensors capable of recording continuous environmental data for bathymetry, temperature, currents, productivity and ice on a very large scale. A wide variety of applications are possible with satellite data including mangrove, seagrass and coral reef monitoring, benthic habitat mapping and the identification of potential conservation areas (Ferwerda et al., 2007; Kanniah et al., 2015; Magris et al., 2015; Li et al., 2020). Several freely available medium to high spatial resolution datasets offer long-term information with almost global coverage and are highly beneficial for providing repeatable standardised data, particularly for upper ocean layers and shallow MPAs (Kachelriess et al., 2014; McCarthy et al., 2017). Satellite technology has also been used to track surfacing animals fitted with transmitters for insights into distribution and migrations (Hays and Hawkes, 2018). In terms of protected area enforcement, satellites can be utilized to track vessels to monitor potential illegal fishing inside large remote MPAs (McCauley et al., 2016; Kanjir et al., 2018).
Satellite data may cover virtually any section of the earth’s surface including remote and inaccessible areas otherwise difficult to monitor. Although the initial cost of launching a satellite into orbit is expensive (ranging in the 10s to 100s of millions of euro), the use of widely available free satellite data is generally quite cost-effective and timesaving when compared to chartering aircraft or research vessels. Many satellite data sources are available via open-source platforms such as USGS Earth Explorer and Copernicus data streams, though a small fee may be incurred in terms of data usage during downloads. The longest data time series is available from the 1970s to present for the AVHRR and Meteosat series. High spatial resolution imagery data are available from the Quickbird and INKONOS satellites at a resolution of up to 1 m (McCarthy et al., 2017). Temporal resolutions can be up to 15 minutes for the Meteosat series, though, 1-5 days is more common (McCarthy et al., 2017).
The major constraint in using satellite data to monitor marine areas, similar to UAVs, is that most sensors can only penetrate up to approximately 30 m, in ideal conditions, due to light absorption in water limiting their use to shallow, low turbidity areas (Kachelriess et al., 2014; Poursanidis et al., 2019). The exception is the use of satellite-based altimeters which use sea surface height to measure low resolution bathymetry (Calmant and Baudry, 1996). The relatively coarse resolution of satellite data will also make it unsuitable for many fine-scale applications that require high levels of detail. Satellite data are also heavily affected by the presence of clouds which is an important consideration as global cloud cover is approximately 68% (Stubenrauch et al., 2013; McCarthy et al., 2017). However, microwave based sensors can be used to mitigate this problem as they are capable of penetrating clouds (Li et al., 2020). In addition, a spatial and temporal bias may exist, for example, cloud cover is lowest in subtropical regions (20°N and 20°S) and varies based on time of year (Stubenrauch et al., 2013).
Satellite systems continue to improve imaging capabilities while collecting better spatial and spectral resolution data. These improvements have recently led to the use of very high resolution satellite imagery to detect baleen whales using the WorldView-3 satellite (Cubaynes et al., 2019). The satellite imagery had a spatial resolution of 31 cm which enabled the identification of fin whales, humpback whales, southern right whales and grey whales in several distinct locations around the world (Cubaynes et al., 2019). The use of very high resolution satellite data provides further opportunities in marine monitoring and has recently been applied to mapping coastal habitats and detecting changes in coral communities over time (Ampou et al., 2018; Poursanidis et al., 2018).
Observational techniques
Camera systems – tow sled
Towed camera systems (Figure 2) are used to assess seabed composition and epifaunal/interface species assemblages in predominantly sedimentary areas of seabed. They comprise a frame, camera(s) and lighting source mounted on a sledge which is deployed from a vessel and towed via an armoured data cable as the vessel moves along a predefined transect. Video and still imagery data are collected, and the data cable enables observation in real time to assist in obstruction avoidance. Camera sledge systems are deployed onto the seabed and then towed whilst in contact with the seafloor. Ideally, this system is deployed over sedimentary areas although can also be used on cobble pavements or similar flat areas of hard substrata. Cable adjustments can be made to ensure the sledge remains in contact with the seafloor as topographic features are navigated. Two-camera configurations are commonly used in towed camera systems. One obliquely angled, forward facing camera used to collect video data and a separate downward facing camera for still image capture plus scaling lasers identifiable in both fields of view (Coggan et al., 2007; Hitchin et al., 2015). Towing the system into the prevailing tidal flow assists in removing disturbed sediment away from the field of view and reduces the potential for obscured imagery data.
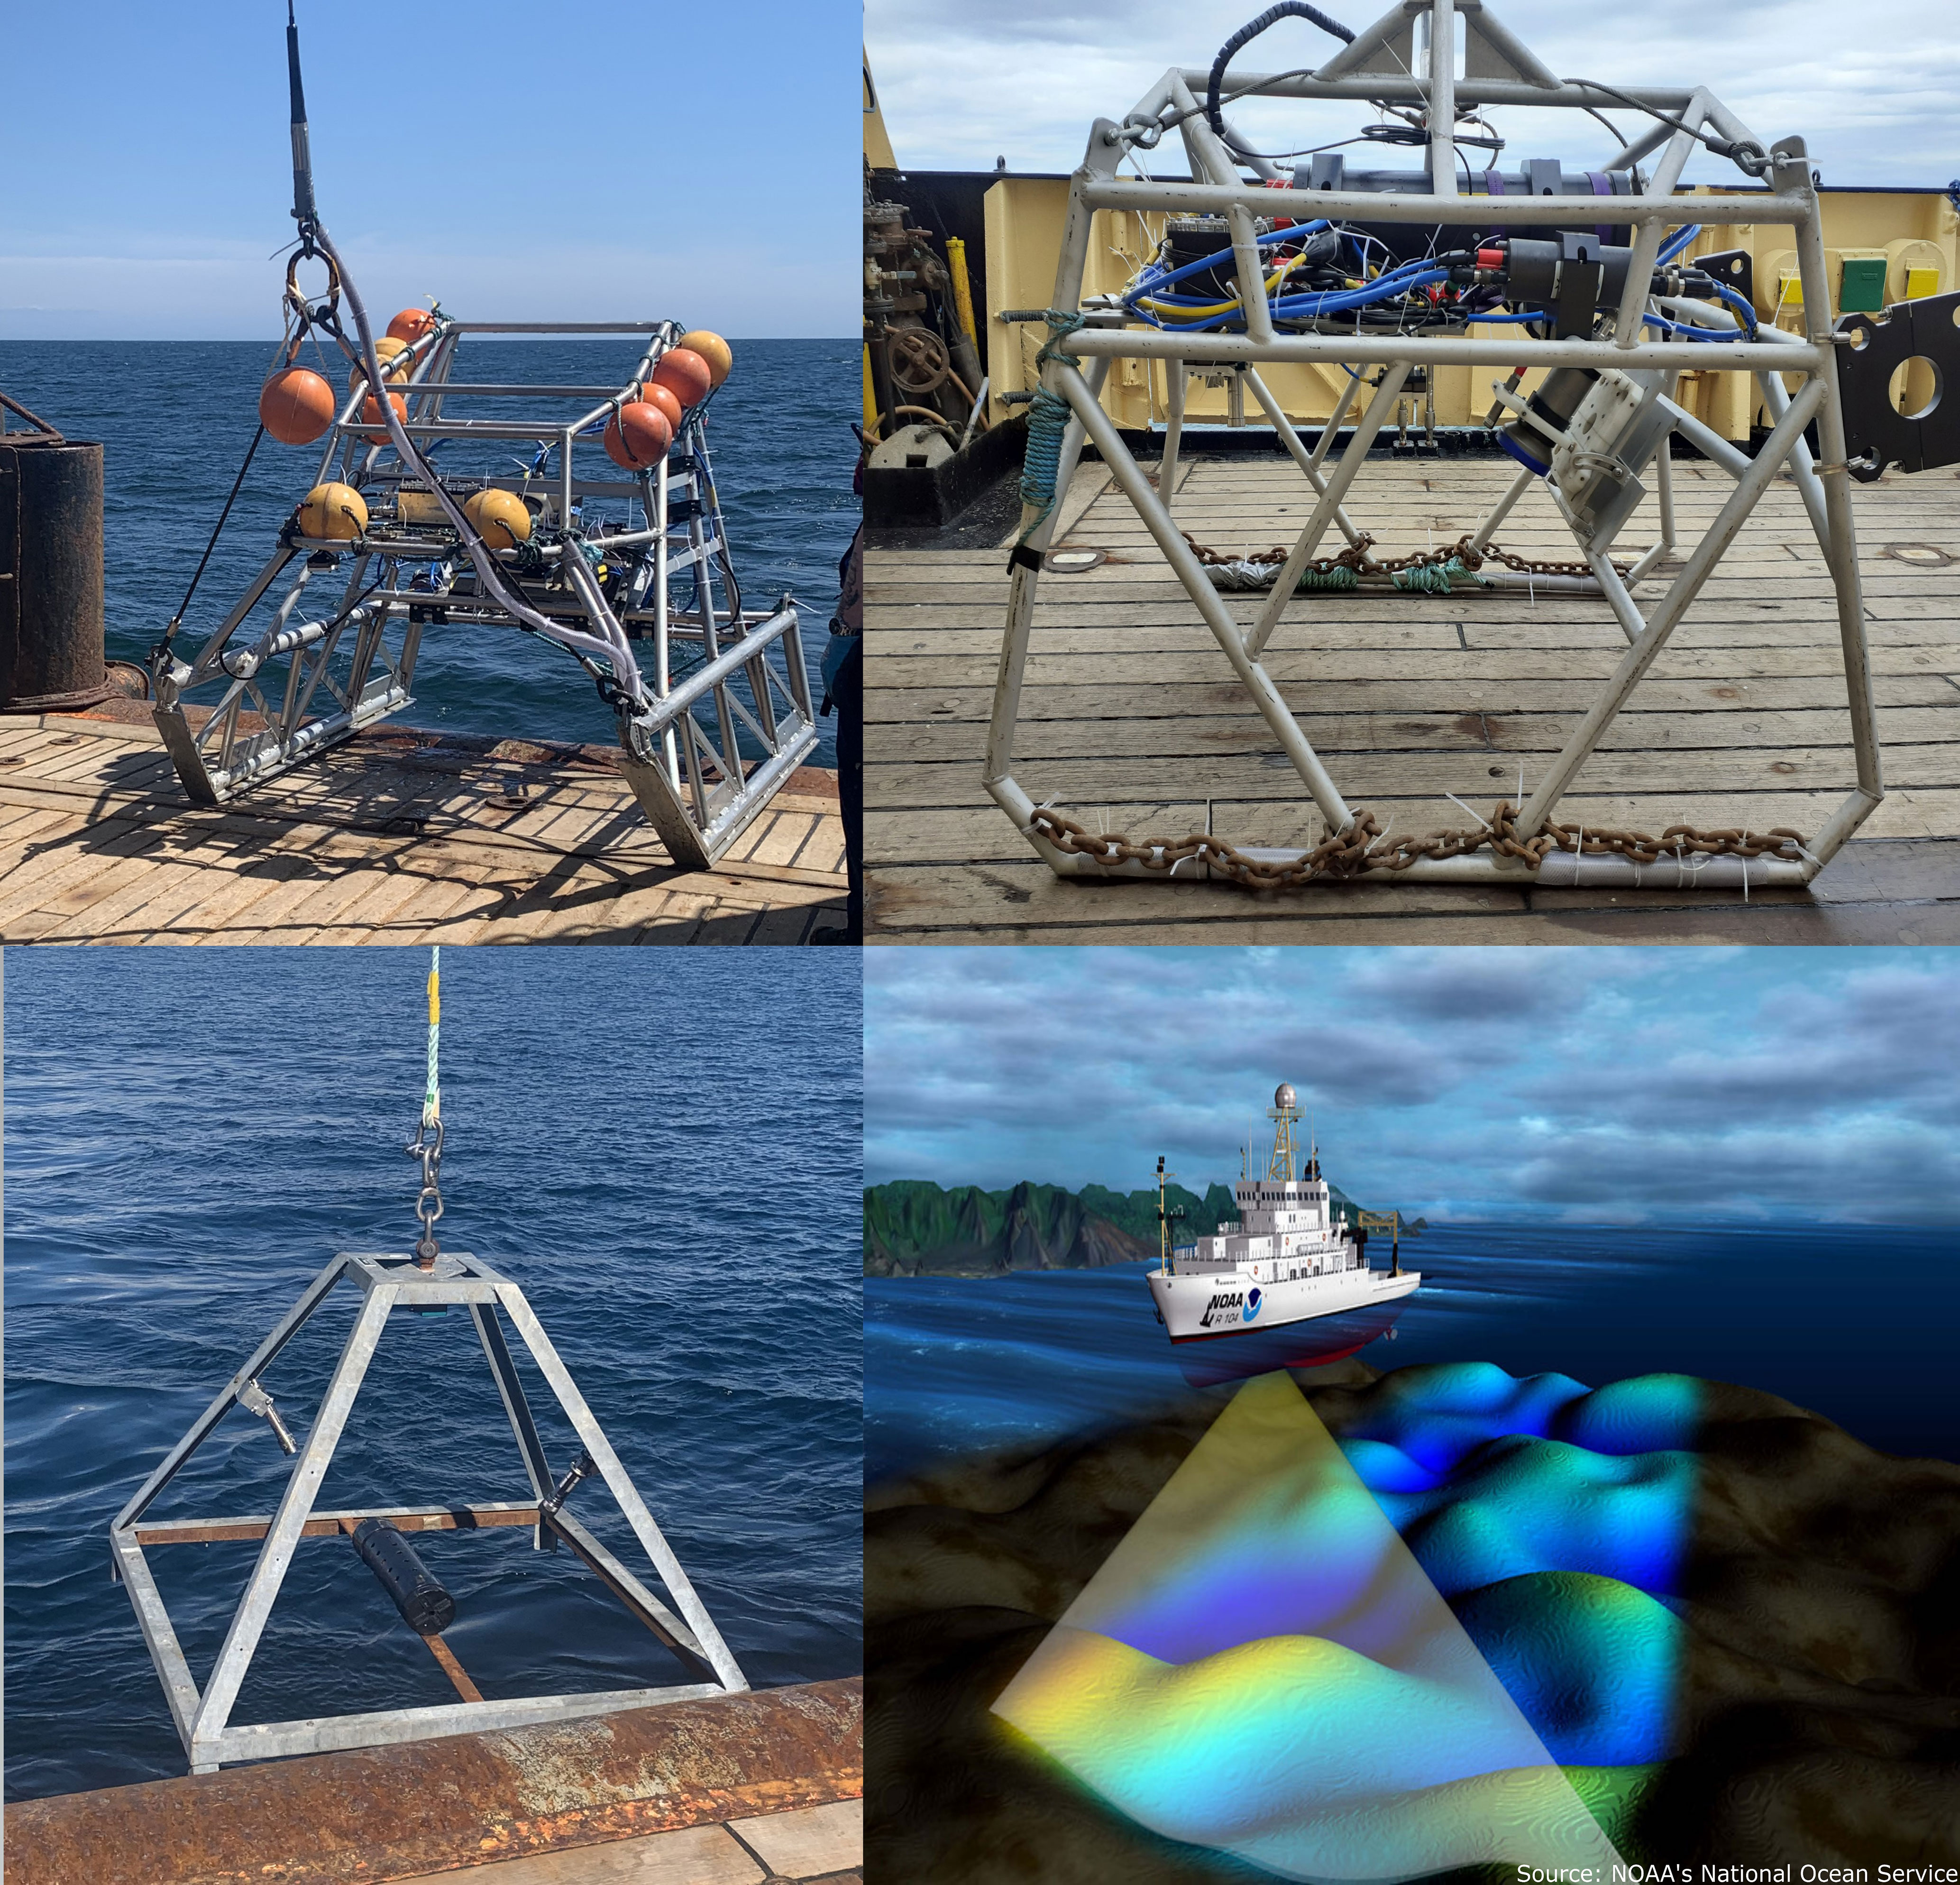
Figure 2 Top left: towed camera, top right: drop camera, bottom left: Baited Remote Underwater Video (BRUV) and bottom right: Multibeam Echosounder (MBES).
The position of the camera frame on the seafloor can be determined either using an USBL beacon or through layback calculations from the ship’s position (in depths <200 m and assuming currents are sufficiently weak) as recommended in UK national operational guidelines for epibiota monitoring (Hitchin et al., 2015). USBL is considered best practice, especially on larger vessels, when currents are strong and in deep waters. If USBL is not available, layback calculations can be made by recording the amount of cable out and mean water depth along the transect. If deploying camera systems from small vessels, the position of the vessel can be used as a proxy for camera location if the water depth is less than ~25 m and currents are weak (Hitchin et al., 2015).
Towed camera systems have previously been applied in MPA monitoring on several occasions such as to characterise habitats, identify reef species and estimate population size on the west Florida Shelf (Brizzolara et al., 2020). They have also been used to monitor changes in the number of taxa and functional richness in an MPA off the coast of England (Davies et al., 2022b). An advantage of towed camera systems is that they offer a constant field of view and repeatability of transects to enable quantification and monitoring of the same feature. The act of towing means that transects can be repeated to a high degree of accuracy compared to drifting and the use of USBL transponders will allow the system to be towed as close as possible over past coordinates. This repeatability means that targets can be monitored more confidently over time rather than sampling different sections of an area which confounds the ability to assess change.
The use of towed camera systems is limited to relatively uniform areas of seabed with the absence of rapid topographic changes and boulders. Therefore, the technique cannot be utilised across the entire spectrum of marine substrata. Current speeds and swell height will also impact the ability of the system to maintain contact with the seabed. Additional cable will likely have to be payed out and additional weight may have to be fitted to ensure bottom contact. In addition, the use of a benthic sledge introduces the risk of potentially damaging fragile and/or slow growing seabed features and epifauna (e.g. biogenic reefs, seapens and cold-water corals). However, the risk of damaging seabed features may be mitigated with the use of neutrally buoyant non-bottom contacting towed systems deployed at a set altitude above the seafloor (Sheehan et al., 2010). These systems have minimal contact with the seabed with only a thin gauge ballast chain interacting with the seafloor, to maintain altitude over undulating seabed through weight compensation. However, it is also important to note that biodiversity metrics collected using towed camera systems may vary with differing levels of bottom-contact (Sheehan et al., 2016).
Greater affordability of quality, high definition cameras will make towed camera systems a more attractive technique in the future for a wider group of investigators. Efforts have also been made to create new towed camera platforms that integrate acoustic devices that simultaneously collect imagery and sidescan sonar data which is particularly useful for deep-sea habitats (Purser et al., 2019). In terms of data processing and analysis, the increasing use of machine learning to automatically detect features of interest in imagery data will limit the time needed to process vast quantities of collected footage (Mohamed et al., 2018).
Drop camera
Drop camera systems (Figure 2) utilise the same equipment and share most principles of use with camera sledge systems. However, drop camera systems are suspended above the seabed rather than towed across the sediment surface. They are best suited for use over hard substratum and reef areas with comparatively high levels of topographic variation or fragile epifaunal taxa that would be adversely impacted by tow sled systems. They tend to yield best results when deployed with dynamic positioning which enables slow tow speeds and greater directional control. Drop cameras can also be used for spot sampling (single observation), or for bed hopping whilst the vessel drifts. Bed hopping provides a series of close-up shots of the seabed, as well as a wider view of the transect overall.
Drop camera systems have been used to provide an assessment of demersal fish and benthic invertebrate communities on the Rosemary Bank MPA in the North Atlantic, particularly around the pinnacle of a seamount (Eerkes-Medrano et al., 2020). They have also been used as a cost-effective method of surveying the distribution and habitat associations of rocky reef fish in the northeast Pacific (Easton et al., 2015). These systems can be used in a wide variety of seabed substrata, including areas that are topographically complex and have rock and/or reef features. The frame can be lowered onto the seafloor if the aim is to collect close up images, or it can be suspended above the seafloor to provide a wider field of view. Therefore, the level of contact with the seafloor can be controlled to minimise damage to seabed organisms.
Large swell heights and strong currents can make maintaining a steady altitude above the seabed difficult. This can be reduced with heave compensating winches and manual counter action from winch operators but there is a limitation to their effectiveness. The roll of a vessel can also exacerbate swell effects if the system is deployed over the side. Deploying from the stern can reduce this problem but is more likely to expose the system to greater effects of pitch. Large swell heights can also increase the likelihood of the system colliding with the seabed and creating sediment plumes which obscure the field of view. Another issue with utilising drop cameras for assessment of assemblages using quantitative metrics is that the field of view is constantly varying due to changing altitude above the seabed. This can be mitigated using scaling lasers. However, post-processing of extracted data is compromised by the area in view being in constant flux. When dynamic positioning is not available, vessels must drift when gear is deployed to ensure cables do not wrap around rotating propellers. This means that drop camera deployments can be uncontrolled drifts with direction of travel being dictated by prevailing wind and tide conditions.
Like towed systems, most of the future technological advances in drop camera systems will likely involve improvements to camera resolution, reductions in cost and the increasing automation of data processing and analysis. Easy to operate and affordable drop cameras have been designed for use in deep-sea environments (Dominguez-Carrió et al., 2021). It is also possible to use a bottom following Lagrangian float capable of adjusting its depth to collect imagery data of the seafloor (Roman et al., 2011). The float is equipped with a GPS/iridium to obtain positions at the surface, and acoustic and RF beacons are used for backup locating. The floating drifters are transported by horizontal currents which significantly reduces vessel requirements during data collection.
Baited remote underwater video
Baited Remote Underwater Video (BRUV; Figure 2) consists of a frame holding suitable bait and a camera linked to one or more light sources. The system is deployed and recovered using a tether, or for deep deployments can be free-falling and released using a timed or acoustic mechanism to drop ballast weights (Bailey et al., 2007). Current meters, CTD profilers or other scientific instruments may also be attached to collect ancillary data. BRUVs have been used to examine species assemblages and study animal behaviour (Espinoza et al., 2020; O’Hea Miller et al., 2023). Due to their stationary and silent nature, BRUVs cause less disturbance to animals compared to divers and towed or powered vehicles (Stoner et al., 2008; Emslie et al., 2018). In recent times, the introduction of cheap and widely available digital ‘action cameras’ and waterproof housings has led to more frequent use of BRUVs in marine habitats and has increased their popularity in citizen science projects (Florisson et al., 2018). The systems are also commonly configured without the use of bait in the form of Remote Underwater Video (RUV), which have been observed to have an effect on the assemblages that are recorded (Harvey et al., 2007).
Numerous studies have deployed BRUVs within and around MPAs and they have been used to demonstrate changes linked to management measures as well as identifying suitable sites for protection (Letessier et al., 2019). Although historically used for imaging benthic and demersal species, there has been increasing interest in deploying BRUVs in the water column. Letessier et al. (2019) recorded observations of pelagic fishes and sharks using benthically anchored BRUVs moored in mid-water. Pelagic BRUVs tend to be lighter, easier to deploy and cheaper to construct and have been used to identify wildlife hotspots (Letessier et al., 2019), examine aggregations around seamounts (Bouchet et al., 2020) and assess temporal community stability in submarine canyons (Forrest et al., 2021).
The simplest metric obtained using video monitoring techniques is species presence. Other commonly recorded metrics are time to first arrival (tarrival), maximum number of a species observed (MaxN) and the timing of maximum observations (tMaxN). Intuitively, these metrics should be related to the local abundance of a species; however, multiple factors influence how organisms detect, respond to and behave around BRUVs (Martinez et al., 2011; Sherman et al., 2018). To extract size information, BRUVs with two cameras mounted at specific angles have been used to achieve stereo-imaging (Elliott et al., 2017). Stereo-BRUVs have been effectively used to estimate fish lengths and when combined with abundance data can prove valuable in monitoring studies.
Although BRUVs are often effective in detecting cryptic species, the behavioural response of organisms will vary depending on species, life-stage and environmental conditions (Priede and Bagley, 2000). Baited observing systems tend to attract a disproportionate number of predators and scavengers and agonistic interactions may prevent some species from approaching the bait (Cappo et al., 2004; Hardinge et al., 2013). Observations are also heavily influenced by illumination and turbidity. White light may affect organism behaviour so red light has been used, though objects may be more difficult to identify and a smaller area will be illuminated due to the attenuation of red light in seawater (Fitzpatrick et al., 2013). The type and freshness of bait can have a large influence on species attraction and can be difficult to standardise between studies (Harvey et al., 2007). The most effective bait will vary between locations, likely reflecting local faunal composition but oily baits generally seem most effective (Jones et al., 2020). To prevent odour plumes overlapping and possible double counting of individuals, a minimum distance between BRUVs is recommended. Bait detection concentrations and swimming speeds will be species and size specific so users should consider these factors as well as current speeds and directions, soak times and the influence of tides when choosing a minimum distance (Whitmarsh et al., 2017).
New directions and developments include the use of artificial intelligence and deep learning for automated identification of marine organisms in BRUV footage which can decrease processing time and improve the rate of correct identification (Villon et al., 2018). Recently, BRUVs have been used in an MPA to the west of Scotland to identify individual flapper skate based on their dorsal spot pattern (Benjamins et al., 2018). Moreover, to help increase the field of view, the use of cameras with 360-degree recording which enables panoramic imaging may aid in detecting species missed by traditional uni-directional cameras (Kilfoil et al., 2017). Finally, battery life tends to be a constraint on soak time, particularly if continuous recording is required. However, innovative approaches using supplementary solar power to charge pelagic BRUVs has enabled recording for over 24 h and comparisons of day versus night observations (Torres et al., 2020).
Acoustic seabed mapping
Various acoustic techniques have been used to acquire data on the seabed, including the single beam echo sounder, side scan sonar and MBES (Figure 2). However, in recent decades, acoustic surveys have primarily been conducted using MBES systems (Lurton, 2002). Acoustic signals are emitted in a fan shape from the transducer and beamforming is used to extract directional information from returning sound waves producing a swath of seabed data from each ping. To measure distance to the seabed, the two-way travel time between transmission and reception of an acoustic pulse is calculated using the known speed of sound in water, influenced by variables such as temperature, salinity and depth. MBES systems are mostly ship mounted, though they can also be installed on ROVs and AUVs operating closer to the seabed to produce higher spatially resolved data. While MBES is widely used in hydrography, navigation, offshore resource exploitation, archeology and geology, its use in ecological monitoring is more recent.
In the context of MPA monitoring, MBES has been used in combination with ground-truth data to produce benthic substrate and habitat maps by combining bathymetry, seabed slope and backscatter information which has contributed to the management of various designated sites (Copeland et al., 2013; Innangi et al., 2019a). The collection of MBES data, particularly in areas of dynamic sedimentary seafloor enables the collection of baseline data for monitoring environmental change and mapping the distribution of habitats and species across different spatial scales. Backscatter data from MBES can be used to discriminate and classify seabed sediments which may be useful for identifying habitat types (Gaida et al., 2018; Runya et al., 2021). Generally, high reflectivity of the return signal (backscatter strength) tends to indicate hard substrates such as rock and gravel, while low reflectivity signifies soft sediments such as fine sand and mud (Lurton and Lamarche, 2015). However, ground-truthing using grabs and/or underwater video is required to validate substrate type. MBES can also provide scattering data for objects in the water column which can be used to evaluate fish, marine mammal and zooplankton populations, map kelp ecosystems, examine suspended sediments and detect gas plumes emerging from the seafloor (Colbo et al., 2014). The various data types collected from the same instrument underlines the multi-purpose nature of MBES which enables collection of seabed and water column data simultaneously.
A variety of MBES systems are available depending on the preferred working depth, operating frequency and swath width. Higher frequencies are used for shallow depths and low frequencies for deeper areas. Higher frequencies are also required if targeting small objects in the water column such as zooplankton or suspended sediments (Colbo et al., 2014). These frequencies also tend to provide greater resolution data than lower frequencies in shallow water areas. In shallow areas (< 20 m), horizontal resolution of 0.25 m is possible using a frequency of 300 kHz (Ierodiaconou et al., 2018). While the Challenger Deep within the Mariana Trench, at a depth of approximately 10,924 m, has been mapped at a gridded resolution of 75 m at 12 kHz (Bongiovanni et al., 2021). Using MBES in deep water will result in a wider swath width, and therefore, greater coverage and reduced survey time for a given unit of area when compared to shallow water.
Like many other techniques, the use of MBES is negatively influenced by poor sea conditions. Adverse conditions can result in poor data quality as well as making it more difficult for a vessel to maintain a constant heading on tracklines. Its use can have the potential to cause a behavioural response in marine mammals which may require mitigation (Lurton, 2016) MBES is also expensive, has high power requirements and produces copious amounts of data, particularly if bathymetry, backscatter and water column data are all being logged. However, with cheaper methods of data storage becoming available, this issue has somewhat been alleviated. Most multibeam systems operate around a single frequency (i.e., monochromatic). However, recent advances in sonar technology have resulted in MBES systems being capable of using multiple frequencies simultaneously to offer improved classification of seafloor characteristics (Brown et al., 2019). Advances in data processing, such as object-based image analysis and automatic feature detection also have the potential to significantly reduce processing time (Summers et al., 2021). Moreover, automating data segmentation may also provide more reliable, reproducible and objective results compared with expert (‘by eye’) interpretation approaches (Huvenne et al., 2007).
Imaging sonar
Imaging sonars (Figure 3) such as Dual-Frequency Identification Sonar (DIDSON) and ARIS is another class of imaging sonar that produces sound pulses and uses returning echoes to create digital images at close range. DIDSON sonar has a range of up to 12 m from the camera on high frequency settings (1.8 MHz) and up to 30 m on low frequency settings, though with lower resolutions (1.1 MHz; Artero et al., 2021). Higher frequency settings also tend to produce clearer images. DIDSON cameras emit horizontal, line focused beams which create images with a high enough resolution to enable identification of individual fish (Holmes et al., 2006). Data which can be extracted from this class of sonar include abundance, length, behaviour and direction of movement (Moursund et al., 2003). DIDSON has previously been applied in fisheries stock assessment and small-scale monitoring studies, particularly in low light and high turbidity conditions (Moursund et al., 2003). For example, it has been used to determine abundance, size structure and spatial distribution of large demersal fish in rocky marine habitats off French Guiana (Artero et al., 2021). It has also been used to examine the abundance, distribution and behaviour of a range of fish species in an estuary (Becker et al., 2011).
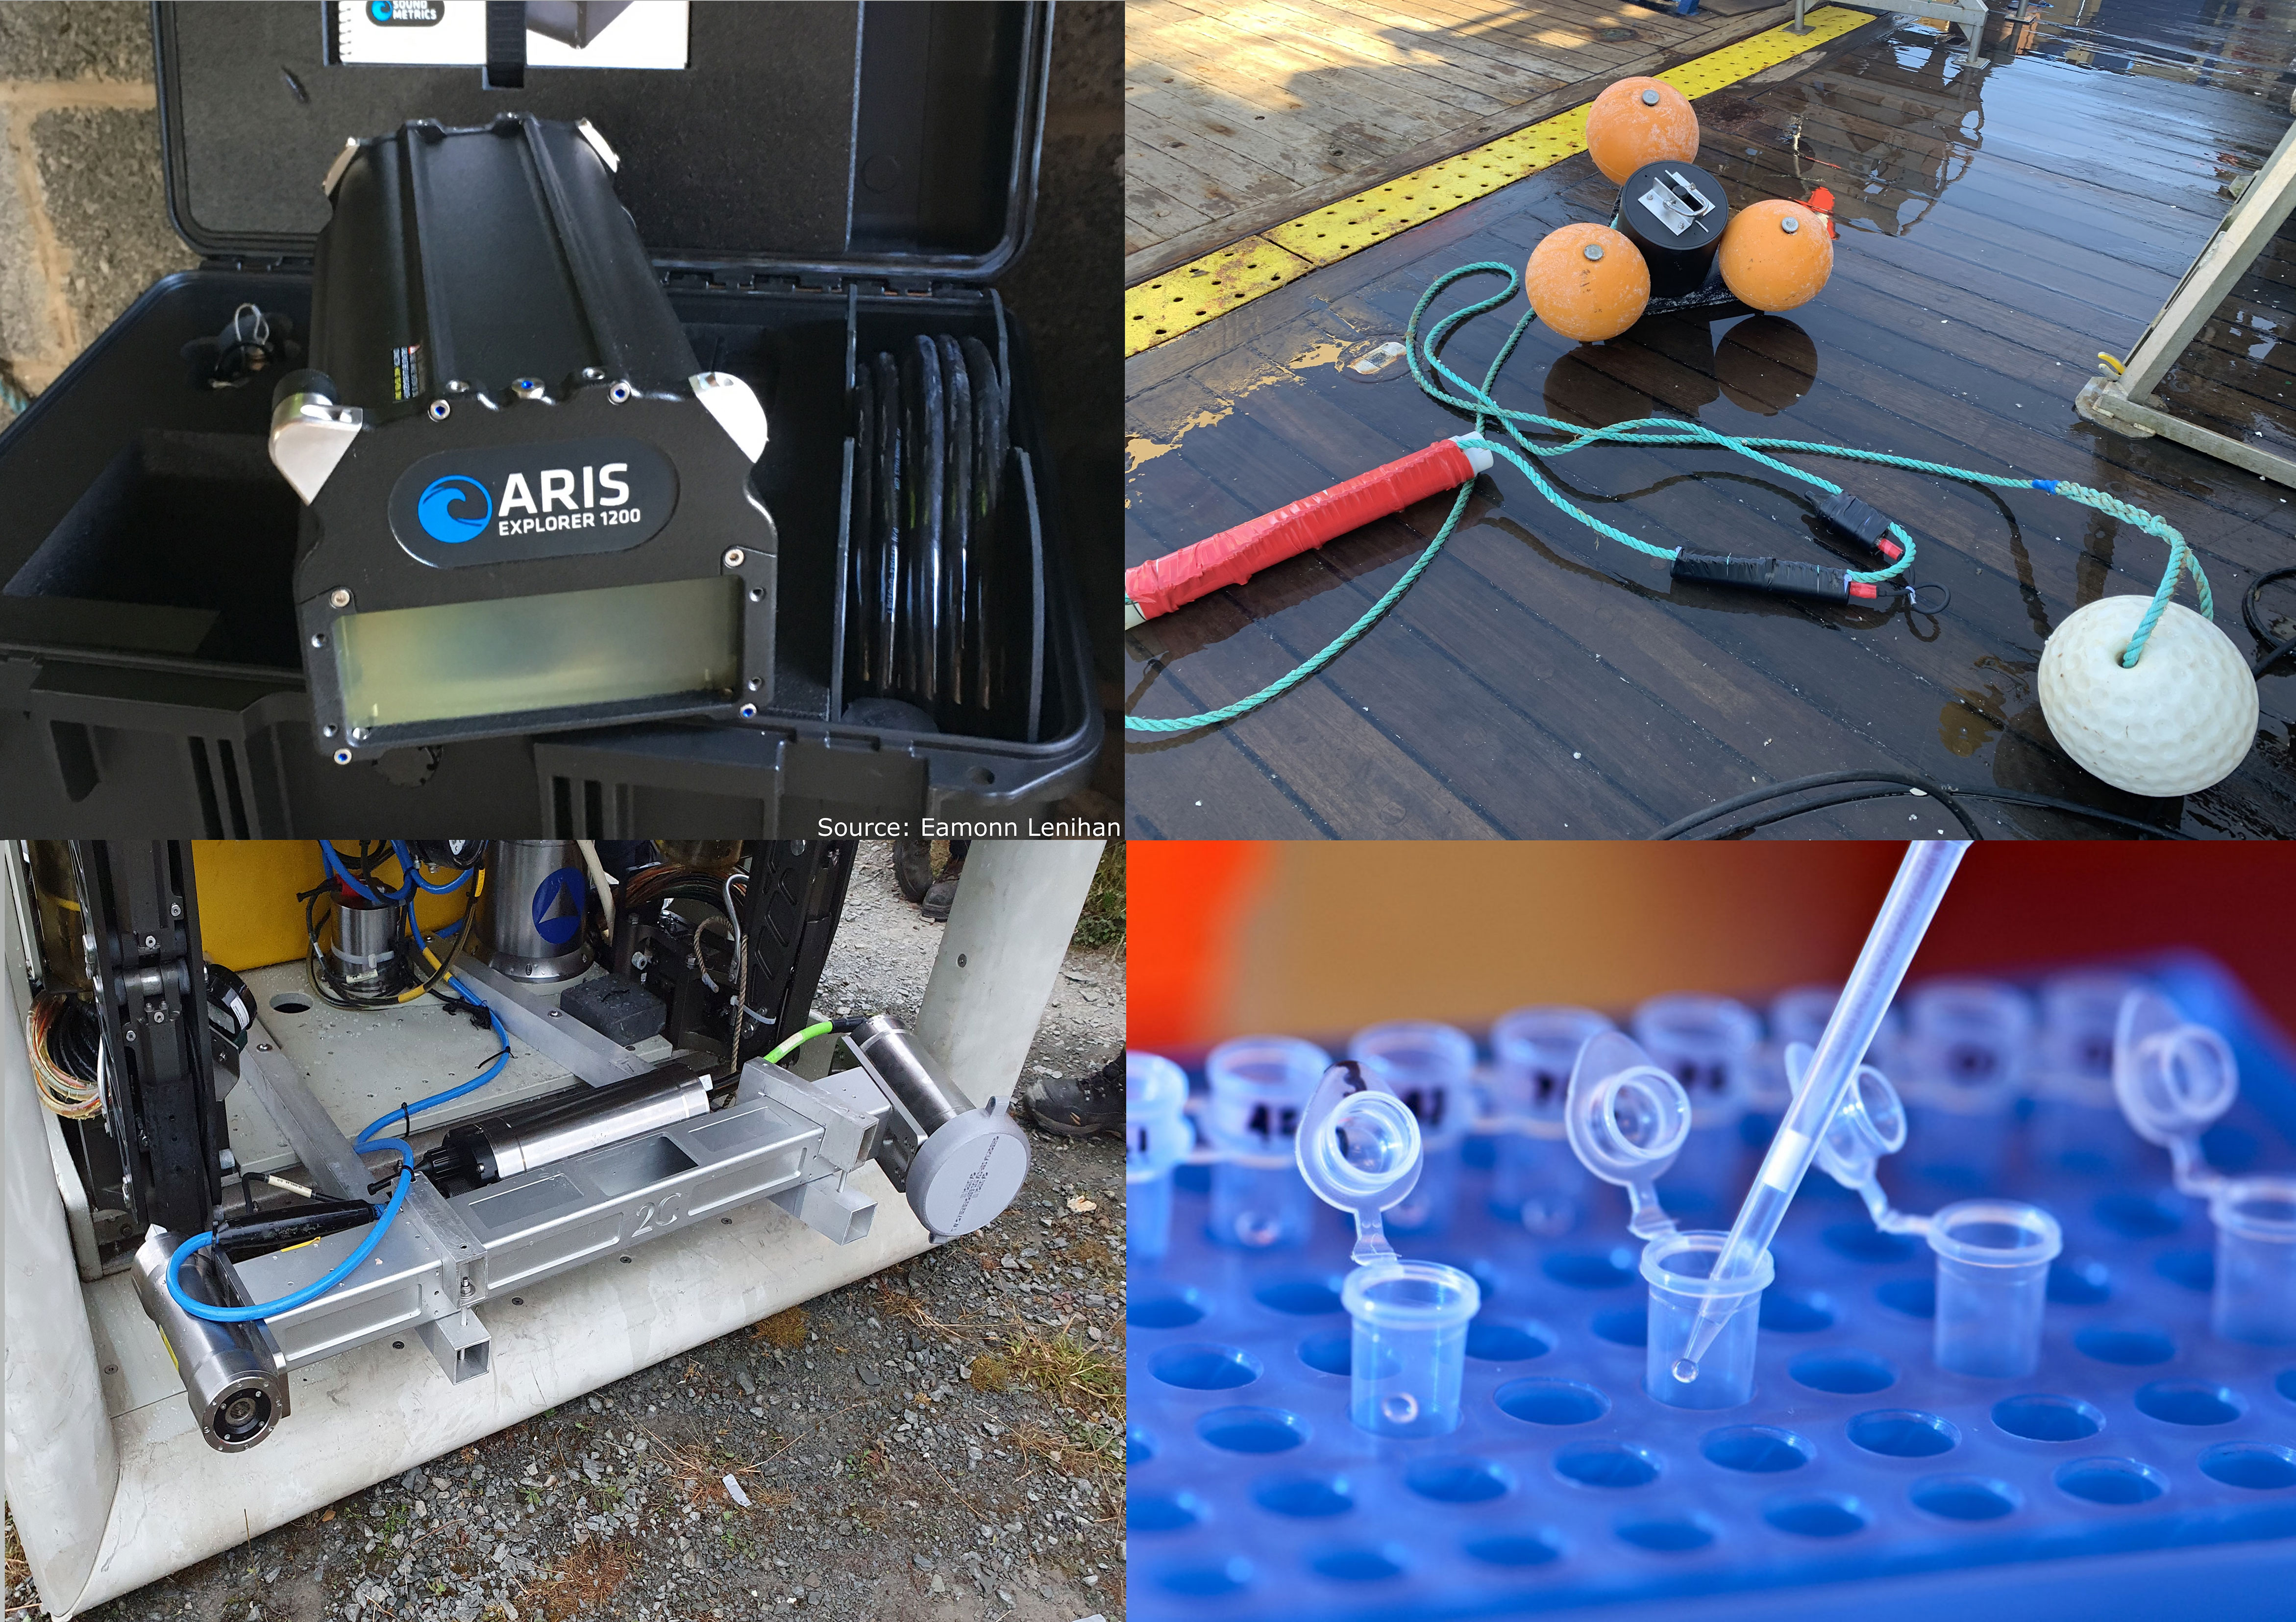
Figure 3 Top left: imaging sonar, top right: Static Passive Acoustic Monitoring (PAM) hydrophone, bottom left: Subsea LiDAR and bottom right: Environmental DNA.
Imaging sonars are advantageous in areas with poor water clarity that would otherwise prevent standard video techniques or for nighttime applications. These platforms are most suitable for imaging larger sized organisms. Data are recorded in two dimensions meaning that images may have low taxonomic resolution unless the target is easily identifiable by its shape. Habitat structure is also a consideration as highly complex 3D environments can block beams. Long-term deployments may be impractical as biofouling of the lens will cause problems. Because of the large amounts of data generated, methods to automatically identify, track and count target species in DIDSON images have also been developed (Jing et al., 2017). In terms of future developments, the improvement of viewing angles, portability and range of frequencies are making this technique a more attractive option for potential users.
Passive acoustic monitoring
Passive Acoustic Monitoring (PAM) is used to record and study sound in the marine environment. The approach also provides an opportunity to monitor biological and anthropogenic sources of noise simultaneously, which can be used to examine possible interactions and exposure levels. The equipment required for PAM can be either mobile or static (Mellinger et al., 2007). Towed hydrophone arrays and ocean gliders offer a mobile platform that can cover large areas over time while static devices can be deployed for longer and provide insights into temporal patterns of species occurrence at a single point (Mellinger et al., 2007). For static devices (Figure 3), high resolution temporal data can be collected in-situ for up to 6 months which reduces the requirement for ship time and this greatly reduces overall survey costs. For both approaches, static and towed, data can be collected continuously, during poor weather conditions and throughout the hours of darkness. Most devices save raw sound files which can be processed multiple times for various purposes such as detecting species, soundscape analysis, ambient noise measurements and the identification of specific noise-emitting events e.g., naval sonar. However, recording across a wide frequency range produces very large data files so some devices only record certain frequencies or are programmed to run a detection algorithm in real time and will only save metadata on specific detection events (Rayment et al., 2009). Depending on the recording schedule employed, PAM allows for the collection of continuous high resolution temporal data, suitable for investigations of fine-scale patterns of occurrence (Nuuttila et al., 2017). In addition, static PAM provides time series data suitable for the study of long-term trends (Širović et al., 2015).
The majority of bioacoustics research has focused on cetaceans. This group of species exhibits complex acoustic repertoires including clicks, chirps, pulses, whistles and song encompassing a wide range of frequencies that are often species specific (Richardson et al., 1995). Using these distinguishing features, PAM can be utilised to assess species vocalisations to determine presence, habitat use, and in some cases, relative abundance and density (Elliott et al., 2011; Marcoux et al., 2011; Kyhn et al., 2012). However, at least 800 fish and invertebrate species are known to produce sound, including commercially important species such as Atlantic cod and Atlantic herring (Ladich, 2019). PAM has been successfully applied as part of MPA monitoring schemes to detect the presence of cryptic fish species not easily observed in visual surveys and identify spatio-temporal patterns in spawning behavior within conservation zones (Picciulin et al., 2019; Caiger et al., 2020). In addition, this technique has been used to characterise temporal patterns in the soundscape of MPAs (Buscaino et al., 2016). Moreover, the soundscapes of reef habitats have been linked to their health indicating a useful means of assessing overall reef condition (Lamont et al., 2022). However, this requires long-term surveys to initially collect baseline data which future changes can be compared to.
In tidally energetic environments, contamination of recordings due to flow noise, caused by the movement of water over the hydrophone, can be problematic (Wilson et al., 2014). Human activities often pose the greatest threat to PAM moorings, for example, entanglement in fishing gear can displace and damage moorings. In some instances, device failure can occur (e.g., battery failure, memory failure, device flooding) and as data are usually downloaded in intervals of weeks to months, this can result in large gaps in a time series. Noise emitting activities such as boat traffic and pile driving can also acoustically mask biological sounds (Clausen et al., 2019). Biofouling can affect the performance of acoustic sensors over time though antifouling measures are often used prior to deployments (Heupel et al., 2008). Passive acoustic studies are also dependent on the acoustic behaviour of a species and detection requires the target to vocalise. Animals may be present in an area but stay silent (Deecke et al., 2005). Therefore, the absence of an acoustic detection does not always represent the absence of a species. In addition, successful detection can be influenced by numerous acoustic characteristics, including frequency, amplitude and duration of the target sound and ambient noise conditions (Zimmer, 2011).
Future developments in the field of PAM primarily rely on improvements to automated processing and analysis of acoustic datasets (Rankin et al., 2017; Allen et al., 2021). Without automated analysis, even the detection of well characterised species vocalisations can be extremely labour intensive and often unfeasible given the volume of data being collected. Such analytical advances may provide an opportunity to reassess historic PAM datasets. These data may provide an excellent repository for information on the presence of vocalizing species and historical levels of ambient noise.
LiDAR and laser line scanning
Light amplification by stimulated emission of radiation, also known as laser, is a device for emitting a single, intense beam of coherent, monochromatic light. Laser technology has been used in marine research in a number of different applications, including salinity measurement sensors, chlorophyll sensors, pH sensors, current measuring sensors, dissolved oxygen sensors. More specially of relevance for the purpose of this review, the use of laser technology for scanning and environmental characterisation in the environmental sciences has been around since the 1960s and incorporates both Light Detection and Ranging (LiDAR) and Laser Line Scanning (LLS) in terrestrial environments (Large and Heritage, 2009), which has more recently been applied in marine environments (Coles, 1988; Palomer et al., 2019). LLS or Underwater Laser Scanners (ULS) are implementation of similar technology, and are in themselves a form of underwater LiDAR taken to include different principles of acquisition including Time of Flight, Phase Shift and Triangulation-based systems. Some of these techniques have been employed for remote sensing and environmental characterization underwater. Many of the underwater applications are analogous to aerial or UAV based deployments, but most are common in terms of the data products that they will provide to the end user – a 3D point cloud measuring the structural morphology and surface properties of the terrain or other object of interest. Compared with their terrestrial counterparts, the main differences here are in the relative infancy of the technology and associated research and development, the limited range of potential applications and markets, and the technical constraints of working with light at range in a fluid medium.
Airborne LiDAR has been used on crewed aircraft and UAVs, while mobile deployments of terrestrial laser scanning allow for fine-scale topographic mapping of large areas in short periods of time. The use of laser scanning in aquatic environments is to some extent less developed than in a terrestrial context and has experienced a much more recent evolution in the discipline (Filisetti et al., 2018). This is largely due to the attenuation of light in the water column and the prevalence of acoustic mapping and remote sensing technologies for spatial mapping.
The potential resolutions achievable with laser systems make them very applicable for precision metrology and measuring environmental change (Large and Heritage, 2009). There are a wide range of applications in marine monitoring, including scanning for topography (airborne bathymetric LiDAR), underwater 3D scanning of structures (subsea LiDAR; Figure 3), and measurement of scattering in the water column for plankton (Anglès et al., 2008; Wang and Tang, 2012; Zavalas et al., 2014). Lasers can also be used while collecting imagery data as a mechanism for scaling observations within a fixed or variable field of view (Pilgrim et al., 2000). This allows for calibration of the scale and extent of objects for quantitative measurements. The applicability of this technology to environmental monitoring in the marine environment would allow for geomorphological stability of complex systems to be determined in an unprecedented level of detail, beyond relative based changes using visual or more qualitative means. This kind of precision mensuration could develop ecological understanding and insight, or particular significance in areas of high structural complexity, including biogenic reef and other habitat forming structures.
Airborne LiDAR uses an aircraft mounted laser transmitter/receiver which transmits a blue/green laser pulse to the water surface of which a portion is reflected back to the receiver. Part of this pulse reflects off the sea bottom and depth is calculated from the time between surface return and bottom return (Purkis and Klemas, 2011). It offers a method of surveying large areas in a relatively short period of time. LiDAR data are typically very dense with point spacing varying from centimetres to metres and it can be used to create high resolution digital bathymetry models (Jawak et al., 2015). It has previously been applied in mapping shallow coral reefs to sub-metre resolution and defining the relationship between habitat complexity and associated fish assemblage structure (Wedding et al., 2008).
Bathymetric LiDAR is most effective in clear water because turbidity limits the maximum detectable depth as laser energy is lost to refraction, scattering and absorption in water. Typically, it may be used at depths of three times the Secchi depth (Estep et al., 1994) and beyond this depth, acoustic techniques (e.g., MBES) may be preferable. Airborne LiDAR platforms and sensors have recently become smaller and more lightweight, meaning that they can now be fitted to UAVs, enabling more widespread applications and increased accessibility (Mandlburger, 2020).
Subsea LiDAR and LLS instead uses underwater platforms to transmit and receive laser pulses. Accuracy and resolution is improved in comparison to airborne LiDAR as the laser does not pass through the air-water interface, the platform is travelling at a lower speed and the return distance is shorter (Filisetti et al., 2018). However, the laser footprint is also significantly reduced; therefore, smaller areas may be surveyed in very high resolution with sub-centimetric data possible. However, this is limited by the power of the laser and water clarity. The greater resolution and accuracy achievable using subsea LiDAR and LLS permits enhanced identification of fine-scale bathymetric features and more detailed mapping of 3D structures. High precision and positional accuracy are also an advantage of using laser. Through integration with an Inertial Navigation System (INS) and positional information, high geometric precision is provided. They can also be integrated with ROVs or AUVs where the required supporting ancillary sensors are in place.
Turbidity is an important consideration for both subsea LiDAR and LLS and will affect data quality. Ambient light is also an issue and can restrict the potential range of applications, e.g., for diver-based operations. In addition, if integrated with a ROV, lights used for pilot navigation affect data quality and present a trade-off between visibility for the ROV pilot and data quality. Challenges related to the need to get very close to complex targets introduce potential problems with entanglement or resuspension of sediment. Survey altitude also affects the intensity of the returning signal, which can have an impact on the ability to discriminate material properties. Some systems have very powerful lasers, which can pose risk to human eye health and potentially to photoreceptive organisms. Despite subsea LiDAR and LLS being at the early adoption phase in marine ecology, it could be effective in providing high resolution baseline data for features of interest within a MPA. Airborne bathymetric LiDAR, can offer considerable applications for intertidal and estuarine ecological monitoring. These have been used with success in a range of different environments and suggest a wide range of potential future use cases. Whether airborne, tripod vehicle mounted, or on subsea dynamic platforms, users must consider the level of resolution needed for their objectives in the context of equipment cost and even mobilisation, which may limit use outside of commercial applications.
Environmental DNA
Environmental DNA (eDNA; Figure 3) is broadly defined as DNA that is collected from a variety of environmental samples e.g., water or sediment, rather than from individual organisms. Biological material in samples may come from faeces, disrupted cells, gastrointestinal contents, gametes, shed skin/exoskeletons, carcasses and even accidental damage. Typically, in marine biomonitoring eDNA is collected by filtering a standard volume of seawater through a membrane filter and employing a commercially available DNA extraction kit (Gold et al., 2021). The DNA is then assayed in one of two ways. Firstly, it can be interrogated for the presence of specific species using quantitative Polymerase Chain Reaction (qPCR). This requires a set of primers that are specific for known targets, which can be individual species or higher-level phylogenetic groups. While detection of single species may be the most sensitive approach, it is often more useful to employ sets of primers that can identify multiple taxa. The design of these primers is critical to the success of the technique, although this is problematic for less common species that are still likely important to monitor. However, as more and more genetic sequences are deposited into the databases (e.g., GenBank), primer availability will undoubtedly improve. The second approach, eDNA metabarcoding, uses primers directed against a broader taxonomic range and is designed to identify all organisms in a system based on recovery of DNA sequences of signature regions. This approach is reliant on efficient and cost-effective next generation DNA sequencing platforms. Studies employing metagenomics are always prone to some misinterpretation due to contamination (Sepulveda et al., 2020). Clearly aseptic collection of samples is essential but other levels of control are routinely applied. Evaluating potential contamination from reagents is becoming standard as are bioinformatics approaches to detect contamination e.g., identifying sequences that exhibit decreasing abundance at higher concentrations (Takahashi et al., 2023). These are particularly important in situations where nucleic acid targets are in a relatively low abundance, such as marine environments.
The use of eDNA enables users to detect the presence or absence of a specific DNA target. The choice of target determines whether the data provides species level identification or whether some other taxonomic level is determined. Current experimental evidence suggests that eDNA signals most likely stay within approximately 30 m of an organism in a marine setting (Murakami et al., 2019). However, because of the sensitivity of some detection methods (e.g. qPCR) signals have been detected from up to 40 km based on hydrodynamic conditions (Andruszkiewicz et al., 2019). The use of eDNA in biomonitoring is effective when used to establish a baseline condition for future change (Czachur et al., 2022). While an exclusive focus on eDNA technology to monitor MPAs is probably not the most appropriate strategy at this point a parallel approach with a more established technology is warranted. This has been appreciated by many marine researchers who recognise that the utility of their DNA data is strengthened by the availability of extensive physical, chemical, and biological measurements associated with each sample (Biller et al., 2018). Applications related to MPA monitoring also include identification of rare and endangered species, development of a community index to assess overall ecosystem health and assessing the impact of a stressor on an environment (Port et al., 2016; Weltz et al., 2017; Berry et al., 2019).
One of the main advantages of using eDNA in marine monitoring is that it delivers increased detection-efficiency compared to traditional monitoring systems, whereby, water or sediment samples may be used to detect a variety of target organisms. Technological advances have resulted in eDNA monitoring systems being significantly more cost-effective than alternative techniques. In general, eDNA sampling protocols do not rely on high levels of technical expertise so samples may be collected opportunistically on research surveys. In addition, qPCR has the potential to deliver quantitative as well as qualitative data which significantly increases its utility, particularly for monitoring.
A fundamental limitation for the procedure is its current inability to quantify density and the lack of definitive information on the rate of eDNA decay. It has recently been recognised that eDNA decays faster at higher temperatures in marine environments as opposed to freshwater settings (García-Machado et al., 2022). Parameters such as salinity, pH, light and oxygen levels all impact on eDNA decay rates and more work is needed to elucidate the effects of these in both laboratory and field scenarios (Lamb et al., 2022). Moreover, an assumption within eDNA analysis is that all organisms contribute equally to the DNA target. This is undoubtedly an oversimplification as eDNA shedding and decay rates are highly variable between species and intimately associated with environmental conditions (Mauvisseau et al., 2022).
Innovative methods of using eDNA analysis continue to be developed. For example, due to their propensity to filter large volumes of water each day, sponges have been used to extract eDNA from their tissues and as a result amplify survey effort (Mariani et al., 2019). Extracted eDNA from sponges can, therefore, serve as an indicator of biodiversity in the area. Instruments for sampling eDNA have been integrated with AUVs to enable remote repeatable sampling of a water mass over a 12 hour period (Yamahara et al., 2019). As a monitoring technique, eDNA is relatively stable but its detection does not distinguish between living and dead organisms, potentially allowing for a misinterpretation of the health of an ecosystem. Technical developments are supporting the detection of eRNA, which is only present in living organisms and has a rapid decay upon release (Veilleux et al., 2021). Therefore, determining the edna:eRNA ratio may give a more accurate picture of the health of an ecosystem. In terms of sample analysis, potential exists for automation of the process. In clinical settings, robots routinely extract DNA from samples for downstream analysis which can include both PCR and sequencing approaches. On-site DNA sequencing has also become a reality based on nanopore sequencing technology (Truelove et al., 2019).
Processing and analytical techniques
Photogrammetry
Modern photogrammetry, also known as structure-from-motion, is a method of extracting 3D information from two-dimensional datasets such as photographs. The process involves taking overlapping photographs of an object, structure, or space, and converting them into 2D or 3D digital models (Mikhail et al., 2001). Typically, the process interprets the photos and geometric relationships between photos or frames to gather critical measurements which are used to construct 3D models. These models can then be utilised to examine properties of a target location or habitat such as surface area, volume and complexity. The technique was first developed for terrestrial applications and later applied underwater by archaeologists in the 1960s (Drap, 2012). Photogrammetry datasets are essentially a large collection of high-quality images of a scene which is targeted for 3D generation. These images have a high overlap in both horizonal and vertical planes. Once the photogrammetry workflow has been completed, the range of outputs include orthomosaic, dense point clouds and 3D mesh (Ferrari et al., 2021). Photographs may be collected using several platforms including AUV, ROV, diver or aerially captured images, meaning that photogrammetry may be applied in a range of different scenarios and scales.
Photogrammetry is now used extensively in marine ecology to examine interactions between habitat structure and communities and for long-term monitoring of sites (Darling et al., 2017; Piazza et al., 2019). For example, off the Philippines, photogrammetry was used to examine structural differences in reefs both inside and outside MPAs (Bayley et al., 2019). Moreover, the technique was used in Antarctica to identify variations in benthic species composition between 2006 and 2015 (Piazza et al., 2019). It is particularly well suited to monitoring reefs since they are composed of sessile organisms and reef structure is important in determining ecological assemblages (Marre et al., 2019; de Oliveira et al., 2021). It can also be useful to conduct baseline surveys or quantify changes to habitats over time or before and after an anthropogenic or natural disturbance, (e.g., fishing activity or a storm). It can give a detailed view of what the habitat looked like when the survey was executed and can be compared to other instances captured in other timeframes. Structural complexity of habitats may be quantified using metrics such as rugosity and fractal dimension characteristics. Photogrammetry is a relatively inexpensive technique and produces measurements that are highly repeatable and accurate (Marre et al., 2019). It is also widely applicable to a range of different habitats, depths and scales as imagery data may be collected using a variety of platforms e.g., AUV, ROV, AUV and SCUBA diver.
Good quality data is essential for photogrammetry to be successful and there must be sufficient lighting and focus. The data should be continuous with >60% overlap in place between images, otherwise there may be no alignment between photos and thus, the user may end up with two or more completely separate survey datasets. The resolution of the dataset needs to be of sufficient quality, both medium and high resolution datasets will be acceptable. Very high resolution can mean a small swath width, slow survey speed and larger quantities of data. In contrast, higher altitude surveying can allow for a larger swath width, faster survey times and larger survey area capabilities, but with a lower resolution 3D scene generation. The two main drivers of model resolution are the camera system and flight altitude with sub-centimetric to millimetric resolutions possible (Marre et al., 2019). Datasets can be quite laborious and difficult to acquire. Specifically, it can be difficult to achieve high quality data in areas of high wave and tidal regimes, areas of low visibility or where soft substrates, like kelp, prevent image alignment (Bryson et al., 2017). Therefore, photogrammetry may only be suited to areas which generally have a low level of turbulence. In addition, at least three GPS coordinates, one GPS coordinate and relative positioning of reference targets should be given for orienting the model. If these conditions are not met, a reference position, scale bars, compass and levels are necessary to orientate the model and extract measurement from it (Bayley and Mogg, 2020).
Underwater photogrammetry remains relatively novel and is still rapidly gaining popularity among those interested in marine benthic monitoring. Currently, very high resolution models are available only for small to medium areas (e.g., 20-500m2), though improvements in cameras systems and computer processing times may enable the production of higher resolution 3D models for larger spatial extents (Marre et al., 2019). With recent developments in artificial intelligence and improvements in multi-GPU systems, 3D models can be used in new algorithms for the automated classification of species from their 3D characteristics (Mohamed et al., 2020; Yuval et al., 2021). This area of research and use of 3D photogrammetry data will likely grow significantly in the future and can ultimately reveal new insights in the years to come.
Object-based image analysis
Object-Based Image Analysis (OBIA) is a flexible semi-automated technique designed to categorise an image across two separate stages: segmentation and classification. Segmentation separates an image into regions of similar pixel values using an intra-object heterogeneity criterion which creates image objects that accurately depict features of interest (Blaschke, 2010). Image objects can be created using multiple images/layers ensuring that multiple data sources, e.g. bathymetry, backscatter, slope and roughness are considered simultaneously when searching for areas of homogeneity. The multiresolution segmentation algorithm found within eCognition Developer, is the most widely used segmentation algorithm and utilises a criterion called the scale parameter to determine the degree of intra-object homogeneity (Ma et al., 2017; Lacharité et al., 2018). Classification is the process of identifying the features that the image objects represent in the data and can be conducted using an automated, semi-automated or rules defined approach. Automated or unsupervised classifications categorise the image objects into an undefined number of classes through a variety of data clustering techniques (Lucieer and Lamarche, 2011). Semi-automated or supervised classification systems involve the labelling of samples by an expert which then uses an algorithm to assimilate the pattern provided by a subset of those samples and validate the algorithm by using the remaining sample (Hillman et al., 2018). Such classification is also termed machine learning and can provide a more accurate classification and a more valid replication of human interpretation (Calvert et al., 2015; Herkül et al., 2017).
Delineating geographic features as distinct image objects allows the production of summary statistics, analyzing the data in groups, and thus reducing the noise included in a classification (Blaschke, 2010; Ierodiaconou et al., 2018). Summarising these data can also reduce the computations required to run an accurate classification, affording the capacity to scale up classification to include big data (Lang et al., 2019). Furthermore, additional attributes of image objects such as size, shape, texture and relative position can also be included as descriptors to help frame geographic features. These advantages have led to the adoption of this technique in studies designed to classify geographic features with a high degree of accuracy using a diverse array of datasets including LIDAR, satellite, MBES and imagery data.
For instance. OBIA has been used to classify imagery data collected from aerial UAV surveys to create high spatial resolution maps for sensitive habitats such as sea grass meadows, rocky coast fish nurseries and biogenic reefs (Ventura et al., 2018). Another example of its application is in mapping large areas of coral reef habitat on the Great Barrier Reef using satellite imagery, modelled wave exposure and field-based benthic composition data (Roelfsema et al., 2018). Moreover, the technique offers an objective framework for long-term monitoring and can provide data on potential changes to benthic habitats linked to environmental and/or anthropogenic processes (Innangi et al., 2019b; Fallati et al., 2020).
OBIA is the preferred method of classification when the scale of the feature of interest spans several image pixels, referred to as a high resolution feature within the literature (Blaschke et al., 2014; Zhang et al., 2020). Gao and Mas (2008) determined that pixel-based classifications enable greater accuracy when deployed for geographic features represented by a portion of a pixel, or low resolution features. Therefore, the effective application of OBIA is limited to scenarios where a significant disparity of image object size and resolution exist and where high resolution features occur (Blaschke et al., 2014; Zhang et al., 2020). Such features can occur within fine or coarse spatial resolution data, however, a significant correlation between the resolution of the data employed in OBIA and the optimal scale parameter used during segmentation has been determined (Blaschke et al., 2014; Ma et al., 2017; Kucharczyk et al., 2020). Furthermore, the heuristic nature of the segmentation process challenges the replicability of OBIA classification as segmentation scale has a significant impact on the resultant classification (Liu and Xia, 2010; Ye et al., 2018). Studies designed to standardize this process have improved the objectivity of segmentation (Drǎguţ et al., 2010l; Drǎguţ et al., 2014). Nevertheless, establishing a singular value to describe geographic object diversity remains elusive in complicated terrains with a wide assortment of geographic feature types and geometries (Kucharczyk et al., 2020).
Currently, the increased proliferation of high-resolution marine surveying equipment such as AUVs, BRUVs, UAVs, and ROVs raises the issue of extracting meaningful information from such high-volume datasets, as manual classification is laborious and time consuming (Diesing et al., 2014; Husson et al., 2016). Furthermore, the quality of manual classification can vary widely between operators causing bias to influence the quantitative data analysis and disrupting effective interpretation of the ecology depicted therein (Durden et al., 2016). Moreover, unreliable classification schemes also prevents the replication of the classification approach on new datasets (Malik et al., 2023). Deep learning techniques offer an automated means to help mitigate this issue and reduce the time required/to analyse this data by orders of magnitude while providing a reliable measurement of the accuracy of the classification (Marrable et al., 2022; Piechaud and Howell, 2022).
Deep learning is a subset of machine learning that provides layered computer networks to derive a more accurate classification of image features from complex scenarios where traditional approaches are inadequate (Li et al., 2018). These networks are designed to mimic the neural network present within biological systems, with the aim of developing a classification system that provides detailed information abstraction from raw data (Li et al., 2018). Convolutional neural networks (CNNs) are the most widespread form of deep learning within the remote sensing community (Robson et al., 2020). International competitions in image recognition have shown that CNNs have surpassed the performance of humans (He et al., 2015). The integration of OBIA with deep learning outputs can be used to provide clear delineation of image object features with a high classification accuracy. Deep learning approaches have been integrated with seabed habitat mapping data to derive more accurate results than those achieved with conventional machine learning (Conti et al., 2019). Furthermore, Malik et al. (2023) achieved a mean precision of 95% when deploying CNNs to identify nine different fish species depicted in underwater imagery.
However, deep learning algorithms require a significant amount of manually annotated training data that are representative of the image feature intended for classification (Yasir et al., 2020). Therefore, annotation of the data required to train these deep learning algorithms presents significant impediment for the development of a feasible classification scheme (Schoening et al., 2014). Piechaud et al. (2019) suggests that a compromise between classification performance and annotation effort may be required to ensure a viable implementation of deep learning algorithms. Conversely, Marrable et al. (2022) postulates that a community-wide effort is needed to address the paucity of training data available. This is supported by Piechaud and Howell (2022), who created a workflow where non-specialist ecologists could train a CNN to identify a single species of underwater organisms in 54,000 images in under 10 days, attaining a precision of 91%. Thus, providing a method to circumvent the traditional annotation constraints of deep learning while deriving data that is ready for quantitative analysis (Piechaud and Howell, 2022).
Conclusions
To slow the loss of biodiversity and to protect marine ecosystems, significant conservation actions are required throughout global oceans. MPAs are recognised as important tools in realising this objective, and over the past decade, the rate of MPA designation has accelerated appreciably. In many cases, decisions about area-based protection must be made based on best available data, which may be a limiting factor. Information supporting the marine spatial planning process will be a major consideration going into the future, particularly for new designations and modification of existing MPA boundaries as better information becomes available. Effective MPA monitoring programmes are essential to ensuring that conservation objectives are achieved and should be tailored to adequately monitor species and habitats of importance.
When deciding on the optimal monitoring strategy it is important to ensure that the methods used are appropriate for monitoring objectives, and crucially to ensure backwards compatibility with historic monitoring efforts. However, if routine monitoring is not sufficient to ensure condition assessments are being met, agencies should be prepared to augment their programmes or redesign monitoring strategies to better inform management. Key considerations include economic cost, environmental conditions at the site, spatial scale and temporal resolution. Standardised and repeatable surveys, which collect data at a scale and resolution to enable evaluation of changing site conditions is vital. This may mean that the best approach involves utilising a variety of complementary techniques to ensure a robust evaluation is conducted, particularly for baseline assessments.
With several new and emerging techniques being more commonly applied in marine monitoring, it is important that standardised methodologies and best practice frameworks are defined. This would help to ensure methodologies are applied and interpreted similarly in a way that mitigates potential biases. Workshops, standards reviewing bodies, and publication of guidelines can enable knowledge sharing and maximise the value and impact of MPA monitoring programmes. For example, the Global Coral Reef Monitoring Network (GCRMN; gcrmn.net) was established by the International Coral Reef Initiative in 1995 and aims to provide scientific information on the condition of the world’s coral reefs. They have also developed protocols and guidelines to help build local and national capacity to collect, analyse and report coral reef monitoring data.
The development of new and existing technologies which can be applied to marine monitoring has enabled the collection of vast quantities of data at ever improving resolutions. Coupled to this, several monitoring and data storage techniques which may have been prohibitively expensive in the past are increasingly becoming more cost effective. Moreover, developments in high performance computing, big data analytics and artificial intelligence now make the analysis and interpretation of substantial datasets more manageable and less time-consuming. As technology, computing power and data storage capabilities continue to increase, it will enable MPA managers to examine species and habitats in greater detail. However, simply collecting more data is not sufficient. Consideration of the statistical power of surveys to detect change is also crucial so as to avoid the ‘data-rich but information poor’ scenario (Wilding et al., 2017). Monitoring programs therefore need to be clear about what they are trying to measure, and the levels of change which need to be detected. It is also important not to allow technological development to be conflated with increased understanding of ecological processes, as these may be very different things.
Research institutes in the global south may not readily have access or technical or financial resources available in Europe, North America or Australia, where many of the advances have been developed and progressed. Challenges to funding in current geopolitical and economic circumstances are likely to further impact developments in this arena in terms of equality of opportunity, and we must actively seek opportunities to spread the benefit of this work beyond our own institutions. The way forward here will be through better cooperation between sensor developers and scientists, where equipment and processes can be designed to meet the needs of monitoring agencies and other interested parties. This has additional considerations around intellectual property rights, marketisation of research – which is sometimes at odds with the spirit of open-source development of software and analytical approaches. Working through these challenges and barriers to progress will help to maximise the benefits and develop our understanding of baseline condition and extent, properties of fundamental importance in conservation of the marine environment. This will allow for greater quantification of temporal and spatial variation and ultimately, a better understanding of ecosystem processes.
Author contributions
RM and CM drafted the manuscript. RM, RR, JD, JH, CF, AW, GS, AC, SB, LB, GD and CG made substantial contributions to the content and revision of the whole manuscript and to drafting sections. All authors contributed to the article and approved the submitted version.
Funding
This research was funded through the Marine Protected Area Monitoring and Management (MarPAMM) project, which is supported by the European Union’s INTERREG VA Programme, managed by the Special EU Programmes Body (SEUPB) with matching funding from the Government of Ireland, the Northern Ireland Executive, and the Scottish Government. This research was also carried out with the support of the Marine Institute under the Marine Research Programme with the support of the Irish Government.
Conflict of interest
The authors declare that the research was conducted in the absence of any commercial or financial relationships that could be construed as a potential conflict of interest.
Publisher’s note
All claims expressed in this article are solely those of the authors and do not necessarily represent those of their affiliated organizations, or those of the publisher, the editors and the reviewers. Any product that may be evaluated in this article, or claim that may be made by its manufacturer, is not guaranteed or endorsed by the publisher.
References
Allen A. N., Harvey M., Harrell L., Jansen A., Merkens K. P., Wall C. C., et al. (2021). A convolutional neural network for automated detection of humpback whale song in a diverse, long-term passive acoustic dataset. Front. Mar. Sci. 8. doi: 10.3389/fmars.2021.607321
Ampou E. E., Ouillon S., Iovan C., Andréfouët S. (2018). Change detection of bunaken island coral reefs using 15 years of very high resolution satellite images: a kaleidoscope of habitat trajectories. Mar. pollut. Bull. 131, 83–95. doi: 10.1016/j.marpolbul.2017.10.067
Andruszkiewicz E. A., Koseff J. R., Fringer O. B., Ouellette N. T., Lowe A. B., Edwards C. A., et al. (2019). Modeling environmental DNA transport in the coastal ocean using Lagrangian particle tracking. Front. Mar. Sci. 6. doi: 10.3389/fmars.2019.00477
Anglès S., Jordi A., Garcés E., Masó M., Basterretxea G. (2008). High-resolution spatio-temporal distribution of a coastal phytoplankton bloom using laser in situ scattering and transmissometry (LISST). Harmful Algae 7, 808–816. doi: 10.1016/j.hal.2008.04.004
Artero C., Marchetti S., Bauer E., Viala C., Noël C., Koenig C. C., et al. (2021). High-resolution acoustic cameras provide direct and efficient assessments of large demersal fish populations in extremely turbid waters. Appl. Sci. 11, 1–16. doi: 10.3390/app11041899
Ayma A., Aguzzi J., Canals M., Lastras G., Bahamon N., Mecho A., et al. (2016). Comparison between ROV video and agassiz trawl methods for sampling deep water fauna of submarine canyons in the northwestern Mediterranean Sea with observations on behavioural reactions of target species. Deep. Res. Part I Oceanogr. Res. Pap. 114, 149–159. doi: 10.1016/j.dsr.2016.05.013
Bailey D. M., King N. J., Priede I. G. (2007). Cameras and carcasses: historical and current methods for using artificial food falls to study deep-water animals. Mar. Ecol. Prog. Ser. 350, 179–191. doi: 10.3354/meps07187
Batchelor C. L., Montelli A., Ottesen D., Evans J., Dowdeswell E. K., Christie F. D. W., et al. (2020). New insights into the formation of submarine glacial landforms from high-resolution autonomous underwater vehicle data. Geomorphology 370, 107396. doi: 10.1016/j.geomorph.2020.107396
Bayley D. T. I., Mogg A. O. M. (2020). A protocol for the large-scale analysis of reefs using structure from motion photogrammetry. Methods Ecol. Evol. 11, 1410–1420. doi: 10.1111/2041-210X.13476
Bayley D. T. I., Mogg A. O. M., Purvis A., Koldewey H. J. (2019). Evaluating the efficacy of small-scale marine protected areas for preserving reef health: a case study applying emerging monitoring technology. Aquat. Conserv. Mar. Freshw. Ecosyst. 29, 2026–2044. doi: 10.1002/aqc.3215
Becker A., Whitfield A. K., Cowley P. D., Jarnegren J., Naesje T. F. (2011). An assessment of the size structure , distribution and behaviour of fish populations within a temporarily closed estuary using dual frequency identification sonar ( DIDSON ). J. Fish Biol. 79, 761–775. doi: 10.1111/j.1095-8649.2011.03057.x
Benjamins S., Fox C. J., Last K., McCarty C. E. (2018). Individual identification of flapper skate dipturus intermedius using a baited camera lander. Endanger. Species Res. 37, 37–44. doi: 10.3354/esr00911
Benoist N. M. A., Morris K. J., Bett B. J., Durden J. M., Huvenne V. A. I., Le Bas T. P., et al. (2019). Monitoring mosaic biotopes in a marine conservation zone by autonomous underwater vehicle. Conserv. Biol. 33, 1174–1186. doi: 10.1111/cobi.13312
Berry T. E., Saunders B. J., Coghlan M. L., Stat M., Jarman S., Richardson A. J., et al. (2019). Marine environmental DNA biomonitoring reveals seasonal patterns in biodiversity and identifies ecosystem responses to anomalous climatic events. PloS Genet. 15, 1–19. doi: 10.1371/journal.pgen.1007943
Bevan E., Whiting S., Tucker T., Raith A., Douglas R. (2018). Measuring behavioral responses of sea turtles, saltwater crocodiles, and crested terns to drone disturbance to define ethical operating thresholds. PloS One 13, 1–17. doi: 10.1371/journal.pone.0194460
Biller S. J., Berube P. M., Dooley K., Williams M., Satinsky B. M., Hackl T., et al. (2018). Marine microbial metagenomes sampled across space and time. Sci. Data 5, 1–7. doi: 10.1038/sdata.2018.176
Blaschke T. (2010). Object based image analysis for remote sensing. ISPRS J. Photogramm. Remote Sens. 65, 2–16. doi: 10.1016/j.isprsjprs.2009.06.004
Blaschke T., Hay G. J., Kelly M., Lang S., Hofmann P., Addink E., et al. (2014). Geographic object-based image analysis - towards a new paradigm. ISPRS J. Photogramm. Remote Sens. 87, 180–191. doi: 10.1016/j.isprsjprs.2013.09.014
Bongiovanni C., Stewart H. A., Jamieson A. J. (2021). High-resolution multibeam sonar bathymetry of the deepest place in each ocean. Geosci. Data J. 9, 1–16. doi: 10.1002/gdj3.122
Bouchet P. J., Letessier T. B., Caley M. J., Nichol S. L., Hemmi J. M., Meeuwig J. J. (2020). Submerged carbonate banks aggregate pelagic megafauna in offshore tropical Australia. Front. Mar. Sci. 7. doi: 10.3389/fmars.2020.00530
Branchini S., Pensa F., Neri P., Tonucci B. M., Mattielli L., Collavo A., et al. (2015). Using a citizen science program to monitor coral reef biodiversity through space and time. Biodivers. Conserv. 24, 319–336. doi: 10.1007/s10531-014-0810-7
Brizzolara J. L., Grasty S. E., Ilich A. R., Gray J. W., Naar D. F., Murawski S. A. (2020). Characterizing benthic habitats in two marine protected areas on the West Florida shelf (Amsterdam: Elsevier Inc). doi: 10.1016/b978-0-12-814960-7.00036-1
Bröker K. C. A., Hansen R. G., Leonard K. E., Koski W. R., Heide-Jørgensen M. P. (2019). A comparison of image and observer based aerial surveys of narwhal. Mar. Mammal Sci. 35, 1253–1279. doi: 10.1111/mms.12586
Brown C. J., Beaudoin J., Brissette M., Gazzola V. (2019). Multispectral multibeam echo sounder backscatter as a tool for improved seafloor characterization. Geosciences 9. doi: 10.3390/geosciences9030126
Bryson M., Ferrari R., Figueira W., Pizarro O., Madin J., Williams S., et al. (2017). Characterization of measurement errors using structure-from-motion and photogrammetry to measure marine habitat structural complexity. Ecol. Evol. 7, 5669–5681. doi: 10.1002/ece3.3127
Buscaino G., Ceraulo M., Pieretti N., Corrias V., Farina A., Filiciotto F., et al. (2016). Temporal patterns in the soundscape of the shallow waters of a Mediterranean marine protected area. Sci. Rep. 6, 1–13. doi: 10.1038/srep34230
Buscher E., Mathews D. L., Bryce C., Bryce K., Joseph D., Ban N. C. (2020). Applying a low cost, mini remotely operated vehicle (ROV) to assess an ecological baseline of an indigenous seascape in Canada. Front. Mar. Sci. 7. doi: 10.3389/fmars.2020.00669
Butcher P. A., Colefax A. P., Gorkin R. A., Kajiura S. M., López N. A., Mourier J., et al. (2021). The drone revolution of shark science: a review. Drones 5, 1–28. doi: 10.3390/drones5010008
Caiger P. E., Dean M. J., DeAngelis A. I., Hatch L. T., Rice A. N., Stanley J. A., et al. (2020). A decade of monitoring atlantic cod gadus morhua spawning aggregations in Massachusetts bay using passive acoustics. Mar. Ecol. Prog. Ser. 635, 89–103. doi: 10.3354/MEPS13219
Caldwell Z. R., Zgliczynski B. J., Williams G. J., Sandin S. A. (2016). Reef fish survey techniques: assessing the potential for standardizing methodologies. PloS One 11, 1–14. doi: 10.1371/journal.pone.0153066
Calmant S., Baudry N. (1996). Modelling bathymetry by inverting satellite altimetry data: a review. Mar. Geophys. Res. 18, 123–134. doi: 10.1007/BF00286073
Calvert J., Strong J. A., Service M., McGonigle C., Quinn R. (2015). An evaluation of supervised and unsupervised classification techniques for marine benthic habitat mapping using multibeam echosounder data. ICES J. Mar. Sci. 72, 55. doi: 10.1093/icesjms/fsu223
Capocci R., Dooly G., Omerdić E., Coleman J., Newe T., Toal D. (2017). Inspection-class remotely operated vehicles-a review. J. Mar. Sci. Eng. 5. doi: 10.3390/jmse5010013
Cappo M., Harvey E. B., Malcolm H. C., Speare P. (2003). “Potential of video techniques to monitor diversity , abundance and size of fish in studies of marine protected areas,” in Aquatic protected areas-what works best and how do we know? world congress on aquatic protected areas proceedings. Eds. Beumer J. P., Grant A., Smith D. C. (Cairns, Australia: World Congress on Aquatic Protected Areas Proceedings), 455–464.
Cappo M., Speare P., De’Ath G. (2004). Comparison of baited remote underwater video stations (BRUVS) and prawn (shrimp) trawls for assessments of fish biodiversity in inter-reefal areas of the great barrier reef marine park. J. Exp. Mar. Bio. Ecol. 302, 123–152. doi: 10.1016/j.jembe.2003.10.006
Castellanos-Galindo G. A., Casella E., Mejía-Rentería J. C., Rovere A. (2019). Habitat mapping of remote coasts: evaluating the usefulness of lightweight unmanned aerial vehicles for conservation and monitoring. Biol. Conserv. 239, 108282. doi: 10.1016/j.biocon.2019.108282
CBD (2010) Convention on biological diversity. decision X/2: the strategic plan for biodiversity 2011-2020 and the aichi biodiversity targets. Available at: https://www.cbd.int/decision/cop/?id=12268.
Chirayath V., Earle S. A. (2016). Drones that see through waves – preliminary results from airborne fluid lensing for centimetre-scale aquatic conservation. Aquat. Conserv. Mar. Freshw. Ecosyst. 26, 237–250. doi: 10.1002/aqc.2654
Clausen K. T., Tougaard J., Carstensen J., Delefosse M., Teilmann J. (2019). Noise affects porpoise click detections–the magnitude of the effect depends on logger type and detection filter settings. Bioacoustics 28, 443–458. doi: 10.1080/09524622.2018.1477071
Coggan R., Mitchell A., White J., Golding N. (2007). Recommended operating guidelines (ROG) for underwater video and photographic imaging techniques. Report from working group https://emodnet.ec.europa.eu/sites/emodnet.ec.europa.eu/files/public/gmhm3_video_rog.pdf
Colbo K., Ross T., Brown C., Weber T. (2014). A review of oceanographic applications of water column data from multibeam echosounders. Estuar. Coast. Shelf Sci. 145, 41–56. doi: 10.1016/j.ecss.2014.04.002
Colefax A. P., Butcher P. A., Kelaher B. P. (2018). The potential for unmanned aerial vehicles (UAVs) to conduct marine fauna surveys in place of manned aircraft. ICES J. Mar. Sci. 75, 1–8. doi: 10.1093/icesjms/fsx100
Coles B. W. (1988). Recent developments in underwater laser scanning systems. Underw. Imaging 0980, 42. doi: 10.1117/12.948640
Conti L. A., Lim A., Wheeler A. J. (2019). High resolution mapping of a cold water coral mound. Sci. Rep. 9, 1–15. doi: 10.1038/s41598-018-37725-x
Copeland A., Edinger E., Devillers R., Bell T., LeBlanc P., Wroblewski J. (2013). Marine habitat mapping in support of marine protected area management in a subarctic fjord: Gilbert bay, Labrador, Canada. J. Coast. Conserv. 17, 225–237. doi: 10.1007/s11852-011-0172-1
Cubaynes H. C., Fretwell P. T., Bamford C., Gerrish L., Jackson J. A. (2019). Whales from space: four mysticete species described using new VHR satellite imagery. Mar. Mammal Sci. 35, 466–491. doi: 10.1111/mms.12544
Czachur M. V., Seymour M., Creer S., von der Heyden S. (2022). Novel insights into marine fish biodiversity across a pronounced environmental gradient using replicated environmental DNA analyses. Environ. DNA 4, 181–190. doi: 10.1002/edn3.238
Darling E. S., Graham N. A. J., Januchowski-Hartley A., Nash K. L., Pratchett M. S., Wilson S. K. (2017). Relationships between structural complexity, coral traits, and reef fish assemblages. Coral Reefs 36, 561–575. doi: 10.1007/s00338-017-1539-z
Davies B. F. R., Holmes L., Attrill M. J., Sheehan E. V. (2022a). Ecosystem benefits of adopting a whole- site approach to MPA management. Fish. Manage. Ecol. 29, 790–805. doi: 10.1111/fme.12581
Davies B. F. R., Holmes L., Bicknell A., Attrill M. J., Sheehan E. V. (2022b). A decade implementing ecosystem approach to fisheries management improves diversity of taxa and traits within a marine protected area in the UK. divers Distrib 28, 173–188. doi: 10.1111/ddi.13451
Deecke V. B., Ford J. K. B., Slater P. J. B. (2005). The vocal behaviour of mammal-eating killer whales: communicating with costly calls. Anim. Behav. 69, 395–405. doi: 10.1016/j.anbehav.2004.04.014
de Oliveira L. M. C., Lim A., Conti L. A., Wheeler A. J. (2021). 3D classification of cold-water coral reefs: a comparison of classification techniques for 3D reconstructions of cold-water coral reefs and seabed. Front. Mar. Sci. 8. doi: 10.3389/fmars.2021.640713
Diesing M., Green S. L., Stephens D., Lark R. M., Stewart H. A. (2014). Mapping seabed sediments: comparison of manual, geostatistical, object-based image analysis and machine learning approaches. Cont. Shelf Res. 84, 107–119. doi: 10.1016/j.csr.2014.05.004
Ditria E. M., Buelow C. A., Gonzalez-Rivero M., Connolly R. M. (2022). Artificial intelligence and automated monitoring for assisting conservation of marine ecosystems: a perspective. Front. Mar. Sci. 9. doi: 10.3389/fmars.2022.918104
Dominguez-Carrió C., Fontes J., Morato T. (2021). A cost-effective video system for a rapid appraisal of deep-sea benthic habitats: the azor drift-cam. Methods Ecol. Evol. 12, 1379–1388. doi: 10.1111/2041-210X.13617
Drǎguţ L., Csillik O., Eisank C., Tiede D. (2014). Automated parameterisation for multi-scale image segmentation on multiple layers. ISPRS J. Photogramm. Remote Sens. 88, 119–127. doi: 10.1016/j.isprsjprs.2013.11.018
Drǎguţ L., Tiede D., Levick S. R. (2010). ESP: a tool to estimate scale parameter for multiresolution image segmentation of remotely sensed data. Int. J. Geogr. Inf. Sci. 24, 859–871. doi: 10.1080/13658810903174803
Drap P. (2012). “Underwater photogrammetry for archaeology,” in Special applications of photogrammetry. Ed. Da Silva D. C. (Rijeka: IntechOpen), 111–136. doi: 10.5772/33999
Dunn M. J., Adlard S., Taylor A.P., Wood A.G., Trathan P.N., Ratcliffe N. (2021). Un-crewed aerial vehicle population survey of three sympatrically breeding seabird species at Signy Island, South Orkney Islands. Polar Biology 44, 717-727.
Durban J. W., Fearnbach H., Barrett-Lennard L. G., Perryman W. L., Leroi D. J. (2015). Photogrammetry of killer whales using a small hexacopter launched at sea. J. Unmanned Veh. Syst. 3, 131–135. doi: 10.1139/juvs-2015-0020
Durden J. M., Bett B. J., Schoening T., Morris K. J., Nattkemper T. W., Ruhl H. A. (2016). Comparison of image annotation data generated by multiple investigators for benthic ecology. Mar. Ecol. Prog. Ser. 552, 61–70. doi: 10.3354/meps11775
Easton R. R., Heppell S. S., Hannah R. W. (2015). Quantification of habitat and community relationships among nearshore temperate fishes through analysis of drop camera video. Mar. Coast. Fish. 7, 87–102. doi: 10.1080/19425120.2015.1007184
Eerkes-Medrano D., Drewery J., Burns F., Cárdenas P., Taite M., McKay D. W., et al. (2020). A community assessment of the demersal fish and benthic invertebrates of the rosemary bank seamount marine protected area (NE Atlantic). Deep. Res. Part I Oceanogr. Res. Pap., 156. doi: 10.1016/j.dsr.2019.103180
Elliott R. G., Dawson S. M., Henderson S. (2011). Acoustic monitoring of habitat use by bottlenose dolphins in doubtful sound, new Zealand. New Zeal. J. Mar. Freshw. Res. 45, 637–649. doi: 10.1080/00288330.2011.570351
Elliott S. A. M., Turrell W. R., Heath M. R., Bailey D. M. (2017). Juvenile gadoid habitat and ontogenetic shift observations using stereo-video baited cameras. Mar. Ecol. Prog. Ser. 568, 123–135. doi: 10.3354/meps12068
Emslie M. J., Cheal A. J., MacNeil M. A., Miller I. R., Sweatman H. P. A. (2018). Reef fish communities are spooked by scuba surveys and may take hours to recover. PeerJ 2018, 1–17. doi: 10.7717/peerj.4886
Espinoza M., Arce T. A., Zamora I. C., Chinchilla I. (2020). Monitoring elasmobranch assemblages in a data − poor country from the Eastern tropical pacific using baited remote underwater video stations. Sci. Rep. 156, 1–18. doi: 10.1038/s41598-020-74282-8
Estep L. L., Lillycrop W. J., Parson L. E. (1994). Estimation of maximum depth of penetration of a bathymetric LIDAR system using a secchi depth data base. Mar. Technol. Soc J. 28, 31–36.
Fallati L., Saponari L., Savini A., Marchese F., Corselli C., Galli P. (2020). Multi-temporal UAV data and bject-based image analysis (OBIA) for estimation of substrate changes in a post-bleaching scenario on a maldivian reef. Remote Sens. 12. doi: 10.3390/rs12132093
Ferrari R., Lachs L., Pygas D. R., Humanes A., Sommer B., Figueira W. F., et al. (2021). Photogrammetry as a tool to improve ecosystem restoration. Trends Ecol. Evol. 36, 1093–1101. doi: 10.1016/j.tree.2021.07.004
Ferrari R., Marzinelli E. M., Ayroza C. R., Jordan A., Figueira W. F., Byrne M., et al. (2018). Large-Scale assessment of benthic communities across multiple marine protected areas using an autonomous underwater vehicle. PloS One 13, 1–20. doi: 10.1371/journal.pone.0193711
Ferwerda J. G., De Leeuw J., Atzberger C., Vekerdy Z. (2007). Satellite-based monitoring of tropical seagrass vegetation: current techniques and future developments. Hydrobiologia 591, 59–71. doi: 10.1007/s10750-007-0784-5
Filisetti A., Marouchos A., Martini A., Martin T., Collings S. (2018). Developments and applications of underwater LiDAR systems in support of marine science. Ocean. 2018 MTS/IEEE Charleston. IEEE, 1–10. doi: 10.1109/OCEANS.2018.8604547
Finley K. J., Renaud W. E. (1980). Marine mammals inhabiting the Baffin bay north water in winter. Arctic 33, 724–738. doi: 10.14430/arctic2592
Fitzpatrick C., McLean D., Harvey E. S. (2013). Using artificial illumination to survey nocturnal reef fish. Fish. Res. 146, 41–50. doi: 10.1016/j.fishres.2013.03.016
Florisson J. H., Tweedley J. R., Walker T. H. E., Chaplin J. A. (2018). Reef vision: a citizen science program for monitoring the fish faunas of artificial reefs. Fish. Res. 206, 296–308. doi: 10.1016/j.fishres.2018.05.006
Forrest J. A. H., Bouchet P. J., Barley S. C., McLennan A. G., Meeuwig J. J. (2021). True blue: temporal and spatial stability of pelagic wildlife at a submarine canyon. Ecosphere 12. doi: 10.1002/ecs2.3423
Furlong M. E., Paxton D., Stevenson P., Pebody M., McPhail S. D., Perrett J. (2012). Autosub long range: a long range deep diving AUV for ocean monitoring. 2012 IEEE/OES Auton. Underw. Veh. AUV 2012, 1–7. doi: 10.1109/AUV.2012.6380737
Gaida T. C., Ali T. A. T., Snellen M., Amiri-Simkooei A., van Dijk T. A. G. P., Simons D. G. (2018). A multispectral bayesian classification method for increased acoustic discrimination of seabed sediments using multi-frequency multibeam backscatter data. Geosci 8. doi: 10.3390/geosciences8120455
Gao Y., Mas J. (2008). A comparison of the performance of pixel based and object based classifications over images with various spatial resolutions. Online J. Earth Sci. 2, 27–35.
García-Machado E., Laporte M., Normandeau E., Hernández C., Côté G., Paradis Y., et al. (2022). Fish community shifts along a strong fluvial environmental gradient revealed by eDNA metabarcoding. Environ. DNA 4, 117–134. doi: 10.1002/edn3.221
Goetze J. S., Bond T., McLean D. L., Saunders B. J., Langlois T. J., Lindfield S., et al. (2019). A field and video analysis guide for diver operated stereo-video. Methods Ecol. Evol. 10, 1083–1090. doi: 10.1111/2041-210X.13189
Gold Z., Sprague J., Kushner D. J., Marin E. Z., Barber P. H. (2021). eDNA metabarcoding as a biomonitoring tool for marine protected areas. PloS One 16, 1–19. doi: 10.1371/journal.pone.0238557
Gomes-Pereira J. N., Auger V., Beisiegel K., Benjamin R., Bergmann M., Bowden D., et al. (2016). Current and future trends in marine image annotation software. Prog. Oceanogr. 149, 106–120. doi: 10.1016/j.pocean.2016.07.005
Gonzalez-Rivero M., Beijbom O., Rodriguez-Ramirez A., Bryant D. E. P., Ganase A., Gonzalez-marrero Y., et al. (2020). Monitoring of coral reefs using artificial intelligence: a feasible and cost-effective approach. Remote Sens. 12, 1–22. doi: 10.3390/rs12030489
Grane-Feliu X., Bennett S., Hereu B., Aspillaga E., Santana-Garcon J. (2019). Comparison of diver operated stereo-video and visual census to assess targeted fish species in Mediterranean marine protected areas. J. Exp. Mar. Bio. Ecol. 520, 151205. doi: 10.1016/j.jembe.2019.151205
Halpern B. S., Warner R. R. (2002). Marine reserves have rapid and lasting effects. Ecol. Lett. 5, 361–366. doi: 10.1046/j.1461-0248.2002.00326.x
Hardinge J., Harvey E. S., Saunders B. J., Newman S. J. (2013). A little bait goes a long way: the influence of bait quantity on a temperate fish assemblage sampled using stereo-BRUVs. J. Exp. Mar. Bio. Ecol. 449, 250–260. doi: 10.1016/j.jembe.2013.09.018
Harvey E. S., Cappo M., Butler J. J., Hall N., Kendrick G. A. (2007). Bait attraction affects the performance of remote underwater video stations in assessment of demersal fish community structure. Mar. Ecol. Prog. Ser. 350, 245–254. doi: 10.3354/meps07192
Hays G. C., Hawkes L. A. (2018). Satellite tracking sea turtles: opportunities and challenges to address key questions. Front. Mar. Sci. 5. doi: 10.3389/fmars.2018.00432
He K., Zhang X., Ren S., Sun J. (2015). Delving deep into rectifiers: surpassing human-level performance on ImageNet classificatio. Proc. IEEE Int. Conf. Comput. Vis., 1026–1034.
Herkül K., Peterson A., Paekivi S. (2017). Applying multibeam sonar and mathematical modeling for mapping seabed substrate and biota of offshore shallows. Estuar. Coast. Shelf Sci. 192, 57–71. doi: 10.1016/j.ecss.2017.04.026
Hermoso M. I., Martin V. Y., Gelcich S., Stotz W., Thiel M. (2021). Exploring diversity and engagement of divers in citizen science: insights for marine management and conservation. Mar. Policy 124, 104316. doi: 10.1016/j.marpol.2020.104316
Heupel M. R., Reiss K. L., Yeiser B. G., Simpfendorfer C. A. (2008). Effects of biofouling on performance of moored data logging acoustic receivers. Limnol. Oceanogr. Methods 6, 327–335. doi: 10.4319/lom.2008.6.327
Hillman J. I. T., Lamarche G., Pallentin A., Pecher I. A., Gorman A. R., Schneider von Deimling J. (2018). Validation of automated supervised segmentation of multibeam backscatter data from the chatham rise, new Zealand. Mar. Geophys. Res. 39, 205–227. doi: 10.1007/s11001-016-9297-9
Hitchin R., Turner J. A., Verling E. (2015). Epibiota remote monitoring from digital imagery: operational guidelines. (Peterborough, UK: JNCC/NMBAQCS). 24pp. doi: 10.25607/OBP-413
Holmes J. A., Cronkite G. M. W., Enzenhofer H. J., Mulligan T. J. (2006). Accuracy and precision of fish-count data from a “dual-frequency identification sonar” (DIDSON) imaging system. ICES J. Mar. Sci. 63, 543–555. doi: 10.1016/j.icesjms.2005.08.015
Houghton J. D. R., Doyle T. K., Davenport J., Hays G. C. (2006). Developing a simple, rapid method for identifying and monitoring jellyfish aggregations from the air. Mar. Ecol. Prog. Ser. 314, 159–170. doi: 10.3354/meps314159
Husson E., Ecke F., Reese H. (2016). Comparison of manual mapping and automated object-based image analysis of non-submerged aquatic vegetation from very-High-Resolution UAS images. Remote Sens. 8, 1–18. doi: 10.3390/rs8090724
Huvenne V. A. I., Bett B. J., Masson D. G., Le Bas T. P., Wheeler A. J. (2016). Effectiveness of a deep-sea cold-water coral marine protected area, following eight years of fisheries closure. Biol. Conserv. 200, 60–69. doi: 10.1016/j.biocon.2016.05.030
Huvenne V. A. I., Huenerbach V., Blondel P., Le Bas T. P. (2007). Detailed mapping of shallow-water environments using image texture analysis on sidescan sonar and multibeam backscatter imagery. Underw. Acoust. Meas., 879–886.
Ierodiaconou D., Schimel A. C. G., Kennedy D., Monk J., Gaylard G., Young M., et al. (2018). Combining pixel and object based image analysis of ultra-high resolution multibeam bathymetry and backscatter for habitat mapping in shallow marine waters. Mar. Geophys. Res. 39, 271–288. doi: 10.1007/s11001-017-9338-z
Innangi S., Di Martino G., Romagnoli C., Tonielli R. (2019a). Seabed classification around lampione islet, pelagie islands marine protected area, Sicily channel, Mediterranean Sea. J. Maps 15, 153–164. doi: 10.1080/17445647.2019.1567401
Innangi S., Tonielli R., Romagnoli C., Budillon F., Di Martino G., Innangi M., et al. (2019b). MARI-D-18-00014R2 seabed mapping in the pelagie islands marine protected area (Sicily channel, southern Mediterranean) using remote sensing object based image analysis (RSOBIA). Mar. Geophys. Res. 40, 333–355. doi: 10.1007/s11001-018-9371-6
Jawak S. D., Vadlamani S. S., Luis A. J. (2015). A synoptic review on deriving bathymetry information using remote sensing technologies: models, methods and comparisons. Adv. Remote Sens. 04, 147–162. doi: 10.4236/ars.2015.42013
Jing D., Han J., Wang X., Wang G., Tong J., Shen W., et al. (2017). A method to estimate the abundance of fish based on dual-frequency identification sonar (DIDSON) imaging. Fish. Sci. 83, 685–697. doi: 10.1007/s12562-017-1111-3
Johnston D. W. (2019). Unoccupied aircraft systems in marine science and conservation. Ann. Rev. Mar. Sci. 11, 439–463. doi: 10.1146/annurev-marine-010318-095323
Jones R. E., Griffin R. A., Januchowski-Hartley S. R., Unsworth R. K. F. (2020). The influence of bait on remote underwater video observations in shallow-water coastal environments associated with the north-Eastern atlantic. PeerJ 8, 1–21. doi: 10.7717/peerj.9744
Jones R. S., Thompson M. J. (1978). Comparison of florida reef fish assemblages using a rapid visual technique. Bull. Mar. Sci. 28, 159–172.
Kachelriess D., Wegmann M., Gollock M., Pettorelli N. (2014). The application of remote sensing for marine protected area management. Ecol. Indic. 36, 169–177. doi: 10.1016/j.ecolind.2013.07.003
Kanjir U., Greidanus H., Oštir K. (2018). Vessel detection and classification from spaceborne optical images: a literature survey. Remote Sens. Lett. 207, 1–26. doi: 10.1016/j.rse.2017.12.033
Kanniah K. D., Sheikhi A., Cracknell A. P., Goh H. C., Tan K. P., Ho C. S., et al. (2015). Satellite images for monitoring mangrove cover changes in a fast growing economic region in southern peninsular Malaysia. Remote Sens. 7, 14360–14385. doi: 10.3390/rs71114360
Kilfoil J. P., Wirsing A. J., Campbell M. D., Kiszka J. J., Gastrich K. R., Heithaus M. R., et al. (2017). Baited remote underwater video surveys undercount sharks at high densities: insights from full-spherical camera technologies. Mar. Ecol. Prog. Ser. 585, 113–121. doi: 10.3354/meps12395
Kucharczyk M., Hay G. J., Ghaffarian S., Hugenholtz C. H. (2020). Geographic object-based image analysis: a primer and future directions. Remote Sens. 12, 1–33. doi: 10.3390/rs12122012
Kyhn L. A., Tougaard J., Thomas L., Duve L. R., Stenback J., Amundin M., et al. (2012). From echolocation clicks to animal density–acoustic sampling of harbor porpoises with static dataloggers. J. Acoust. Soc Am. 131, 550–560. doi: 10.1121/1.3662070
Lacharité M., Brown C. J., Gazzola V. (2018). Multisource multibeam backscatter data: developing a strategy for the production of benthic habitat maps using semi-automated seafloor classification methods. Mar. Geophys. Res. 39, 307–322. doi: 10.1007/s11001-017-9331-6
Ladich F. (2019). Ecology of sound communication in fishes. Fish Fish. 20, 552–563. doi: 10.1111/faf.12368
Lamb P. D., Fonseca V. G., Maxwell D. L., Nnanatu C. C. (2022). Systematic review and meta-analysis: water type and temperature affect environmental DNA decay. Mol. Ecol. Resour. 22, 1–12. doi: 10.1111/1755-0998.13627
Lamont T. A. C., Williams B., Chapuis L., Prasetya M. E., Seraphim M. J., Harding H. R., et al. (2022). The sound of recovery: coral reef restoration success is detectable in the soundscape. J. Appl. Ecol. 59, 742–756. doi: 10.1111/1365-2664.14089
Lang S., Hay G. J., Baraldi A., Tiede D., Blaschke T. (2019). GEOBIA achievements and spatial opportunities in the era of big earth observation data. ISPRS Int. J. Geo-Information 8. doi: 10.3390/ijgi8110474
Lang M., Meir J., Streeter T., Van Hoesen K. (2013). Diving physiology and decompression sickness: considerations from humans and marine animals. Smithson. Contrib. Mar. Sci. 39, 23–38.
Large A. R. G., Heritage G. L. (2009). “Laser scanning - evolution of the discipline,” in Laser scanning for the environmental sciences (Oxford: Wiley), 1–20. doi: 10.1002/9781444311952.ch1
Lester S. E., Halpern B. S., Grorud-Colvert K., Lubchenco J., Ruttenberg B. I., Gaines S. D., et al. (2009). Biological effects within no-take marine reserves: a global synthesis. Mar. Ecol. Prog. Ser. 384, 33–46. doi: 10.3354/meps08029
Letessier T. B., Mouillot D., Bouchet P. J., Vigliola L., Fernandes M. C., Thompson C., et al. (2019). Remote reefs and seamounts are the last refuges for marine predators across the indo-pacific. PloS Biol. 17, 1–20. doi: 10.1371/journal.pbio.3000489
Levy J., Hunter C., Lukacazyk T., Franklin E. C. (2018). Assessing the spatial distribution of coral bleaching using small unmanned aerial systems. Coral Reefs 37, 373–387. doi: 10.1007/s00338-018-1662-5
Li J., Fabina N. S., Knapp D. E., Asner G. P. (2020). The sensitivity of multi-spectral satellite sensors to benthic habitat change. Remote Sens. 12, 20–22. doi: 10.3390/rs12030532
Li J. H., Lee M. J., Park S. H., Kim J. T., Kim J. G., Suh J. H. (2013). Development of p-SURO II hybrid autonomous underwater vehicle and its experimental studies. J. Inst. Control. Robot. Syst. 19, 813–821. doi: 10.5302/J.ICROS.2013.13.9027
Li Y., Zhang H., Xue X., Jiang Y., Shen Q. (2018). Deep learning for remote sensing image classification: a survey. Wiley Interdiscip. Rev. Data Min. Knowl. Discovery 8, 1–17. doi: 10.1002/widm.1264
Lim A., Huvenne V. A. I., Vertino A., Spezzaferri S., Wheeler A. J. (2018). New insights on coral mound development from groundtruthed high-resolution ROV-mounted multibeam imaging. Mar. Geol. 403, 225–237. doi: 10.1016/j.margeo.2018.06.006
Lin Y., Hsiung J., Piersall R., White C., Lowe C. G., Clark C. M. (2017). A multi-autonomous underwater vehicle system for autonomous tracking of marine life. J. F. Robot. 34, 757–774. doi: 10.1002/rob.21668
Lindfield S. J., Harvey E. S., Mcilwain J. L., Halford A. R. (2014). Silent fish surveys: bubble-free diving highlights inaccuracies associated with SCUBA-based surveys in heavily fished areas. Methods Ecol. Evol. 5, 1061–1069. doi: 10.1111/2041-210X.12262
Liu D., Xia F. (2010). Assessing object-based classification: advantages and limitations. Remote Sens. Lett. 1, 187–194. doi: 10.1080/01431161003743173
Lucieer V., Lamarche G. (2011). Unsupervised fuzzy classification and object-based image analysis of multibeam data to map deep water substrates, cook strait, new Zealand. Cont. Shelf Res. 31, 1236–1247. doi: 10.1016/j.csr.2011.04.016
Lurton X. (2002). An introduction to underwater acoustics: principles and applications. 2nd ed (London: Springer).
Lurton X. (2016). Modelling of the sound field radiated by multibeam echosounders for acoustical impact assessment. Appl. Acoust. 101, 201–221. doi: 10.1016/j.apacoust.2015.07.012
Lurton X., Lamarche G. (2015). Backscatter measurements by seafloor mapping sonars: guidelines and recommendations.Guidelines and Recommendations. 200p. Available at: http://geohab.org/wp-content/uploads/2014/05/BSWG-REPORT-MAY2015.pdf
Ma L., Li M., Ma X., Cheng L., Du P., Liu Y. (2017). A review of supervised object-based land-cover image classification. ISPRS J. Photogramm. Remote Sens. 130, 277–293. doi: 10.1016/j.isprsjprs.2017.06.001
MacNeil M. A., Tyler E. H. M., Fonnesbeck C. J., Rushton S. P., Polunin N. V. C., Conroy M. J. (2008). Accounting for detectability in reef-fish biodiversity estimates. Mar. Ecol. Prog. Ser. 367, 249–260. doi: 10.3354/meps07580
Magris R. A., Heron S. F., Pressey R. L. (2015). Conservation planning for coral reefs accounting for climate warming disturbances. PloS One 10, 1–26. doi: 10.1371/journal.pone.0140828
Malik H., Id A. N., Hassan S., Ali F., Id A. N., Yon D. K. (2023). Multi-classification deep neural networks for identification of fish species using camera captured images. PloS One 18, 1–32. doi: 10.1371/journal.pone.0284992
Mandlburger G. (2020). A review of airborne laser bathymetry for mapping of inland and coastal waters. Hydrogr. Nachrichten 116, 6–15. doi: 10.23784/HN116-01
Marcoux M., Auger-méthé M., Chmelnitsky E. G., Ferguson S. H., Humphries M. M. (2011). Local passive acoustic monitoring of narwhal presence in the Canadian Arctic : a pilot project Source : Arctic Vol. 64 (Arctic Institute of North America Stable), 307–316. Available at: http://www.jstor.org/stable/2.
Mariani S., Baillie C., Colosimo G., Riesgo A. (2019). Sponges as natural environmental DNA samplers. Curr. Biol. 29, R401–R402. doi: 10.1016/j.cub.2019.04.031
Marrable D., Barker K., Sawitchaya T., W. M., Bainbridge S., Stowar M., et al. (2022). Accelerating species recognition and labelling of fish from underwater video with machine- assisted deep learning. Front. Mar. Sci. 9. doi: 10.3389/fmars.2022.944582
Marre G., Holon F., Luque S., Boissery P., Deter J. (2019). Monitoring marine habitats with photogrammetry: a cost-effective, accurate, precise and high-resolution reconstruction method. Front. Mar. Sci. 6. doi: 10.3389/fmars.2019.00276
Marsh L., Copley J. T., Huvenne V. A. I., Tyler P. A., the Isis ROV Facility (2013). Getting the bigger picture: using precision remotely operated vehicle (ROV) videography to acquire high-definition mosaic images of newly discovered hydrothermal vents in the southern ocean. Deep. Res. Part II Top. Stud. Oceanogr. 92, 124–135. doi: 10.1016/j.dsr2.2013.02.007
Marsh H., Saalfeld W. K. (1989). Aerial surveys of sea turtles in the northern great barrier reef marine park. Wildl. Res. 16, 239–249. doi: 10.1071/WR9890239
Martinez I., Jones E. G., Davie S. L., Neat F. C., Wigham B. D., Priede I. G. (2011). Variability in behaviour of four fish species attracted to baited underwater cameras in the north Sea. Hydrobiologia 670, 23–34. doi: 10.1007/s10750-011-0672-x
Maslin M., Louis S., Dejean K. G., Lapierre L., Villéger S., Claverie T. (2021). Underwater robots provide similar fish biodiversity assessments as divers on coral reefs. Remote Sens. Ecol. Conserv. 7, 567–578. doi: 10.1002/rse2.209
Matsuda T., Maki T., Masuda K., Sakamaki T. (2019). Resident autonomous underwater vehicle: underwater system for prolonged and continuous monitoring based at a seafloor station. Rob. Auton. Syst. 120, 103231. doi: 10.1016/j.robot.2019.07.001
Mauvisseau Q., Harper L. R., Sander M., Hanner R. H., Kleyer H., Deiner K. (2022). The multiple states of environmental DNA and what is known about their persistence in aquatic environments. Environ. Sci. Technol. 56, 5322–5333. doi: 10.1021/acs.est.1c07638
McCarthy M. J., Colna K. E., El-Mezayen M. M., Laureano-Rosario A. E., Méndez-Lázaro P., Otis D. B., et al. (2017). Satellite remote sensing for coastal management: a review of successful applications. Environ. Manage. 60, 323–339. doi: 10.1007/s00267-017-0880-x
McCauley D. J., Woods P., Sullivan B., Bergman B., Jablonicky C., Roan A., et al. (2016). Ending hide and seek at sea. Sci. (80-. ). 351, 1148–1150. doi: 10.1126/science.aad5686
Mellinger D. K., Stafford K. M., Moore S. E., Dziak R. P., Matsumoto H. (2007). An overview of fixed passive acoustic observation methods for cetaceans. Oceanography 20, 36–45. doi: 10.5670/oceanog.2007.03
Mikhail E. M., Bethel J. S., McGlone C. (2001). Introduction to modern photogrammetry (New York: John Wiley & Sons).
Mohamed H., Nadaoka K., Nakamura T. (2018). Assessment of machine learning algorithms for automatic benthic cover monitoring and mapping using towed underwater video camera and high-resolution satellite images. Remote Sens. 10. doi: 10.3390/rs10050773
Mohamed H., Nadaoka K., Nakamura T. (2020). Towards benthic habitat 3D mapping using machine learning algorithms and structures from motion photogrammetry. Remote Sens. 12, 127. doi: 10.3390/rs12010127
Moursund R. A., Carlson T. J., Peters R. D. (2003). A fisheries application of a dual-frequency identification sonar acoustic camera. ICES J. Mar. Sci. 60, 678–683. doi: 10.1016/S1054-3139(03)00036-5
Mulero-Pazmany M., Jenni-Eiermann S., Strebel N., Sattler T., Jose J. J., Tablado Z. (2017). Unmanned aircraft systems as a new source of disturbance for wildlife : a systematic review. PloS One 12, 1–14. doi: 10.1371/journal.pone.0178448
Murakami H., Yoon S., Kasai A., Minamoto T., Yamamoto S., Sakata M. K., et al. (2019). Dispersion and degradation of environmental DNA from caged fish in a marine environment. Fish. Sci. 85, 327–337. doi: 10.1007/s12562-018-1282-6
Neuswanger J., Wipfli M., Rosenberger A., Hughes N. (2015). Measuring fish and their physical habitats: versatile 2-d and 3-d video techniques with user-friendly software. Can. J. Fish. Aquat. Sci. 73, 1–13. doi: 10.1139/cjfas-2016-0010
Nichols J. D., Williams B. K. (2006). Monitoring for conservation. Trends Ecol. Evol. 21, 668–673. doi: 10.1016/j.tree.2006.08.007
Nocerino E., Menna F., Gruen A., Troyer M., Capra A., Castagnetti C., et al. (2020). Coral reef monitoring by scuba divers using underwater photogrammetry and geodetic surveying. Remote Sens. 12, 1–26. doi: 10.3390/rs12183036
Nuuttila H. K., Courtene-Jones W., Baulch S., Simon M., Evans P. G. H. (2017). Don’t forget the porpoise: acoustic monitoring reveals fine scale temporal variation between bottlenose dolphin and harbour porpoise in Cardigan bay SAC. Mar. Biol. 164, 1–16. doi: 10.1007/s00227-017-3081-5
O’Hea Miller S. B., Davis A. R., Wong M. Y. L. (2023). Further insights into Invasion : field observations of behavioural interactions between an invasive and critically underwater video ( BRUV ). Biol. (Basel). 12, 1–14. doi: 10.3390/biology12010018
Palomer A., Ridao P., Ribas D. (2019). Inspection of an underwater structure using point-cloud SLAM with an AUV and a laser scanner. J. F. Robot. 36, 1333–1344. doi: 10.1002/rob.21907
Pande A., MacDiarmid A. B., Smith P. J., Davidson R. J., Cole R. G., Freeman D., et al. (2008). Marine reserves increase the abundance and size of blue cod and rock lobster. Mar. Ecol. Prog. Ser. 366, 147–158. doi: 10.3354/meps07494
Pawlik J. R., Armstrong R. A., Farrington S., Reed J., Rivero-calle S., Singh H., et al. (2022). Comparison of recent survey techniques for estimating benthic cover on Caribbean mesophotic reefs. Mar. Ecol. Prog. Ser. 686, 201–211. doi: 10.3354/meps14018
Pérez-Rosales G., Pichon M., Rouzé H., Villéger S., Torda G., Bongaerts P., et al. (2022). Mesophotic coral ecosystems of French Polynesia are hotspots of alpha and beta generic diversity for scleractinian assemblages. Divers. Distrib. 28, 1391–1403. doi: 10.1111/ddi.13549
Piazza P., Cummings V., Guzzi A., Hawes I., Lohrer A., Marini S., et al. (2019). Underwater photogrammetry in Antarctica: long-term observations in benthic ecosystems and legacy data rescue. Polar Biol. 42, 1061–1079. doi: 10.1007/s00300-019-02480-w
Picciulin M., Kéver L., Parmentier E., Bolgan M. (2019). Listening to the unseen: passive acoustic monitoring reveals the presence of a cryptic fish species. Aquat. Conserv. Mar. Freshw. Ecosyst. 29, 202–210. doi: 10.1002/aqc.2973
Piechaud N., Howell K. L. (2022). Ecological informatics fast and accurate mapping of fine scale abundance of a VME in the deep sea with computer vision. Ecol. Inform. 71, 101786. doi: 10.1016/j.ecoinf.2022.101786
Piechaud N., Hunt C., Culverhouse P. F., Foster N. L., Howell K. L. (2019). Automated identification of benthic epifauna with computer vision. Mar. Ecol. Prog. Ser. 615, 15–30. doi: 10.3354/meps12925
Pilgrim D. A., Parry D. M., Jones M. B., Kendall M. A. (2000). ROV image scaling with laser spot patterns. Underw. Technol. 24, 93–103. doi: 10.3723/175605400783259684
Port J. A., O’Donnell J. L., Romero-Maraccini O. C., Leary P. R., Litvin S. Y., Nickols K. J., et al. (2016). Assessing vertebrate biodiversity in a kelp forest ecosystem using environmental DNA. Mol. Ecol. 25, 527–541. doi: 10.1111/mec.13481
Poursanidis D., Topouzelis K., Chrysoulakis N. (2018). Mapping coastal marine habitats and delineating the deep limits of the neptune’s seagrass meadows using very high resolution earth observation data. Int. J. Remote Sens. 39, 8670–8687. doi: 10.1080/01431161.2018.1490974
Poursanidis D., Traganos D., Reinartz P., Chrysoulakis N. (2019). On the use of sentinel-2 for coastal habitat mapping and satellite-derived bathymetry estimation using downscaled coastal aerosol band. Int. J. Appl. Earth Obs. Geoinf. 80, 58–70. doi: 10.1016/j.jag.2019.03.012
Price D. M., Robert K., Callaway A., Lo lacono C., Hall R. A., Huvenne V. A. I. (2019). Using 3D photogrammetry from ROV video to quantify cold-water coral reef structural complexity and investigate its influence on biodiversity and community assemblage. Coral Reefs 38, 1007–1021. doi: 10.1007/s00338-019-01827-3
Priede I., Bagley P. (2000). In situ studies on deep-sea demersal fishes using autonomous unmanned lander platforms. Oceanogr. Mar. Biol. Annu. Rev. 38, 357–392.
Purkis S., Klemas V. (2011). Remote sensing and global environmnetal change (Oxford, UK: Wiley Blackwell).
Purser A., Marcon Y., Dreutter S., Hoge U., Sablotny B., Hehemann L., et al. (2019). Ocean floor observation and bathymetry system (OFOBS): a new towed camera/sonar system for deep-sea habitat surveys. IEEE J. Ocean. Eng. 44, 87–99. doi: 10.1109/JOE.2018.2794095
Qian C., Huang B., Yang X., Chen G. (2021). Data science for oceanography: from small data to big data. Big Earth Data 00, 1–15. doi: 10.1080/20964471.2021.1902080
Rankin S., Archer F., Keating J. L., Oswald J. N., Oswald M., Curtis A., et al. (2017). Acoustic classification of dolphins in the California current using whistles, echolocation clicks, and burst pulses. Mar. Mammal Sci. 33, 520–540. doi: 10.1111/mms.12381
Raoult V., Colefax A. P., Allan B. M., Cagnazzi D., Castelblanco-Martínez N., Ierodiaconou D., et al. (2020a). Operational protocols for the use of drones in marine animal research. Drones 4, 1–35. doi: 10.3390/drones4040064
Raoult V., Tosetto L., Harvey C., Nelson T. M., Reed J., Parikh A., et al. (2020b). Remotely operated vehicles as alternatives to snorkellers for video-based marine research. J. Exp. Mar. Bio. Ecol. 522, 151253. doi: 10.1016/j.jembe.2019.151253
Rayment W., Dawson S., Slooten L. (2009). Trialling an automated passive acoustic detector (T-POD) with hector’s dolphins (Cephalorhynchus hectori). J. Mar. Biol. Assoc. United Kingdom 89, 1015–1022. doi: 10.1017/S0025315409003129
Reid P. C., Colebrook J. M., Matthews J. B. L., Aiken J. (2003). The continuous plankton Recorder : concepts and history, from plankton indicator to undulating recorders. Prog. Oceanogr. 58, 117–173. doi: 10.1016/j.pocean.2003.08.002
Richardson W. J., Greene C. R. J., Malme C. I., Thomson D. H. (1995). Marine mammals and noise (San Diego: Academic Press).
Robson B. A., Bolch T., MacDonell S., Hölbling D., Rastner P., Schaffer N. (2020). Automated detection of rock glaciers using deep learning and object-based image analysis. Remote Sens. Environ. 250. doi: 10.1016/j.rse.2020.112033
Roelfsema C., Kovacs E., Ortiz J. C., Wolff N. H., Callaghan D., Wettle M., et al. (2018). Coral reef habitat mapping: a combination of object-based image analysis and ecological modelling. Remote Sens. Environ. 208, 27–41. doi: 10.1016/j.rse.2018.02.005
Roman C., Inglis G., McGilvray B. (2011). Lagrangian Floats as sea floor imaging platforms. Cont. Shelf Res. 31, 1592–1598. doi: 10.1016/j.csr.2011.06.019
Rowat D., Gore M., Meekan M. G., Lawler I. R., Bradshaw C. J. A. (2009). Aerial survey as a tool to estimate whale shark abundance trends. J. Exp. Mar. Bio. Ecol. 368, 1–8. doi: 10.1016/j.jembe.2008.09.001
Runya R. M., McGonigle C., Quinn R., Howe J., Collier J., Fox C., et al. (2021). Examining the links between multi-frequency multibeam backscatter data and sediment grain size. Remote Sens. 13. doi: 10.3390/rs13081539
Sahoo A., Dwivedy S. K., Robi P. S. (2019). Advancements in the field of autonomous underwater vehicle. Ocean Eng. 181, 145–160. doi: 10.1016/j.oceaneng.2019.04.011
Schaub J., Hunt B. P. V., Pakhomov E. A., Holmes K., Lu Y., Quayle L. (2018). Using unmanned aerial vehicles (UAVs) to measure jellyfish aggregations. Mar. Ecol. Prog. Ser. 591, 29–36. doi: 10.3354/meps12414
Schoening T., Kuhn T., Nattkemper T. W. (2014). “Seabed classification using a bag-of-prototypes feature representation,” in 2014 ICPR Work. Comput. Vis. Anal. Underw. Imag. (CVAUI), IEEE. 1–8.
Sepulveda A. J., Hutchins P. R., Forstchen M., Mckeefry M. N., Swigris A. M. (2020). The elephant in the Lab ( and field ): contamination in aquatic environmental DNA studies. Front. Ecol. Evol. 8. doi: 10.3389/fevo.2020.609973
Sheehan E. V., Stevens T. F., Attrill M. J. (2010). A quantitative, non-destructive methodology for habitat characterisation and benthic monitoring at offshore renewable energy developments. PloS One 5. doi: 10.1371/journal.pone.0014461
Sheehan E. V., Vaz S., Pettifer E., Foster N. L., Nancollas S. J., Cousens S., et al. (2016). An experimental comparison of three towed underwater video systems using species metrics, benthic impact and performance. Methods Ecol. Evol. 7, 843–852. doi: 10.1111/2041-210X.12540
Sherman C. S., Chin A., Heupel M. R., Simpfendorfer C. A. (2018). Are we underestimating elasmobranch abundances on baited remote underwater video systems (BRUVS) using traditional metrics? J. Exp. Mar. Bio. Ecol. 503, 80–85. doi: 10.1016/j.jembe.2018.03.002
Širović A., Rice A., Chou E., Hildebrand J. A., Wiggins S. M., Roch M. A. (2015). Seven years of blue and fin whale call abundance in the southern California bight. Endanger. Species Res. 28, 61–76. doi: 10.3354/esr00676
Stoner A. W., Ryer C. H., Parker S. J., Auster P. J., Wakefield W. W. (2008). Evaluating the role of fish behavior in surveys conducted with underwater vehicles. Can. J. Fish. Aquat. Sci. 65, 1230–1243. doi: 10.1139/F08-032
Stubenrauch C. J., Rossow W. B., Kinne S., Ackerman S., Cesana G., Chepfer H., et al. (2013). Assessment of global cloud datasets from satellites: project and database initiated by the GEWEX radiation panel. Bull. Am. Meteorol. Soc 94, 1031–1049. doi: 10.1175/BAMS-D-12-00117.1
Summers G., Lim A., Wheeler A. J. (2021). A scalable, supervised classification of seabed sediment waves using an object-based image analysis approach. Remote Sens. 13, 1–27. doi: 10.3390/rs13122317
Takahashi M., Saccò M., Kestel J. H., Nester G., Campbell M. A., Van Der Heyde M., et al. (2023). Aquatic environmental DNA : a review of the macro-organismal biomonitoring revolution. Sci. Total Environ. 873, 1–23. doi: 10.1016/j.scitotenv.2023.162322
Torres A., Abril A. M., Clua E. E. G. (2020). A time-extended (24 h) baited remote underwater video (BRUV) for monitoring pelagic and nocturnal marine species. J. Mar. Sci. Eng. 8. doi: 10.3390/jmse8030208
Trenkel V. M., Lorance P., Mahévas S. (2004). Do visual transects provide true population density estimates for deepwater fish? ICES J. Mar. Sci. 61, 1050–1056. doi: 10.1016/j.icesjms.2004.06.002
Truelove N. K., Andruszkiewicz E. A., Block B. A. (2019). A rapid environmental DNA method for detecting white sharks in the open ocean. Methods Ecol. Evol. 10, 1128–1135. doi: 10.1111/2041-210X.13201
van Rein H. B., Brown C., Quinn R., Breen J. (2009). A review of sublittoral monitoring methods in temperate waters: a focus on scale. Underw. Technol. 28, 99–113. doi: 10.3723/ut.28.099
van Rein H., Schoeman D. S., Brown C. J., Quinn R., Breen J. (2011). Development of benthic monitoring methods using photoquadrats and scuba on heterogeneous hard-substrata: a boulder-slope community case study. Aquat. Conserv. Mar. Freshw. Ecosyst. 21, 676–689. doi: 10.1002/aqc.1224
Veilleux H. D., Misutka M. D., Glover C. N. (2021). Environmental DNA and environmental RNA: current and prospective applications for biological monitoring. Sci. Total Environ. 782, 146891. doi: 10.1016/j.scitotenv.2021.146891
Ventura D., Bonifazi A., Gravina M. F., Belluscio A., Ardizzone G. (2018). Mapping and classification of ecologically sensitive marine habitats using unmanned aerial vehicle (UAV) imagery and object-based image analysis (OBIA). Remote Sens. 10, 1–23. doi: 10.3390/rs10091331
Verfuss U. K., Aniceto A. S., Harris D. V., Gillespie D., Fielding S., Jiménez G., et al. (2019). A review of unmanned vehicles for the detection and monitoring of marine fauna. Mar. pollut. Bull. 140, 17–29. doi: 10.1016/j.marpolbul.2019.01.009
Vieira E. A., de Souza L. R., Longo G. O. (2020). Diving into science and conservation: recreational divers can monitor reef assemblages. Perspect. Ecol. Conserv. 18, 51–59. doi: 10.1016/j.pecon.2019.12.001
Villon S., Mouillot D., Chaumont M., Darling E. S., Subsol G., Claverie T., et al. (2018). A deep learning method for accurate and fast identification of coral reef fishes in underwater images. Ecol. Inform. 48, 238–244. doi: 10.1016/j.ecoinf.2018.09.007
Wang C. C., Tang D. (2012). Application of underwater laser scanning for seafloor shell fragments characterization. J. Mar. Sci. Technol. 20, 95–102. doi: 10.51400/2709-6998.2427
Wartenberg R., Booth A. J. (2015). Video transects are the most appropriate underwater visual census method for surveying high-latitude coral reef fishes in the southwestern Indian ocean. Mar. Biodivers. 45, 633–646. doi: 10.1007/s12526-014-0262-z
Wedding L. M., Friedlander A. M., McGranaghan M., Yost R. S., Monaco M. E. (2008). Using bathymetric lidar to define nearshore benthic habitat complexity: implications for management of reef fish assemblages in Hawaii. Remote Sens. Environ. 112, 4159–4165. doi: 10.1016/j.rse.2008.01.025
Weltz K., Lyle J. M., Ovenden J., Morgan J. A. T., Moreno D. A., Semmens J. M. (2017). Application of environmental DNA to detect an endangered marine skate species in the wild. PloS One 12, 1–16. doi: 10.1371/journal.pone.0178124
Wheeler A. J., Lim A., Butschek F., O’reilly L., Harris K., O’driscoll P. (2021). The “little monsta” deep-sea benthic, precision deployable, multi-sensor and sampling lander array. Sensors 21, 1–13. doi: 10.3390/s21103355
Wheeler A. J., Murton B., Copley J., Lim A., Carlsson J., Collins P., et al. (2013). Moytirra: discovery of the first known deep-sea hydrothermal vent field on the slow-spreading mid-Atlantic ridge north of the Azores. Geochemistry Geophys. Geosystems 14, 4170–4184. doi: 10.1002/ggge.20243
White E. R., Myers M. C., Flemming J. M., Baum J. K. (2015). Shifting elasmobranch community assemblage at Cocos island-an isolated marine protected area. Conserv. Biol. 29, 1186–1197. doi: 10.1111/cobi.12478
Whitmarsh S. K., Fairweather P. G., Huveneers C. (2017). What is big BRUVver up to? methods and uses of baited underwater video. Rev. Fish Biol. Fish. 27, 53–73. doi: 10.1007/s11160-016-9450-1
Wilding T. A., Gill A. B., Boon A., Sheehan E., Dauvin J. C., Pezy J. P., et al. (2017). Turning off the DRIP (‘Data-rich, information-poor’) – rationalising monitoring with a focus on marine renewable energy developments and the benthos. Renew. Sustain. Energy Rev. 74, 848–859. doi: 10.1016/j.rser.2017.03.013
Wilks J., Davis R. J. (2000). Risk management for scuba diving operators on Australia ‘ s great barrier reef. Tour. Manage. 21, 591–599. doi: 10.1016/S0261-5177(00)00008-X
Wilson B., Benjamins S., Elliott J. (2014). Using drifting passive echolocation loggers to study harbour porpoises in tidal-stream habitats. Endanger. Species Res. 22, 125–143. doi: 10.3354/esr00538
Witman J. D., Dayton P. K., Arnold S. N., Steneck R. S., Birkeland C. (2013). Scuba revolutionizes marine science. Smithson. Contrib. Mar. Sci. 39, 3–11.
Wright S., Hull T., Sivyer D. B., Pearce D., Pinnegar J. K., Sayer M. D., et al. (2016). SCUBA divers as oceanographic samplers: The potential of dive computers to augment aquatic temperature monitoring. Scientific Reports 6(1), 1–8.
Wynn R. B., Huvenne V. A. I., Le Bas T. P., Murton B. J., Connelly D. P., Bett B. J., et al. (2014). Autonomous underwater vehicles (AUVs): their past, present and future contributions to the advancement of marine geoscience. Mar. Geol. 352, 451–468. doi: 10.1016/j.margeo.2014.03.012
Yamahara K. M., Preston C. M., Birch J., Walz K., Marin R., Jensen S., et al. (2019). In situ autonomous acquisition and preservation of marine environmental dna using an autonomous underwater vehicle. Front. Mar. Sci. 6. doi: 10.3389/fmars.2019.00373
Yasir M., Ur A., Moneeb R. (2020). Habitat mapping using deep neural networks. Multimed. Syst. 27, 679–690. doi: 10.1007/s00530-020-00695-0
Ye S., Pontius R. G., Rakshit R. (2018). A review of accuracy assessment for object-based image analysis: from per-pixel to per-polygon approaches. ISPRS J. Photogramm. Remote Sens. 141, 137–147. doi: 10.1016/j.isprsjprs.2018.04.002
Yuval M., Alonso I., Eyal G., Tchernov D., Loya Y., Murillo A. C., et al. (2021). Repeatable semantic reef-mapping through photogrammetry and label-augmentation. Remote Sens. 13, 1–19. doi: 10.3390/rs13040659
Zavalas R., Ierodiaconou Daniel D., Ryan D., Rattray A., Monk J. (2014). Habitat classification of temperate marine macroalgal communities using bathymetric LiDAR. Remote Sens. 6, 2154–2175. doi: 10.3390/rs6032154
Zhang X., Xiao P., Feng X. (2020). Object-specific optimization of hierarchical multiscale segmentations for high-spatial resolution remote sensing images. ISPRS J. Photogramm. Remote Sens. 159, 308–321. doi: 10.1016/j.isprsjprs.2019.11.009
Keywords: monitoring, marine protected area, management, marine, conservation, biodiversity, habitat
Citation: McGeady R, Runya RM, Dooley JSG, Howe JA, Fox CJ, Wheeler AJ, Summers G, Callaway A, Beck S, Brown LS, Dooly G and McGonigle C (2023) A review of new and existing non-extractive techniques for monitoring marine protected areas. Front. Mar. Sci. 10:1126301. doi: 10.3389/fmars.2023.1126301
Received: 17 December 2022; Accepted: 23 June 2023;
Published: 19 July 2023.
Edited by:
Carolyn J. Lundquist, National Institute of Water and Atmospheric Research (NIWA), New ZealandReviewed by:
Thomas Claverie, University Center of Mayotte, MayotteNicola Foster, University of Plymouth, United Kingdom
Copyright © 2023 McGeady, Runya, Dooley, Howe, Fox, Wheeler, Summers, Callaway, Beck, Brown, Dooly and McGonigle. This is an open-access article distributed under the terms of the Creative Commons Attribution License (CC BY). The use, distribution or reproduction in other forums is permitted, provided the original author(s) and the copyright owner(s) are credited and that the original publication in this journal is cited, in accordance with accepted academic practice. No use, distribution or reproduction is permitted which does not comply with these terms.
*Correspondence: Ryan McGeady, ryanjmcgeady@gmail.com