Summer phytoplankton photosynthetic characteristics in the Changjiang River Estuary and the adjacent East China Sea
 Ji Li
Ji Li Yonghui Gao
 Yalin Bao1
  Xiu Gao
 Patricia M. Glibert
- 1School of Oceanography, Shanghai Jiao Tong University, Shanghai, China
- 2Shanghai Frontiers Science Center of Polar Science (SCOPS), Shanghai, China
- 3Horn Point Laboratory, University of Maryland Center for Environmental Science, Cambridge, MD, United States
Introduction: The Changjiang (Yangtze) River is one of the largest rivers in the world, and its estuary and offshore plume create a diversity of ecological habitats for the phytoplankton community. The phytoplankton community has to balance between light limitation in the sediment-laden inshore waters and nutrient limitation in the offshore waters. Active fluorescence measurements can provide rapid, non-intrusive estimates of photosynthetic characteristics at high spatial and temporal resolution.
Methods: In the summer of 2020, a field survey of hydrodynamic characteristics, availability of nutrients, the maximum quantum efficiency of photosystem II (Fv/Fm), and rapid light curves across the Changjiang River Estuary and its adjacent sea was conducted, assessing relationships between photosynthetic physiology and biomass accumulation.
Results: The photosynthetic activities significantly differed among the turbid river water, the stratified river plume water, and the oceanic East China Sea Water. The photosynthetic physiology of phytoplankton was the most active near the front of Changjiang Diluted Water, where the Fv/Fm was over 0.5.
Discussion: Phytoplankton photosynthesis was alleviated from light limitation downstream of the river mouth, and benefited from phosphorus supply via tidal mixing and upwelling. The relatively suitable light and nutrients led to high photosynthetic activities, supporting increased productivity and biomass in this water. The phytoplankton in the Changjiang estuary rivermouth were under intense stress, suggested by the Fv/Fm values under 0.3. Also, the strong vertical mixing process diluted the river nutrients before the phytoplankton consumed them. Nutrients further limited the phytoplankton offshore in the East China Sea.
1 Introduction
The Changjiang (Yangtze) River is the longest river in Asia and is ranked 5th in water discharge and 4th in sediment loading in the world (Dai and Lu, 2014; Luan et al., 2016). The maximum discharge rate of Changjiang River has been reported to be over 40,000 m3/s in summer (Luan et al., 2016). The terrestrial nutrients from the Changjiang River make the Changjiang River Estuary (CRE) one of the most productive areas in coastal China (Gong et al., 2003; Wang et al., 2016). However, due to the rapid development of China’s economy and the rapid increase in population, the CRE has contributed significantly to eutrophication of its estuarine system, causing a shift from diatoms to a degraded system with frequent harmful dinoflagellate blooms every year (Zhang et al., 2007; Zhou et al., 2022).
The CRE is also one of the most studied coastal ecosystems in China (e.g., Zhang and Liu, 2002; Zhang et al., 2007; Zhou et al., 2008). The estuarine dynamics and the biogeochemical processes have been extensively studied in detail. A massive plume region is created when the large amount of freshwater enters the ocean (Wu and Wu, 2018). The suspended sediments from river input form a sediment front between the well-mixed low-salinity water near the river mouth and the stratified plume water seaward (Ge et al., 2020). Complicated mechanisms between the river strongly influence the CRE, including Pacific ocean water masses in the East China Sea (ECS), the Taiwan Warm Current (TWC), the Subei coastal current and the intrusion of the Kuroshio Current (Qi et al., 2014). The complex dynamic physical characteristics of the CRE drive the biochemical cycles of nutrients, suspended matter, and light, ultimately affecting the spatial and temporal distribution and physiological status of phytoplankton in the estuary and its adjacent sea areas (Li et al., 2021). There are many records of the temporal and spatial dynamics of the phytoplankton in the CRE (e.g., Wang et al., 2021; Fang et al., 2022; Gao et al., 2022). However, there has been a lack of in situ data sets about the photosynthetic characteristics of phytoplankton in the mixing of different water masses of this estuarine area.
The maximal photochemical efficiency (Fv/Fm) is one of the principal parameters of photosynthesis. Fv/Fm is often used as an indicator of the physiological status of phytoplankton (Parkhill et al., 2001). Relatively low Fv/Fm indicates the environmental stresses and/or photoinhibition (Tan et al., 2019). Rapid light curves (RLC) measure effective quantum yields, and acclimation of photosynthetic activates over a range of changing actinic irradiances, which provide additional information about the efficiency (alpha, α) and maximum photosynthetic capacity (as relative electron transport rate, rETRmax) of photosynthesis to assess the photosynthetic activates (Marshall et al., 2000; Ralph and Gademann, 2005). Here, these measures were used to assess spatial variations in physiological status of the phytoplankton across the gradient of light and nutrient limitation of the CRE.
In the study, we hypothesized that the photosynthetic activities of phytoplankton along the CRE were impacted by variations in the mixing of different water masses because of differences in their turbidity and nutrient content. The investigations of phytoplankton biomass and photosynthesis parameters were conducted along the transition from the inner river mouth to the adjacent shelf in the Changjiang River Estuary in the summer of 2020. This region spans the gradient from the inner light-limited zone through the plume to the offshore nutrient limited zone (sensu Li et al., 2021). Highest chlorophyll a (Chl-a) has previously been documented in the transition zone beyond the sediment front where sufficient light is available for growth. These measurements therefore build an understanding of the physiological status of the phytoplankton to support the previously observed biomass accumulation.
2 Materials and methods
2.1 Study sites and sampling regime
A cruise was conducted between 1 and 5 July 2020 in the CRE and its adjacent ECS onboard the R/V RunJiang. Observations of physical and biogeochemical variables were made along two cross-shelf transects extending from the estuary and another two transects parallel to these two transects located in the north and south of them in the lower Yellow Sea and the upper East China Sea, respectively. These transects are labeled as A, B, C, and D from north to south, and data and samples were collected at the 52 stations on these four transects (Figure 1).
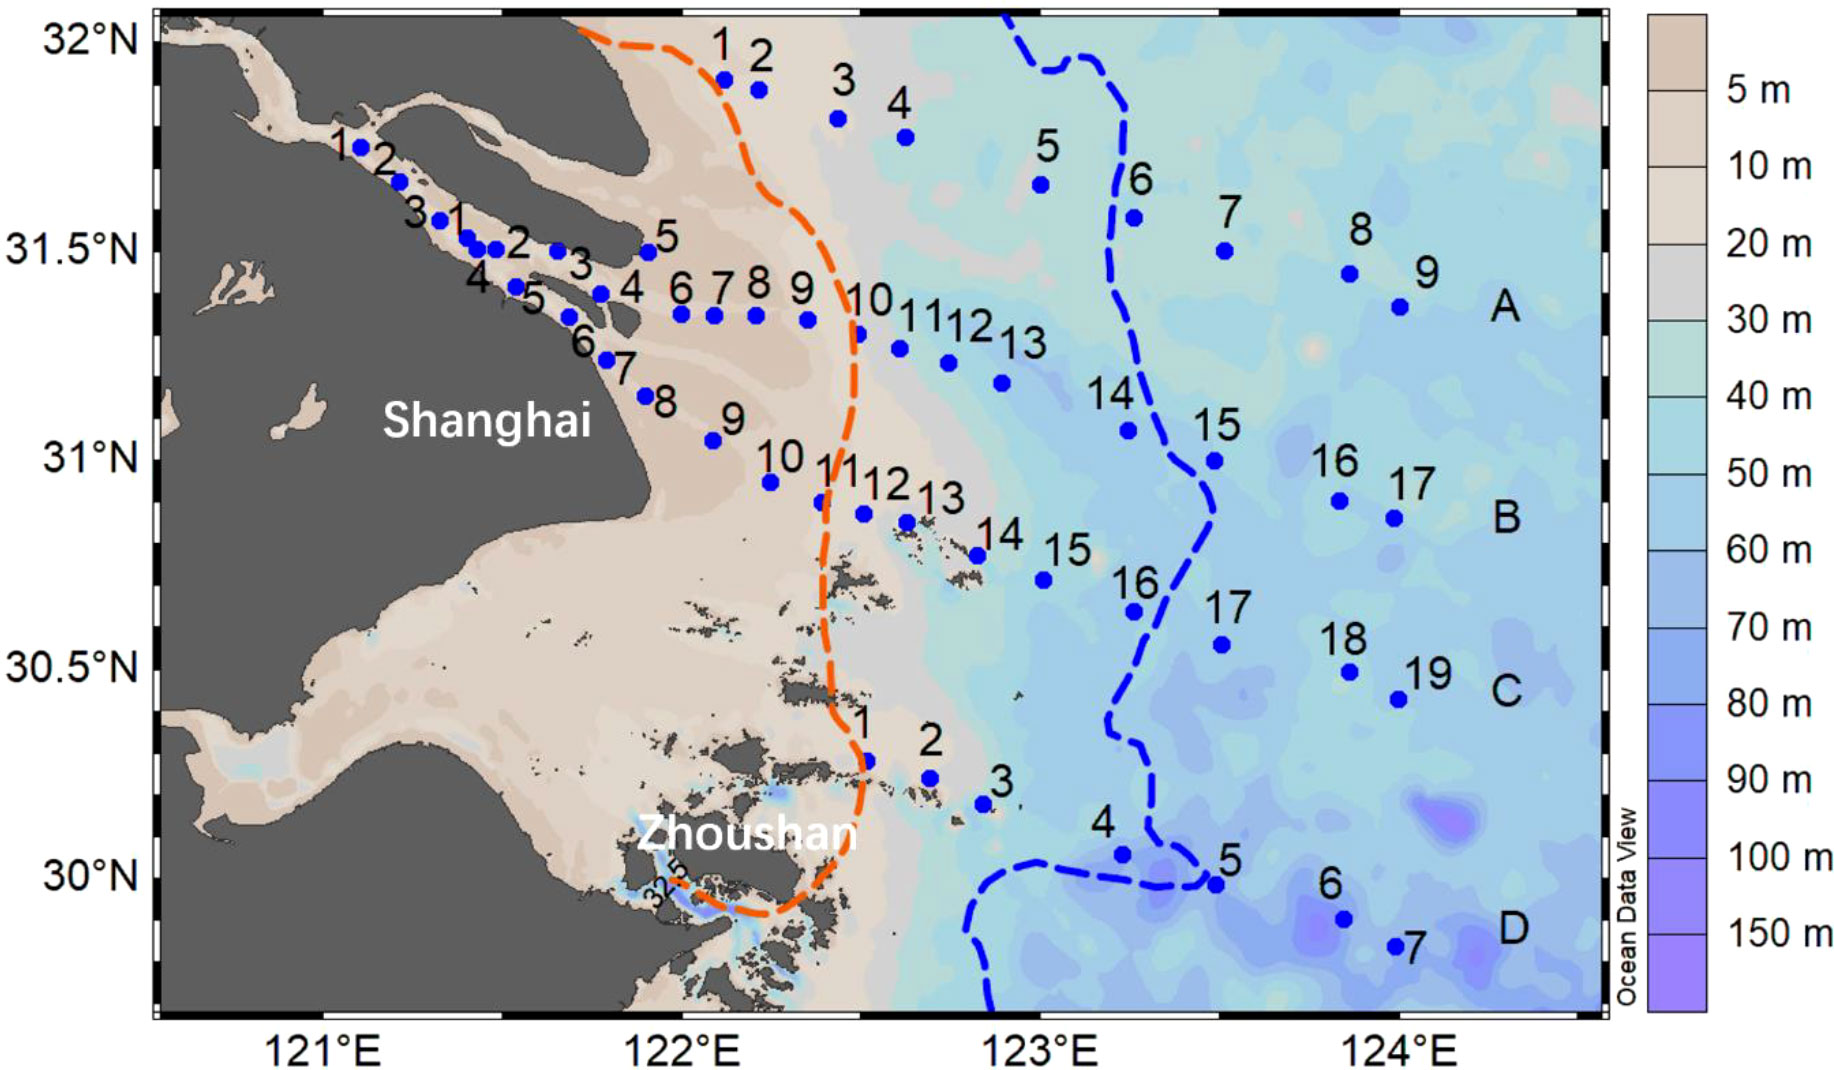
Figure 1 Stations for transects (A–D) in the southern branch of the Changjiang River Estuary and the adjacent East China Sea. The background map shows the water column depth. The location of sediment front (red line) and plume front (blue line) of the estuary were shown according to Li et al., 2021.
2.2 Sampling and hydrographic properties
The basic physical parameters, including temperature, salinity, dissolved oxygen (DO) and turbidity, were measured at each station through a Sea-Bird Electronics (SBE) 911 Sealogger CTD (Conductivity-Temperature-Depth) system with DO sensor SBE43 (U.S.). The Apparent Oxygen Utilization (AOU) was estimated by the difference between the measured DO and its equilibrium saturation concentration in water with the same properties. Photosynthetically active radiation (PAR) was assessed on the deck with a portable illuminometer (Biospherical, QSL2101, U.S.). The surface (about 3 meters in depth) PAR values were calculated with the optical attenuation coefficient (Kd). Water samples at different depths in each station were taken using a Niskin hydrophore (General Oceanics, US).
Surface water samples were filtered through 25 mm GF/F glass fiber filters (Whatman, U.K.). The filters were frozen in sterile sample bags, and the water samples were stored in high-density polyethylene bottles at -20°C. Subsequently, the filters were used to determine parameters such as Chl-a and accessory pigments, and nutrient concentrations were measured from the water samples.
The Chl-a concentrations were measured following the National Standard of China for the Specification for Marine Monitoring (State Bureau of Quality and Technical Supervision of China, 2007). Filters were extracted with 90% acetone in a dark environment at a low temperature for 12h. The total Chl-a content was determined by using a chlorophyll fluorescence analyzer (Trilogy, U.S.). The nitrate (NO3-), nitrite (NO2-), ammonium (NH4+), dissolved silica (DSi), and soluble reactive phosphorus (SRP) concentrations of the filtered water samples were measured in the laboratory by a continuous flow nutrient analyzer (QuAAtro, Germany). The sum of NO3-, NO2- and NH4+ constituted dissolved inorganic nitrogen (DIN).
The photosynthetic pigment composition of phytoplankton at ten stations on transect C was analyzed by High-Performance Liquid Chromatography (HPLC, Dionex UltiMate 3000) following Van Heukelem and Thomas (2001). The phytoplankton community composition was calculated using CHEMTAX (Mackey et al., 1996) in R-Studio (4.1.3) by the calculation of the matrices of species-specific pigments of different concentrations and ratios with the references from earlier phytoplankton research with CHEMTAX in the ECS (Zhu et al., 2009).
2.3 In situ measurement of photosynthetic activity
Photosynthetic parameters of samples at all 52 sampling stations were measured using a Phyto-PAM II (Walz, Germany). The on-site water samples were quickly stored in a blackened bottle and placed in a flowing seawater environmental bath. After 20-minutes dark adaptation, a 2mL sample was transferred to a quartz cuvette using a pipettor, and the measuring light of Phyto-PAM II was turned on to obtain the minimal fluorescence F0. Then, the Saturation Pulse was turned on to obtain the maximum fluorescence Fm after dark adaptation. (Fm-F0) is variable fluorescence. The maximum photochemical efficiency Fv/Fm was calculated by:
The in situ actinic light was set from 1 μmol photons m-2 s-1 and increased by 100 μmol photons m-2 s-1 every 30s to 1300 μmol photons m-2 s-1 to obtain the RLC parameters. Three parameters were determined from the RLCs: initial slope (α), rETRmax, and saturation light intensity (Ik).
2.4 Data processing and statistical analysis
Environmental data and photosynthetic parameters were processed in Excel and R-Studio. Figures were made using Ocean Data View and R-Studio. All comparisons were made via repeated measures ANOVA with a Tukey–Kramer adjustment for pairwise comparison. Also, Pearson correlations were calculated to examine relationships between photosynthetic and physical parameters.
3 Results
3.1 Research area hydrological and environmental parameters
All transects encompassed the previously defined zones of the CRE (Table 1). The sediment front was located at 121.9°E–122.5°E, and the plume front was located at approximately 122.5°E–123.5°E. Using previously defined zones (Li et al., 2021), Zone I is where the turbid river reaches the estuary mouth before the sediment front; Zone II is the stratified river plume water between the sediment front and plume front; and Zone III is the oceanic water offshore off the plume front.
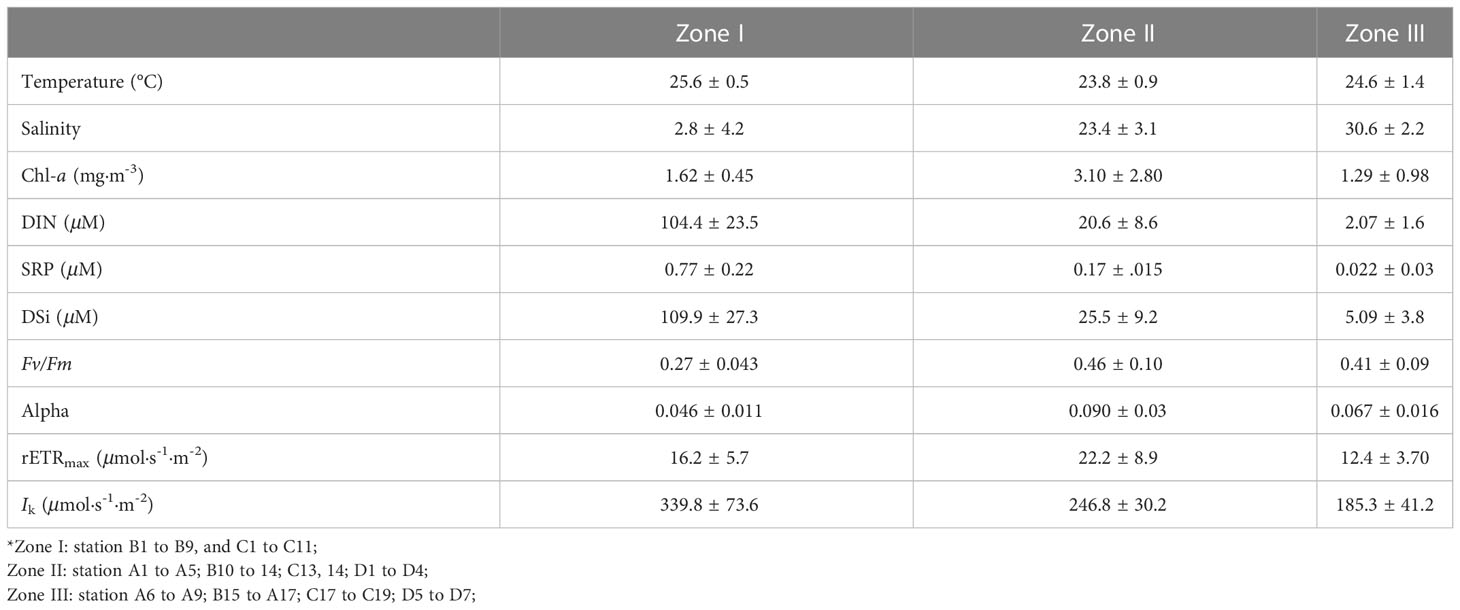
Table 1 The mean value and standard deviation of environmental factors, Chl-a concentration, and photosynthetic parameters in three zones of the Changjiang River Estuary divided by the sediment and plume fronts (as defined by Li et al., 2021).
Surface water temperature was higher in both the upper river mouth (Zone I) and the southern part of the oceanic zone (Zone III). The water temperature in Zone II between the two fronts was up to ~1-2°C lower than either Zone I or Zone III (Figure 2; Table 1). The turbidity was the highest in the estuarine region (Zone I) and formed a sharp front as it extended out to sea (Figure 2). The AOU was the highest near the river mouth in the sediment font area and also high near the Zhoushan Islands (up to 117 μmol/kg). Negative AOU (-76.8 μmol/kg) values were observed in Zone II (Figure 2), where Chl-a concentration reached its peak (8.9 mg/m3, Figure 2). The high Chl-a areas (> 4 mg/m3) were located in the Zone II. The Chl-a concentration increased from 1.62 ± 0.45 mg/m3 in Zone I to 3.10 ± 2.80 mg/m3 in Zone II and decreased to 1.29 ± 0.98 mg/m3 seaward in Zone III.
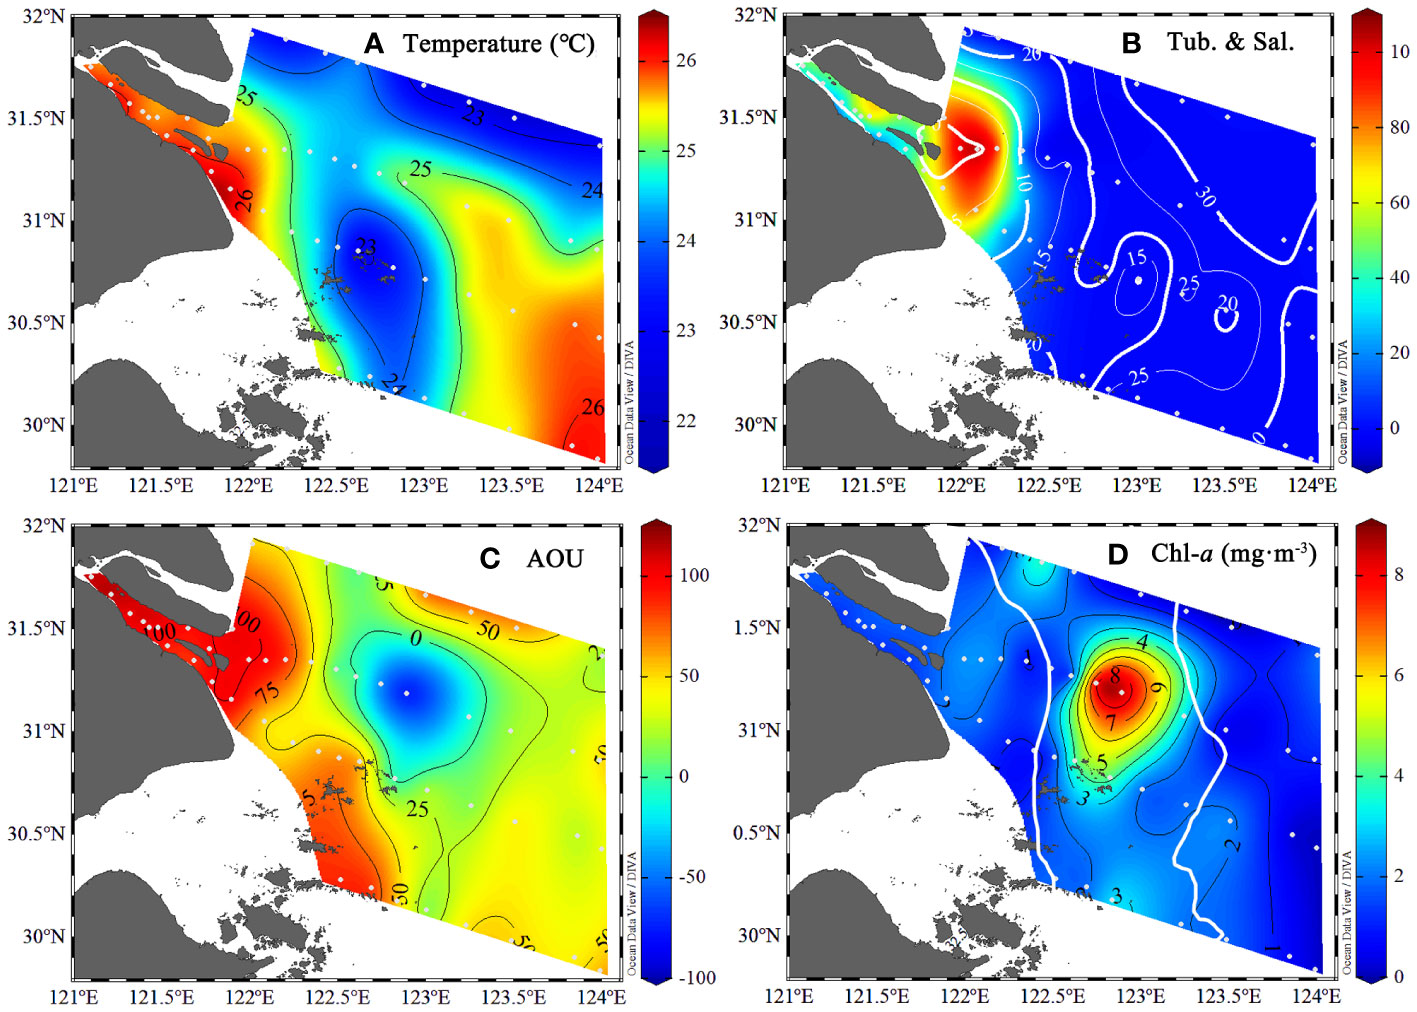
Figure 2 The environmental parameters from the surface water (~3 m) of the Changjiang River Estuary in the summer. (A) water temperature (°C); (B) water turbidity (NTU) with overlaid salinity (solid white line); (C) The derived Apparent Oxygen Utilization (AOU, μmol/kg); (D) The chlorophyll-a concentration (μg/m3) with the location of the sediment and plume fronts (solid white line).
Stratification of the water column is apparent in the transition from Zone I to Zone II, as shown for transect C (Figure 3). In general, the water inside the river mouth was well-mixed. Temperatures were as much as 5°C different between surface and bottom water in the stratified waters, and salinity was substantially higher in deeper waters. Concentrations of DIN decreased from >125 μmol L-1 inshore in Zone I to near detection limits offshore in Zone III (Figure 3). Concentrations of SRP also declined from Zones I to III, initially dropping from >1.0 μmol L-1 in Zone I to 0.25 μmol L-1 in surface waters of Zone II, and finally declining sharply at the nutrient front to nondetectable levels in Zone III (Figure 3). Spatial and depth trends in DSi tracked those of DIN (Figure 3). A peak in Chl-a was observed in the surface waters of Zone II, reaching values >4.5 μg m-3 (Figure 3). Inorganic nutrient ratios (as DIN/SRP and DIN/DSi) were highest in Zones I and surface waters of Zone II, with lowest values offshore in Zone III beyond the plume front (Figures 3H).
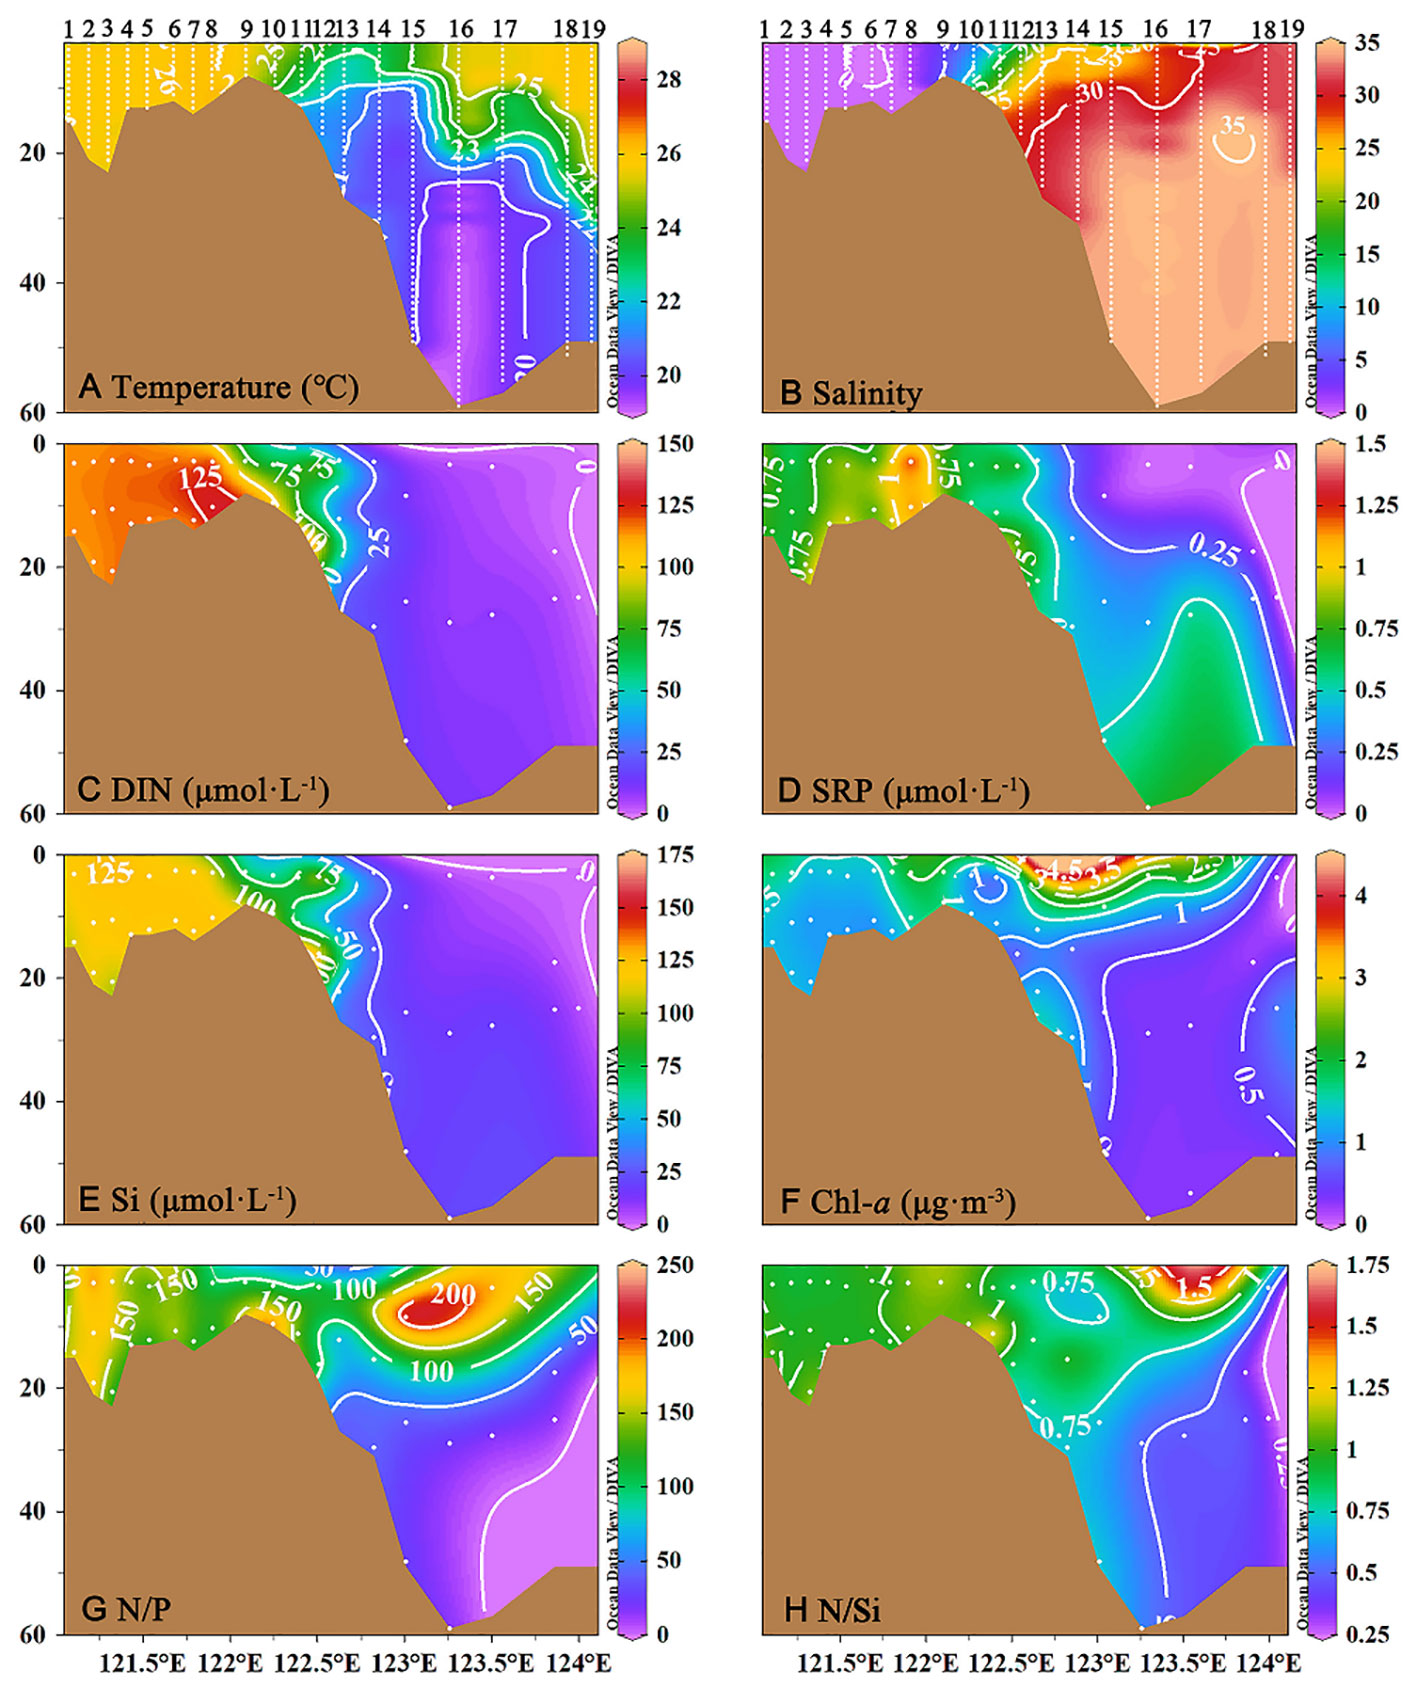
Figure 3 The vertical profiles of (A) temperature (°C), (B) salinity, (C) dissolved inorganic nitrogen (DIN, μmol/L), (D) Soluble reactive phosphorus (SRP, μmol/L), (E) silicate (μmol/L), (F) chlorophyll a (Chl-a, μg/m-3), (G) DIN : SRP ratios (N:P), (H) DIN : Si ratios (N:Si) from transect C in the southern branch of the Changjiang River Estuary and the East China Sea.
3.2 Photosynthetic parameters
In Zone I near the river mouth, the maximum quantum yield (Fv/Fm) was low, with an average value of 0.27 (Figure 4A), and the initial slope of the RLC (α) was also low (0.045 ± 0.011) (Figure 4B). Accordingly, high values of Ik (339.8 ± 73.6 μmol·s-1·m-2) and comparatively low values of rETRmax (~16.2 ± 5.7 μmol·s-1·m2) were also observed in Zone I (Figures 4C, D). In Zone II, values of Fv/Fm were high (0.48-0.62) and the locations of high α values (0.090 ± 0.03) were consistent with the high Fv/Fm, as were high values of rETRmax (22.2 ± 8.9 μmol·s-1·m-2) (Figures 4B, D). In the oceanic water of Zone III, the Fv/Fm decreased to an average of 0.41, but a region of high Fv/Fm (0.53) was also observed in the northeast of the research area. The α value decreased to an average of 0.067 ± 0.016. The rETRmax also decreased to 12.4 ± 3.70 μmol·s-1·m-2 in Zone III.
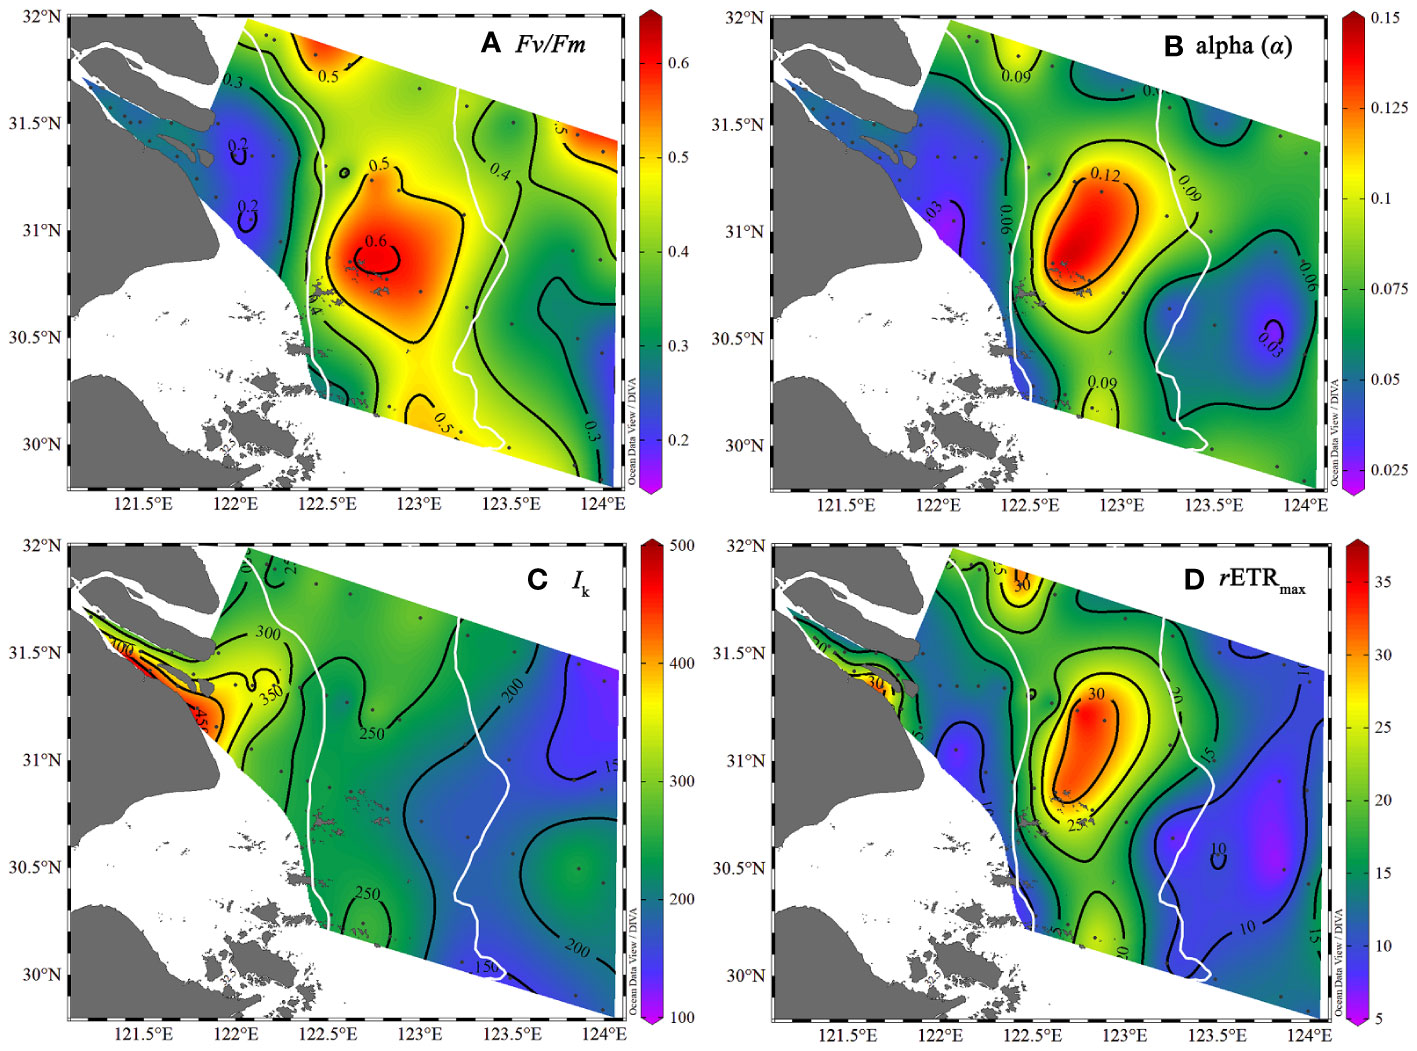
Figure 4 The photosynthetic parameters from the surface water (~3 m) of the Changjiang River Estuary in the summer with the location of the sediment and plume fronts (solid white line). (A) Fv/Fm, (B) alpha, (C) Ik, (D) rETRmax.
The vertical profiles of photosynthetic parameters from transect C reveal variability with depth (Figure 5). In Zone I, all depths were characterized by low Fv/Fm, low α, and high Ik, but there was a small region of relatively high rETRmax (between Station C3 and C6). Highest values of Fv/Fm were observed in the surface waters of Zone II, and remained ~0.5 through much of the water column, while rETRmax in this region declined from a high of >30 μmol·s-1·m-2 in surface waters to ~20 μmol·s-1·m-2 in deeper waters (Figure 5D). In Zone III, the Fv/Fm value was low (~0.3) in the surface, but slightly increased in the subsurface layer. Also in this zone, values of a decreased and those of Ik increased to values comparable to those observed in Zone I (Figures 5C).
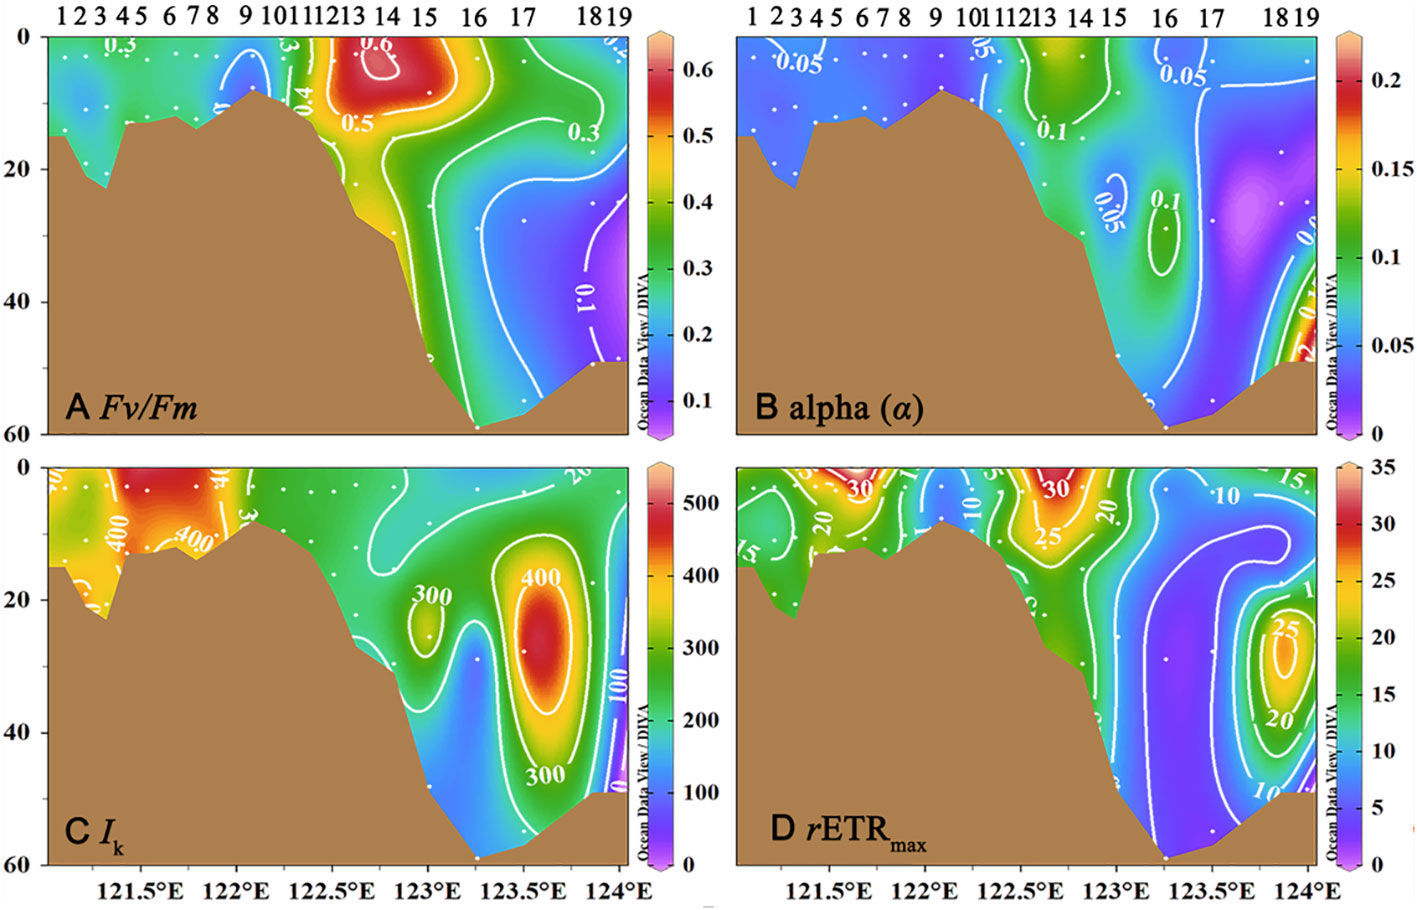
Figure 5 The vertical profile of photosynthetic parameters at transect C in the southern branch of the Changjiang River Estuary and the East China Sea. (A) Fv/Fm; (B) alpha (a); (C) Ik; (D) rETRmax.
3.3 Phytoplankton community composition
The phytoplankton community composition, as determined from transect C, was dominated by diatoms at all stations and zones (Figure 6). The dinoflagellate population was a relative minor component, but did increase from inshore to offshore. Cryptophytes were an important component mainly at freshwater stations C1, C3, and C5. Chlorophytes were only found at station C1 (6.04%), and Cyanobacteria were found at stations C-1 and C-19.
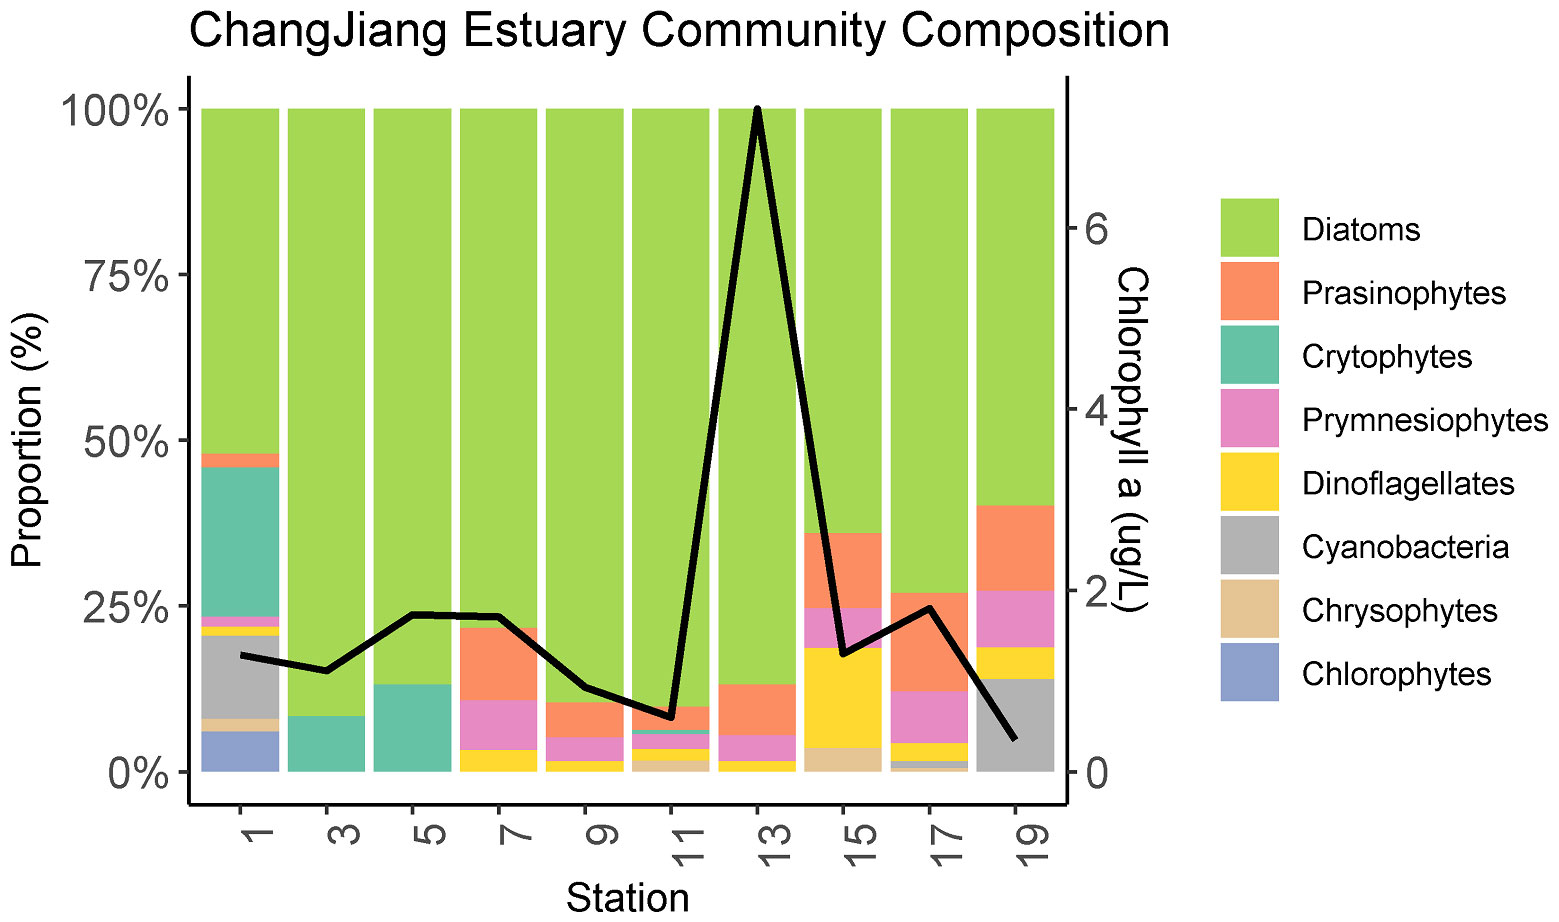
Figure 6 The phytoplankton community composition and Chlorophyll a concentration (solid black line) in the surface water of Changjiang River Estuary in summer along the transect C, according to high-performance liquid chromatography (HPLC) and CHEMTAX analysis. Phytoplankton species include Diatoms, Prasinophytes, Crytophytes, Prymnesiophytes, Dinoflagellates, Cyanobacteria, Chrysophytes, And Chlorophytes.
4 Discussion
4.1 Physical and environmental conditions in the estuary
The environment in the CRE is highly dynamic and exhibits a broad range of nutrient and light conditions and distinct environmental spatial variation along the estuary. A persistent sediment front exists in the CRE near 121.9°E–122.5°E in summer, which was influenced by the mixing caused by salinity intrusion and tidal mixing (Li and Zhang, 1998). The intense mixing and circulation caused by the current and tide from the ocean resuspend the sediment deposited at the bottom to return to the water body with the upwelling near the sediment front outside the river mouth. The Changjiang River plume extended northeastward in the summer is one of the iconic hydrodynamic features of CRE (Chen et al., 2008). The CTD profiles and the relatively low temperature in the CDW area suggested cold bottom water (~20°C) approaching the surface water which was suggested to be the intrusion of the TWC deep water (TWCDW), originating from the Kuroshio subsurface water (Ichikawa and Beardsley, 2002; Zhang et al., 2014). The uplift of TWCDW increased the exchange near the CDW front and enhanced the convergence within the main plume.
Previously, using five years of summer observations in the CRE, Li et al. (2021) showed that summer Chl-a develops in the “sandwich” region between the sediment and the plume fronts. That is, it develops when relieved of light limitation in the nearshore, Zone I, and nutrient limitation offshore, in Zone III. Here, at the stations with high Chl-a concentration (~8 μg/L) in the plume area, the DIN concentration decreased to 25 μmol/L or lower, and the DIP was ~0.3 μmol/L or lower. Estimated by the ratio of Chl-a to C (Chl/C) and the Redfield stoichiometry, such amount of Chl-a only consumed less than 2 μmol-N/L, but may consume ~0.22 μmol-P/L (Zhang et al., 2020). This indicated that biological consumption by phytoplankton only contributed a very small portion of the large N (and Si) lost along the estuary, but may contribute to a significant portion of the P lost. It is suggested that the dilution mostly caused the high DIN and Si lost in the surface water by the low N and Si oceanic water. However, this mixing process brought additional P from the bottom oceanic water to the surface while diluting the N and Si nutrients. Phosphorus is suggested to be the limiting nutrient in this area (Li et al., 2009; Huang et al., 2019). The intrusion of water of TWC and Kuroshio subsurface water near the CRE is characterized as relative P-rich. This supply of P input from the intrusion water partially released the P stress, enhancing phytoplankton growth and primary production in the frontal areas (Shi et al., 2014; Zhou et al., 2019). The mixing process also resulted in relative low N:P ratio (72) at the Chl-a peak at station C13, comparing the high N:P ratio in the upper estuary and the oceanic water. Therefore, phytoplankton cells, dominated by diatoms, meet the relative cold and N:P-balanced water with a consistent N supply from the river, and an extra P supply from the upwelling bottom water. An uplifted thermocline in the summer also increased light availability to the phytoplankton (Zhang et al., 2020). Phytoplankton blooms triggered by coastal upwelling around the CRE have been extensively reported (Wang et al., 2017; Xu et al., 2019). This study revealed the physiological status of the active cells. When favorable environmental conditions enhanced the photosynthetic activities, a bloom developed in the frontal area.
Along the estuary, the Chl-a peaks were observed in the surface water of the plume area between the two fronts, consistent with trends reported by Li et al. (2021). The Chl-a peaks were developed in the stratified water off the sediment front, and declined coincided with nutrient depletion, indicating the balance of light and nutrients between the river water and the oceanic water of the East China Sea. After the surface nutrients were depleted in Zone III, stratification prevented nutrient supply from the bottom water, resulting in low phytoplankton biomass.
4.2 The photosynthetic coefficients in the estuary and environmental stressors
The Fv/Fm is one of the most commonly used fluorescence parameters to assess the physiological status or as an indicator of the stressor (Tan et al., 2019). Here, the phytoplankton assemblages were grouped in stress, transitional, and blooming conditions, based on the value of the Fv/Fm, as low (<0.3), moderate (0.3-0.5), and high (>0.5), respectively. Phytoplankton cells were stressed in Zone I, the high turbidity zone in the estuary, but were not stressed in Zone II, where the Chl-a peak was observed. Then, the phytoplankton cells again were stressed in the oceanic water. Although the phytoplankton may be under stress in different parts of the estuarine, the causes of the stress varied based on the variety of environmental conditions in the estuary.
The extra supply of P from the bottom water partially released the P stress in the Zone II, indicated by the highest Fv/Fm value, and enhanced the phytoplankton growth and primary production in the frontal areas. The favorable environmental condition enhanced photosynthetic activities, and high biomass was developed in the frontal area. The high Fv/Fm value in the middle and bottom layers of stations C12 and C14 indicated that the phytoplankton were relatively healthy and active throughout the water column.
In the Zone III, the surface P was depleted, and stratification prevented P supply from the bottom water. The high N:P ratio suggested P limitation resulted in low Fv/Fm. Cyanobacteria were present at a relatively high proportion in the phytoplankton community at station C19. Small-size cyanobacteria (e.g., picocyanobacteria) can adapt to the oligotrophic water with greater efficiency to utilize nutrients with a relatively low Fv/Fm (Hirata et al., 2011; Hodoki et al., 2011), and are known to be abundant in the oligotrophic water off the ECS (Xu et al., 2019). In offshore water, high light irradiance and UV radiation may also damage the PS II system and reduce the photosynthetic activities’ performance. The Chl-a maximum was located in the subsurface layer to avoid photoinhibition and balance the availability of light and P in the deeper water.
5 Conclusion
This study provided a spatial perspective of the phytoplankton photosynthetic physiology along the salinity gradient of the CRE. There was also a good agreement between the physiological status and phytoplankton biomass accumulated at the different sections of the CRE, adding further understanding of the relationships between suspended sediment and nutrients and phytoplankton biomass accumulation. The photosynthetic efficiency (Fv/Fm) ranged from low to moderate in the turbid upper estuary before the sediment front, highest between the sediment and plume front, and low in the nutrient limiting ocean water, respectively. In the estuary, the photosynthetically inactive cells were under stress from light, nutrients, salinity, resuspension particles, the decline of blooms, and high turbulence. The P supply from the offshore high-phosphate bottom water is critical to active the phytoplankton cells and stimulate the blooms in the front area of the CDW, which supports the primary production in this area.
Data availability statement
The raw data supporting the conclusions of this article will be made available by the authors, without undue reservation.
Author contributions
JL: conceptualization, design of the work, writing original draft. YG: design of the work, analysis, interpretation of data for the work, review, editing, and funding acquisition. YB: carrying out the experiment, sample preparation, and; interpretation of the results XG: writing original draft, visualization, interpretation of the results. PG: substantial contributions of review and revision of the manuscript. All authors contributed to the article and approved the submitted version.
Funding
This study is supported by National Natural Science Foundation of China (Grant No. 4160060782 to YG), Shanghai Jiao Tong University foundation of prospective study, and Shanghai Frontiers Science Center of Polar Science (SCOPS). Data and sample were collected onboard of R/V Runjiang implementing the open research cruise supported by NSFC Ship-time Sharing Project.
Acknowledgments
We would like to thank Jianzhong Ge and some other colleagues for their remarkable advice. We are also deeply grateful to all reviewers for their valuable comments and discussions.
Conflict of interest
The authors declare that the research was conducted in the absence of any commercial or financial relationships that could be construed as a potential conflict of interest.
Publisher’s note
All claims expressed in this article are solely those of the authors and do not necessarily represent those of their affiliated organizations, or those of the publisher, the editors and the reviewers. Any product that may be evaluated in this article, or claim that may be made by its manufacturer, is not guaranteed or endorsed by the publisher.
References
Chen C., Xue P., Ding P., Beardsley R. C., Xu Q., Mao X., et al. (2008). Physical mechanisms for the offshore detachment of the changjiang diluted water in the East China Sea. J. Geophysical Research-Oceans 113, 1–17. doi: 10.1029/2006jc003994
Dai S. B., Lu X. X. (2014). Sediment load change in the Yangtze river (Changjiang): A review. Geomorphology 215, 60–73. doi: 10.1016/j.geomorph.2013.05.027
Fang F.-T., Zhu Z.-Y., Ge J.-Z., Deng B., Du J.-Z., Zhang J. (2022). Reconstruction of the main phytoplankton population off the changjiang estuary in the East China Sea and its assemblage shift in recent decades: From observations to simulation. Mar. pollut. Bull. 178, 1–11. doi: 10.1016/j.marpolbul.2022.113638
Gao Y., Jiang Z., Chen Y., Liu J., Zhu Y., Liu X., et al. (2022). Spatial variability of phytoplankton and environmental drivers in the turbid sanmen bay (East China Sea). Estuaries Coasts 45, 2519–2533. doi: 10.1007/s12237-022-01104-7
Ge J., Torres R., Chen C., Liu J., Xu Y., Bellerby R., et al. (2020). Influence of suspended sediment front on nutrients and phytoplankton dynamics off the changjiang estuary: A FVCOM-ERSEM coupled model experiment. J. Mar. Syst. 204, 1–19. doi: 10.1016/j.jmarsys.2019.103292
Gong G. C., Wen Y. H., Wang B. W., Liu G. J. (2003). Seasonal variation of chlorophyll a concentration, primary production and environmental conditions in the subtropical East China Sea. Deep-Sea Res. Part Ii-Topical Stud. Oceanography 50, 1219–1236. doi: 10.1016/s0967-0645(03)00019-5
Hirata T., Hardman-Mountford N. J., Brewin R. J. W., Aiken J., Barlow R., Suzuki K., et al. (2011). Synoptic relationships between surface chlorophyll-a and diagnostic pigments specific to phytoplankton functional types. Biogeosciences 8, 311–327. doi: 10.5194/bg-8-311-2011
Hodoki Y., Ohbayashi K., Kobayashi Y., Okuda N., Nakano S.-I. (2011). Temporal variation in cyanobacteria species composition and photosynthetic activity in experimentally induced blooms. J. Plankton Res. 33, 1410–1416. doi: 10.1093/plankt/fbr040
Huang T.-H., Chen C.-T. A., Lee J., Wu C.-R., Wang Y.-L., Bai Y., et al. (2019). East China Sea Increasingly gains limiting nutrient p from south China Sea. Sci. Rep. 9, 1–10. doi: 10.1038/s41598-019-42020-4
Ichikawa H., Beardsley R. C. (2002). The current system in the yellow and East China seas. J. Oceanography 58, 77–92. doi: 10.1023/a:1015876701363
Li J. F., Zhang C. (1998). Sediment resuspension and implications for turbidity maximum in the changjiang estuary. Mar. Geology 148, 117–124. doi: 10.1016/s0025-3227(98)00003-6
Li J., Glibert P. M., Zhou M., Lu S., Lu D. (2009). Relationships between nitrogen and phosphorus forms and ratios and the development of dinoflagellate blooms in the East China Sea. Mar. Ecol. Prog. Ser. 383, 11–26. doi: 10.3354/meps07975
Li W., Ge J., Ding P., Ma J., Glibert P. M., Liu D. (2021). Effects of dual fronts on the spatial pattern of chlorophyll-a concentrations in and off the changjiang river estuary. Estuaries Coasts 44, 1408–1418. doi: 10.1007/s12237-020-00893-z
Luan H. L., Ding P. X., Wang Z. B., Ge J. Z., Yang S. L. (2016). Decadal morphological evolution of the Yangtze estuary in response to river input changes and estuarine engineering projects. Geomorphology 265, 12–23. doi: 10.1016/j.geomorph.2016.04.022
Mackey M. D., Mackey D. J., Higgins H. W., Wright S. W. (1996). CHEMTAX - a program for estimating class abundances from chemical markers: Application to HPLC measurements of phytoplankton. Mar. Ecology-Progress Ser. 144, 265–283. doi: 10.3354/meps144265
Marshall H. L., Geider R. J., Flynn K. J. (2000). A mechanistic model of photoinhibition. New Phytol. 145, 347–359. doi: 10.1046/j.1469-8137.2000.00575.x
Parkhill J. P., Maillet G., Cullen J. J. (2001). Fluorescence-based maximal quantum yield for PSII as a diagnostic of nutrient stress. J. Phycology 37, 517–529. doi: 10.1046/j.1529-8817.2001.037004517.x
Qi J., Yin B., Zhang Q., Yang D., Xu Z. (2014). Analysis of seasonal variation of water masses in East China Sea. Chin. J. Oceanology Limnology 32, 958–971. doi: 10.1007/s00343-014-3269-1
Ralph P. J., Gademann R. (2005). Rapid light curves: A powerful tool to assess photosynthetic activity. Aquat. Bot. 82, 222–237. doi: 10.1016/j.aquabot.2005.02.006
Shi X., Li H., Wang H. (2014). Nutrient structure of the Taiwan warm current and estimation of vertical nutrient fluxes in upwelling areas in the East China Sea in summer. J. Ocean Univ. China 13, 613–620. doi: 10.1007/s11802-014-2481-0
State Bureau of Quality and Technical Supervision of China (2007). National standard of China for the specification for marine monitoring GB 17378.5-2007 (Beijing: Standards Press of China).
Tan L., Xu W., He X., Wang J. (2019). The feasibility of Fv/Fm on judging nutrient limitation of marine algae through indoor simulation and in situ experiment. Estuar. Coast. Shelf Sci. 229, 1–8. doi: 10.1016/j.ecss.2019.106411
Van Heukelem L., Thomas C. S. (2001). Computer-assisted high-performance liquid chromatography method development with applications to the isolation and analysis of phytoplankton pigments. J. Chromatogr. A 910, 31–49. doi: 10.1016/s0378-4347(00)00603-4
Wang H., Dai M., Liu J., Kao S.-J., Zhang C., Cai W.-J., et al. (2016). Eutrophication-driven hypoxia in the East China Sea off the changjiang estuary. Environ. Sci. Technol. 50, 2255–2263. doi: 10.1021/acs.est.5b06211
Wang K., Chen J., Ni X., Zeng D., Li D., Jin H., et al. (2017). Real-time monitoring of nutrients in the changjiang estuary reveals short-term nutrient-algal bloom dynamics. J. Geophysical Research-Oceans 122, 5390–5403. doi: 10.1002/2016jc012450
Wang Y., Liu D., Xiao W., Zhou P., Tian C., Zhang C., et al. (2021). Coastal eutrophication in China: Trend, sources, and ecological effects. Harmful Algae. 107, 1–13. doi: 10.1016/j.hal.2021.102058
Wu T., Wu H. (2018). Tidal mixing sustains a bottom-trapped river plume and buoyant coastal current on an energetic continental shelf. J. Geophysical Research-Oceans 123, 8026–8051. doi: 10.1029/2018jc014105
Xu Q., Sukigara C., Goes J. I., Gomes H. D. R., Zhu Y., Wang S., et al. (2019). Interannual changes in summer phytoplankton community composition in relation to water mass variability in the East China Sea. J. Oceanography 75, 61–79. doi: 10.1007/s10872-018-0484-y
Zhang J., Liu C. L. (2002). Riverine composition and estuarine geochemistry of particulate metals in China - weathering features, anthropogenic impact and chemical fluxes. Estuar. Coast. Shelf Sci. 54, 1051–1070. doi: 10.1006/ecss.2001.0879
Zhang J., Liu S. M., Ren J. L., Wu Y., Zhang G. L. (2007). Nutrient gradients from the eutrophic changjiang (Yangtze river) estuary to the oligotrophic kuroshio waters and re-evaluation of budgets for the East China Sea shelf. Prog. Oceanography 74, 449–478. doi: 10.1016/j.pocean.2007.04.019
Zhang Q., Liu H., Qin S., Yang D., Liu Z. (2014). The study on seasonal characteristics of water masses in the western East China Sea shelf area. Acta Oceanologica Sin. 33 (11), 64–74. doi: 10.1007/s13131-014-0556-9
Zhang Z., Zhou M., Zhong Y., Zhang G., Jiang S., Gao Y., et al. (2020). Spatial variations of phytoplankton biomass controlled by river plume dynamics over the lower changjiang estuary and adjacent shelf based on high-resolution observations. Front. Mar. Sci. 7. doi: 10.3389/fmars.2020.587539
Zhou M.-J., Shen Z.-L., Yu R.-C. (2008). Responses of a coastal phytoplankton community to increased nutrient input from the changjiang (Yangtze) river. Continental Shelf Res. 28, 1483–1489. doi: 10.1016/j.csr.2007.02.009
Zhou Z.-X., Yu R.-C., Sun C., Feng M., Zhou M.-J. (2019). Impacts of changjiang river discharge and kuroshio intrusion on the diatom and dinoflagellate blooms in the East China Sea. J. Geophysical Research-Oceans 124, 5244–5257. doi: 10.1029/2019jc015158
Zhou Z.-X., Yu R.-C., Zhou M.-J. (2022). Evolution of harmful algal blooms in the East China Sea under eutrophication and warming scenarios. Water Res. 221, 118807–118807. doi: 10.1016/j.watres.2022.118807
Keywords: Changjiang River Estuary, phytoplankton, photosynthetic characteristics, physical process, light limitation, nutrient limitation, Fv/Fm, fluorescence
Citation: Li J, Gao Y, Bao Y, Gao X and Glibert PM (2023) Summer phytoplankton photosynthetic characteristics in the Changjiang River Estuary and the adjacent East China Sea. Front. Mar. Sci. 10:1111557. doi: 10.3389/fmars.2023.1111557
Received: 29 November 2022; Accepted: 30 January 2023;
Published: 17 March 2023.
Edited by:
Chung-Chi Chen, National Taiwan Normal University, TaiwanReviewed by:
Wei-Jen Huang, National Sun Yat-sen University, TaiwanChunlei Fan, Morgan State University, United States
Copyright © 2023 Li, Gao, Bao, Gao and Glibert. This is an open-access article distributed under the terms of the Creative Commons Attribution License (CC BY). The use, distribution or reproduction in other forums is permitted, provided the original author(s) and the copyright owner(s) are credited and that the original publication in this journal is cited, in accordance with accepted academic practice. No use, distribution or reproduction is permitted which does not comply with these terms.
*Correspondence: Yonghui Gao, ygao80@sjtu.edu.cn