The morphodynamic response of a gravel barrier to unimodal and bimodal storm wave conditions
 Kristian Ions
 Khan Ozdemir1
  D. E. Reeve
 Harshinie Karunarathna
- 1Energy and Environment Research Group, Faculty of Science and Engineering, Swansea University, Swansea, United Kingdom
- 2JBA Consulting, Edinburgh, Scotland, United Kingdom
Gravel barrier beaches can offer natural protection to coastlines from adverse storm conditions. Understanding the morphodynamics of gravel barrier beaches is vital for the effective and sustainable management of these systems. Here, we use a synthetic dataset to investigate the morphodynamic response of the gravel barrier beach at Hurst Castle Spit, located on the Southwest coast of the United Kingdom, to both unimodal and bimodal storms. This spit is exposed to wind and swell waves propagating up the English Channel from the Southwest approaches and has suffered repeated storm erosion. The results are analyzed to identify the key drivers that govern the spatio-temporal gravel barrier morphodynamic responses to storms and to explore the morphodynamic states of the barrier. We found that the morphodynamic response of the barrier beach is strongly influenced by the combination of storm wave height and still water level. Further, the presence of swell waves can be a controlling factor in the barrier response.
1 Introduction and background
Gravel barrier beaches are dynamic coastal systems which form the boundary between the sea and land in open coasts and estuaries. They occur in many mid- and high-latitude locations worldwide (United Kingdom, USA, New Zealand, Japan) and offer shelter to low-lying lands, habitats and coastal communities (Carter and Orford, 1993). During storms, gravel barrier systems can undergo far-reaching morphodynamic changes ranging from erosion of the barrier foreshore to breaching, complete inundation and rollback, affecting the adjacent hinterland (Bradbury and Powell, 1992; Sallenger, 2000). The combination of restricted sediment supply, increasing storm frequency, and climate change-induced sea level rise, means that gravel barriers are becoming increasingly threatened (Vitousek et al., 2017; Pollard et al., 2022). Therefore, insights into the morphodynamic responses of gravel barrier beaches to storms are vital for developing sustainable strategies for their maintenance.
Gravel and sand beaches behave differently to each other, (Buscombe and Masselink, 2006). Gravel beaches have steep faces, typically of the order of 1:5 slope, due to the large sediment size leading to a larger angle of repose, (Reeve et al., 2018). According to the Udden-Wentworth classification scheme ‘gravel’ sediment ranges from 2 mm to 60 mm. The steeper beach face makes them reflective beaches in contrast to dissipative sandy beaches (Austin and Masselink, 2006). On gravel beaches the reflective shore face causes the incoming waves break closer to the shoreline, thus forming a narrow surf zone in front of the beach. The short-term morphodynamic response of gravel barrier beaches is controlled by the local wave climate, astronomical tidal variations, storm surges, barrier pre-storm geometry and material properties.
Previous studies have investigated the morphodynamic characteristics of gravel barrier beaches, their relationship to prevailing hydrodynamic conditions, and attempts have been made to predict their morphodynamic change. Orford and Carter (1982) investigated distinct sediment transport characteristics and morphodynamic regime shifts of a gravel beach in Ireland and their relationship with incoming waves. Although this study was limited only to one gravel beach, they concluded that the antecedent state of the barrier influenced overtopping and overwashing, sometimes offering some protection to the upper beach. Powell (1990) examined the morphodynamic behavior of gravel beaches using an extensive set of laboratory flume tests and developed an empirical relationship to predict wave run-up and beach profile change. He concluded that incident wave parameters and beach sediment characteristics dominate the beach morphodynamic change. He also concluded that the antecedent beach state does not influence beach change, in contrast to Orford and Carter (1982), Obhrai et al. (2009) extended Powell (1990) laboratory measurements to investigate the failure mechanisms of gravel beaches. They concluded that wave and barrier characteristics, including wave steepness, freeboard, barrier geometry, sediment volume, and barrier permeability are key factors that determine barrier morphodynamic responses, which is in agreement with previous studies. Polidoro et al. (2018) have conducted a detailed laboratory investigation on the impacts of bimodal storms on gravel beaches, revealing that increased swell component in the incident wave spectrum results in greater run-up and, therefore greater sediment transport up the beach face. Based on this study, a new parametric model was proposed, applicable when there is no overwashing, which can be used to determine morphodynamic changes of gravel barriers when responding to bimodal seas.
In a sequence of papers Orford and Carter (1982) and Carter and Orford (1993) and Orford et al. (1995) identified five distinct gravel barrier beach responses: barrier face erosion; crest build up-due to overtopping and sediment deposition on the barrier crest; crest lowering-due to overwashing and consequent sediment deposition at the back of the barrier; crest rollback due to overwashing events; and crest breaching due to inundation of barrier.
Carter and Orford (1993) and Orford et al. (1995), proposed a catalogue of gravel beach morphological states or regimes, subsequently modified by Sallenger (2000), McCall et al. (2015) and Orford and Anthony (2011). In order of increasing severity of impact these are:
(i) The swash regime - berm formation in the upper beach, where wave run-up is confined solely to the barrier foreshore and does not impact the crest of the barrier; (ii) The collision regime, where beach face erosion occurs due to wave run-up exceeding the foreshore but not exceeding the barrier crest level; (iii) swash overtopping, when run-up is sufficiently large to overtop the barrier crest. The sediment can be deposited on the top of the barrier, or small sediment volumes can be deposited behind the barrier as the run-up decelerates due to infiltration and bed friction; (iv) discrete overwashing resulting in crest lowering. When run-up exceeds the maximum crest level and has sufficient velocity, waves can overtop the barrier, carrying sediment landward; (v) sluicing overwashing where the top of the barrier is completely removed due to the combination of significant wave run-up and high still water level (SWL); and (vi) catastrophic overwashing or inundation regime- occurs when the SWL is almost equal to or higher than the crest height of the barrier. Crest roll-over and landward migration of the barrier can occur. Breaching is also very common during this regime. The underlying conceptual model of gravel beach evolution is that changes in physical conditions can cause the beach to switch from one regime to another.
For sediment overwashing to occur, two criteria must be satisfied; the maximum wave run-up height should exceed the barrier crest height; and the bed velocity must exceed the threshold of sediment motion.
Bradbury and Powell (1992) combined laboratory investigations of Powell (1990) and field measurements at the Hurst Castle Spit (HCS) barrier beach located in the south-west of the United Kingdom (UK) and defined threshold hydrodynamic conditions leading to different morphodynamic responses. They concluded that HCS barrier is very sensitive to minor changes in freeboard and incident wave conditions. They also found that the barrier crest width is an important parameter when determining barrier response to wave action. Although this conclusion is primarily associated with HCS, it is in line with the previous findings of Carter and Orford (1981), Powell (1990) and Sallenger (2000). Bradbury (2000) examined the relationship between barrier geometry and hydraulic conditions at HCS and developed an empirical framework to predict gravel barrier morphodynamic responses. Several others (e.g., Van Hijum and Pilarczyk, 1982; Sallenger, 2000; Lorang, 2002; Stockdon et al., 2006) have developed empirical models for predicting overtopping and cross-shore change of barrier beaches. However, those were developed for sandy barriers, which have been found to underperform for gravel beaches (Poate et al., 2016). Suanez et al. (2022) used high-frequency beach surveys at Sillon de Talbert beach in France to test the empirical barrier evolution model of Orford and Carter (1982). They concluded that although Orford and Carter (1982) model is generally successful in reproducing the barrier morphodynamic evolution, wave energy flux should be considered as an additional parameter to improve the model.
More recently, Polidoro et al. (2014), Almeida et al. (2017), and McCall et al. (2015), have investigated run-up and overwashing of gravel barriers using numerical models. Those studies have been limited to consideration of the hydrodynamics without further analysing the amount of sediment transport and also by the short duration of the simulations.
Pollard et al. (2022) recently studied several key morphological parameters and how they govern gravel barriers’ response to storm surges and rising sea levels. However, this study did not extend to bimodal wave conditions, a common occurrence in many coastal sites around the UK and elsewhere (Thompson et al., 2018; Vettor and Soares, 2020). Thompson et al. (2018) reports that bimodal storms, where bimodal storms are twin-peaked frequency wave spectrums, can increase the risk of coastal overtopping when compared to their unimodal counterparts comprising only of wind waves. Studies that have reported on the impact of bimodal seas on gravel barrier morphodynamic such as Almeida et al. (2017) found that bimodal waves increased the likelihood of overwashing however this was not related to the modes (or regimes) of barrier response.
The advancement of process-based computational coastal hydro-morphodynamic models of gravel beaches (e.g., Jamal et al., 2014; McCall et al., 2014) provides a new opportunity to investigate the storm response of gravel barriers, and to probe the limitations inherent in experimental and field-based studies. XBeach-G is an open-source code based on solving the non-hydrostatic, depth-averaged equations of motion for flow, (McCall et al., 2014). These are linked to equations describing the continuity of mass (of beach material) through empirically-derived sediment transport and deposition formulae. It can simulate the movement of material by waves and tides as well as the feedback of changes in beach morphology on wave transformations. McCall et al. (2015) used XBeach-G to simulate gravel barrier response to storms. They showed that a well-validated numerical model could be a useful tool to overcome the limitations of empirical models and predict wave overtopping and the morphodynamic response of gravel beaches to storms. Subsequently, there have been further studies investigating specific features of gravel beach responses to storms using computational modelling, (Masselink et al., 2014; Williams et al., 2015; Bergillos et al., 2016; Bergillos et al., 2017; Brown et al., 2019; Phillips et al., 2020). More recently, Ions et al. (2021) used XBeach-G to develop generalised relationships to predict changes in gravel beach morphology. These have all displayed good accuracy in comparison with experimental measurements.
The majority of these previous gravel barrier response studies have focused on unimodal conditions. Secondly, although the previous empirical and numerical modelling studies contributed to the understanding and predicting gravel barrier morphodynamics, their validity is limited beyond the conditions used to derive them or the conditions used in simulations. Lastly the impact of bimodal storms on gravel barrier beach response regimes still needs greater exploration, especially linking bimodal impact to the morphodynamic response of a gravel barrier.
This research significantly extends the work presented in Ions et al. (2021) and utilises a comprehensive, synthetically generated dataset using the numerical model XBeach-G. Using a gravel barrier beach located in the United Kingdom, we investigate and compare the impacts of unimodal and bimodal storms on a gravel barrier morphodynamics. The different barrier response regimes are then linked to key hydrodynamics, including swell fraction and antecedent barrier profile conditions.
2 Field site
Our study site is the Hurst Castle Spit, (HCS), located in Christchurch Bay on the Southwest coast of the UK (Figure 1). HCS, is a hook-shaped gravel barrier which extends from West Solent towards Isle of White (Figure 1). HCS is 2.25 km long, with an orientation facing towards the southeast, (130° N). The mean crest height of the barrier varies between 3 – 7 mODN from east to west and has a mean foreshore slope, above the 0 mODN mark of 8°. HCS was chosen in this study due to its historic overtopping and breaching events that occurred during the past 200 years and the availability of extensive bathymetric and topographic measurements carried out by the Channel Coastal Observatory of the UK (CCO). HCS forms a barrier to protect an area of extensive low-lying land, including saltmarshes and mudflats; three international nature conservation sites; a Site of Special Scientific Interest (SSSI); key transportation links and protect the Western Solent from storm waves. HCS is regularly eroded and frequently overtopped/overwashed during storms, threatening its stability and integrity.
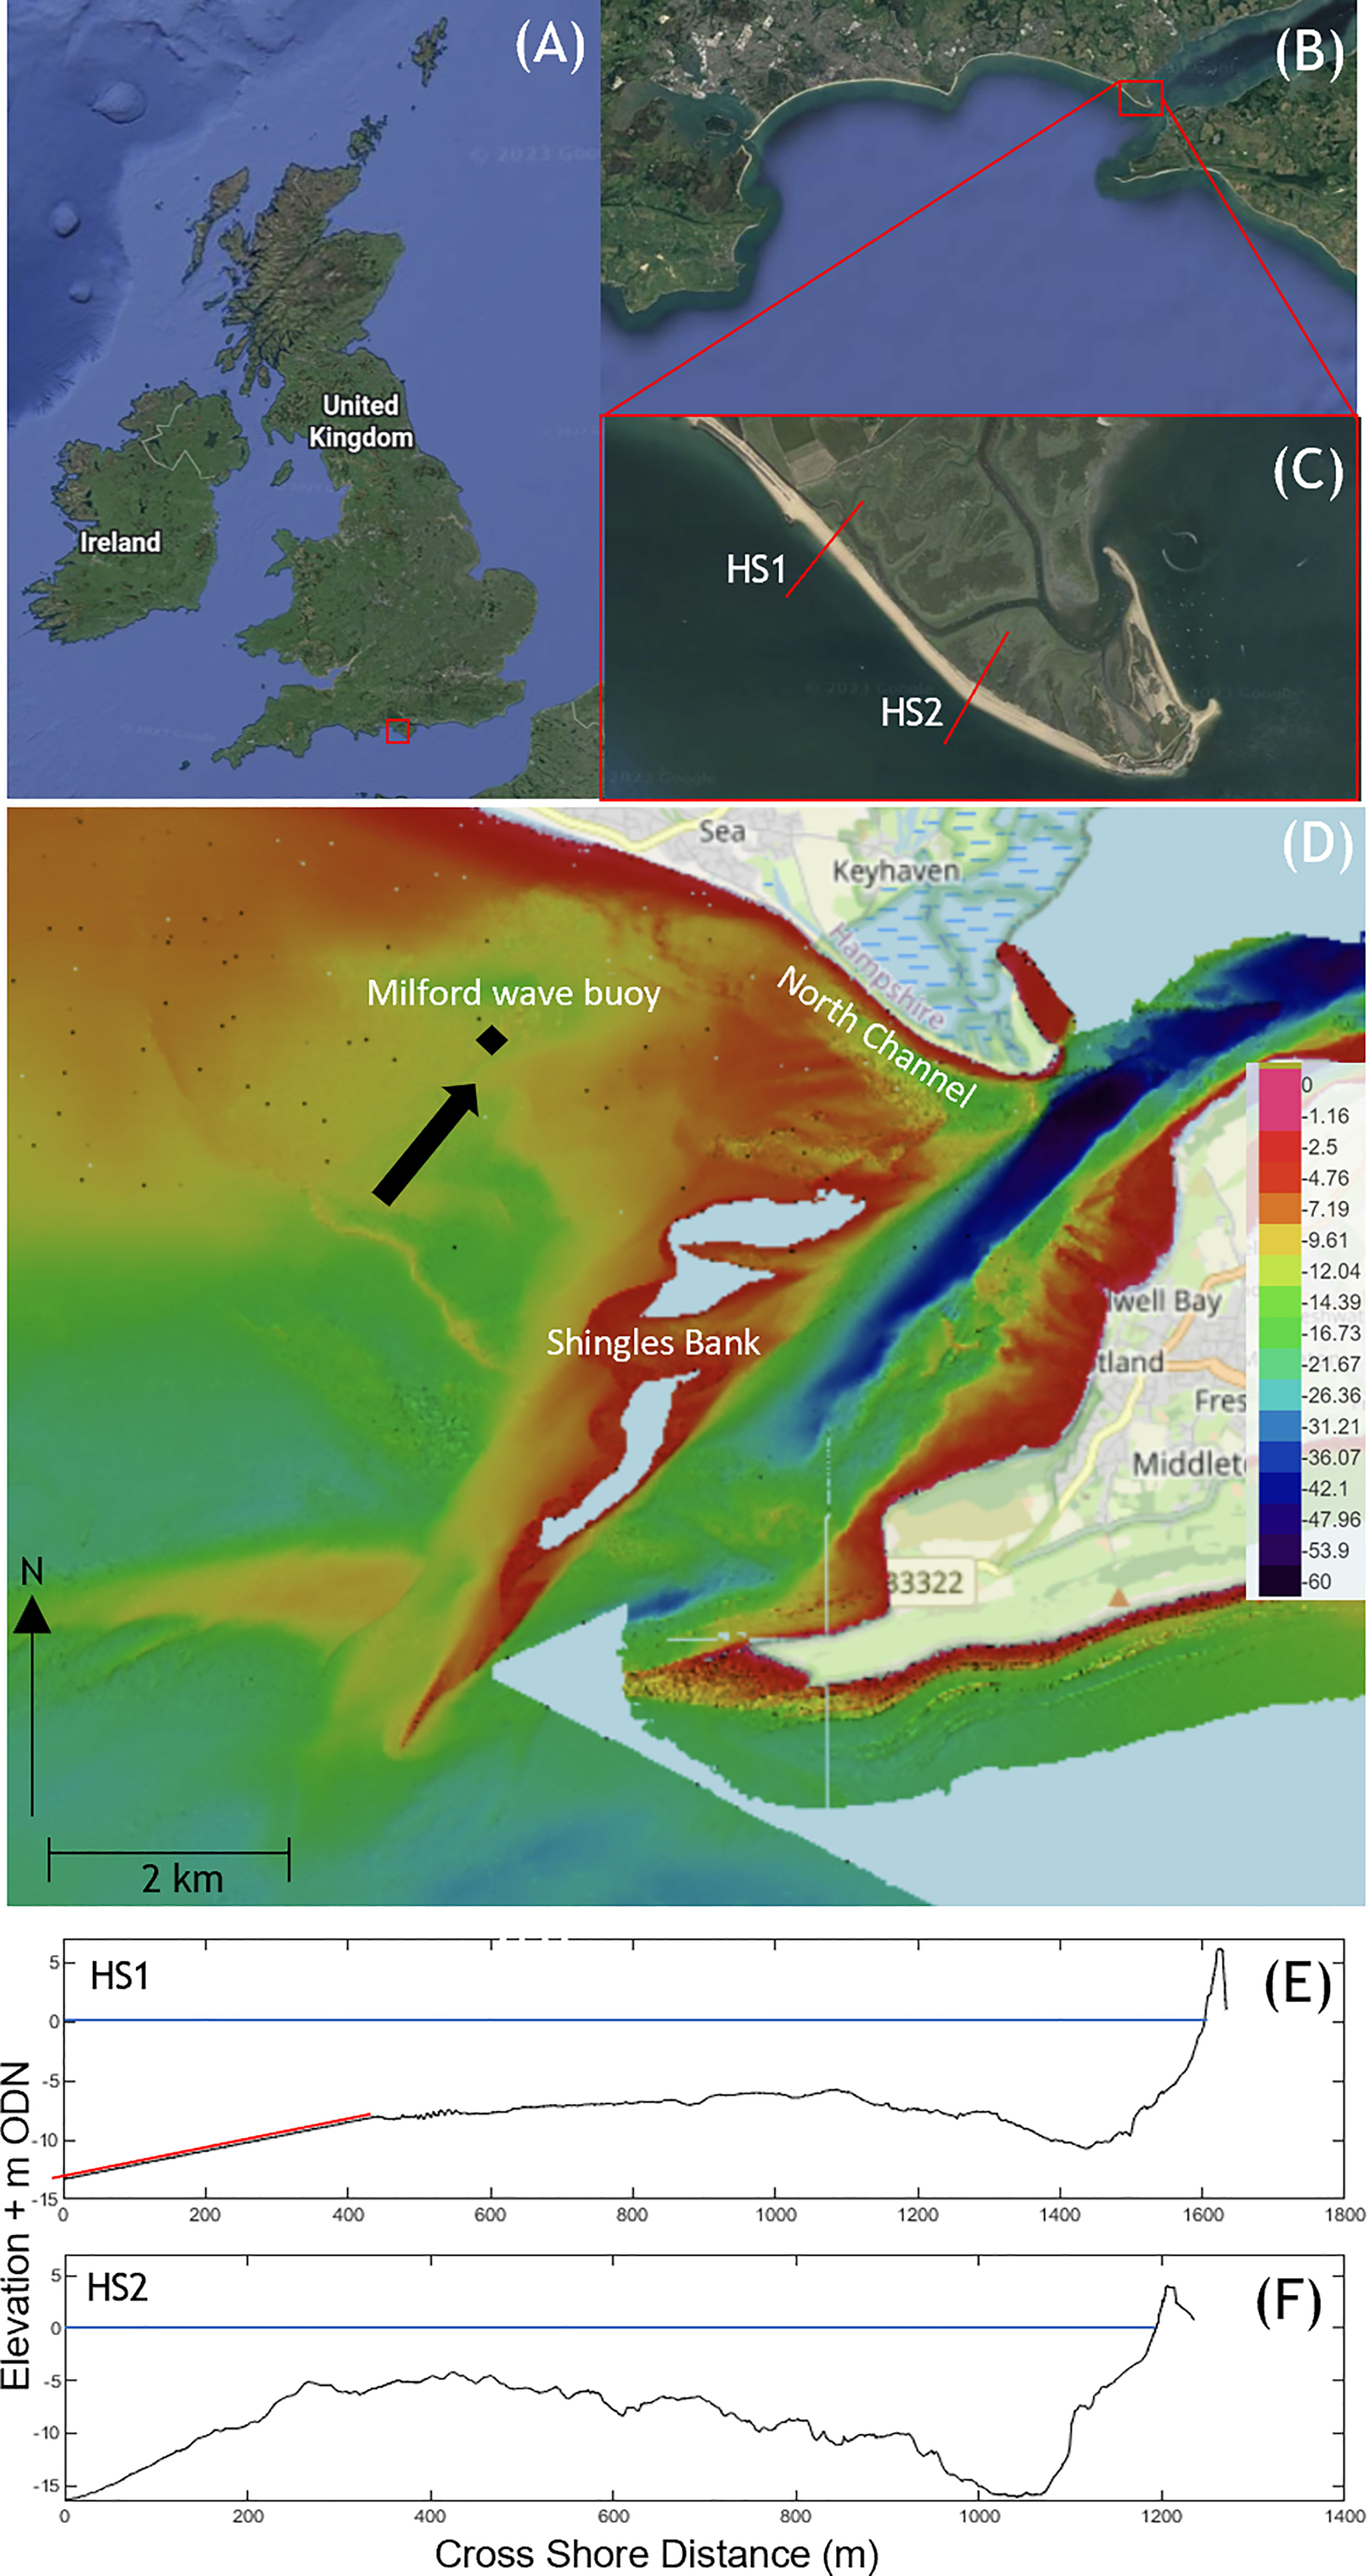
Figure 1 Location in the UK; (A), Christchurch Bay; (B) Hurst Castle Spit (C) Arial view of Hurst Castle Spit (Google Earth) with profiles HS1 and HS2 used for calibration marked in red; (D) Seabed bathymetry surrounding Hurst Spit, white area on shingles bank indicates no measurement data available (courtesy of the Channel Coastal Observatory). Black arrow indicated mean wave approach direction; (E) Cross-shore profile for HCS1, where red line indicates synthetic bathymetry and (F) Cross-shore profile for HCS2. Blue line in (E, F) represents the SWL.
Tides in Christchurch Bay are meso-tidal with a mean spring tidal range of 2.2 m. The barrier is primarily shingle in composition with the median sediment diameter, D50, of 15 mm and D90 of 45 mm (Bradbury and Powell, 1992; Bradbury and Kidd, 1998). The seabed bathymetry offshore of the barrier is complex, with the North Channel running parallel to the beach, allowing incoming waves to propagate very close to the shoreline. Perpendicular to the barrier behind the North Channel is the Shingle Bank which protrudes from the water during spring low tides. The Shingle Bank provides some shelter to the barrier by dissipating wave energy during lower tides (Figure 1). Wave shoaling and breaking (at low water) induced by the complex bathymetry of the banks and channels seawards of the spit reduces the height of off-shore waves by almost one-third (Bradbury and Kidd, 1998).
The south-west coast of the UK is subjected to frequent storms. Waves have been measured by Milford wave buoy (MWB) (50_42075 N, 01_36091 W) located to the west of the HCS at a depth of 8 mODN (https://coastalmonitoring.org/realtimedata/?chart=73) (Figure 1) since 1996 by the CCO. The historic wave records from the Milford wave buoy suggest that the annual average significant wave height (Hs), average peak wave period (Tp) and average wave direction (θ) are 0.65 m, 8.2 s and 211°, respectively. A numerical study of nearshore wave transformation by Bradbury and Kidd (1998) found that the maximum Hs and predominant wave direction vary between 3.57 m (240°) at the eastern end and 2.89 m (210°) at the western end of the spit. They found that the mean of the maximum Hs declines along the spit from east to west due to wave attenuation on the Shingle and North Head Banks.
Bradbury et al. (2007) found that bimodal wave conditions can occur at this site for over 25% of the time during winter, when storms are frequent and severe. Thompson et al. (2018) reported that bimodal storms during the 2013/2014 winter storms in UK induce more significant beach erosion and damage than their unimodal counterparts at certain occasions, which was also observed by Ions et al. (2021).
HCS was initially formed by lose shingle transported from the surrounding cliff faces of Christchurch Bay (Nicholls and Webber, 1987). Sediment supply to HCS has declined due to decreased littoral drift (Nicholls and Webber, 1987) since the 20th-century coastal defences were constructed from Bournemouth through to Milford. Several notable storm events in 1962, 1981 (Nicholls and Webber, 1987; Nicholls and Webber, 1988; Bradbury, 2000) and recently as 2020, caused severe overtopping and overwashing of HCS. The 1989 storm which had a 1:100-year return period caused up to 80m rollback of the barrier at some locations. Due to the increasing rate of landward recession of the HCS, the New Forest District Council intervened and implemented a large-scale beach nourishment scheme during 1996-1997 which increased the barrier width and crest height by up to 20 m and 7 m respectively. The beach nourishment consisted of sediment from the Shingles Bank offshore, where sediment sizes are homogenous with sediment diameter D50 of 15-16mm. Despite these efforts, the barrier was breached recently during the 2013/2014 winter storms when wave heights over 4.1 m and a storm surge in excess of 1.4 m were reported (Bradbury and Mason, 2014). Although the barrier was restored after the 2014 events, a period that was dominated by bimodal storm conditions (Thompson et al., 2018), it breached again in February 2020.
3 Numerical modelling
3.1 XBeach-model
In this study we used the open-source, non-hydrostatic process-based coastal morphodynamic model XBeach-G (XBeach, 2018). The XBeach-G model contains a non-hydrostatic pressure correction term (Smit et al., 2010; Smit et al., 2013) which captures the instantaneous water surface elevation, thus enabling wave run-up on coarse grain beaches to be modelled accurately. This is of particular importance for steep gravel beaches and barriers. The model also includes the option for infiltration and exfiltration through a permeable gravel bed which is a key process for gravel beach morphodynamics. For all simulations ground water flow was turned ‘on’. Lastly, the sediment transport was optimised by McCall et al., 2015 for that of gravel beach morphodynamics.
The hydrodynamic equations solved in XBeach-G when used in 1D mode are:
where x and t are the horizontal spatial and temporal coordinates respectively, η is the water surface elevation measured from the still water level, u is the depth-averaged cross-shore velocity, h is the total water depth, υh is the horizontal viscosity, ρ is the density of seawater, pnh is the depth-averaged dynamic pressure normalized by the density, g is the gravitational acceleration and is the total bed shear stress given by:
where cf is the dimensionless friction coefficient. The sediment transport is calculated via the Shields parameter:
where D50 is the median sediment diameter and ΔI is the relative effective weight of the sediment. Using van Rijn (2007) and Equation (4) the bed load transport equation, excluding silty sediment is given by:
Here is the Van-Rijn calibration coefficient, set to 0.5 as recommended by van Rijn (2007), qb is the volumetric bed load transport rate, is the shields parameter, is the critical Shields parameter and D is the non-dimensionalised grain size.
Changes in the beach profile within the model are calculated using the Exner equation:
where ξ is the elevation of the bed above a horizontal datum and n is the porosity.
Further details of XBeach-G can be found in Roelvink et al. (2009); Jamal et al. (2014); McCall et al. (2014; 2015) and the XBeach User Manual (2018).
3.2 XBeach-G model setup
It is assumed that the impact of longshore processes is smaller compared to cross-shore processes at the storm time scale and therefore were not considered in this study. Further, in the absence of measurements crest compaction is neglected. The eastern part of HCS, towards the Hurst castle, is the most vulnerable to incoming storms with overwash predicted during 1:5-year storm, while the middle and western part of the barrier is found to be less vulnerable to storm wave attack (Bradbury et al., 2005). Two cross-shore profiles, one on the west side of the barrier (HS1) and one towards the eastern side (HS2) (Figures 1, 2), were selected for XBeach-G calibration, validation and subsequent numerical simulations. These profiles representing the most vulnerable and least vulnerable to overwash (Bradbury et al., 2005). The selected profiles have different barrier geometries, crest heights and are swash-aligned where there is evidence of historic overwashing events.
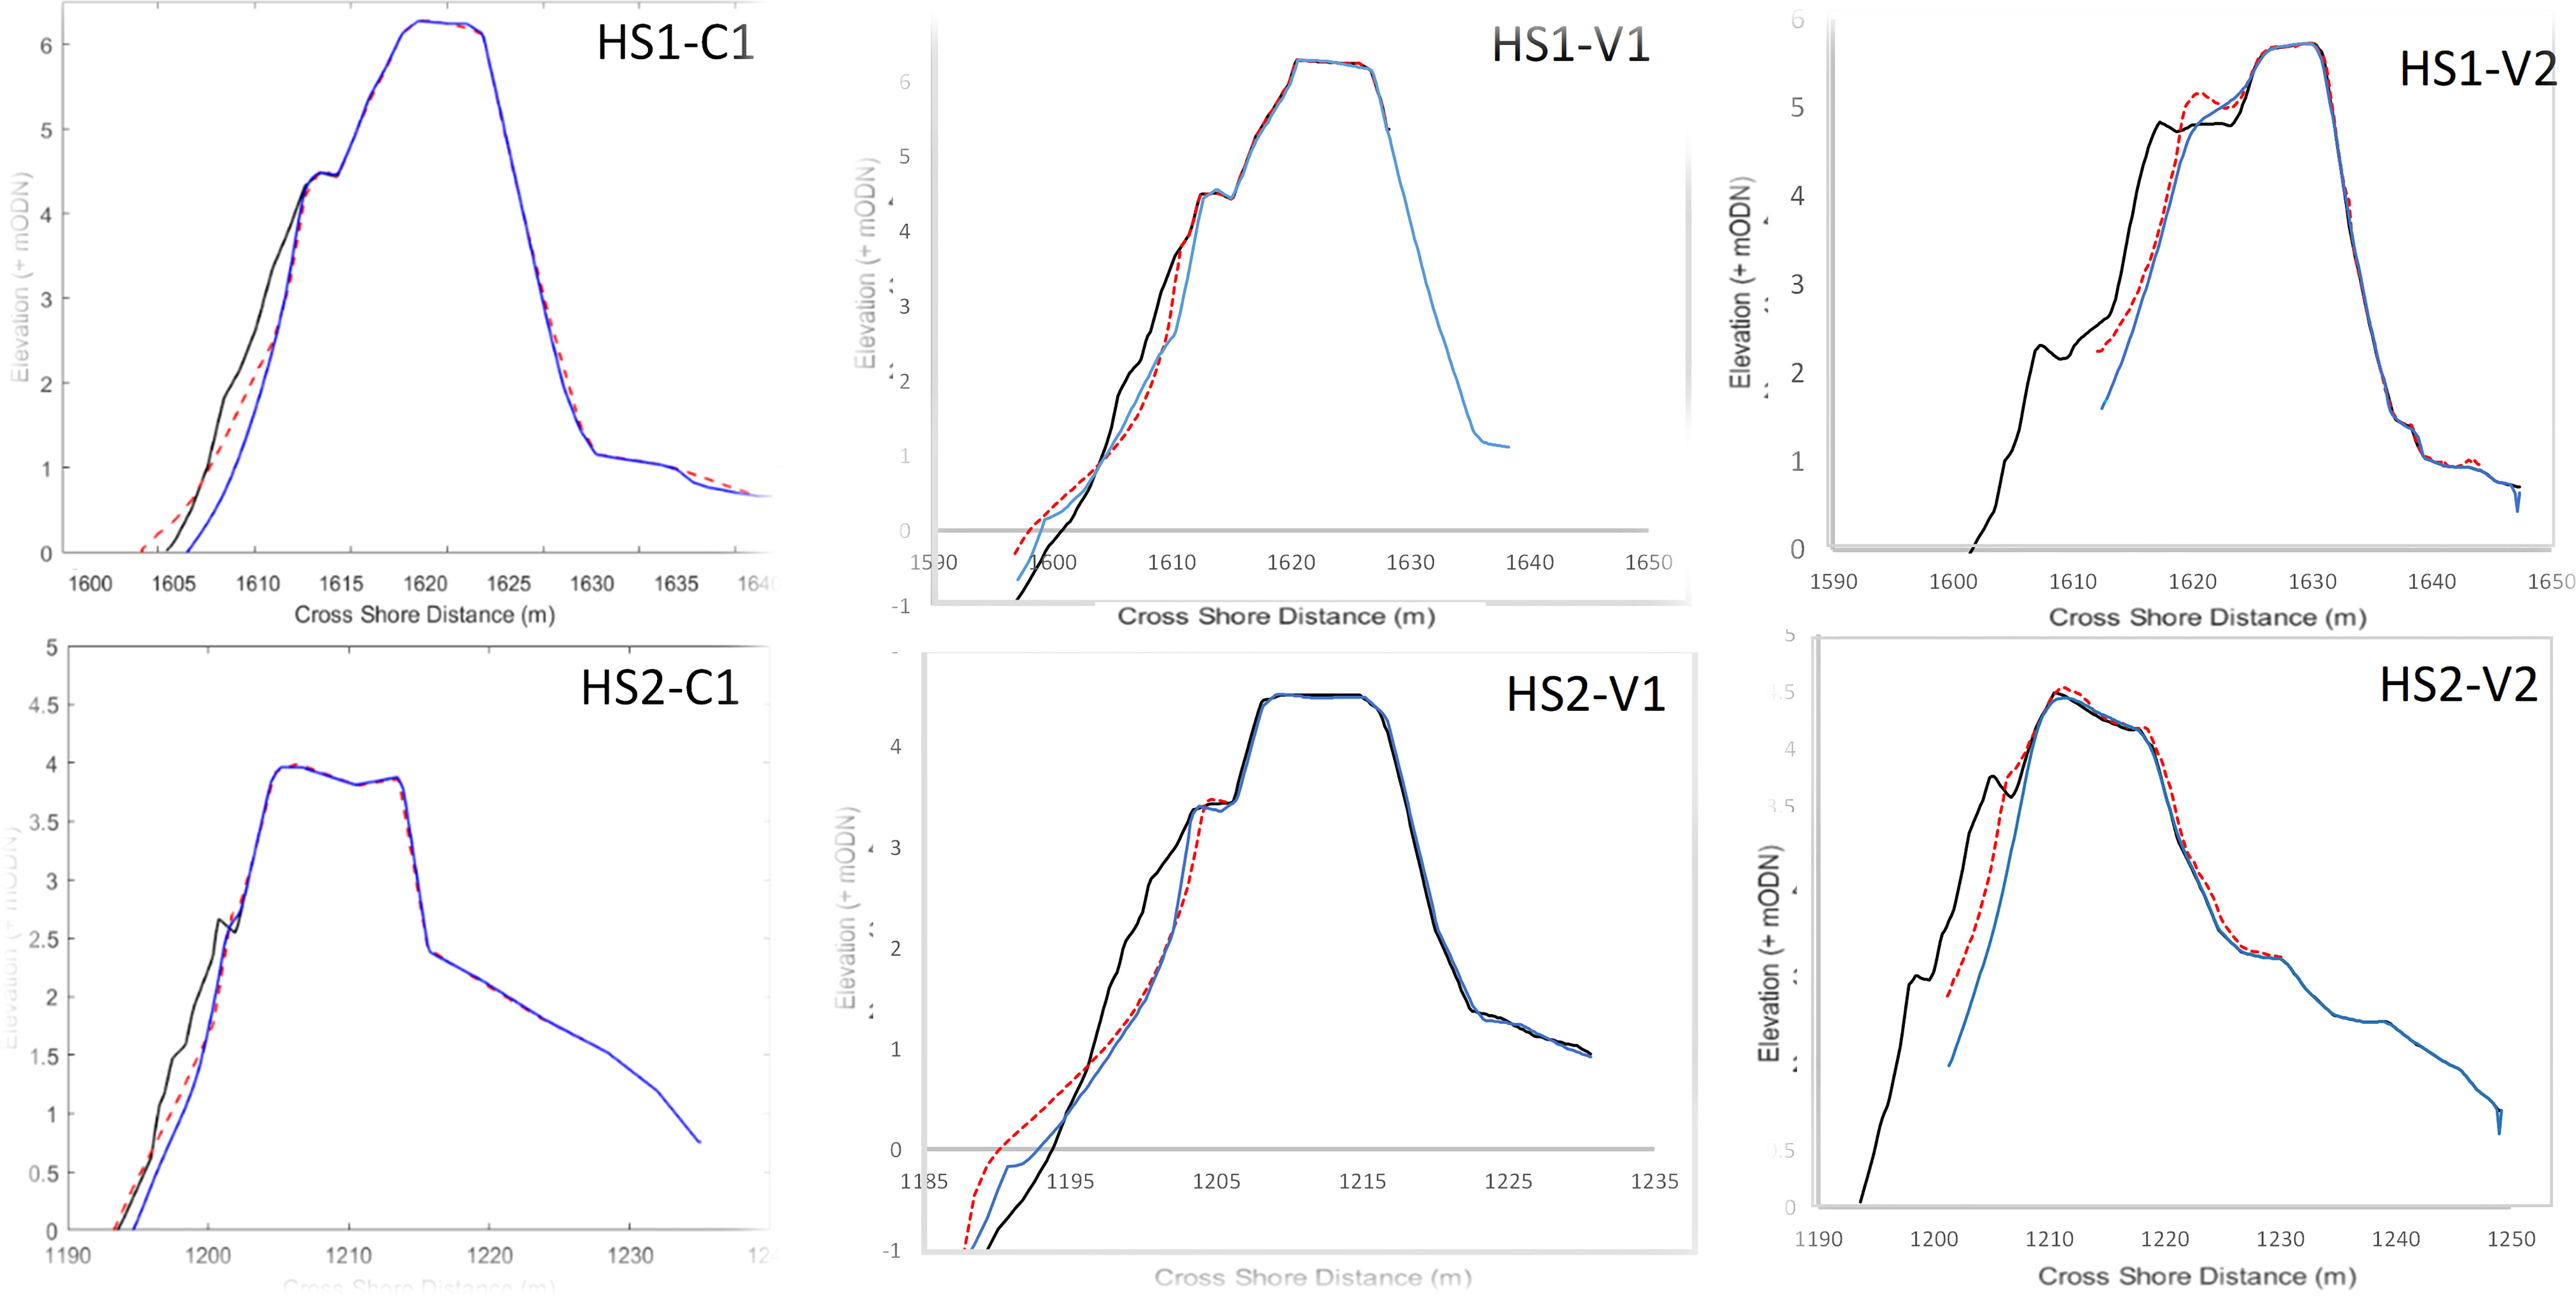
Figure 2 A comparison of measured and simulated post-storm profiles of HS1 and HS2 used for calibration (C1) and validation (V1 & V2) in Table 1. Measured pre-storm profile (black line), measured post-storm profile (red dotted line) and simulated post-storm profile (blue line).
The barrier topography, was combined with off-shore bathymetry data provided by the CCO to form cross-shore bathymetries (Figures 1E, F) to the depth of Milford wave buoy, located at an approximate sounding of 8 mODN. HS1 model domain was then extended using a uniform 1/50 seabed slope (XBeach 2018) until the water depth at the off-shore boundary was 15 m, selected using Figure 3. 3 In XBeach-G manual. HS2 bathymetry naturally extended to a depth of 15m. The grid cell size in the computation domain varied from 2 m– 3 m off-shore, to 0.1 m -0.3 m onshore, which allowed the model to capture the complex morphodynamics of the beach cross section in the nearshore, whilst off-shore grid resolution still is sufficient to capture wave transformation (McCall et al., 2015).
3.3 XBeach-G calibration and validation
XBeach-G was calibrated and validated against historic field measurements of pre- and post-storm beach profiles for HS1 and HS2, obtained from the CCO. The storms used for calibration and validation were identified firstly by peak wave heights exceeding the pre-determined storm threshold of 2.74 m at the MWB, defined by the CCO. Secondly, from this set of storms, suitable storms were selected by their proximity to the corresponding pre- and post- storm beach profile measurements, ensuring that the profile measurements reflect true pre- and post-storm profiles and that only one storm occurred between pre- and post-storm profile measurements. Once suitable storms were identified the input wave conditions and water levels were derived using data obtained from MWB (CCO) and Lymington Tidal gauge, obtained from the British Oceanography Data Centre (BODC). The wave and water level data inputted into XBeach-G was time varying, taken at hourly intervals. A regular JONSWAP spectrum was used, where the key inputs are; Significant wave height Hs, peak wave period Tp, wave approach angle θ, directional spreading S and JONSWAP peak enhancement factor γ.
To accurately quantify the model’s skill at predicting the barriers response to storms the Brier Skill Score (BSS) was used (van Rijn et al., 2003). BSS is categorized into skill brackets; 0-0.3 is ‘poor’; 0.3-0.6 is ‘reasonable/fair’; 0.6-0.8 is ‘good’ and 0.8-1.0 is ‘excellent’ where 1.0 represents simulated storm profile and actual post-storm topography are identical.
One storm condition was selected for XBeach-G calibration (Storm ID C1- Table 1), which occurred during September 2011. The storm displayed unimodal characteristics, with Hs = 3.85 m and Tp = 8.3 s. This storm was firstly simulated on HS1, and XBeach-G parameters were optimized, until the BSS was satisfactory. Using the same calibrated parameters, storm C1 was simulated on HS2. This process was repeated until a single set of calibrated parameters were selected. The choice of one storm for calibration is justifiable, firstly due to limited suitability of storms and secondly due to the extensive application of XBeach-G in previous studies.
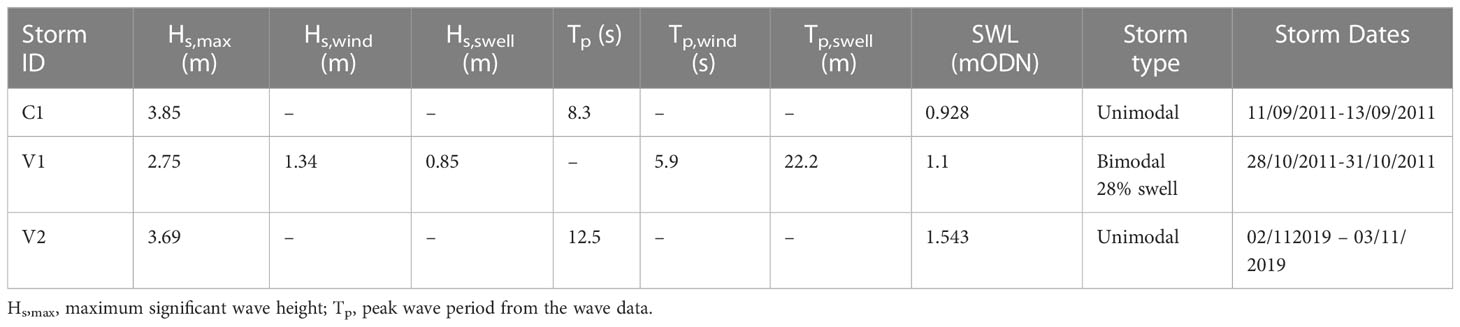
Table 1 Storm conditions extracted from the Milford wave buoy for XBeach-G calibration (C1) and validation (V1 & V2).
The following XBeach-G parameters were calibrated: the critical avalanching slope above water level dryslp = 1; the critical avalanching slope below water level wetslp = 0.3; the maximum Courant Friedrichs-Lewy number CFL = 0.9; the angle of internal friction of sediment repose angle = 45°; and the bed friction factor cf = 3D90. No morphological acceleration was used morfac = 1 was selected. The hydraulic conductivity kx = 0.15 ms-1, was initially selected following McCall et al. (2015), Masselink et al. (2014) and Poate et al. (2016) who used values between 0.01 and 0.2 ms-1 for similar sediment sizes. Remaining XBeach-G parameters were kept at their default values. Key physical processes that were ‘enabled’ are; the McCall & Van- Rijn sediment transport formulae and ground water flow – a key feature of gravel beaches governing overwash (McCall et al., 2014; McCall et al., 2015; Polidoro et al., 2018).
Using the calibrated parameters, four more XBeach-G validation cases were simulated. Two different storms were selected to be simulated on HS1 and HS2, separately. One storm (Storm ID V1, Table 1), which occurred during 28th to 31st October 2011 displayed bimodal characteristics, with a maximum swell percentage of 28%. The sea state consisted of a Hs,wind of 1.34 m, Tp,wind of 5.9 s, a Hs,swell of 0.85 m and a Tp,swell of 22.2 s. The second validation case (V2), which occurred over the period 02/11/2019 – 03/11/2019, categorized as a unimodal storm. This was a shorter storm with peak Hs and Tp of 3.69 m and 12.5 s.
The BSS values were taken from the maximum depth of topographic surveying (V1 extended to a depth of -1 mODN and V2 extended to + 1.8 mODN, on the seaward side) to the point landward where bed level change was less than the measuring accuracy of the surveying equipment used, in all cases a Trimble GPS was used with accuracy of +/- 0.035 m. Validation of HS1 and HS2 models against the storm V1 gave BSS scores 0.81 (excellent) and 0.65 (good), respectively. The validation of HS1 and HS2 models against the storm V2 achieved BSS scores 0.88 (excellent) and 0.6 (good) respectively.
XBeach-G correctly predicted face erosion for HS1-V1 & V2. The erosion profile was captured extremely well in HS1-V2. There is slight over erosion of the upper profile for HS1-V1. Offshore sediment accumulation was also captured reasonably well; however, it was overpredicted in each case – due to the over erosion of upper profile.
XBeach-G predicted the erosion of HS2-V2 upper profile to a satisfactory degree. There was an overprediction of erosion on the upper beach face for HS2-V2, but the barrier slope erosion trend was well captured. Unfortunately, no pre-storm and post- storm topographic data was available below + 1.8 mODN. The upper beach face erosion of HS1-V2 was well simulated. It should be noted that due to the limited profile data for the storm V2, the BSS is only representative of the upper beach profile. Therefore lower shoreface erosion and offshore sediment accumulation formation cannot be compared. However, wave run-up is being correctly simulated with upper beach face erosion predicted to a high degree of accuracy, which is key for predicting barrier response regimes. In all cases the barrier regime was captured accurately, correctly simulating collision regime response for all validation cases.
The profile measurements did not include any instances of overwashing. To test the model against this case we used the Barrier Inertia Model (BIM) developed by Bradbury (2000) and Bradbury et al. (2005). According to the BIM, overwashing at a given barrier cross section will occur if (RcBa/Hs3)<0.0006(Hs/Lm)2.5375 where Rc is barrier freeboard, Ba is cross-sectional area and Lm is the wavelength corresponding to Tm(mean wave period). Five significant storms with Hs return periods between 1:1 and 1:100 years(as determined by Bradbury et al., 2005) were selected to simulate profile change at both HS1 and HS2. The storm surge value of +1 m was used for all the BIM cases. The simulation results at both HS1 and HS2 agreed with the BIM model. Details of the storm conditions and full overview of the BIM validation results are given in Table 2.
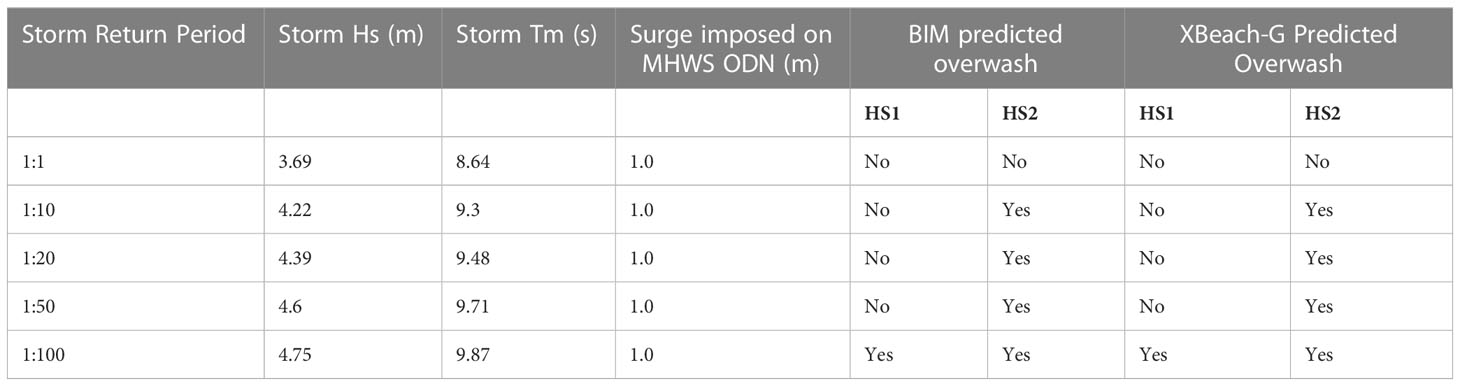
Table 2 Conditions used for BIM and a comparison of XBeach-G predictions of overwashing with BIM.
Although the calibration was carried out for unimodal storm conditions, we have found that the model performs well under a bimodal storm case. This, together with the comparison of overwashing from a wide range of storm scenarios with BIM, gives confidence in using the model for simulating morphodynamic change of HCS from low- to high-intensity unimodal and bimodal storms.
3.4 Numerical simulations
Firstly, a set of unimodal storm conditions were simulated, using XBeach-G, separately on two profiles at HCS. Following this a sub-set of bimodal storm conditions were simulated, using XBeach-G, with equal energy to unimodal cases, which differs by swell fraction only. This allowed direct comparison of swell fraction on HCS’s morphodynamic response. Lastly the two sets of data are combined creating a large synthetic database, where the parameter space is explored.
Two barrier cross-sections were used, HS1 (Profile 1) and HS2 (Profile 2). The two profiles represent high and low barrier crests with different crest levels of 5.14 mODN and 3.96 mODN respectively.
A time varying tide was used. The MHWS tide profile was selected for the initial water level profile, which was obtained from the Lymington tidal gauge (BODC). Six storm hydrograph elevations were then taken from Bradbury et al. (2005) which were calculated for HCS. These values ranged from a 1:1 up to 1:200-year return period. Using a data set of five years duration from Lymington and following the methods of McMillan et al. (2011) a mean surge hydrograph shape was derived. This was then superimposed to the initial tide of Lymington. The storm duration was also calculated using the same five-year data set (20 hours, with additional 4 hour spin up time). The maximum storm surge was aligned with the highest tide level to generate the worst-case water level scenario in all simulations.
The wave conditions simulated were also taken from Bradbury et al. (2005). Bradbury et al. (2005) provides Hs and Tp values for HCS, which range from 1:1 to 1:100-year return period. These conditions were used to force the wave boundary in XBeach-G. Other wave parameters, θ and S, were selected as the average values provided by MWB, of 211° and 15 respectively, which remained constant (CCO).
A JONSWAP spectrum was used to generate unimodal wind waves. The methods set out by Polidoro et al. (2014) were used to generate bimodal wave conditions. The total Hs was generated, and consisted of the wind sea wave, Hwind and swell wave, Hswell, shown in Eq (7). A specific fraction of Hswell was introduced by sharing the total energy between Hwind, and Hswell, through varying S0 Eq. (8) and Eq. (9).
Where m0 is the zeroth moment of the bimodal spectrum shown in Figure 3. An illustration of an example case for bimodal spectra with different swell percentages is shown in Figure 3.
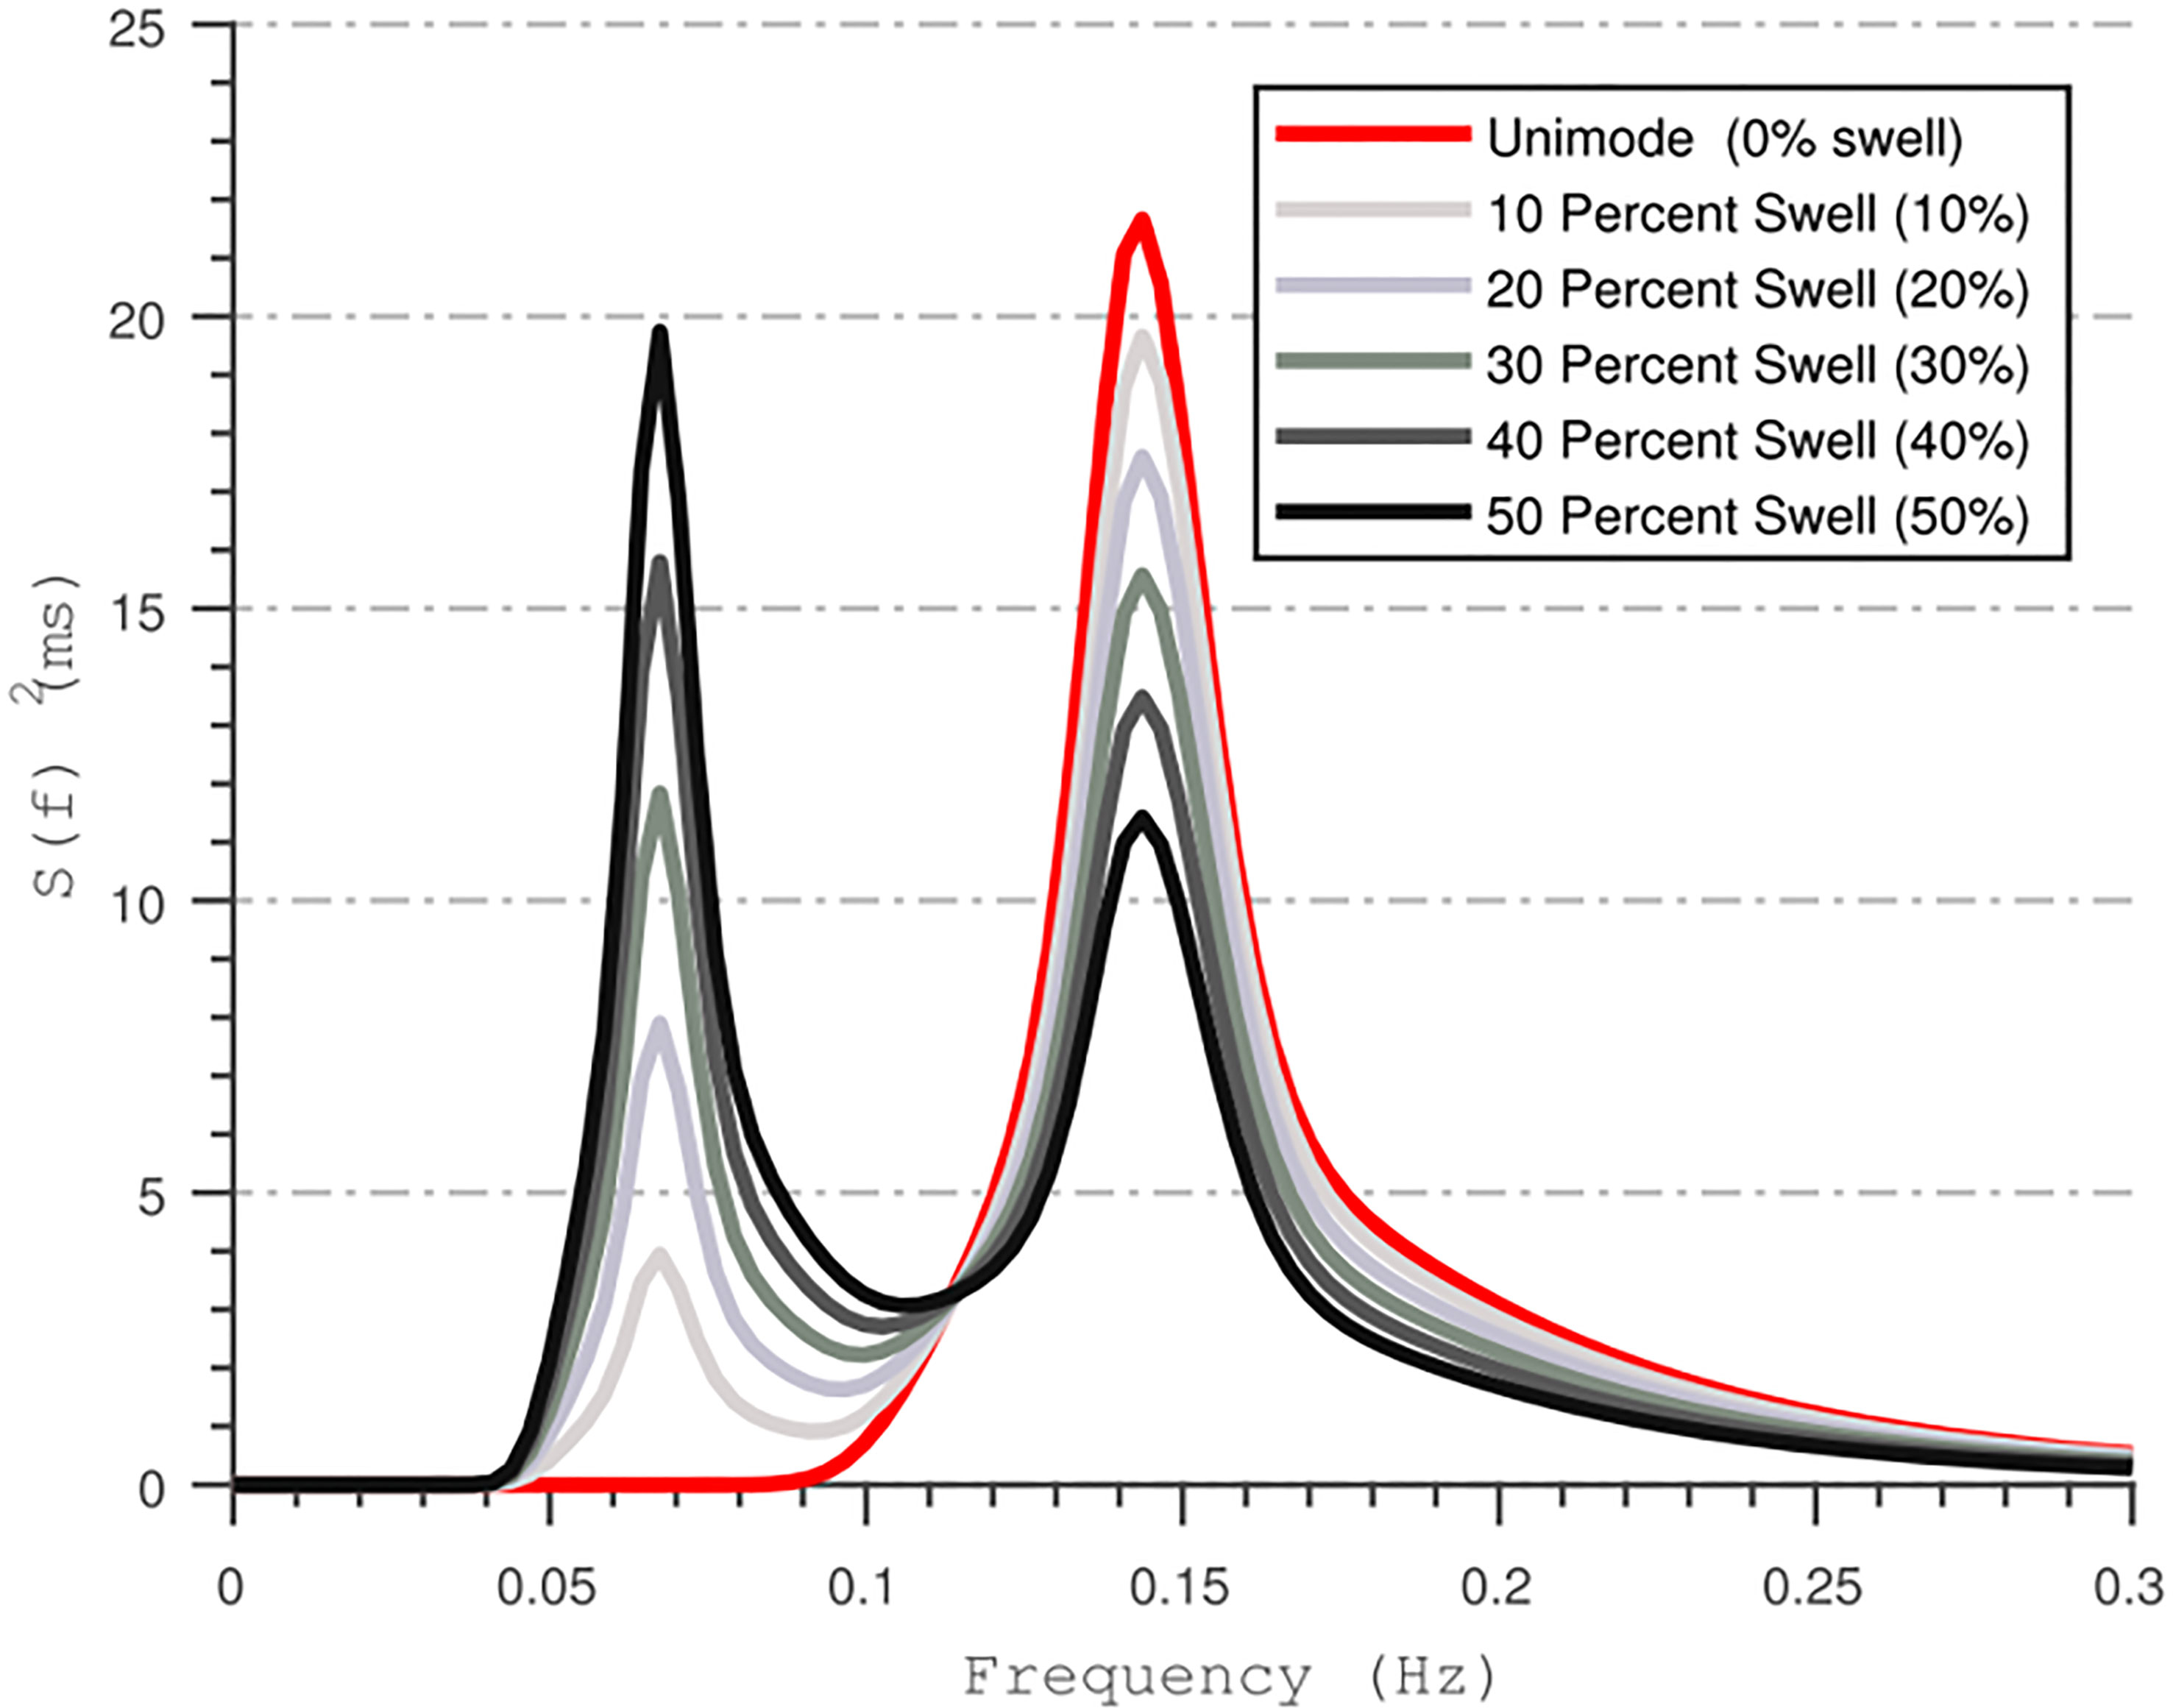
Figure 3 An example of energy-conserved bimodal spectrum. From Figure 3 of Orimoloye et al. (2019).
Bimodal wave spectra with six different swell percentages were generated. Peak wave period in bimodal spectra was kept constant at 15.0 s for Hswell and 5.0 s for Hwind (Table 3).
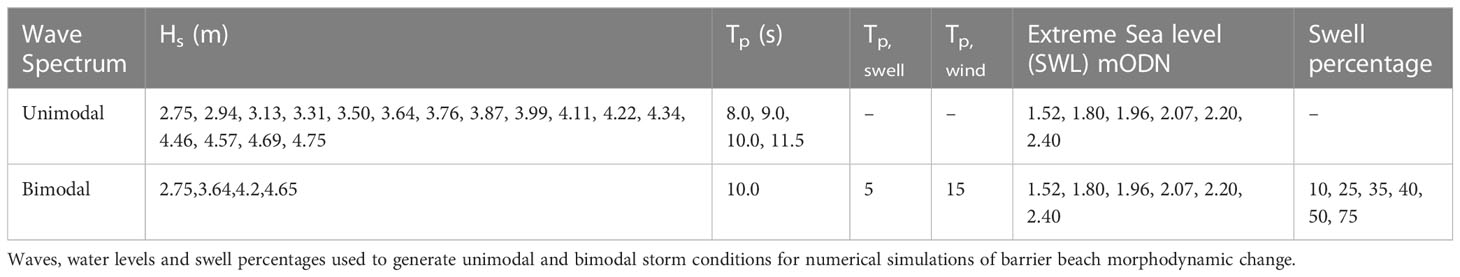
Table 3 Entire set of conditions used to develop synthetic database.
4 Results and discussion
Section 4.1 investigates the spatio-temporal evolution of both Profile 1 and Profile 2 to different unimodal storm conditions. Following this section 4.2 compares spatio-temporal evolution of Profile 2 to varying swell fraction compared to a unimodal storm of same energy. Section 4.3 then investigates the entire synthetic database for barrier response regime response. Lastly section 4.4 presents a distillation of parameters space and relation between key hydrodynamic and morphodynamic parameters to barrier crest elevation change and shoreline recession.
The entire synthetic database is then used to establish the relationship between key morphodynamic drivers and different barrier responses in Section 4.3 and 4.4.
4.1 Spatio-temporal evolution of barrier profiles under unimodal storms
To understand the wide range of short-term morphodynamic responses of gravel barriers to storm conditions in detail, the spatio-temporal evolution of barrier cross sections from four simulations (Table 4) were investigated in detail. These four simulations were selected as they represented the overwash response regime, the most complex and transitional regime that captures both barrier crest height increase and crest height reduction. Two storms were chosen for each barrier cross-section, giving different responses. A schematic diagram of a gravel barrier showing the selected parameters, which will be used herein and in subsequent discussions is given in Figure 4.
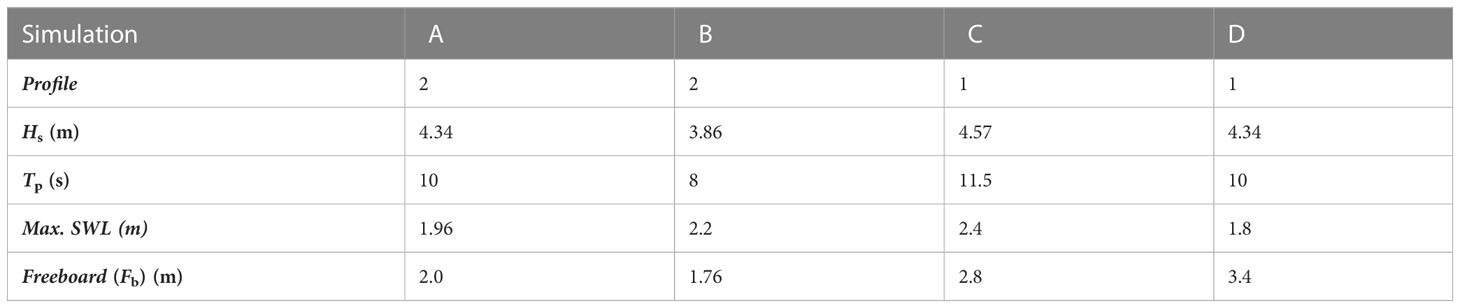
Table 4 Unimodal storm conditions used for a detailed investigation of spatio-temporal barrier evolution and the development of morphodynamic regimes shown in Figure 5.
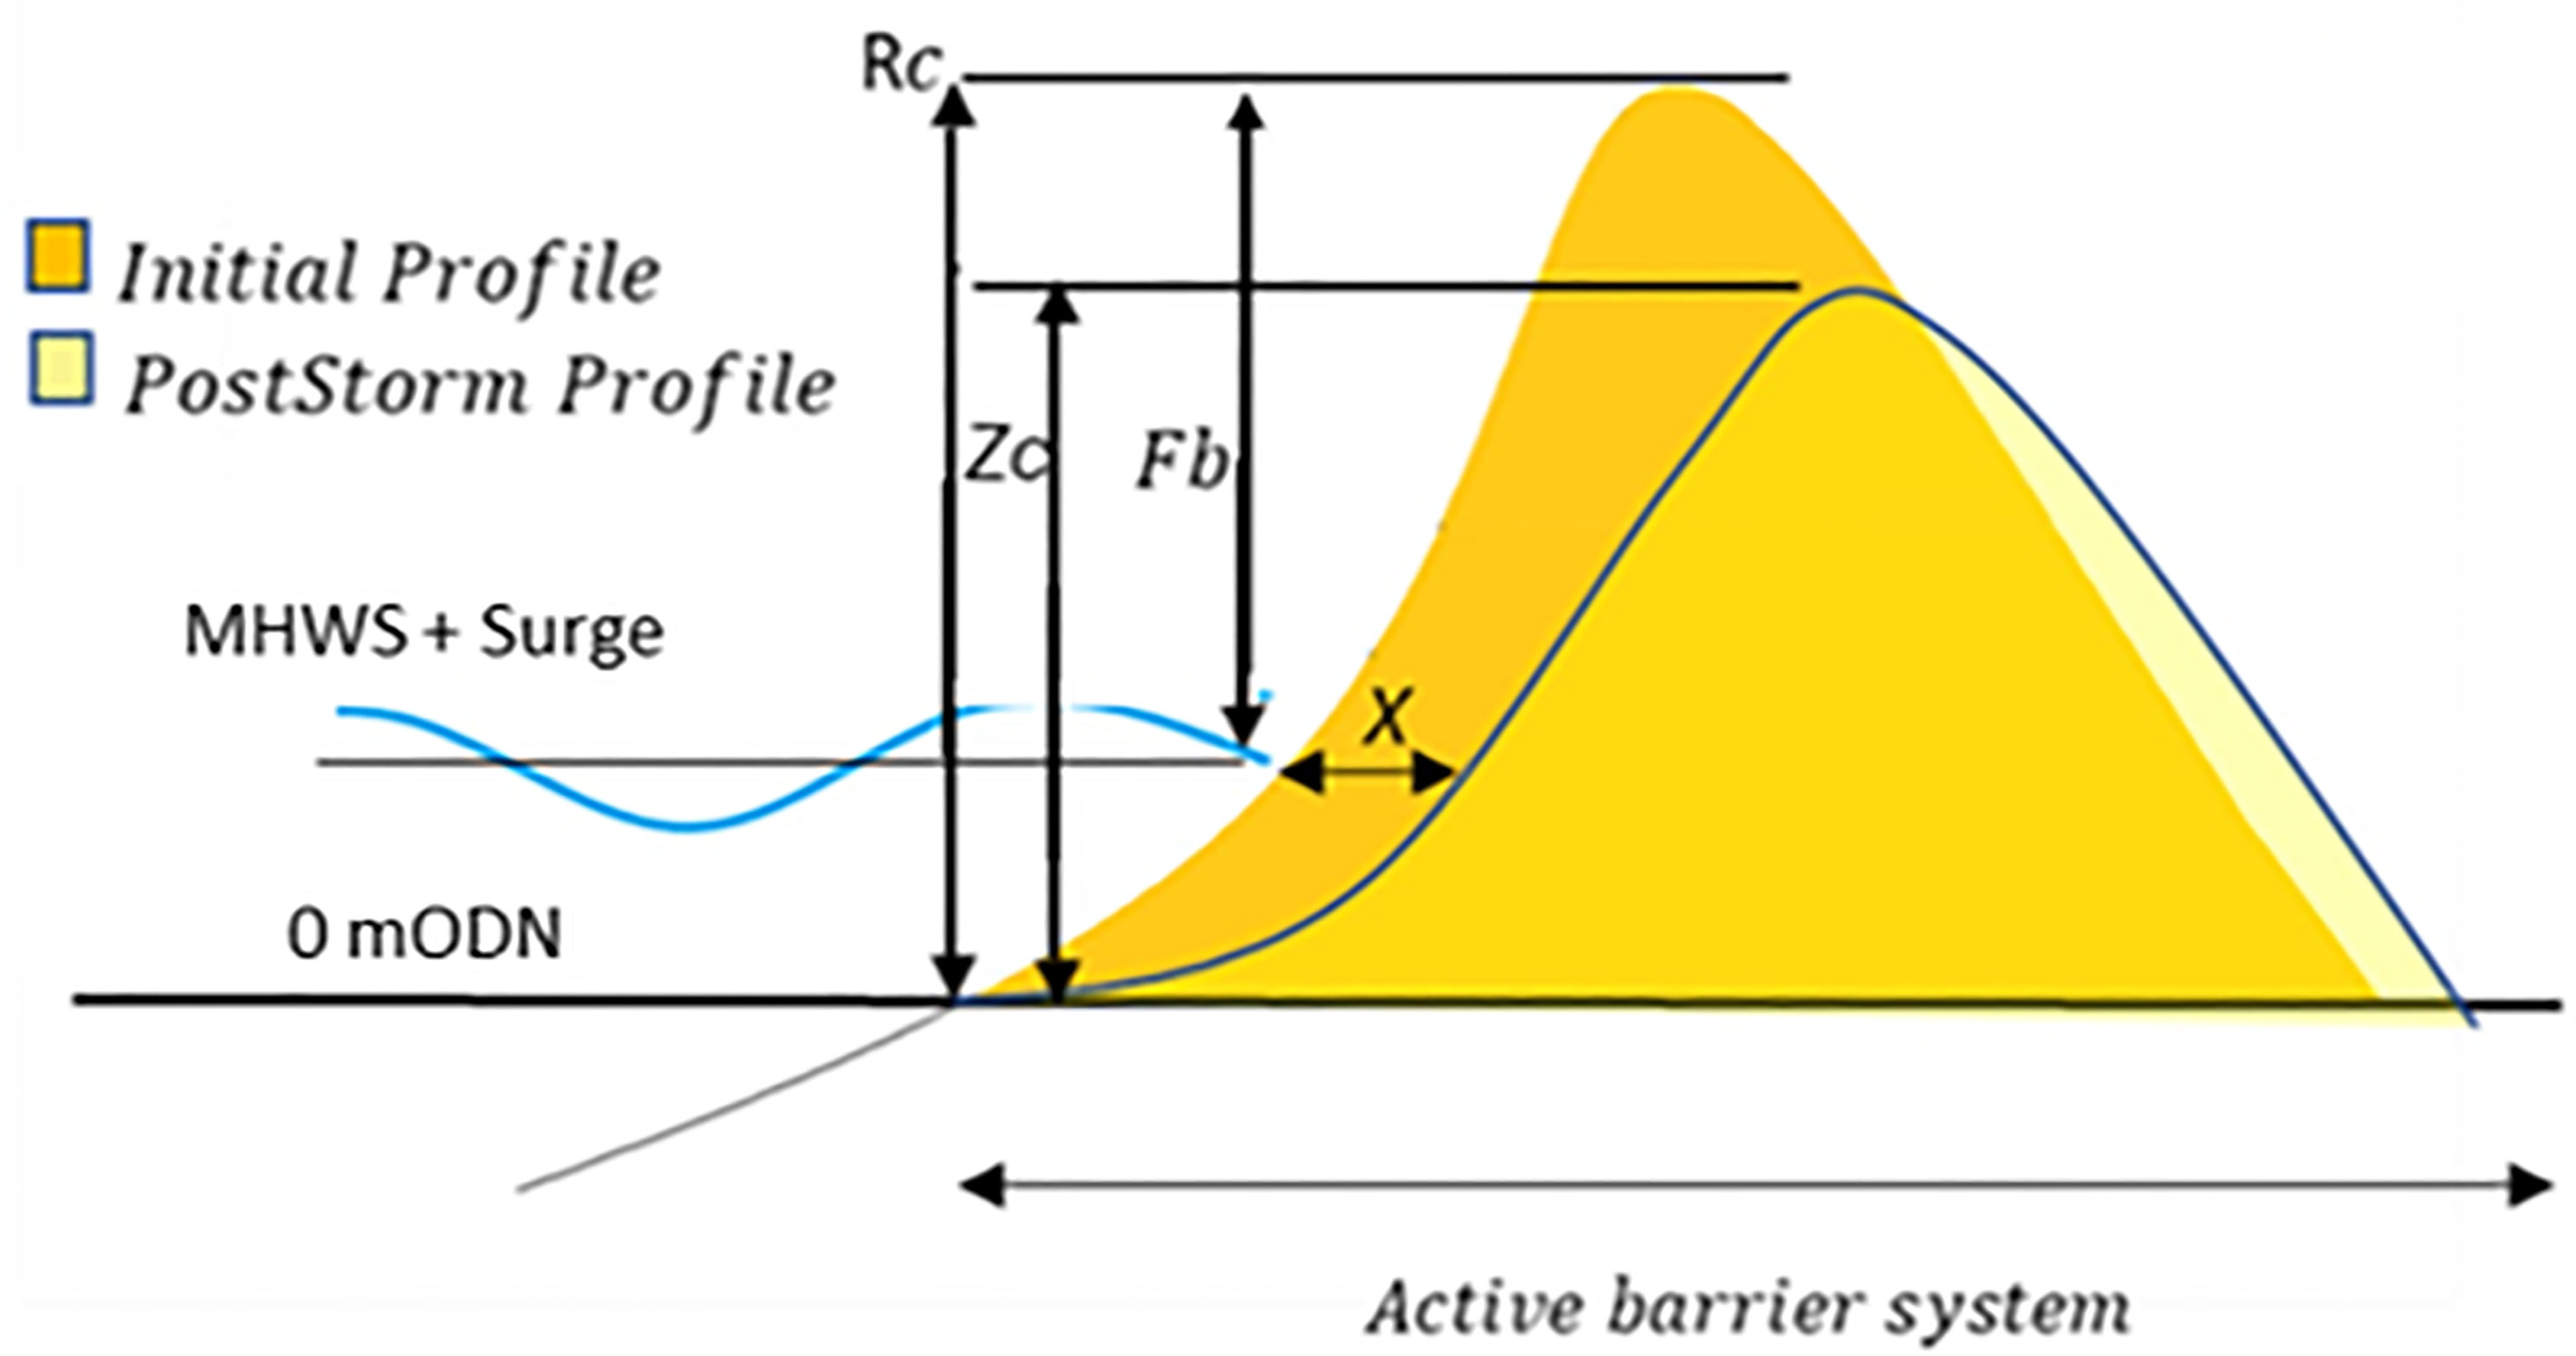
Figure 4 Schematic diagram for barrier parameter description. Barrier Freeboard, Fb, which is the vertical height from the MHWS+ Storm surge to the barrier maximum crest height. Rc is the pre-storm crest height above 0 mODN. Zc is the post-storm barrier crest height above 0 mODN; and X is the horizontal movement of the of barrier at MHWS.
The morphodynamic response of Profile 2 was studied under the influence of two storms in Figures 5A, B. Figures 5A1, A2, A3 correspond to Simulation A in Table 4 and Figures 5B1, B2, B3 correspond to Simulation B in Table 4. The morphodynamic response of Profile 1 was also studied under the influence of two storms in Figures 5C, D. The crest height of Profile 1 is significantly higher than that of Profile 2, which leads to a freeboard higher than in Profile 2 for a given SWL. Figure 5C1, C2, C3 corresponds to Simulation C in Table 4 and Figures 5D1, D2, D3 corresponds to Simulation D in Table 4. Figures 5A1–D1 gives the pre- and post-storm profile. Figures 5A2, D2 shows spatio-temporal profile elevation during the storm, while Figures 5A3-D3 gives wave run-up height above 0 mODN.
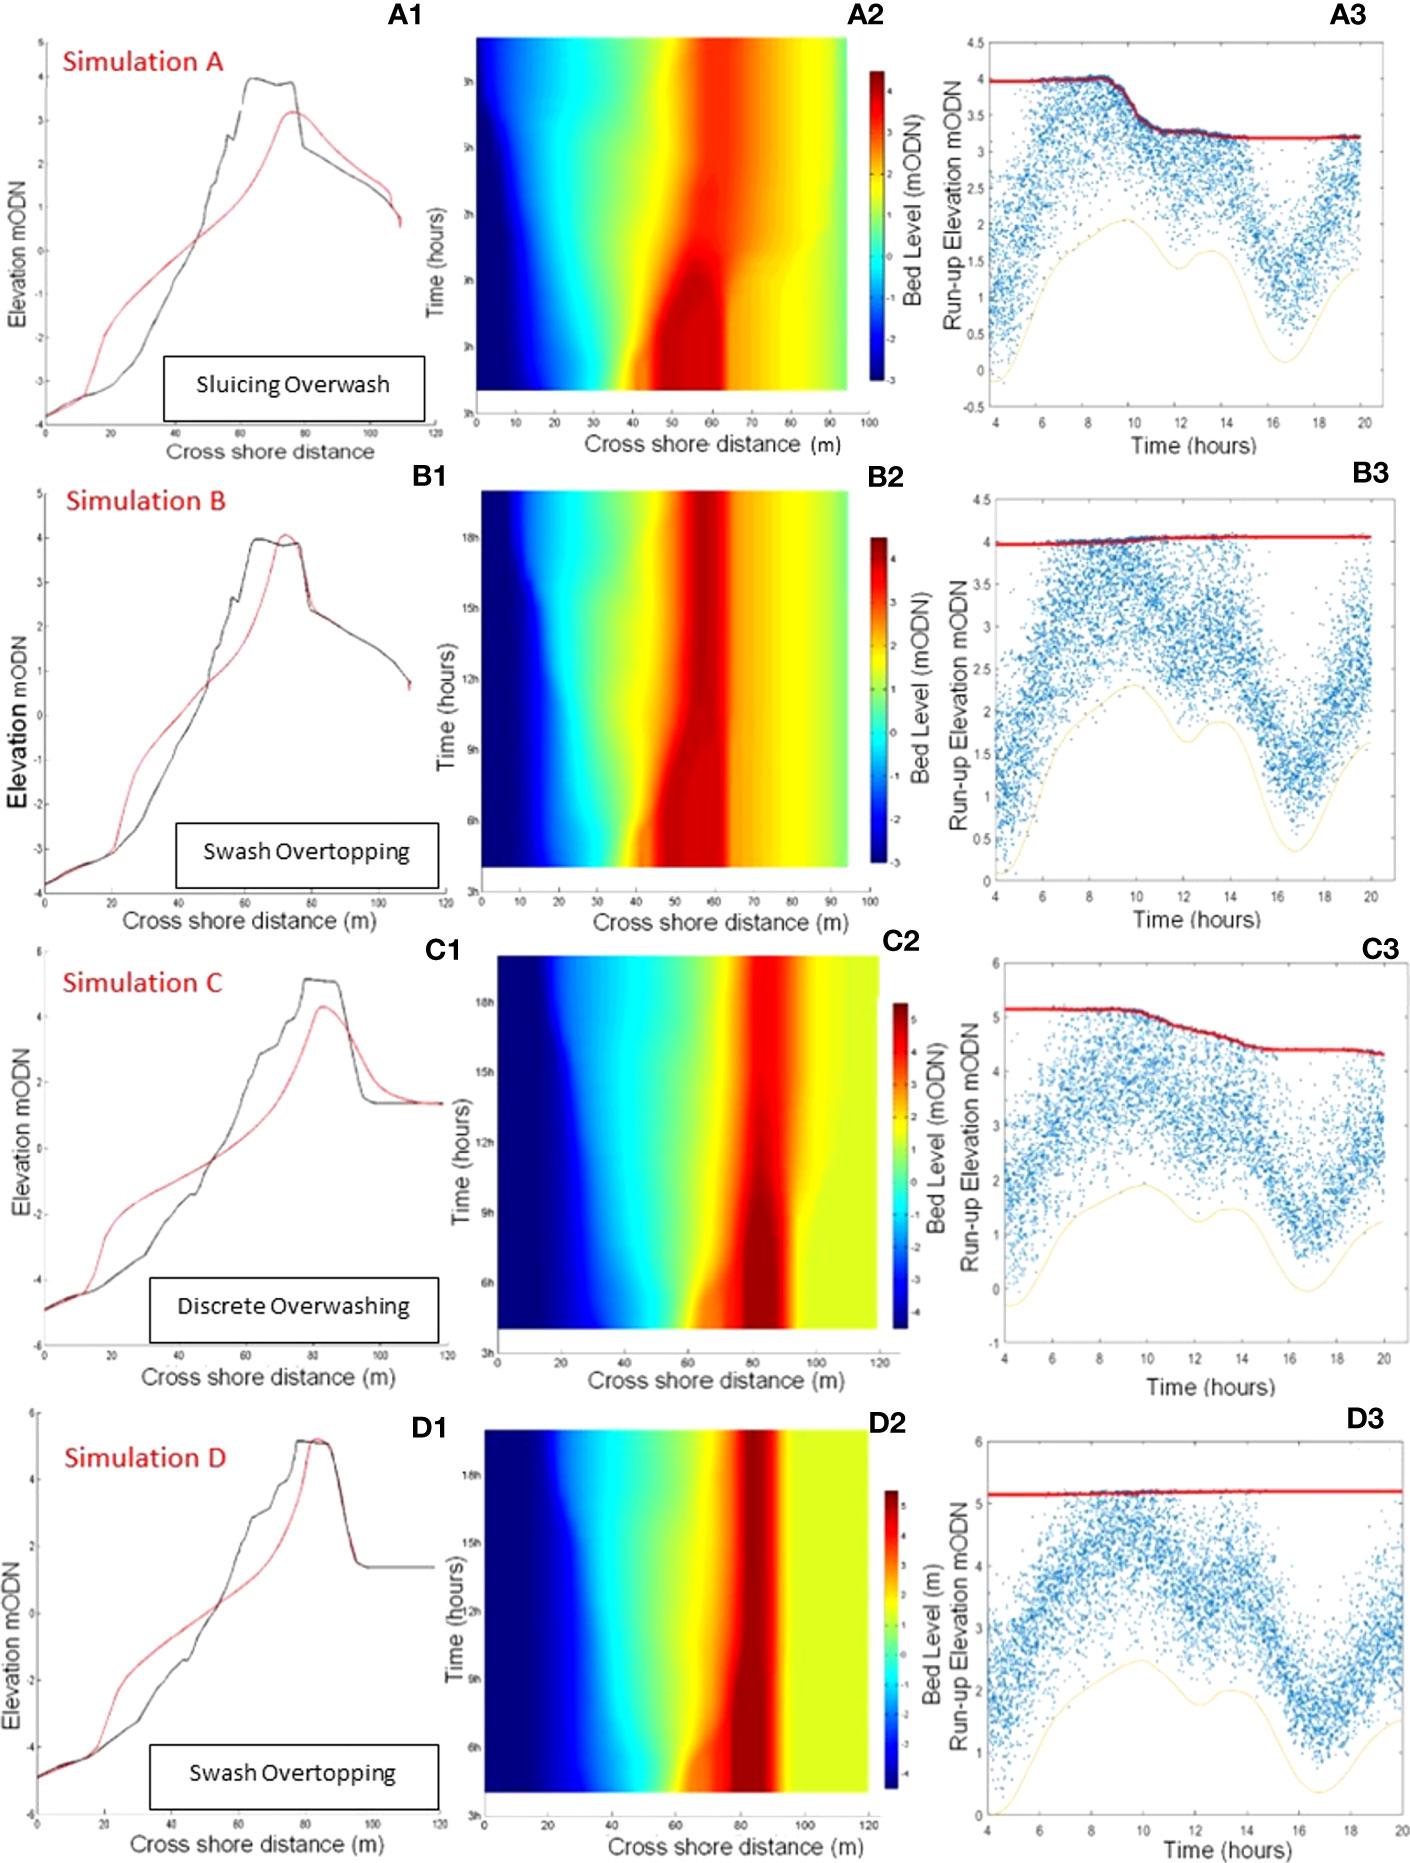
Figure 5 Short-term morphodynamic response of Profile 1 and Profile 2 to unimodal storm conditions given in Table 4 (Simulations (A–D). (A1), (B1), (C1), (D1) - pre storm (black) and post-storm (red) profiles; (A2), (B2), (C2), (D2) - spatio-temporal barrier evolution during the storm); (A3), (B3), (C3), (D3) -wave runup (blue crosses) and evolution of barrier crest height (red). Orange Line - SWL.
Figure 5A1 indicates clear post-storm crest height reduction following the storm. In Figure 5A2, a gradual crest reduction over time can be seen, together with accumulation of sediment at the lower shoreface, forming an off-shore berm and deposition of overwashed sediment at the back of the barrier. The barrier crest moved backwards indicating some degree of roll-over, from overtopping. At the initial stages of the storm, sediment from the upper beach moved seaward until incipient crest reduction. This evolutionary phase corresponds to the collision regime as seen in Figure 5A3. This phase is followed by a period of crest reduction and landward movement of sediment towards the back barrier, while no significant offshore-directed sediment movement can be seen. This corresponds to the discrete overwash response within the overwash regime. During this time, wave run-up either reached or exceeded the barrier crest. No significant profile evolution can be seen during the latter part of the storm. The horizontal position of the barrier crest has moved landward during the storm.
Figure 5B1 clearly shows crest accumulation, thinning of the upper beach and the accumulation of sediment on the lower shoreface. Figure 5B2 shows initial scouring of the beach face, while barrier crest height remains constant. In addition to seaward transport of sediment with backwash flow as explained earlier in Section 4, when the gradient of shoreface slope exceeds the angle of repose of the sediment avalanching can also occur, thus contributing to the reduction of the width of upper beach. This initial response corresponds to collision regime as seen in Figure 5B3. As the water level increases with the rise in storm surge over time, the barrier width is greatly reduced due to continued shoreface erosion; however, barrier crest height remained unchanged during the latter half of the storm. These changes to the barrier correspond with the occurrence of a large number of run-up events that reached the crest of the barrier are shown in Figure 5B3. As the water level begins to decrease during the latter part of the storm, the horizontal barrier position remained stable whilst sediment accumulation at the barrier’s crest continued until the storm’s end.
Figure 5C1 indicates approximately a 1 m reduction in crest height following this storm. According to Figure 5C2, while sediment eroded from the barrier face continued to accumulate at the lower shoreface during the storm, some sediment was transported to the back of the barrier. During the initial period of the storm as the water level rises due to rising surge the barrier face is eroded. This eroded sediment is transported and accumulated offshore on the lower beach face. This corresponds to collision regime. As the storm progresses and the water level increases towards the peak, the barrier crest height gradually reduces as does the width of the barrier crest, due to overwashing which carries sediment over the crest of the barrier and deposits it landward, this corresponds to discrete overwash regime. However, after the slight landward movement of the barrier crest during the early stages of the storm, its horizontal position remains stable during the latter part of the storm. The reduction in crest height is followed by multiple run-up events exceeding the crest of the barrier (Figure 5C3). The reduction of the barrier crest height is explained by the occurrence of numerous run-up events from the high-energy storm wave condition. Higher run-up combined with larger wave heights results in more significant quantities of sediment being transported over the barrier crest due to overwashing, which is then deposited at the back of the barrier, as seen in Figure 5C3.
The pre-and post-storm profiles given in Figure 5D1 show that although a significant amount of reduction of the barrier width has taken place, the horizontal position of the barrier crest remained stable. The sediment eroded from the upper part of the barrier has deposited at the lower shoreface. Figure 5D2 shows the time evolution of the barrier during the storm’s progression while Figure 5D3 shows run-up height. During the initial stages of the storm when the water level increases as a result of the rising surge, no run-up events that caused overtopping are noted. As a result, no sediment accumulation above the crest was found. All sediment eroded from the barrier crest had been transported offshore. This phase can be correlated to the collision regime. During the highest water level (i.e., at the peak of the storm surge) multiple run-up events reached or slightly exceeded the barrier crest level although they did not have a significant effect on the crest elevation. This suggests these events were not of sufficient energy to push sediment onto the crest. Just after the water level peaked, a small amount of sediment accumulation on the barrier crest can be seen. During this storm phase, the barrier response can be stated as the swash overtopping.
Interestingly, overwashing did not occur during the highest water level. This can be due to the initial barrier having a larger freeboard and cross-sectional area. Significant barrier thinning was observed during the highest water level, although no overwashing occurred. The reduction of the active barrier cross-sectional area due to the thinning of the barrier will subject the barrier to an increased risk of wave overwashing, as explained by Bradbury (2000) and Ions et al. (2021).
The results discussed above, combined with existing knowledge, consolidated several essential facts relating to short-term gravel barrier evolution in response to unimodal storms: (i) barriers can go through more than one morphodynamic response during a storm; (ii) Hs and SWL (and hence barrier freeboard) are the key parameters that determine barrier morphodynamic response and wave period (hence wave steepness) plays a crucial role. Waves with longer periods can lead to higher run-up levels and big morphological change and hence crest reduction due to overwash as explained in Section 4; (iii) Moderate Hs combined with large Tp (waves with low steepness) may induce more overwash and barrier erosion than large waves with small period (high wave steepness) for a given barrier cross-section even when the barrier freeboard is large.
4.2 Spatio-temporal barrier response to bimodal storms
Bimodal storm conditions have been shown to increase wave overtopping in some cases, (Orimoloye et al., 2019), and coastal erosion, (Nicholls and Webber, 1988; Polidoro et al., 2018; Ions et al., 2021), compared to their unimodal counterparts. Here we examine the impact of bimodal storms on gravel barrier beach morphodynamics and the morphodynamic regimes in particular. The barrier responses to bimodal and unimodal wave conditions have been compared for sea states that have equivalent energy content.
The differences in barrier morphodynamic response due to bimodal waves can be attributed to the longer period and hence less steep swell waves in the bimodal spectrum. They can propagate closer to the shore, with less breaking-induced energy dissipation. As a result, the run-up from swell waves can be higher than that from shorter wind waves. This increased wave run-up can lead to frequent overwash events, thus moving sediment away from the crest of the barrier, as found in field and laboratory experiments (Almeida et al., 2017; Polidoro et al., 2018).
The pre-and post-storm barrier profiles, spatio-temporal evolution of the profile and the wave run-up time history under storms with different swell percentages ranging from 10-75% are shown in Figure 6 for the bimodal storm with Hs=3.64 m, Tp=10 s and SWL=1.52 m. Morphodynamic change from a storm with the same Hs, Tp, and SWL with 0% swell (unimodal wind waves) is also shown as the baseline scenario for comparison. Frontal erosion of the barrier shoreface and sediment deposition at the lower shoreface, takes place in all cases. The erosion from all bimodal storms is significantly higher than that from unimodal waves except for 10% swell storm (Figure 6B).
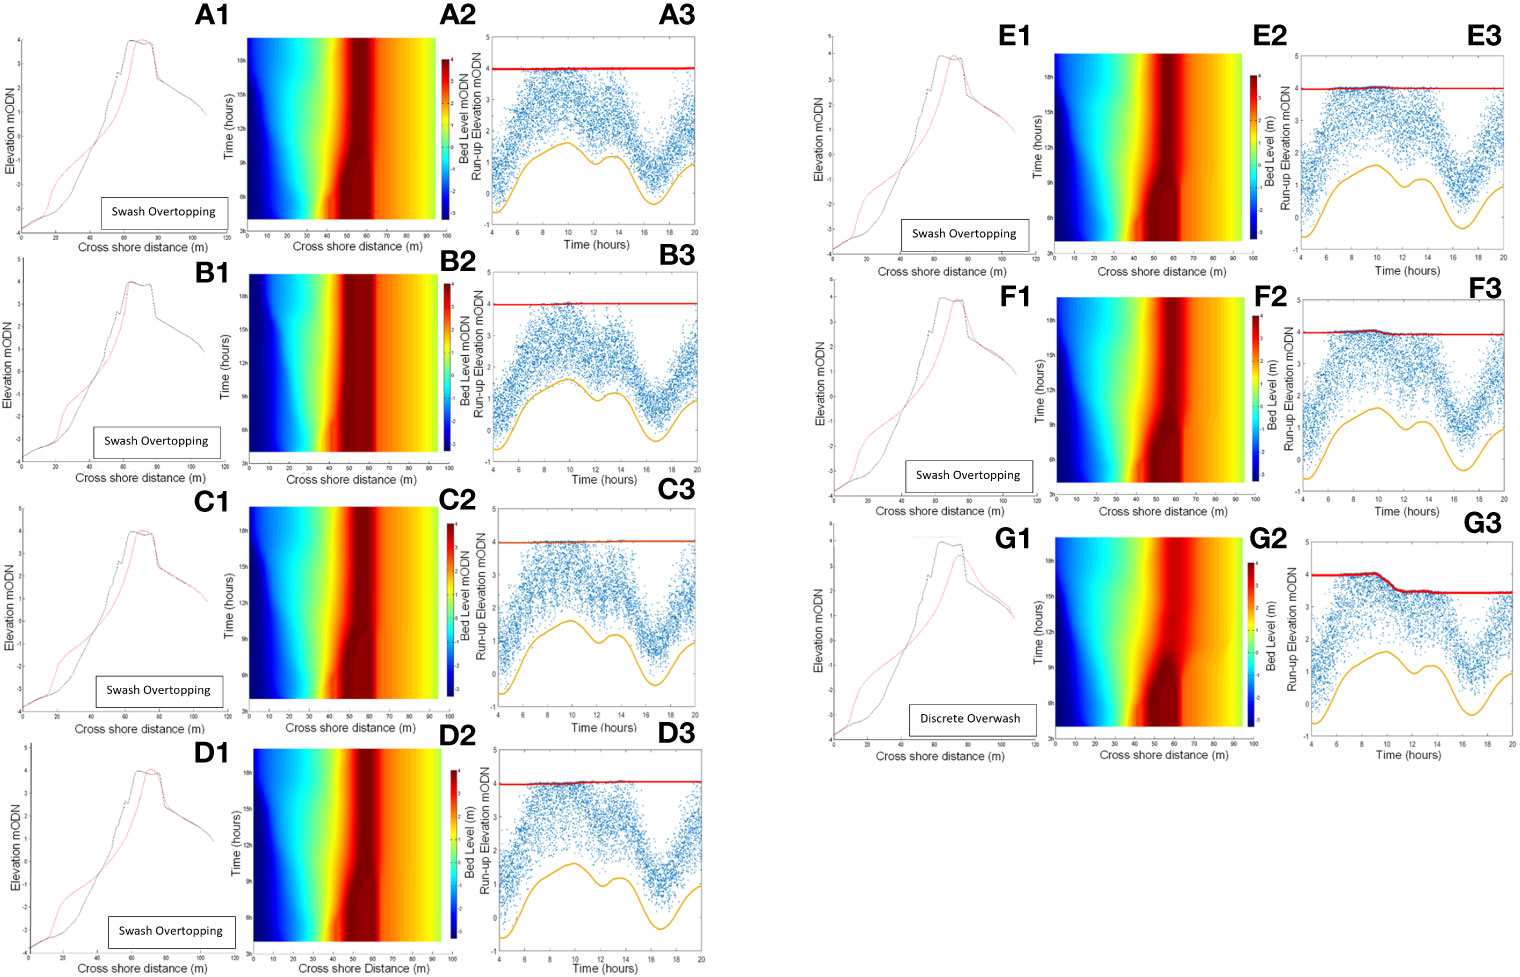
Figure 6 Comparison of profile change and runup at Profile 2 from sea states with bimodal waves containing different swell percentages. (A) 0%, 10% (B), 25%(C), 35% (D), 40% (E), 50% (F), 75% (G). Hs=3.64m, Tp=10s, SWL=1.52m. - Red Line- Maximum Crest Elevation, Orange Line - SWL, - Blue cross – Maximum wave run-up.
Morphodynamic change from the storm with 25% swell (Figure 6C) is somewhat similar to that from the unimodal storm (0% swell), where the response is swash overtopping with a slight shift of barrier crest height. Although the comparison of overtopping events given in Figures 6(A3) and (C3) suggest that the number of run-up events that reached the proximity of the barrier crest is larger than that from 0% swell case, which is confirmed in Figure 7. In cases with swell component between than 35% and 40% (Figures 6D, E), higher erosion of the shoreface and slight crest accumulation can be seen while the barrier is still at swash overtopping response. When the swell component is 50%, barrier response is similar to 40% swell case, except a small crest reduction indicates the start of the discrete overwashing regime. When the swell component is 75% (Figure 6G), the barrier response is sluicing overwash with severe crest reduction. When the swell percentage increases and swell waves dominate the incident wave spectrum, the number of higher run-up events generated by long period waves that can reach the upper beach and cause crest height change increases. This increases shoreface erosion, reducing barrier volume leading to increased overtopping and eventually lowers the barrier crest height.
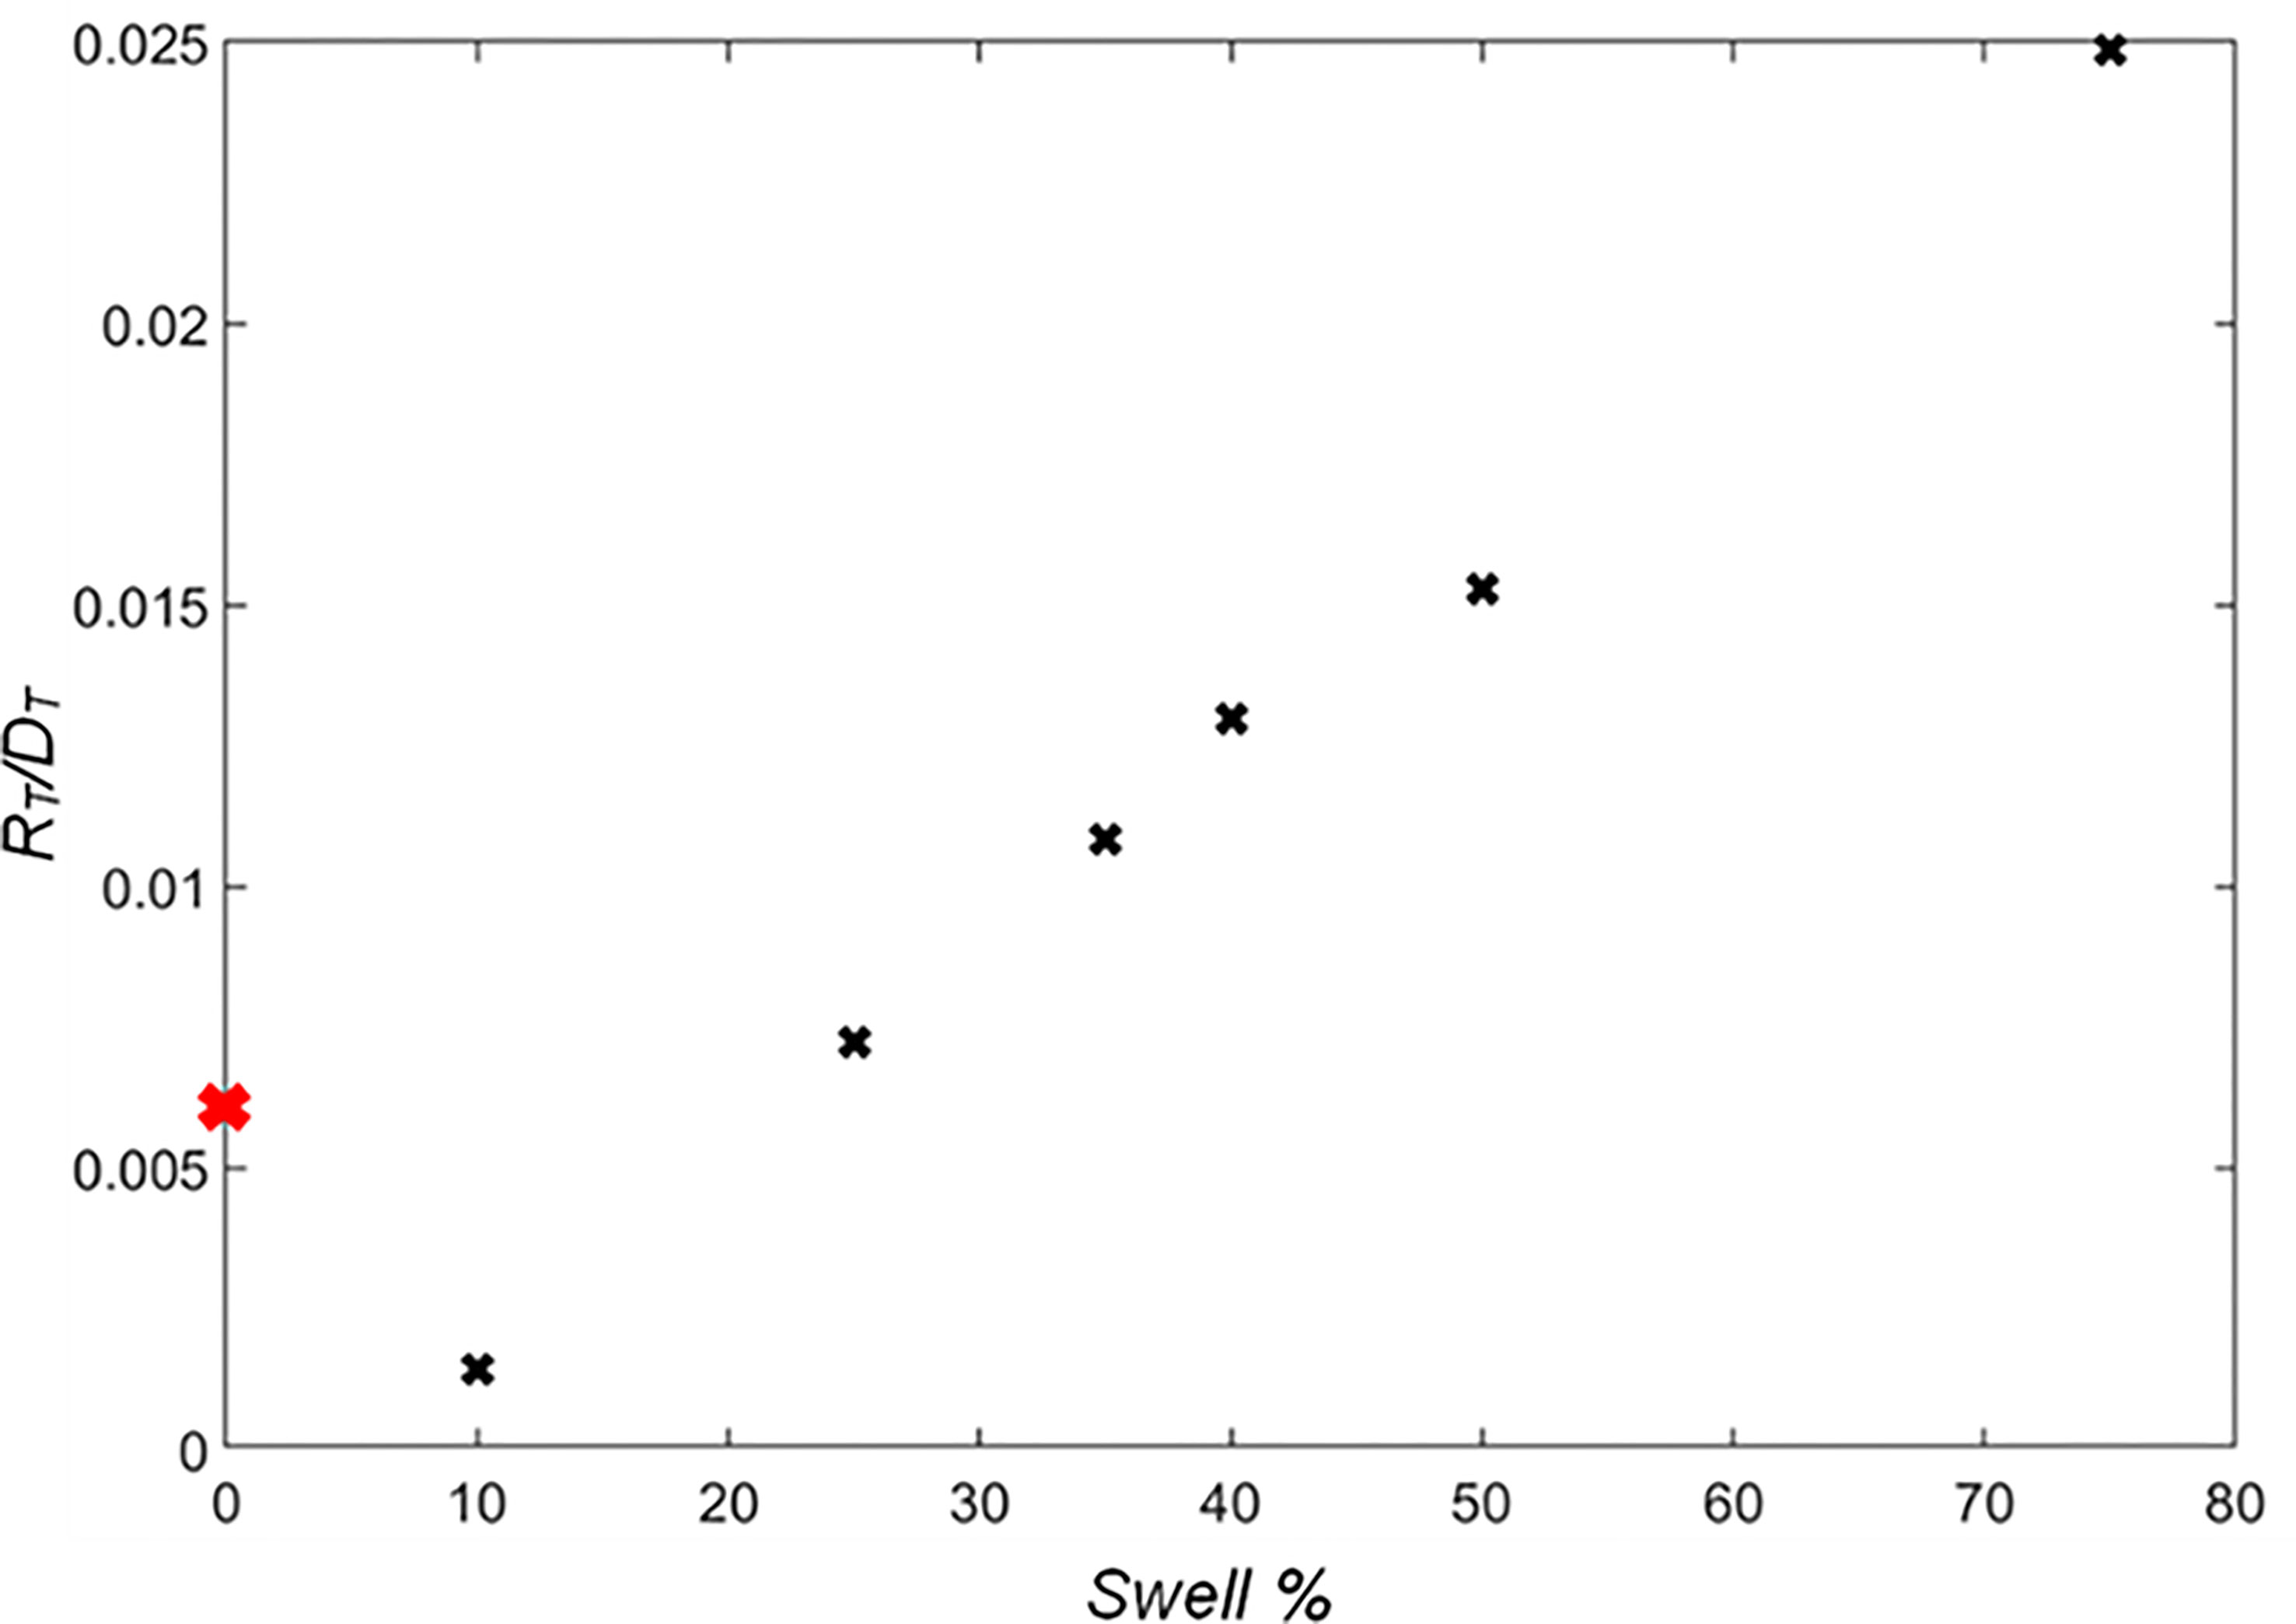
Figure 7 Swell percentage (Swell%) compared with the time duration that wave run-up equals maximum crest level (RT) divided by total storm duration (DT). Black cross represents bimodal conditions and red cross represents unimodal condition.
A direct correlation between the timing of offshore sediment movement and overtopping events can be seen in the case of 10% swell. The offshore sediment deposition has taken place between 6-11 hours of the storm. A significant reduction of run-up events that reach the upper beach face and barrier crest can be seen after the offshore sediment deposition compared to all other cases, leading to less beach face erosion.
Figure 7 presents the total duration of wave run-up that exceeds barrier crest level during a storm (RT) as a fraction of the storm duration (20 hrs) (DT) for storms with different swell percentages. The total time during which the run-up level exceeds barrier crest level steadily increases with increase in swell percentage, and is higher than that from the unimodal storm with the same Hs,Tp, and SWL, with the 10% storm being the only exception, which can also be seen in Figure 6B3. Despite the increased wave run-up for waves with 25-40% swell, increase in sediment overwash (crest reduction as a result) was not found. Two conditions should be satisfied for sediment overwash to occur; the maximum wave run-up height should exceed the barrier crest height; and the bed velocity must exceed the threshold of sediment motion. Therefore, the quantity of sediment overwash may not be directly proportional to total time in which wave run-up exceeds barrier crest.
4.3 Barrier morphodynamic response regimes under storm scenarios
The numerical simulations of gravel barrier morphodynamic change on Profile 1 and Profile 2 under a wide range of unimodal and bimodal storm conditions described in Section 3 resulted in a range of barrier responses; collision regime, the three phases of the overwashing regime and inundation regimes, as described by Sallenger (2000), Orford and Carter (1982) and Orford and Anthony (2011). It should be noted that our simulations did not show the swash regime response. This may be due to the storm conditions and water levels selected in this study being outside the range of conditions required for berm formation (Austin and Masselink, 2006; Buscombe and Masselink, 2006).
According to the numerical simulations, the collision regime was developed under most of the unimodal storm conditions with Tp < 9 s. In these simulations, wave run-up did not reach the upper beach face, irrespective of the SWL. When Tp > 9 s, the profile developed into swash overtopping at Profile 2; however, the collision regime continued to prevail in Profile 1, where the crest height is significantly larger than that of Profile 2. This can be explained by sediment movement along the beach profile taking place only up to the shoreward limit of the wave run-up. Short waves give rise to inherently small run-up heights as a result of energy dissipation from wave breaking in the surf zone before reaching the shoreface. The weak run-up flow tends not to generate notable onshore transport. However, the gravity-driven backwash can carry sediment in the seaward direction along the shoreface, thus eroding the upper beach and depositing sediment below the still waterline to form a submerged berm.
When SWL is large thus leading to smaller freeboards, the overwash regime is developed, especially under storms with Tp > 9 s. If the combined effect of Hs, Tp and SWL is sufficient to generate run-up heights reaching the barrier crest, then crest accumulation occurs under the swash overtopping response mode. This regime was observed for most Hs < 4 m; however, SWL had to be sufficiently large. When Tp is large, wave breaking is confined to the beach’s close proximity, giving rise to energetic run-up flows. These run-up events can carry sediment shoreward along the beach. If SWL is high, then run-up reaches or exceeds the barrier crest. The top part of the beach profile is mostly unsaturated; therefore, a proportion of run-up water infiltrates onto the beach thus generating weaker backwash flows than the run-up. This imbalance between energetic run-up and weaker backwash allows sediment accumulation at the beach crest, although a significant amount of offshore sediment transport still takes place at the shoreface. This leads to the upper shoreface erosion and berm building below the still water line, similar to the collision regime.
Under the highly energetic storms (Hs > 4.0 m, Tp > 9 s), the barrier is subjected to repeated energetic run-up events, which saturates the upper beach area, thus generating strong backwash flows. This, together with high run-up heights exceeding the barrier crest height, removes sediment from the barrier crest and the upper beach and transports sediment offshore. Therefore, there was discrete overwashing under these conditions, with barrier crest height reduction. Previous studies (Polidoro et al., 2018; Masselink et al., 2010) have also shown that increased wave run-up leads to increased barrier saturation, which raises the water table (Masselink et al., 2010), resulting in more significant volumes of backwash from the waves that do not overtop the barrier carrying larger amounts of sediment seaward. Morphodynamics regimes are forced by the combined effect of Hs, Tp and SWL. Antecedent beach profile shape also contributes to this process. Therefore, it is not possible to identify definitive thresholds of Hs, Tp and SWL that initiates the overwash regime shift specifically from ‘crest accumulation’ to ‘crest reduction’. Sluicing overwash was observed for extreme conditions (Hs >4 m, Tp >10 s) on moderate freeboards.
Catastrophic overwashing or Inundation regime was simulated for only the most extreme storms (Hs > 4 m, Tp >10 s) when the freeboard was small (high SWL imposed on large Rc). If the freeboard was small, storms could inundate the barrier even when Hs < 4 m and Tp ≥ 10 s.
Under bimodal storms containing 10% swell, the swash overtopping response prevailed with crest accumulation found. Overall, the morphodynamic change of the barrier was less severe under bimodal storms with 10% swell than that from unimodal wind waves with same Hs. As swell percentage increased, the barrier underwent more severe overwash followed by the reduction of crest height and erosion of the shoreface. For some bimodal storms with 75% swell, a total barrier inundation was seen even when SWL is not excessively high. However, it should be reiterated that it is the combined effect of Hs, Tp, and SWL which determines the morphodynamic regime changes. Under the majority of bimodal storms with swell component greater than 10%, severer morphodynamic responses were found than that of unimodal wind waves with the same Hs.
4.4 Relationship between barrier morphodynamic change and key hydrodynamic parameters
In this section, we utilise the entire HCS barrier evolution simulation database to establish linkages between key hydrodynamic parameters (Hs, Tp, deep water wavelength corresponding to peak wave period, Lp), pre-storm barrier characteristics (freeboard - the vertical distance from the MHWS + storm surge to the maximum barrier crest height, Fb; beach slope tanβ; the pre-storm crest height above 0 mODN, Rc; the post-storm crest height above 0 mODN, Zc) and the morphodynamic response of the barrier.
To enable this, firstly, a set of non-dimensional parameters were developed using Buckingham’s Pi theorem. These were modified on the basis of trial and error to find new non-dimensional quantities which provided the best correlations between hydrodynamic parameters and barrier morphodynamic responses. The parameter that represents the best trends of barrier response to antecedent conditions was ξHs/Fb. Here ξ= (surf similarity parameter in which H0 is the deep-water significant wave height and Lo is the deep-water wavelength. This closely resembles previously derived wave run-up parameters of Battjes (1974) and Overwash Potential of Matias et al. (2012). Despite this, run-up is not explicitly linked to the modes of barrier response in this study as it will not be a suitable parameter to discuss barrier responses during barrier overwashing.
The parameter ξHs/Fb was used to investigate: (i) crest elevation change, in Figure 8, plotting (Zc – Rc)/Rc against ξHs/Fb in section 4.4.1 and (ii) shoreline recession, in Figure 9, plotting X/Rcagainst ξHs/Fbin 4.4.2. Lastly plotting, in Figure 10, (Zc-Rc)/Fb vs. X/Rcexplores the relationship between shoreline recession and crest height change, in section 4.4.3.
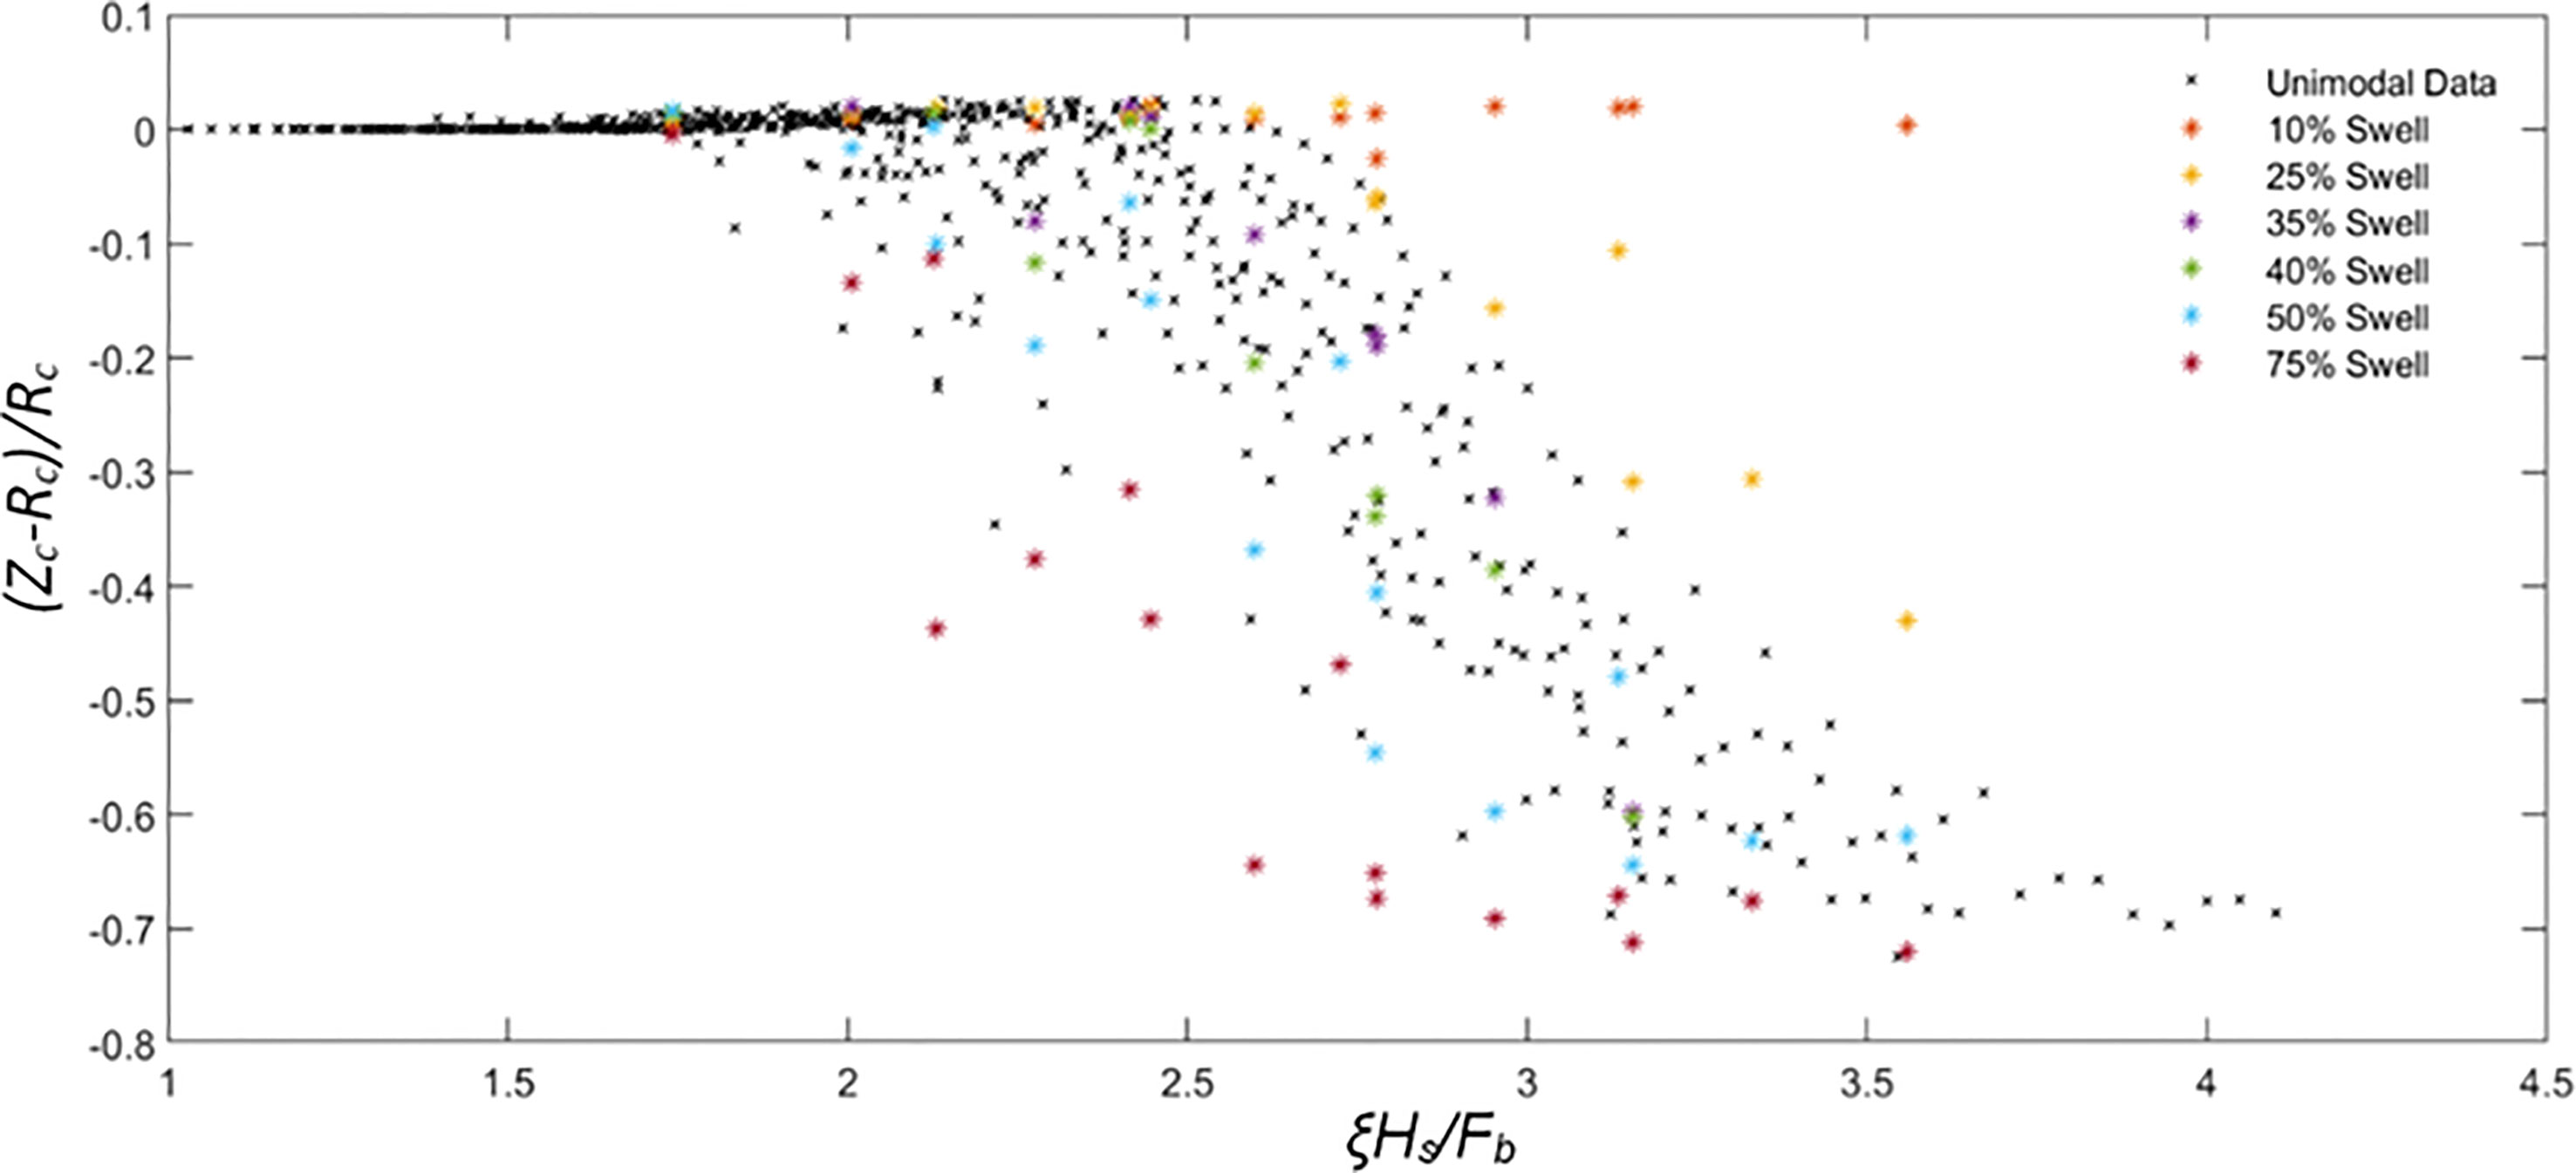
Figure 8 Relationship between non-dimensional post-storm barrier crest height (Zc – Rc)/Rc and non-dimensional parameter (ξHs/Fb) for both unimodal (black crosses) and bimodal (coloured symbols) storm conditions.
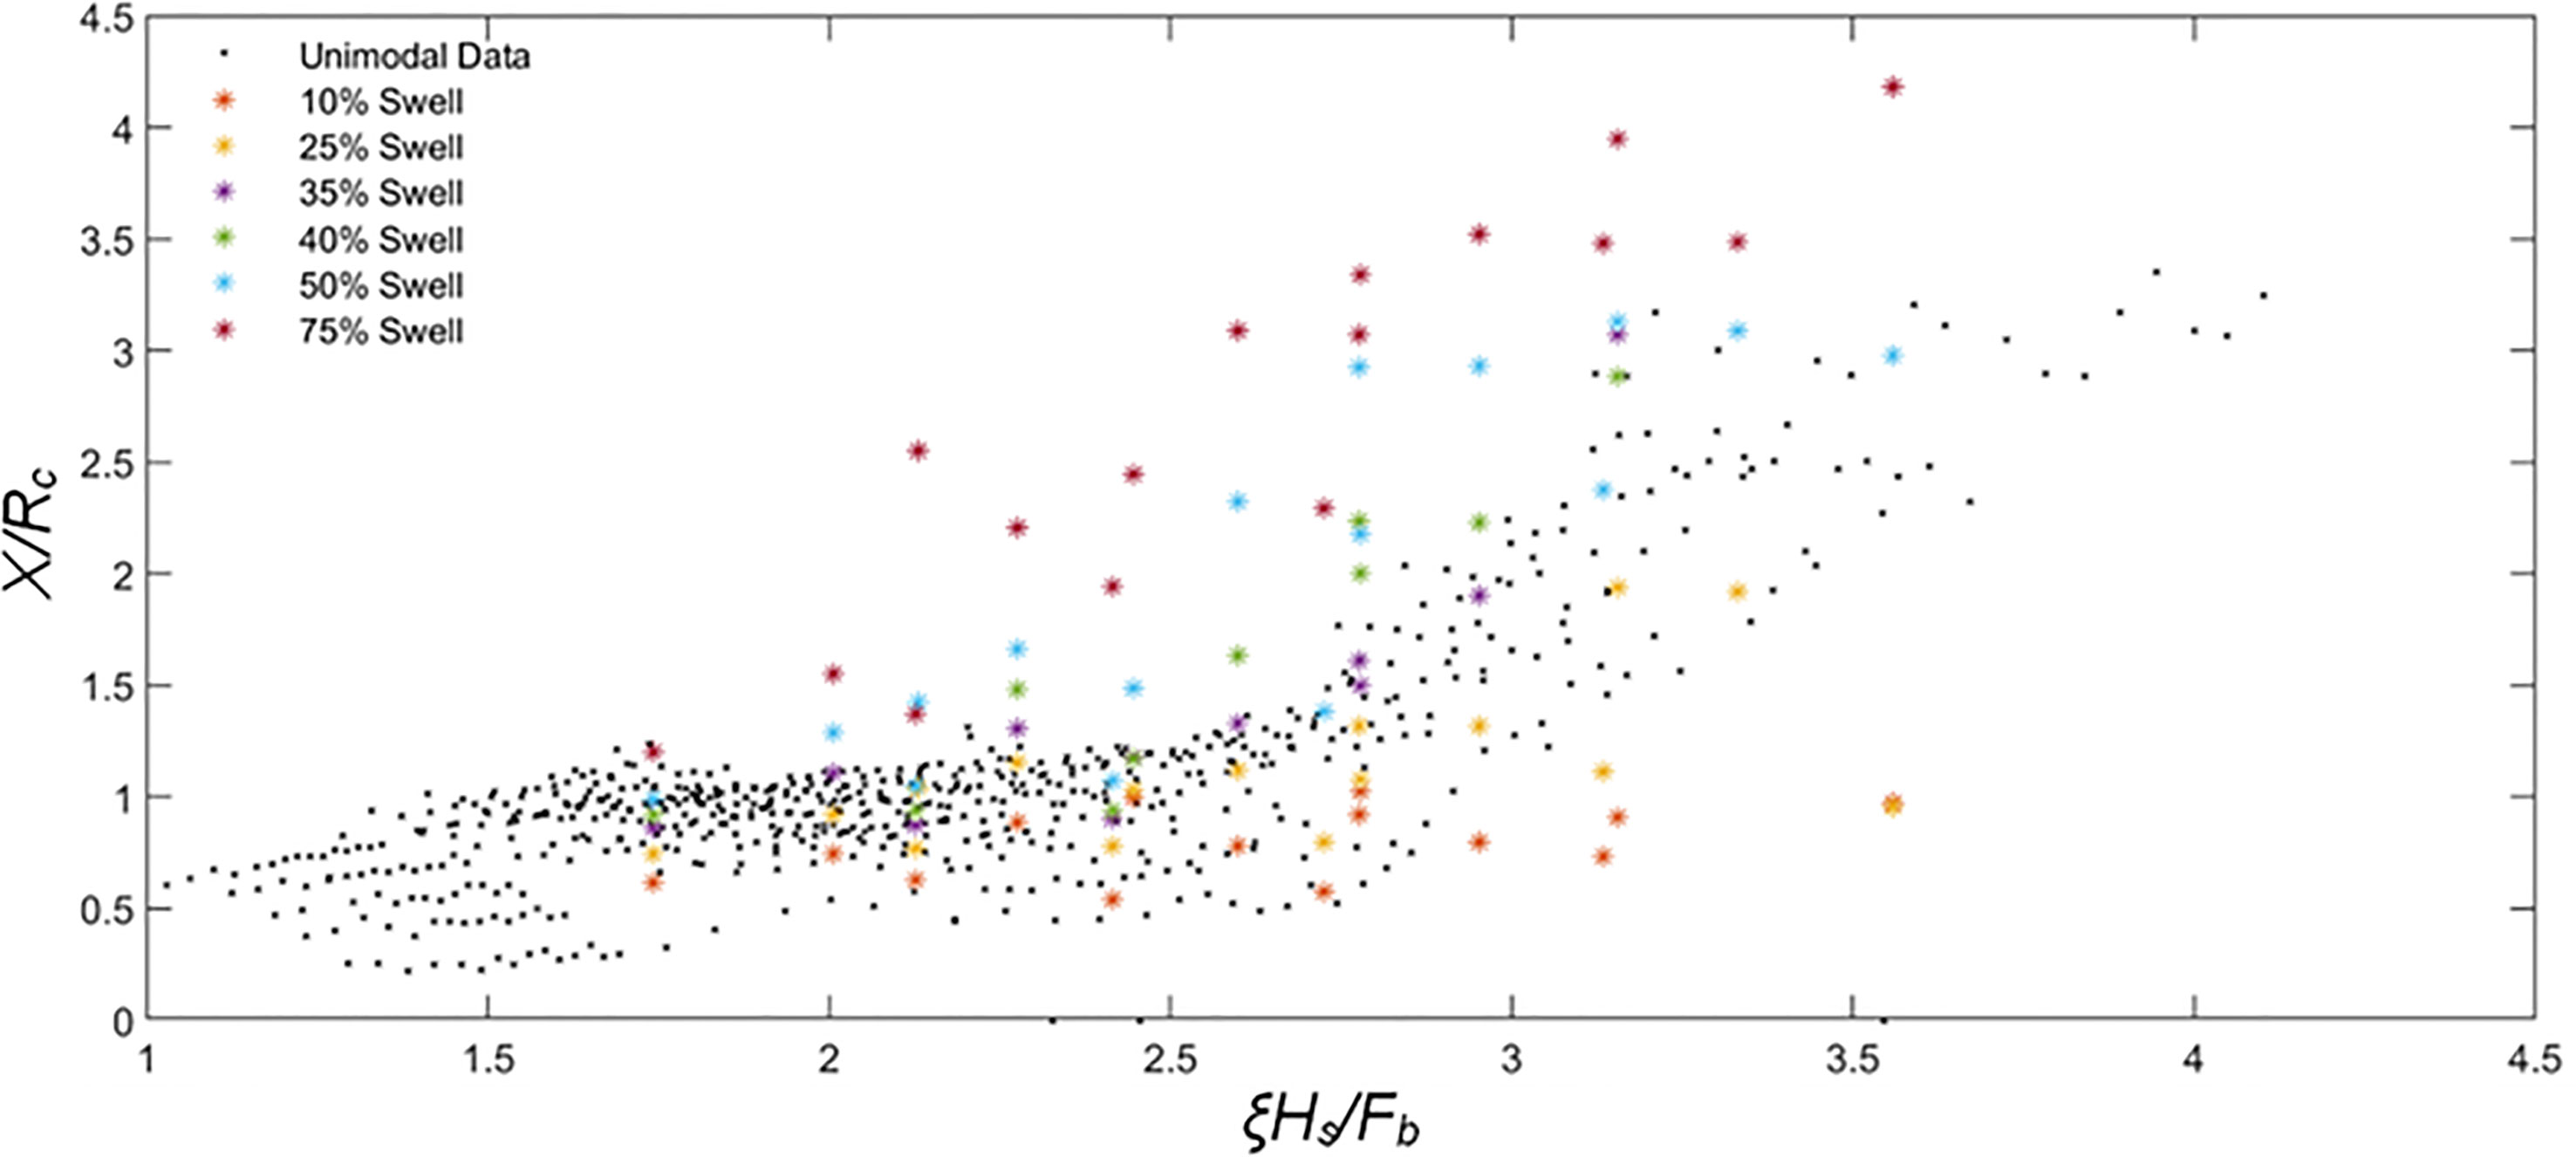
Figure 9 Relationship between non-dimensional X/Rc at MHWS +SWL (X/Rc) and non-dimensional ξHs/Fb for both unimodal (black crosses) and bimodal (coloured symbols) storm conditions.
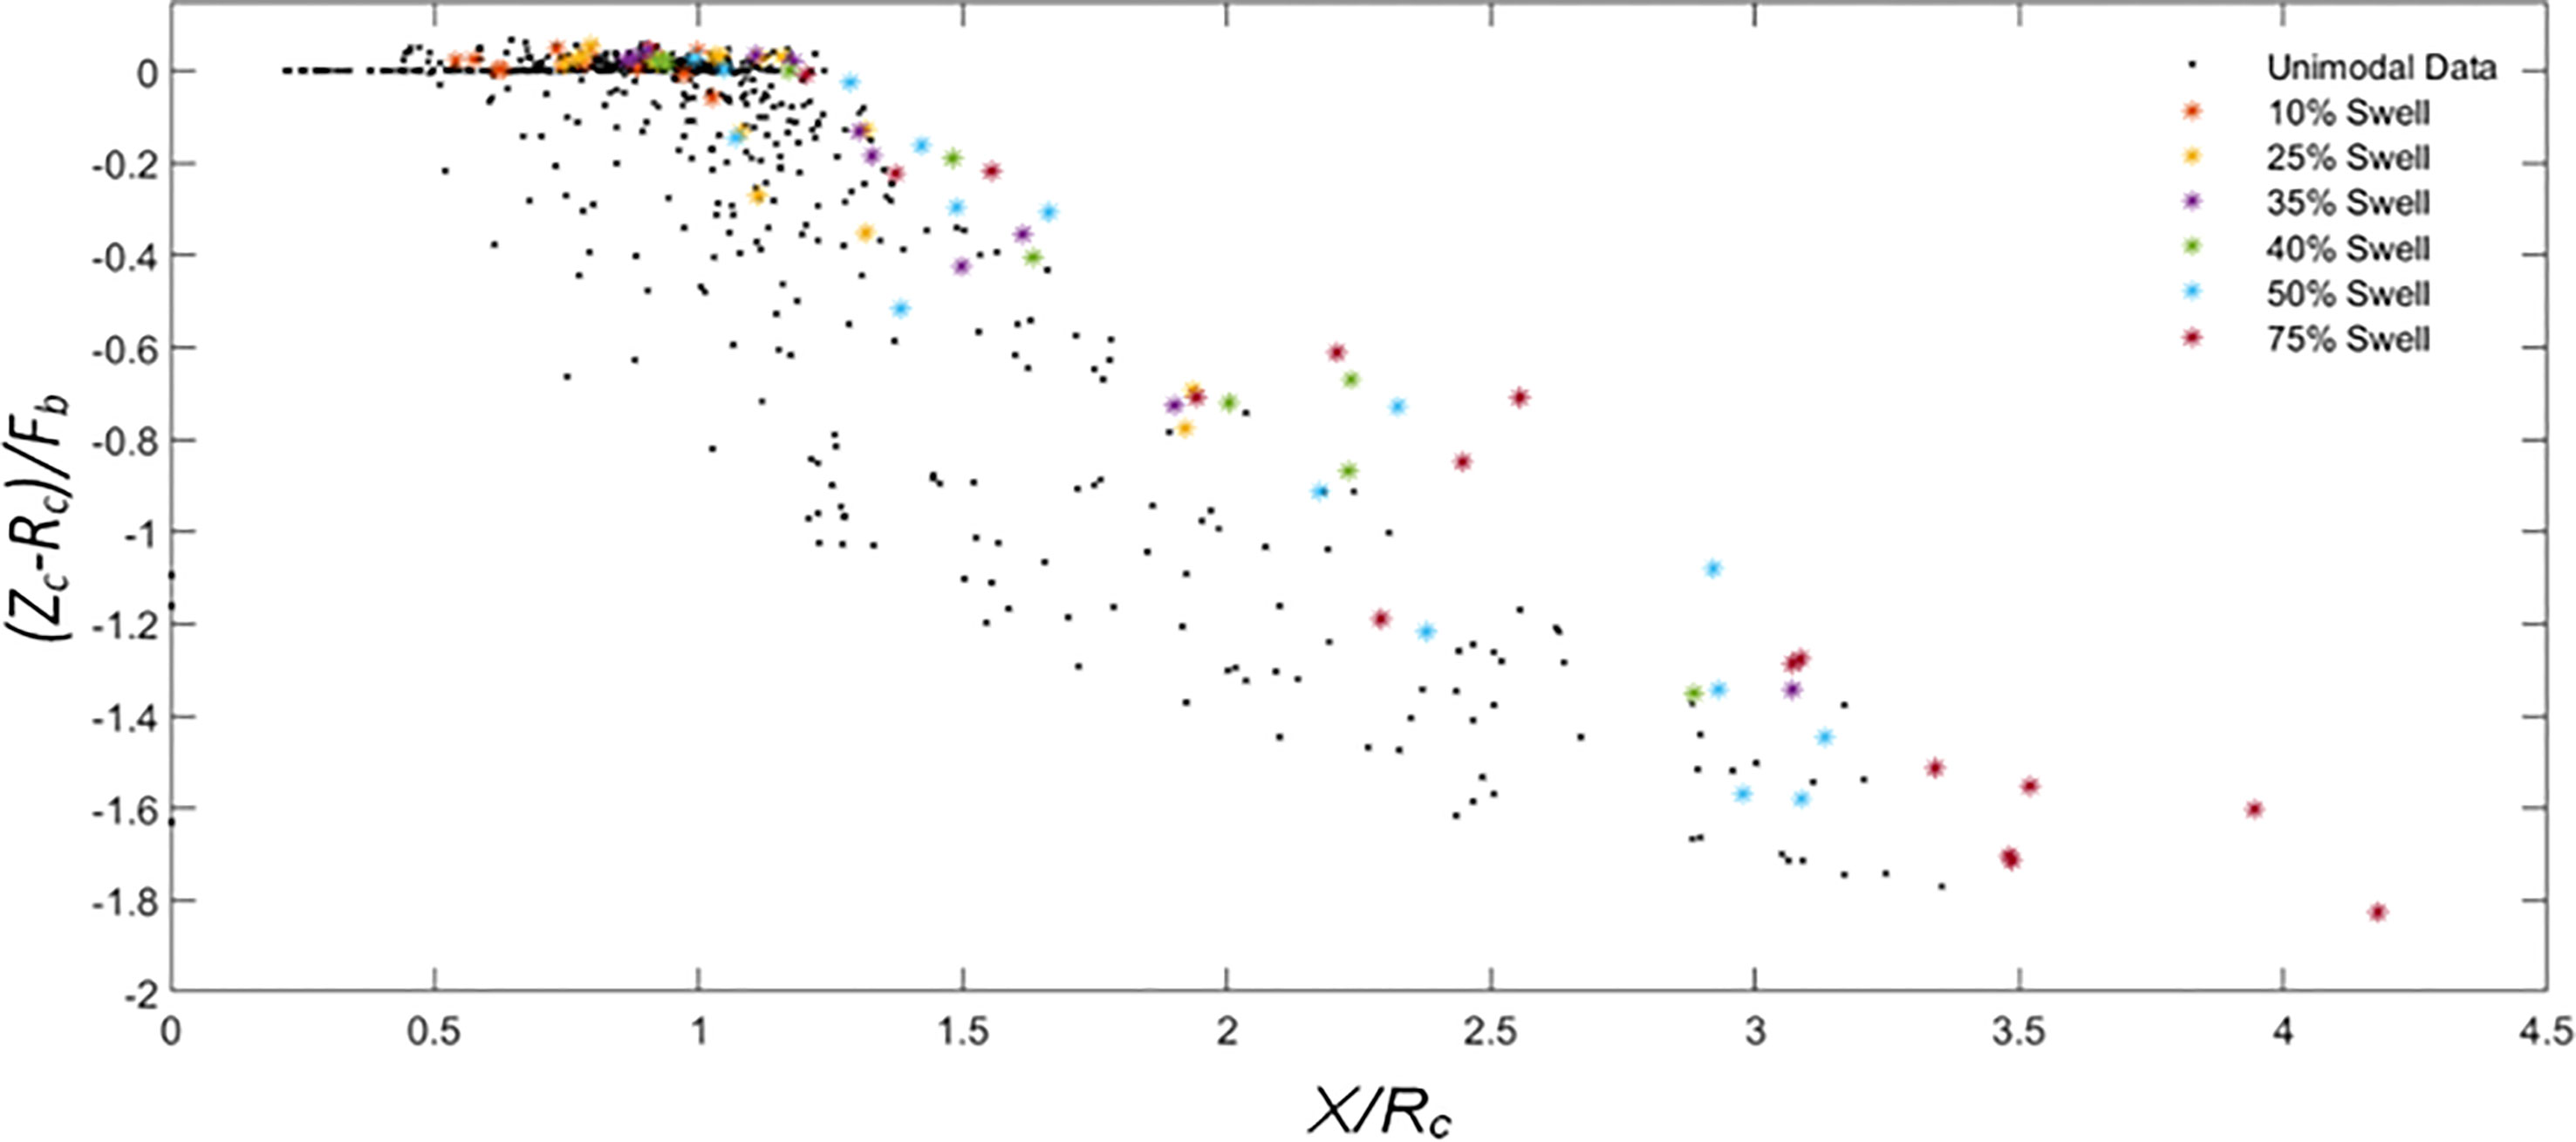
Figure 10 Relationship between non-dimensional shoreline recession at MHWS +SWL (X/Rc) and non-dimensional crest reduction ((Zc – Rc)/Fb) for both unimodal (black crosses) and bimodal (coloured symbols) storm conditions.
4.4.1 Crest elevation change
Figure 8 shows (Zc – Rc)/Rc against ξHs/Fb. As seen in Figure 8, for 0< ξHs/Fb≤1.5, barrier crest change is negligible. This suggested that under those conditions, wave run-up is confined to the foreshore, with no overtopping of the barrier (which corresponds to the collision regime). A close investigation of profile evolution in those cases (e.g., in Figures 4, 6) reveals foreshore erosion followed by seaward sediment transportation and accumulation at the foot of the barrier.
For 1.5 < ξHs/Fb≤ 2.0, most cases show a small increase in crest height as sediment is deposited on the crest due to increased wave run-up and SWL – this corresponds to the swash overtopping response. When 2.0 < ξHs/Fb≤ 2.5, there is gradual crest height reduction under unimodal and bimodal storms. This response corresponds to the discrete overwash response. During this regime, most sediment eroded from the foreshore is carried seaward. The sediment is then deposited below 0 m ODN (Figure 4). When wave run-up is large enough to overwash the barrier, sediment is removed from the barrier crest and transported to the back barrier.
When 2.5 < ξHs/Fb< 3.0 the magnitude of crest lowering continues to increase, and sediment is overwashed further beyond the barrier, under both unimodal and bimodal waves, except from storms with 10% swell. The response regime is now sluicing overwash response. The crest lowering increases with an increase in swell percentage. In this regime, while some sediment eroded from the beach face is transported seaward and deposited below 0 m ODN. A significant volume of sediment from the barrier crest is removed and transported to the back barrier by large overwash events. For ξHs/Fb > 3.0 the response regime can be considered catastrophic overwash response with inundation of the barrier.
4.4.2 Shoreline recession
Figure 9 shows X/Rc vs ξHs/Fb where X is the shoreline recession at MHWS mark after the storm. Non-dimensional shoreline recession steadily increases with ξHs/Fb under unimodal and bimodal storms. When ξHs/Fb < 2.5, the non-dimensional shoreline recession (X/Rc) from unimodal wave conditions gradually increases with the increase of ξHs/Fb and remains between 0.2 and 1.2. This corresponds to the range of ξHs/Fb, giving a small crest change in Figure 8 where sediment transport is predominantly in the offshore direction. For ξHs/Fb > 2.5, X/Rc steadily increases at a faster rate.
This is explained as follows; For ξHs/Fb < 2.5 the barrier response is at the later stages of swash overtopping and the beginning of discrete overwash. Therefore, the barrier crest evolves while scouring take place at the foreshore. Hence, shoreline change is very gradual. For ξHs/Fb > 2.5, barrier response increases from discrete overwashing to sluicing or catastrophic overwashing (barrier rollover) where barrier crest reduction occurs with significant foreshore erosion and back-barrier deposition, which leads to landward movement of shoreline position. When the swell percentage in bimodal waves is less than 25%, shoreline recession is lower than that from unimodal waves. Swell percentages higher than 25% give rise to notably more significant shoreline recession than that from unimodal waves.
4.4.3 Relationship between shoreline recession and crest elevation change
Figure 10 presents (Zc-Rc)/Fb vs. X/Rc, summarising horizontal and vertical barrier cross section change under different morphodynamic regimes under unimodal and bimodal waves. (Zc-Rc)/Fb is inversely proportional to X/Rc except when the barrier is in the collision regime where barrier crest height is static. However, sediment transport processes that govern shoreline recession (offshore transport of sediment eroded from the shoreface) and barrier crest reduction (sediment transported to the back barrier due to overwash) are different.
The results and analysis presented above have been consolidated into a schematisation (Figure 11) which allows identification of the HCS barrier beach systems response to a wide range of modelled storm conditions. It must be noted that this schematic is valid for only HCS and the range of conditions modelled in this study.
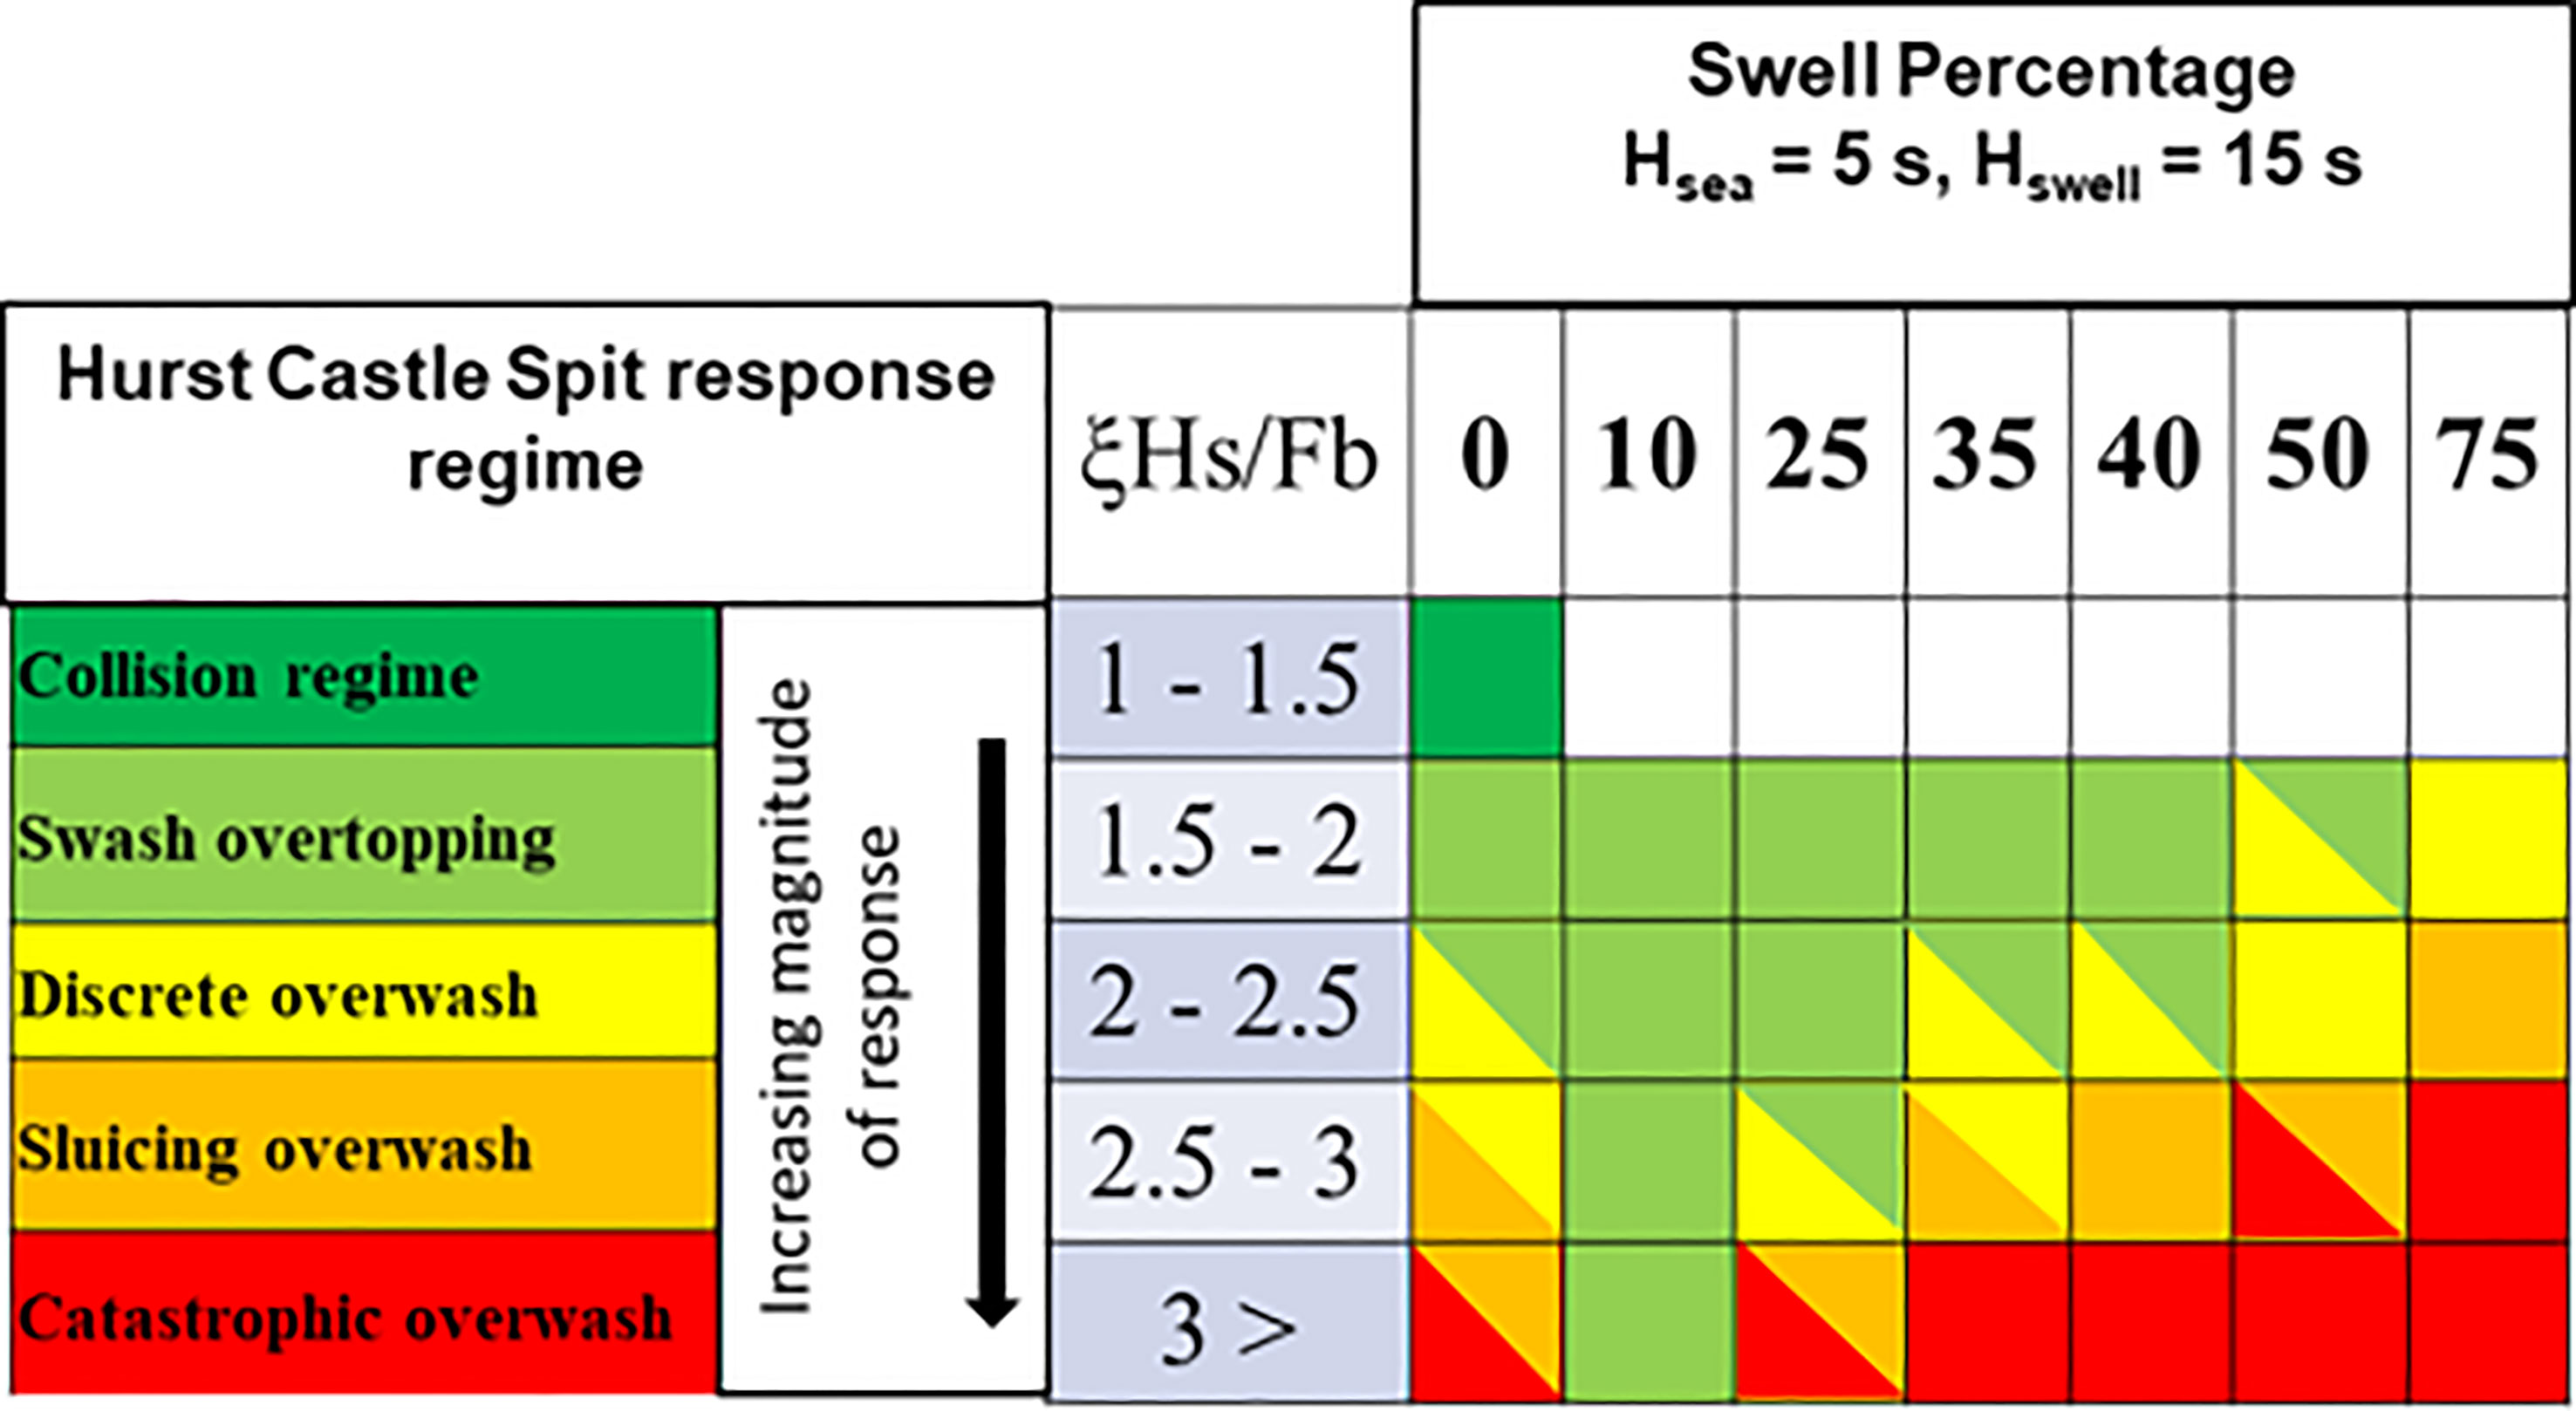
Figure 11 Schematisation of HCS barrier beach system primary response to modelled wave conditions in relation to ξHs/Fb. Diagonal shading indicates mixture of two responses.
As an example case, for a hypothetical storm; Hs= 4.22, Tp = 11 s, SWL = 1.5 mODN considered at HS2 which has a Fb = 3.96 m and tanβ = 0.2. Here ξHs/Fb = 2.30 and the expected unimodal regime response is ‘Overwash regime’, with either ‘swash overtopping’ or ‘discrete overwash’ occurring. For the same conditions but with 50% swell ‘discrete overwash regime’ only is expected. Again, for a 10% swell case only ‘swash overtopping’ is expected
5 Conclusions
In this study a novel approach was taken utilising an extensive synthetic dataset of the morphodynamic evolution of HCS gravel barrier beach simulated by XBeach-G model to investigate morphodynamic states of the barrier. This study considered the impacts of unimodal storms on barrier response regime and directly compared them with bimodal storms. A distillation of the parameters space allowed new insights into barrier response for bimodal storms.
The results reveal that the barrier remains in the collision regime under low-intensity unimodal storms while it transforms into overwash regime under higher-intensity unimodal storms. If the freeboard is small, then, discrete overwash response with crest reduction occurs. Previous studies have highlighted bimodal waves potential to increase wave run-up which was also found here for swell percentage > 10%. Crucially our results also show that bimodal storms increase the rate of sediment being overwashed the back of the barrier. We found swell components exceeding 35% can significantly increase the amount of sediment transported up and over the barrier crest through increased overwash. This occurred irrespective of the values of Hs and Tp for the full range of barrier freeboards modelled in this study. When swell wave component exceeded 50%, the barrier response is the overwash regime. For lower SWL, the response is discrete overwash regime with an increased crest reduction. For larger SWL the response regime changed to sluicing overwash or catastrophic overwash. In contrast, 10% swell components had the opposite effect and resulted in reduced shoreface erosion while only swash overtopping regime was observed. Our results highlighted the importance of antecedent beach conditions in governing barrier response, coupled with SWL. We found Hs controlled the magnitude of a barriers response regime and increasing Tp values were able to increase the severity of response regime from, for example, collision regime to overwash regime.
It should be noted that whilst the above categorization of barrier response regimes was derived from a well-calibrated numerical model of two cross sections at HCS, further investigations at other sites with different barrier cross section and sediment diameters will be helpful as the impact of antecedent beach state cannot be neglected. It should also be noted that defining a hard threshold value for ξHs/Fb that differentiates crest accumulation and crest reduction within the overwash regime is difficult due to the complex dependencies between the hydrodynamics and morphodynamics.
In summary, the modelled gravel barrier beaches regime response increases in severity for higher magnitude combinations of Hs, Tp and SWL. For bimodal storm conditions increasing swell percentage above 10% increases the number of overwashing events and the severity of barrier response.
Lastly, gravel beaches are a common coastal feature in countries in Northern Europe, North America, Japan, Argentina, New Zealand and several other countries (http://www.coastalwiki.org/wiki/Gravel_Beaches). In most countries, bimodal sea states are a common occurrence. Therefore, our findings will have a broader global interest. The methods given in this paper are directly transferable to other barrier beaches subjected to similar conditions worldwide, except for sites with mega-tidal regimes which can alter beach morphodynamics significantly.
Data availability statement
The original contributions presented in the study are included in the article/supplementary materials. Further inquiries can be directed to the corresponding author/s.
Author contributions
KI - Numerical Modelling, Analysis, 1st Draft. HK - Project visualization, contribution to analysis and direction of study, 1st Draft. DP - Project visualization, Review of 1st Draft, contribution to analysis and direction of study. DR - Review of 1st Draft. KO – Analysis. All authors discussed the results and contributed to the final manuscript.
Funding
The project was jointly funded by the Welsh Government's European Social Fund (ESF) programme for East Wales and JBA Consulting, UK. Grant number EP/R51312X/1 for the EPSRC grant.
Acknowledgments
KI acknowledges the Knowledge Economy Skills Scholarship (KESS II) which is a pan-Wales higher level skills initiative led by Bangor University, UK on behalf of the Higher Education Sector in Wales, UK. The project was jointly funded by the Welsh Government’s European Social Fund (ESF) programme for East Wales and JBA Consulting, UK. KI also acknowledges the PhD studentship provided by Swansea University through EPSRC Doctoral Training Partnership to pursue his PhD research. Lastly, the Channel Coastal Observatory is acknowledged for providing field data used for model validation.
Conflict of interest
Author DP was employed by JBA Consulting.
The remaining authors declare that the research was conducted in the absence of any commercial or financial relationships that could be construed as a potential conflict of interest.
Publisher’s note
All claims expressed in this article are solely those of the authors and do not necessarily represent those of their affiliated organizations, or those of the publisher, the editors and the reviewers. Any product that may be evaluated in this article, or claim that may be made by its manufacturer, is not guaranteed or endorsed by the publisher.
References
Almeida L. P., Masselink G., McCall R., Russell P. (2017). Storm overwash of a gravel barrier: Field measurements and XBeach-G modelling. Coast. Eng. 120, 22–35. doi: 10.1016/j.coastaleng.2016.11.009
Austin M. J., Masselink G. (2006). Observations of morphological change and sediment transport on a steep gravel beach. Mar. Geol. 229 (1–2), 59–77. doi: 10.1016/j.margeo.2006.02.003
Battjes J. A. (1974). Runup distributions of waves breaking on slopes. J. Waterway Harbor Coast. Eng. 97 (WW1), 91–114. doi: 10.1061/AWHCAR.0000077
Bergillos R. J., Masselink G., McCall R. T., Ortega-Sánchez M. (2016). Modelling overwash vulnerability along mixed sand-gravel coasts with XBeach-G: case study of playa Granada, southern Spain. Coast. Eng. Proc. 1 (35), 13. doi: 10.9753/icce.v35.sediment.13
Bergillos R. J., Masselink G., Ortega-Sánchez M. (2017). Coupling cross-shore and longshore sediment transport to model storm response along a mixed sand-gravel coast under varying wave directions. Coast. Eng. 129, 93–104. doi: 10.1016/j.coastaleng.2017.09.009
Bradbury A. P. (2000). “Predicting breaching of shingle barrier beaches-recent advances to aid beach management,” in Proceedings of 35th Annual MAFF Conference of River and Coastal Engineers, Vol. 5. 1–05.
Bradbury A. P., Powell K. A. (1992). The short term profile response of shingle spits to storm wave action. Coast. Eng., 2694–2707.
Bradbury A. P., Cope S. N., Prouty D. B. (2005). “Predicting the response of shingle barrier beaches under extreme wave and water level conditions in southern England,” in Coastal dynamics 2005: State of the practice. Barcelona, Spain: Fifth International Conference on Coastal Dynamics, 1–14.
Bradbury A. P., Kidd R. (1998). Hurst Spit stabilisation scheme. design and construction of beach recharge. Proc. 33rd MAFF Conf. River Coast. Engineers 1 (1), 1–1.
Bradbury A. P., Mason T. E. (2014). Review of south coast beach response to wave conditions in the winter of 2013–2014. southeast regional coastal monitoring programme (Southampton: Channel Coastal Observatory, National Oceanography Centre).
Bradbury A. P., Mason T. E., Poate T. (2007). “Implications of the spectral shape of wave conditions for engineering design and coastal hazard assessment–evidence from the English channel,” in Presented at the 10th International Workshop on Wave Hindcasting and Forecasting, North Shore, Oahu, Hawaii. 11–16.
Bradbury A. P., Powell K. A. (1992). The short term profile response of shingle spits to storm wave action. Coast. Eng. Proc. 23, 2694–2707.
Brown S. I., Dickson M. E., Kench P. S., Bergillos R. J. (2019). Modelling gravel barrier response to storms and sudden relative sea-level change using XBeach-G. Mar. Geol. 410, 164–175. doi: 10.1016/j.margeo.2019.01.009
Buscombe D., Masselink G. (2006). Concepts in gravel beach dynamics. Earth-Science Rev. 79 (1-2), 33–52. doi: 10.1016/j.earscirev.2006.06.003
Carter R. W. G., Orford J. D. (1981). Overwash processes along a gravel beach in south-east Ireland. Earth Surface Processes Land. 6 (5), 413–426. doi: 10.1002/esp.3290060503
Carter R. W. G., Orford J. D. (1993). The morphodynamics of coarse clastic beaches and barriers: a short-and long-term perspective. J. Coast. Res. 1993, 158–179.
Ions K., Karunarathna H., Reeve D. E., Pender D. (2021). Gravel barrier beach morphodynamic response to extreme conditions. J. Mar. Sci. Eng. 9 (2), 135. doi: 10.3390/jmse9020135
Jamal M. H., Simmonds D. J., Magar V. (2014). Modelling gravel beach dynamics with XBeach. Coast. Eng. 89, 20–29. doi: 10.1016/j.coastaleng.2014.03.006
Lorang M. S. (2002). Predicting the crest height of a gravel beach. Geomorphology 48 (1-3), 87–101. doi: 10.1016/S0169-555X(02)00176-9
Masselink G., McCall R., Poate T., van Geer P. (2014). Modelling storm response on gravel beaches using XBeach-g,” in Proceedings of the Institution of Civil Engineers-Maritime Engineering, Vol. 167. 173–191 (Thomas Telford Ltd).
Masselink G., Russell P., Blenkinsopp C., Turner I. (2010). Swash zone sediment transport, step dynamics and morphological response on a gravel beach. Mar. Geology 274 (1-4), 50–68.
McCall R. T., Masselink G., Poate T. G., Roelvink J. A., Almeida L. P., Davidson M., et al. (2014). Modelling storm hydrodynamics on gravel beaches with XBeach-g. Coast. Eng. 91, 231–250.
Matias A., Williams J. J., Masselink G., Ferreira Ó. (2012). Overwash threshold for gravel barriers. Coast. Eng. 63, 48–61. doi: 10.1016/j.coastaleng.2011.12.006
McCall R. T., Masselink G., Poate T. G., Roelvink J. A., Almeida L. P. (2015). Modelling the morphodynamics of gravel beaches during storms with XBeach-G. Coast. Eng. 103, 52–66. doi: 10.1016/j.coastaleng.2015.06.002
McCall R. T., Masselink G., Poate T. G., Roelvink J. A., Almeida L. P., Davidson M., et al. (2014). Modelling storm hydrodynamics on gravel beaches with XBeach-G. Coast. Eng. 91, 231–250. doi: 10.1016/j.coastaleng.2014.06.007
Nicholls R., Webber N. (1987). The past, present and future evolution of Hurst castle spit, Hampshire. Prog. Oceanogr. 18 (1-4), 119–137. doi: 10.1016/0079-6611(87)90029-2
Nicholls R., Webber N. (1988). Characteristics of shingle beaches with reference to Christchurch bay, s. England. Coast. Eng. Proc. 21), 142–142. doi: 10.9753/icce.v21.142
Obhrai C., Powell K., Bradbury A. (2009). A laboratory study of overtopping and breaching of shingle barrier beaches. Coast. Eng. 5, 1497–1508. doi: 10.1142/9789814277426_0124
Orford J. D., Anthony E. J. (2011). Extreme events and themorphodynamics of gravel-dominated coastal barriers: Strengtheninguncertain ground. Mar. Geol. 290 (1–4), 41–45. doi: 10.1016/j.margeo.2011.10.005
Orford J. D., Carter R. W. G. (1982). Crestal overtop and washover sedimentation on a fringing sandy gravel barrier coast, carnsore Point,Southeast Ireland. J. Sedimentary Res. 52 (1), 265–278.
Orford J. D., Carter R. W. G., McKenna J., Jennings S. C. (1995). The relationship between the rate of mesoscale sea-level rise and the rate of retreat of swash-aligned gravel-dominated barriers. Mar. Geol. 124 (1-4), 177–186. doi: 10.1016/0025-3227(95)00039-2
Orimoloye S., Karunarathna H., Reeve D. E. (2019). Effects of swell on wave height distribution of energy-conserved bimodal seas. J. Mar. Sci. Eng. 7 (3), 79. doi: 10.3390/jmse7030079
Phillips B. T., Brown J. M., Plater A. J. (2020). Modelling impact of intertidal foreshore evolution on gravel barrier erosion and wave run-up with XBeach-X. J. Mar. Sci. Eng. 8 (11), 914. doi: 10.3390/jmse8110914
Poate T. G., McCall R. T., Masselink G. (2016). A new parameterisation for runup on gravel beaches. Coast. Eng. 117, 176–190. doi: 10.1016/j.coastaleng.2016.08.003
Polidoro A., Pullen T., Dornbusch U. (2014). Wave run-up on shingle beaches–a new method Vol. 68 (Oxford: HR Wallingford). report number - CAS0942-RT001-R05-00.
Polidoro A., Pullen T., Eade J., Mason T., Blanco B., Wyncoll D. (2018). Gravel beach profile response allowing for bimodal sea states. Proc. Institution Civil Engineers-Maritime Eng. 171 (4), 145–166. Thomas Telford Ltd., London. doi: 10.1680/jmaen.2018.11
Polidoro A., Dornbusch U., Pullen T. (2014). “Improved maximum run-up formula for mixed beaches based on field data,” in From sea to shore–meeting the challenges of the sea: (Coasts, marine structures and breakwaters 2013) (ICE Publishing), 389–398.
Pollard J. A., Christie E. K., Spencer T., Brooks S. M. (2022). Gravel barrier resilience to future sea level rise and storms. Mar. Geol. 444, 106709. doi: 10.1016/j.margeo.2021.106709
Powell K. A. (1990). Predicting short-term profile response for shingle beaches (Oxford: HR Wallingford).
Reeve D. E., Chadwick A., Fleming C. (2018). Coastal engineering: Processes, theory and design practice (London: CRC Press), 542.
Roelvink D., Reniers A., van Dongeren A., van Thiel de Vries J., McCall R., Lescinski J. (2009). Modelling storm impacts on beaches, dunes and barrier islands. Coast. Eng. 56 (11–12), 1133–1152. doi: 10.1016/j.coastaleng.2009.08.006
Smit P., Roelvink J. A., van Thiel de Vries J. S. M., McCall R. T., van Dongeren A. R., Zwinkels J. R. (2010). XBeach: Non-hydrostatic model. validation, verification and model description, technical report (Delft University of Technology and Deltares), 59.
Smit P., Zijlema M., Stelling G. (2013). Depth-induced wave breaking in a non-hydrostatic, nearshore wave model. Coast. Eng. 76, 1–16. doi: 10.1016/j.coastaleng.2013.01.008
Stockdon H. F., Holman R. A., Howd P. A., Sallenger A. H. Jr. (2006). Empirical parameterization of setup, swash, and runup. Coast. Eng. 53 (7), 573–588.
Suanez S., Stéphan P., Autret R., Houron J., Floc'h F., David L., et al. (2022). Catastrophic overwash and rapid retreat of a gravel barrier spit during storm events (Sillon de Talbert, north Brittany, France). Earth Surface Processes Land. 47 (8), 2024–2043. doi: 10.1002/esp.5361
Thompson D. A., Karunarathna H., Reeve D. E. (2018). An analysis of swell and bimodality around the south and south-west coastline of England. Natural Hazards Earth System Sci. Discussions, 1–28. doi: 10.5194/nhess-2018-117
Van Hijum E., Pilarczyk K. W. (1982). Gravel beaches: equilibrium profile and longshore transport of coarse material under regular and irregular wave attack (Hydraulics laboratory).
van Rijn L. C. (2007). Unified view of sediment transport by currents and waves. III: Graded beds. J. Hydraulic Eng. 133 (7), 761–775. doi: 10.1061/ASCE0733-94292007133:7761
van Rijn L. C., Walstra D. J., Grasmeijer B., Sutherland J., Pan S., Sierra J. P. (2003). The predictability of cross-shore bed evolution of sandy beaches at the time scale of storms and seasons using process-based profile models. Coast. Eng. 47 (3), 295–327. doi: 10.1016/S0378-3839(02)00120-5
Vettor R., Soares C. G. (2020). A global view on bimodal wave spectra and crossing seas from ERA-interim. Ocean Eng. 210, 107439. doi: 10.1016/j.oceaneng.2020.107439
Vitousek S., Barnard P. L., Fletcher C. H., Frazer N., Erikson L., Storlazzi C. D. (2017). Doubling of coastal flooding frequency within decades due to sea-level rise. Sci. Rep. 7 (1), 1–9. doi: 10.1038/s41598-017-01362-7
Keywords: Gravel barrier, beach erosion, XBeach numerical model, bimodal wave spectrum, sediment transport
Citation: Ions K, Ozdemir K, Pender D, Reeve DE and Karunarathna H (2023) The morphodynamic response of a gravel barrier to unimodal and bimodal storm wave conditions. Front. Mar. Sci. 10:1087771. doi: 10.3389/fmars.2023.1087771
Received: 02 November 2022; Accepted: 20 March 2023;
Published: 25 April 2023.
Edited by:
Roshanka Ranasinghe, IHE Delft Institute for Water Education, NetherlandsReviewed by:
Gerd Masselink, University of Plymouth, United KingdomMatthew John Eliot, Seashore Engineering, Australia
Copyright © 2023 Ions, Ozdemir, Pender, Reeve and Karunarathna. This is an open-access article distributed under the terms of the Creative Commons Attribution License (CC BY). The use, distribution or reproduction in other forums is permitted, provided the original author(s) and the copyright owner(s) are credited and that the original publication in this journal is cited, in accordance with accepted academic practice. No use, distribution or reproduction is permitted which does not comply with these terms.
*Correspondence: Kristian Ions, 920039@swansea.ac.uk