Interannual modulations in sea level rise over tropical Northwest Pacific in satellite altimeter measurements
 Umakanth Uppara
 Jae-Hong Moon
 Chan Joo Jang
 Young-Heon Jo
- 1BK21 School of Earth Environmental Systems, Pusan National University, Busan, Republic of Korea
- 2Department of Oceanography and Marine Research Institute, Pusan National University, Busan, Republic of Korea
- 3Department of Earth and Marine Sciences, Jeju National University, Jejusi, Republic of Korea
- 4Ocean Circulation Research Center, Korea Institute of Ocean Science and Technology, Yeongdo-Gu, Busan, Republic of Korea
- 5Department of Ocean Science, University of Science and Technology, Yuseong-Gu, Daejeon, Republic of Korea
The sea level rise (SLR) estimates in tropical Pacific are dominantly influenced by interannual and interdecadal variations in limited data sets such as satellite altimeter measurements. The Sea Level Anomaly (SLA) trends during 1993–2012 (extensively reported) and 1993–2020 significantly differ with substantial weakening during 1993–2020 over tropical Northwest Pacific (NWP; 0–15°N; 120°E −170°E). An ensemble empirical mode decomposition (EEMD) approach is employed to derive residual SLA by removing the high-frequency SLA variations including the interannual and interdecadal variations. The linear trends estimated from residual SLA provides a better estimate for the trends in SLA. The residual trends have greatly reduced the observed differences in SLA trends between 1993–2012 and 1993–2020. Our analysis suggests that it is the interdecadal variations in SLA that caused the weakening of overall trend during 1993–2020. In particular, the interdecadal trend in SLA over NWP is ≈ −1.73 mm year−1, whereas the trends in total and the residual SLA are estimated as 4.26 mm year−1 and 6.32 mm year−1, respectively. Furthermore, it is observed that there is an in-phase connection between the interannual and the interdecadal variations of SLA associated with La Niña compared with El Niño. Therefore, the non-occurrence of La Niña after 2012 to 2020 possibly has contributed for the decreasing trend in interdecadal variations due to its in-phase connection. In short, the complexity of variations in SLA at different timescales over NWP and the Pacific significantly influences the SLA trend estimates.
1 Introduction
The advent of satellite altimeters has provided near-global measurements of sea level height in recent decades to make realistic estimates of global mean sea level (GMSL) rise (Mitchum et al., 2010; Wenzel and Schröter, 2014). The past two decades noticed a significant sea level rise (SLR) at a rate of 3.7 mm year−1 compared with the SLR of 1.3 mm year−1 during 1901–1970 (Merrifield, 2011; Oppenheimer et al., 2019). However, the GMSL rise largely differs from the regional SLR and the local SLR that are strongly modulated by the coupled ocean dynamics under the influence of climate modes driven by natural and anthropogenic forcing (Cazenave and Llovel, 2010; Stammer et al., 2013; Becker et al., 2014). For example, parts of the tropical Northwest Pacific (NWP) experience SLR in the range of 8–10 mm year-1 during 1993–2012 after the removal of GMSL rise (Figure 1A). Previous researchers suggested the role of wind stress in sea level changes via planetary waves, Ekman pumping, coastal upwelling (Lee and McPhaden, 2008; Timmermann et al., 2010; Nidheesh et al., 2013; Palanisamy et al., 2015; Cha et al., 2018). In general, these changes in Pacific Sea level at interannual and decadal timescales are primarily linked to El Niño/Southern Oscillation (ENSO), Pacific Decadal Oscillation (PDO), and Interdecadal Pacific Oscillation (IPO) (Zhang and Church, 2012; Meehl et al., 2013; Moon et al., 2013; Han et al., 2014; Moon et al., 2015; Meng et al., 2019)
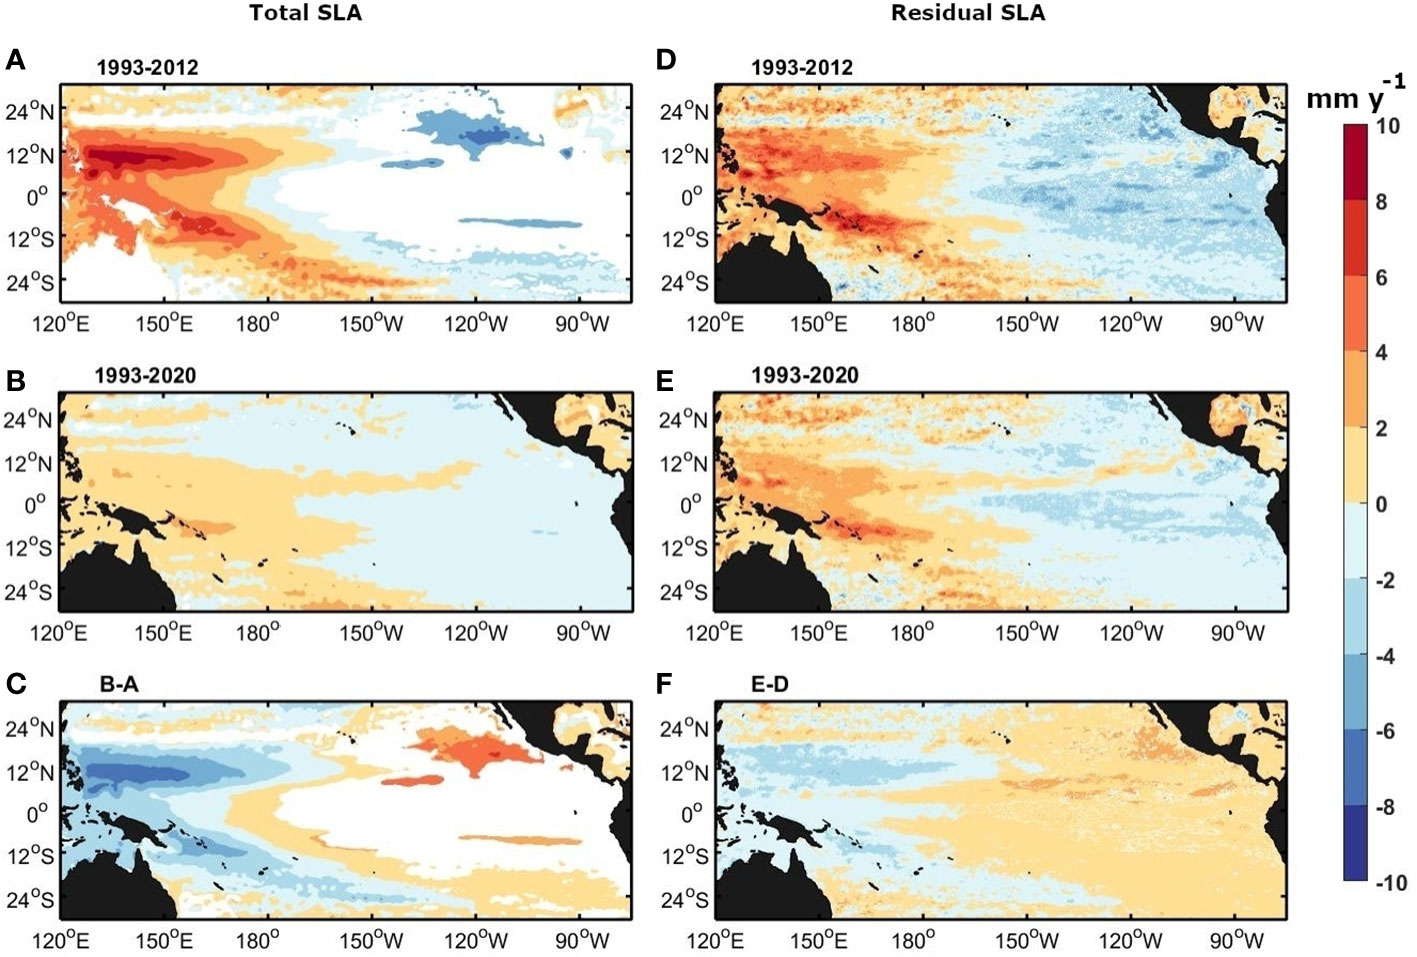
Figure 1 Spatial pattern of linear trend (mm year−1) in altimeter measured SLA for the periods (A) 1993–2012 and (B) 1993–2020 after the removal of GMSL trend, and (C) is (B) – (A). Similarly, (D) and (E) are like (A) and (B); however, trends are estimated using residual SLA and (F) is (E) – (D). Only statistical significance values at 95% confidence level are shown using standard t-test.
A recent study has indicated a weakening of sea level over the west tropical Pacific and an enhancement over the west coast of the United States in recent years as a response to biennial oscillation associated with ENSO and the low-frequency variations of PDO (Hamlington et al., 2016). Similar is the case of SLR even in the latest estimates of trend over the period from 1993 to 2020 (Figure 1B). Strikingly, the weakening of SLR over the parts of NWP is closely three times compared with the trend estimates for the period from 1993 to 2012. It is well documented that, the east–west asymmetry in the SLR in the tropical Pacific is largely modulated by the occurrence of El Niño and La Niña (Mcgregor et al., 2012). On interannual timescales, strong SLR over NWP during La Niña and sharp fall of sea level during El Niño conditions, in response to the prevailing easterly and westerly wind anomalies over the tropical Pacific (Ren et al., 2020). The SLR during La Niña exerts a great threat to the densely populated regions in the west Pacific by causing extreme marine flooding, aggravating coastal erosion, saltwater intrusion into freshwater storage of coastal aquifers (Becker et al., 2012; Chang et al., 2013; Cazenave and Cozannet, 2014), while sharp fall in sea level during El Niño could potentially damage the coral reef and the local ecosystems (Elvan Ampou et al., 2017). Recently, media reports on La Niña during 2021 have indicated a rise of sea levels by approximately 15–20 cm in some parts of western Pacific regions due to high tides across the Pacific.
The present study considered SLA from 1993 to 2020 and during this period, particularly from 2013 to 2020; there is no occurrence of strong La Niña, whereas extreme El Niño event have occurred during 2015–2016. In view of these differences, in the present study, we aim to understand the recent decline in the SLR with a focus on variability associated with El Niño and La Niña at different timescales. Considering the length of the period under study, a major attention is toward the interdecadal variability associated with ENSO and its connection with IPO and the PDO. An ensemble empirical mode decomposition (EEMD) approach is applied to extract dominant periodicities associated with ENSO variability in tropical Pacific SLA. The rest of the paper is organized into different sections as follows. Section 2 describes the data and the methodology adopted in this study. Section 3 discusses the results, while Section 4 presents the summary and the conclusions drawn from the analysis.
2 Data and methodology
2.1 Satellite altimeter and reanalysis data
The satellite altimetry data for SLA from 1993 through 2020 are obtained from Copernicus Marine Environment Monitoring Service (CMEMS). The altimeter measurements from multiple satellites are processed by the Data Unification and Altimeter Combination System (DUACS) and is distributed by CMEMS (Taburet et al., 2019). The data are available on a regular grid with a spatial resolution of 0.25°, and the monthly mean of sea level anomalies are computed with respect to 1993–2012 period. We have used the indices that represent the dominant Pacific climate drivers such as ENSO, IPO, and PDO (https://psl.noaa.gov/gcos_wgsp/Timeseries).
Two different filtering methods are applied to extract interannual and interdecadal variability in the SLA such as Lanczos band pass filter (Duchon, 1979) and EEMD (Huang et al., 1998). Study also examines the SLA composites for El Niño and La Niña events in the total SLA, interannual and interdecadal SLA derived from EEMD. The composites are formed considering 12 months spanning the developing phase of ENSO (from June) to decaying phase (to May). The 12-month means are considered for each ENSO event and during 1993–2020; there is a total of five El Niño events and four La Niña events.
2.2 EEMD
The EEMD approach is the most essential part of the analysis in this study. It is an advanced version of the basic EMD method introduced to decompose the signals into finite number of intrinsic mode functions (IMFs) of different periods and a residual as a representative of long-term non-linear trend in the data (Huang et al., 1998). In EMD, the first IMF is estimated by fitting a cubic spline to the local maximum and the minimum envelops identified in the data. The second IMF is obtained after removing first IMF from the data, and it is repeated until no significant oscillations in the signal (residual mode). However, in EEMD, each IMF is derived as a mean of ensembles of corresponding IMF obtained by EMD in each realization of signal with the addition of varying Gaussian white noise (Huang and Wu, 2008). The ensemble averaging largely reduces the noise and significantly improves the mode separation compared with EMD (Wu and Huang, 2009; Wu et al., 2009). Many researchers have successfully applied EEMD in scientific literature to separate the variability associated with the signal into intrinsic modes corresponding to different periods (Jeong et al., 2022). Particularly, in this study, the application of EEMD is mainly intended to extract interannual and interdecadal variations (IDVs) in SLA and the linear trends associated with residual. In addition, a band pass filter is also used to extract variations in climate indices at interannual, interdecadal, and decadal timescales to support our analysis.
3 Results and discussions
3.1 Trends in Pacific sea level
The SLA data used in this study are relatively short in distinguishing natural and anthropogenic signals in SLR (Ablain et al., 2015; Nicholls et al., 2021). The linear trend estimated over 1993–2020 is broadly a trend of decadal variability. We initially computed the SLR over the tropical Pacific Ocean for the period of 1993–2012 (Figure 1A) and the current period 1993–2020 (Figure 1B) after the removal of GMSL trend (GMSL value is based on the altimeter data; see Table 1). In comparison, an overall weakening of SLR over the western Pacific and an enhancement in SLR over the east Pacific is noticed in Figure 1B. Quantitatively, parts of NWP showing SLR estimates as high as 8–10 mm year−1 in Figure 1A are significantly reduced to 1–2 mm year−1 in Figure 1B. Also noted that, the appearance of positive SLR anomaly over the east Pacific little away from the west coast of America (Figure 1C) is an indication of rising sea levels over the east Pacific in consistent with earlier studies (Hamlington et al., 2020).
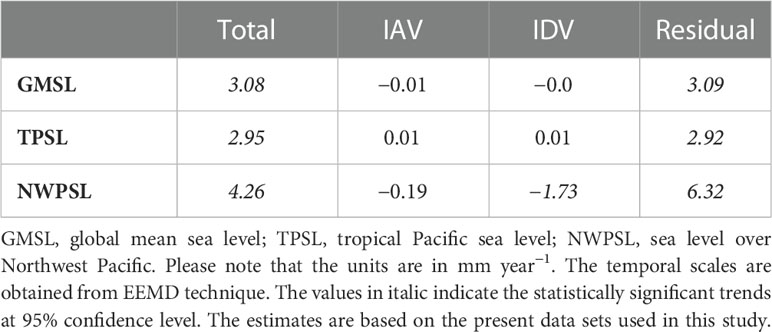
Table 1 Linear trends in SLA over the period 1993–2020 for different spatial and temporal scales.
Furthermore, we attempt to understand the differences in SLR by analyzing the SLA variations at interannual, interdecadal timescales by applying EEMD technique. The IMF modes derived from EEMD contain frequency information, where the combination of 5th and 6th IMF modes represents interannual variations (IAVs) with oscillating periods (2–9 years), 7th and 8th IMF modes represent IDVs with oscillating periods (10–20 years), and the last mode (9th mode in this data set) represents the residual. The residual mode indicates the low-frequency variations in SLA after the removal of variations associated with all frequencies including IAV and IDV modes. The residual trend patterns in Figures 1D, E are strikingly different from Figures 1A, B, with significant weakening of SLR during 1993–2012 (Figure 1D) and the strengthening during 1993–2020 (Figure 1E) over the entire tropical Pacific. The observed difference in trends in SLA between two periods (Figure 1C) over the Northwest Pacific is largely reduced in Figure 1F. This suggests that the trend estimated from residual modes is a better estimate of long-term trend compared with trends estimated from total SLA due to strong influences from IAV and IDV (Cazenave et al., 2014).
We further examined the trend pattern by selectively removing the IAV (IMF 5 and IMF 6) and IDV (IMF 7 and IMF 8) from the total SLA. Therefore, the SLR estimates in Figures 2A, B do not include the variations in SLA at interannual timescales, while Figures 2C, D do not include the variations in SLA at interdecadal timescales. Due to the removal of IAV, the trend in SLA considerably decreased for the period 1993–2012 (Figure 2A) compared with Figure 1A; however, no significant changes in trends for the period 1993–2020 (Figures 1B, 2B). Similarly, in the absence of IDV of SLA, there are no significant differences in SLR over NWP between Figures 1D, 2C, whereas significant rise in SLR in Figure 2D compared with Figure 1B. The trend pattern in Figure 2D appears a close match with residual trend pattern (Figure 1E). This indicates that the length of the data 1993–2020 is longer enough to substantially reduce the IAV influence on trend estimates, whereas the influence of IDVs played a significant role in the reduction of SLR during 1993–2020 (Lyu et al., 2017). This is consistent with trend estimates shown in Table 1 for IDV, which shows a significant negative trend of ≈ −1.73 mm year-1 over the NWP region during the period of 1993–2020.
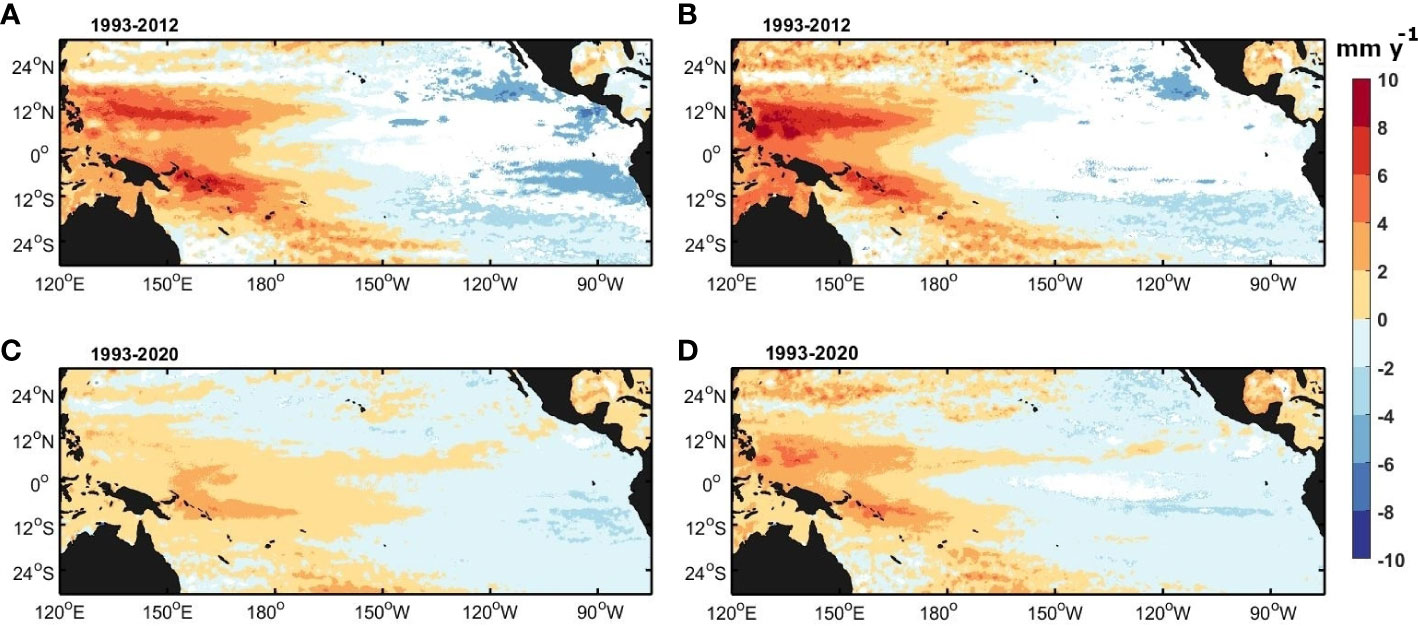
Figure 2 (A, B) Spatial pattern of linear trend (mm year−1) of the SLA after the removal of interannual variations from SLA. The trend patters are shown after the removal of GMSL trend for the period (A) 1993–2012 and (B) 1993–2020. (C, D) are like (A, B); however, trends are estimated after the removal of Interdecadal variations from SLA. Only statistical significance values at 95% confidence level are shown using standard t-test.
3.2 SLA variability over NWP
The SLA variations over NWP are largely dominated by the interannual fluctuations from ENSO in response to El Niño and La Niña (Guo et al., 2022), which can be seen in Figures 3A, B. The SLA time series shows positive SLA persistent over longer duration during La Niña and adjoining neutral years than a sharp dip in SLA during El Niño (Figure 3A). The residual mode overlaid on the SLA time series clearly indicates a rising trend. A close match between interannual SLA mode (Figure 3B) and the observed SLA (Figure 3A) suggests dominant interannual fluctuations as mentioned earlier. The SLA over NWP exhibits strong negative correlations with ENSO (−0.87 at lag-0), IPO (−0.84 at lag-0) while the slightly weak correlation with PDO (−0.64 at lag-3 while −0.58 at lag-0), which are statistically significant (Table 2). The bar diagram in Figure 4 pictorially represents the negative correlation between the NWP SLA with the ENSO (Nino34 index) as well as with the PDO (PDO index). The correlations shown in Table 2 are not lag-0 correlations; these are maximum correlations with lag and are negatively correlated. Here, positive lag indicates a leading climate mode index with respect to SLA over NWP. Despite the low amplitude of variations, both interdecadal and the detrended residual (decadal) variations (Figure 3B) significantly influences the long-term trend estimated. For example, the observed decreasing trend in interdecadal mode as discussed in section 2.1 is a result of change in phase of IDVs from positive during 1994–2012 to negative during 2013–2020. Similarly, the negative amplitude of decadal variations noted from the year 2015 (detrended residual, Figure 3B) also have reinforced the recent decrease in SLA trend (Sun et al., 2017).
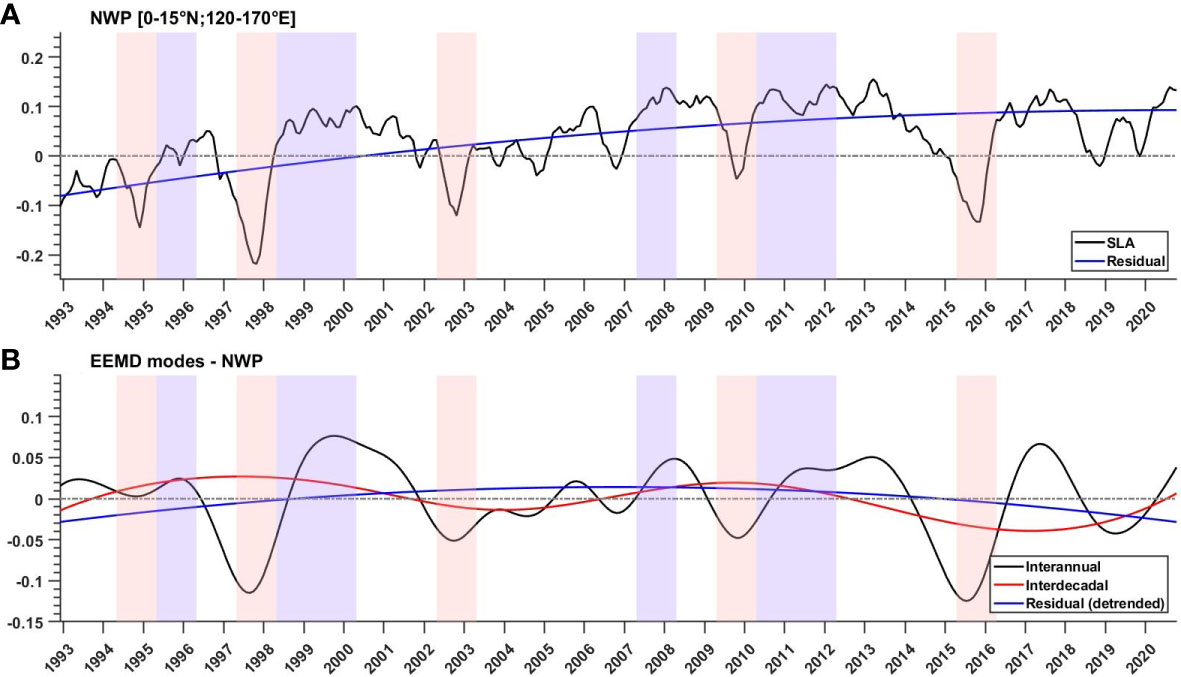
Figure 3 The time series shows the averaged SLA over the NWP (0–15°N; 120E° −170°E) region for the period 1993–2020. (A) Time series of SLA, the residual; (B) EEMD modes such interannual and interdecadal time series and detrended residual. The light color shades of rectangular boxes indicate La Niña (light blue) and El Niño (light pink) years.
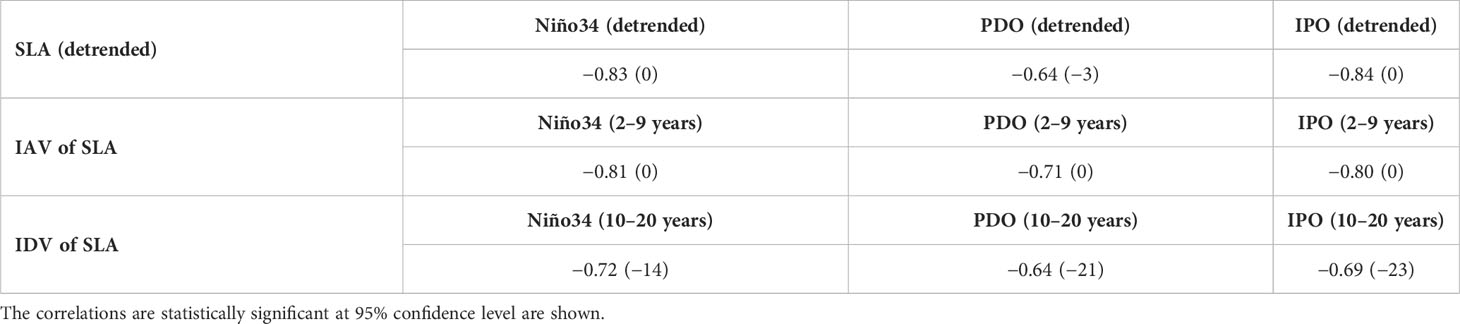
Table 2 The maximum correlations at different lags (in months) between modes of SLA variations derived from EEMD and the climate indices.
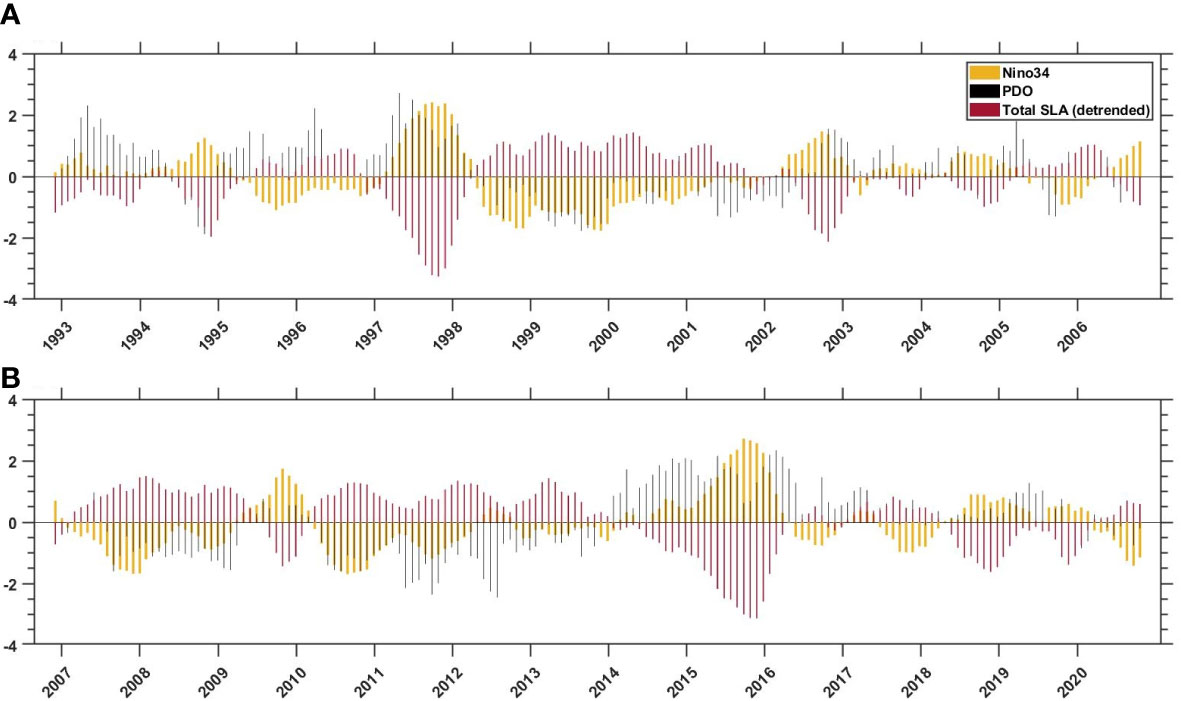
Figure 4 Bar plot of standardized SLA for the period 1993-2020 over the NWP (0 – 15°N; 120 E° -170° E), and the standardized ENSO Nino34 index and PDO index. For clarity, the period 1993-2020 is spit into two equal periods i.e. 1993 - 2006 as in (A) and 2007-2020 as in (B).
In addition, we have estimated the lag correlations between interannual and interdecadal modes of SLA over NWP with the corresponding frequencies (after bandpass filtering) of climate indices. The filtering of climate indices is based on the power spectrum of SLA over the NWP region (Figure 5) along with power spectrum for different modes of SLA derived from EEMD. The spectral power of SLA at interannual timescales (< 10 years) is significantly higher than at interdecadal (> 10 years, less than ≈ 20 years) and decadal timescales > 20 years (residual, not shown). The correlations computed between the SLA modes and the bandpass-filtered indices of ENSO, PDO, and IPO show interannual correlations peaks at lag-0 with ENSO (−0.81), IPO (−0.80), and PDO (−0.71), respectively, while the interdecadal correlations peaks at negative (≈ 1 year or more) lags considering the oscillatory and the low-frequency nature of variations at interdecadal timescales (Table 2). The interdecadal correlations at lag-0 are week such as −0.61, −0.45, and −0.43, respectively, with ENSO, PDO, and IPO. In contrast, the negative lag correlations are slightly strong with ENSO (−0.72 at lag-14), PDO (−0.64 at lag-21), and IPO (−0.69 at lag-23), respectively, as shown in Table 2.
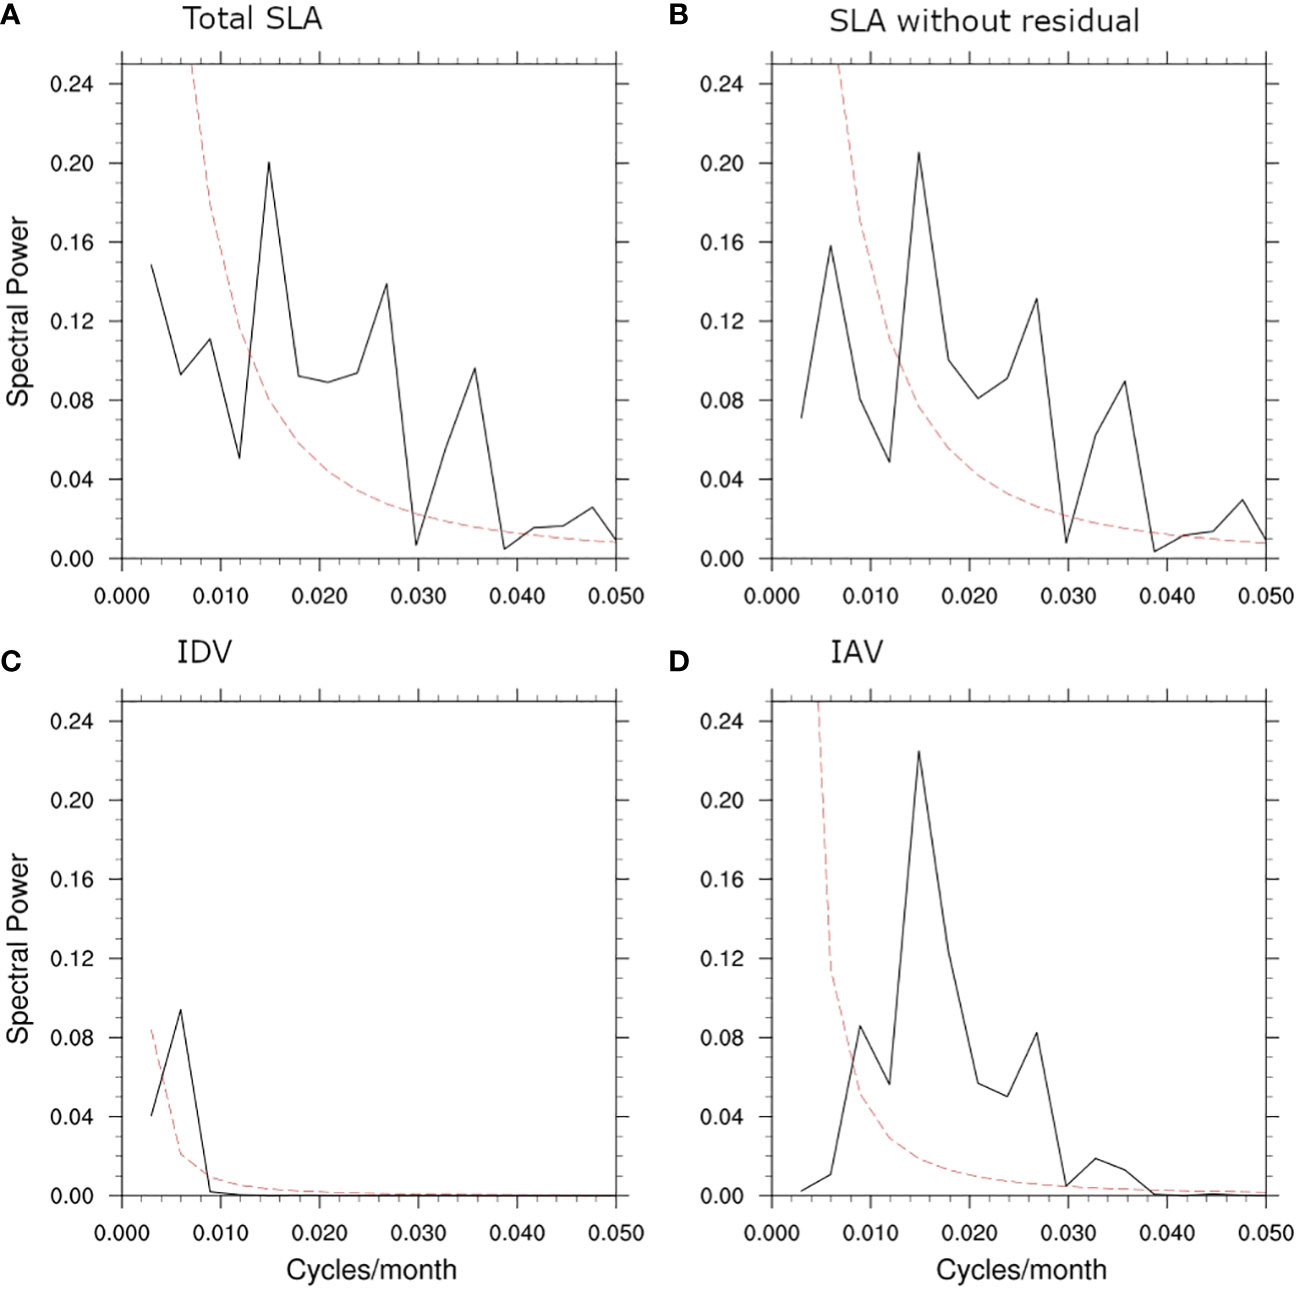
Figure 5 The power spectra of SLA over the NWP region for different cases. (A) Total SLA, (B) SLA after the removal of residual, and (C, D) for the interdecadal and interannual SLA. The dashed line (red) indicates the red noise spectra.
3.3 Interdecadal modulation of ENSO influence on SLA
The east–west asymmetry in SLR in the tropical Pacific is largely attributed to the ENSO, that is, the occurrence of El Niño and La Niña events. During 1993–2020, there are a total of five El Niño events such as 1994–1995, 1997–1998, 2002–2003, 2009–2010, 2015–2016, and four La Niña year events 1995–1996, 1998–2000, 2007–2008, 2010–2012 occurred. Out of these events, there are two La Niña events spanning over 2 years, that is, 1998–2000 and 2010–2012. Currently, this year is a likely extension of La Niña conditions from 2021 to 2023, that is, a triple La Niña event likely to form, and it will be more common in a warming environment as experts suggested. Figure 6 shows the mean composite maps of SLA during El Niño, and La Niña and the pattern of SLA during La Niña (Figure 6D) closely resemble the observed trend pattern in SLA (Figure 1). Although both El Niño and La Niña patterns look similar but opposite (Figures 6A, D), slightly higher magnitude of positive SLA is observed during La Niña to the west of 150°E between 20°S and 20°N compared with magnitude of negative anomalies during El Niño. Furthermore, a slight westward shift of negative SLA across the equator toward the central Pacific in La Niña compared with El Niño. The frequency of occurrence and the duration of these events certainly impact the variations in SLA, specifically over western Pacific.
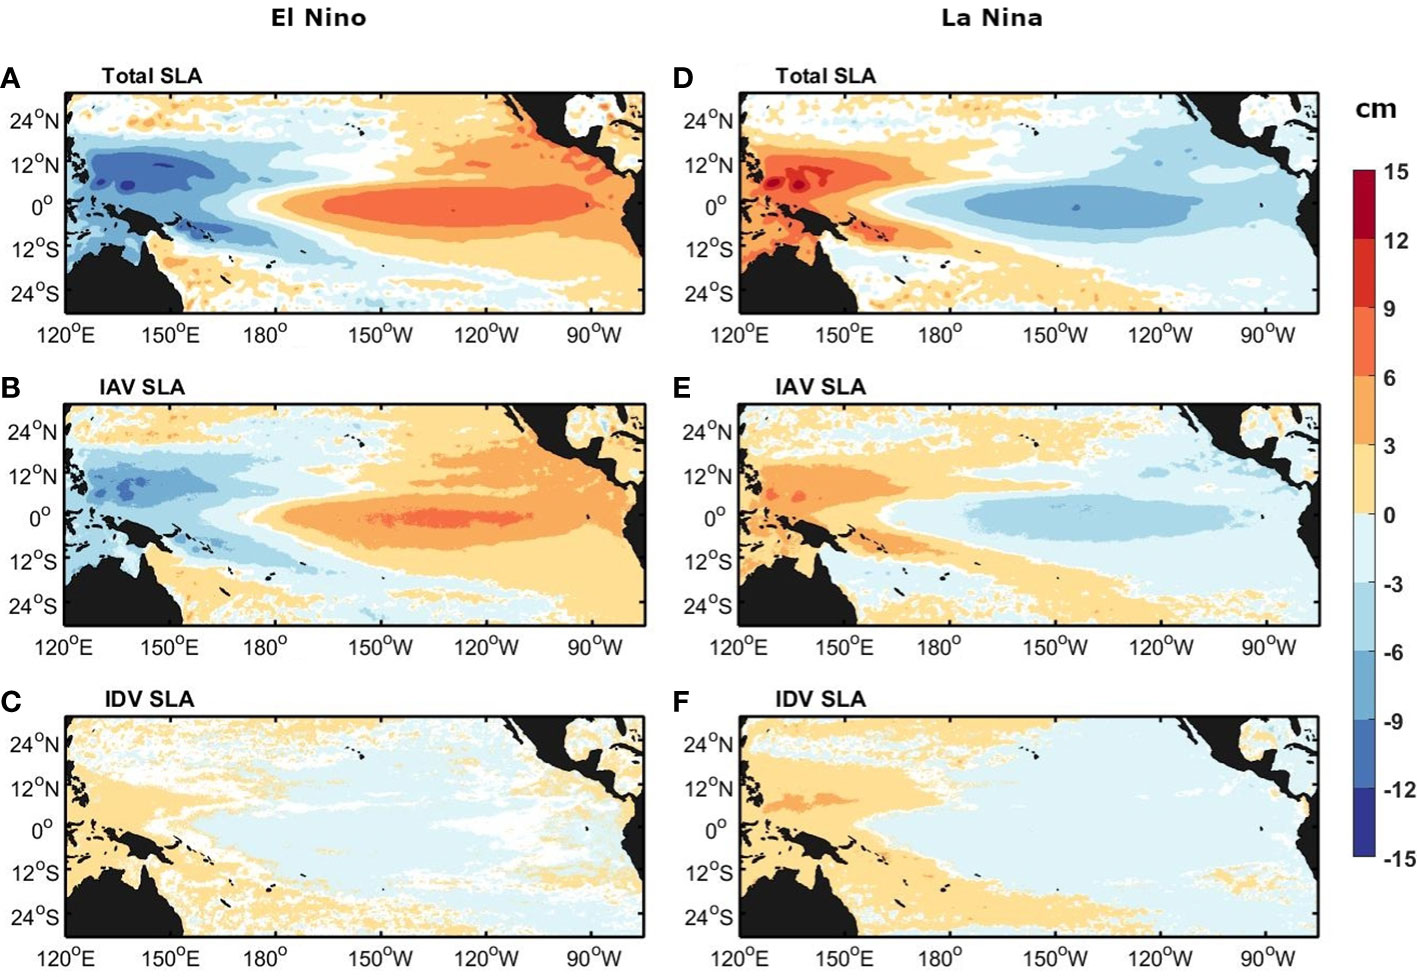
Figure 6 Mean SLA pattern during (A) El Niño (1994–1995, 1997–1998, 2002–2003, 2009–2010, and 2015–2016) and (D) La Niña (1995–1996, 1998–2000, 2007–2008, and 2010–2012) events in the period 1993–2020. Only statistical significance values at 95% confidence level are shown using standard t-test. The SLAs are detrended before making the composites. Like (A) and (D), the El Niño and the La Niña composites of SLA are derived from interannual (B) and (E) and interdecadal (C) and (F) variations of SLA. The units are in cm.
We further examine El Niño and La Niña mean composite maps of SLA derived from interannual and interdecadal modes of SLA from EEMD. The interannual SLA pattern (Figures 6B, E) shows a significant reduction in the magnitude of anomalies in both El Niño and La Niña; however, both the patterns look very much like the total SLA pattens shown in Figures 6A, D. However, the interdecadal mean patterns during El Niño and La Niña show notable differences (Figures 6C, F). El Niño pattern shows negative SLA over the central Pacific while positive anomalies on either side of it in contrast to the interannual and the total SLA mean patterns. It resembles a central Pacific El Niño–type response in SLA and is consistent with earlier studies suggesting the role of decadal anomalies in modulating the frequency of central Pacific El Niño (Di Lorenzo et al., 2010; Sullivan et al., 2016). However, the mean pattern of SLA during La Niña (Figure 6F) is in phase with the interannual, and the total SLA mean patterns, although considerably weak magnitude. Therefore, the occurrence of La Niña may partly influence the estimated trends in the interdecadal SLA due to its in-phase connection. In general, La Niña induces positive SLA over the west Pacific, the non-occurrence of La Niña after 2012 until 2020, might have contributed for the observed decreasing trend in interdecadal SLA. The present analysis suggests the complexity of influences on west pacific SLA by interannual and IDVs in the limited data sets and reiterates the dominant role of IAVs arising from ENSO. Especially, the more frequent and long-duration La Niña events, as suggested in literature, will pose a severe threat to the coastal regions in the west Pacific.
4 Conclusions
The trends in SLA over the tropical Pacific during 1993–2012 and 1993–2020 are significantly different. Quantitatively, the trend over NWP during 1993–2020 shows SLR as low as 1–2 mm year-1 compared with 8–10 mm year-1 during 1993–2012. These differences in the SLA trends are significantly reduced when the trends are estimated from the residual SLA. The residual SLA is derived from EEMD approach after removing high-frequency variations in SLA including the interannual and IDVs. It is observed that the removal of IDVs alone from total SLA does not produce the decreasing trend observed during 1993–2020. This shows that the decreasing trend is due to the IDVs, and it is estimated that the trend in IDV of SLA is approximately −1.73 mm year−1. The power spectrum of total SLA and interannual and interdecadal modes from EMMD indicates two distinct periods (2–9 years and 10–20 years) in SLA, and they likely coincide with periodicities of climate models such as ENSO and IPO.
The total and the interannual correlations of SLA over NWP with climate indices are negative and strongly correlated with ENSO and IPO than the PDO. At interdecadal timescales, the lag-0 correlations are significantly week, whereas the maximum correlations are observed at negative lags. The analysis of composite maps of SLA during El Niño and La Niña indicates that La Niña composite closely resembles the trend patten that is observed during recent decades. The interesting result from the analysis is the difference in the interdecadal modulation of El Niño and La Niña on SLA. The interdecadal component of SLA during La Niña is in phase with the interannual component, whereas El Niño interdecadal component resembles a central Pacific type of SLA pattern compared with the interannual SLA pattern of canonical El Niño. This in phase connection between interannual and IDVs during La Niña might have resulted in the recent decrease in SLR due to non-occurrence of La Niña after 2012 until 2020. These results suggest the important role of ENSO events in modulating the SLR over west Pacific and in particular about the La Niña events and their growing influence on SLR rise under the warming.
Data availability statement
The original contributions presented in the study are included in the article/supplementary material. Further inquiries can be directed to the corresponding author.
Author contributions
Conceptualization: UU and Y-HJ. Data curation: UU. Methodology: UU and Y-HJ. Formal analysis: UU. Writing-original draft: UU. Writing-review and editing: UU, J-HM, CJ and Y-HJ. Supervision: Y-HJ. All authors contributed to the article and approved the submitted version.
Funding
This study was supported by the National Research Foundation of Korea (NRF) grant funded by the Korea government (MSIP) (NRF- 2018R1A2B2006555) and the project titled “Development of technology using analysis of ocean satellite images” (20210046).
Conflict of interest
The authors declare that the research was conducted in the absence of any commercial or financial relationships that could be construed as a potential conflict of interest.
Publisher’s note
All claims expressed in this article are solely those of the authors and do not necessarily represent those of their affiliated organizations, or those of the publisher, the editors and the reviewers. Any product that may be evaluated in this article, or claim that may be made by its manufacturer, is not guaranteed or endorsed by the publisher.
References
Ablain M., Cazenave A., Larnicol G., Balmaseda M., Cipollini P., Faugère Y., et al. (2015). Improved sea level record over the satellite altimetry era, (1993-2010) from the climate change initiative project. Ocean Sci. 11, 67–82. doi: 10.5194/os-11-67-2015
Becker M., Karpytchev M., Lennartz-Sassinek S. (2014). Long-term sea level trends: Natural or anthropogenic? Geophys. Res. Lett. 41, 5571–5580. doi: 10.1002/2014GL061027
Becker M., Meyssignac B., Letetrel C., Llovel W., Cazenave A., Delcroix T. (2012). Sea Level variations at tropical pacific islands since 1950. Glob. Planet. Change 80–81, 85–98. doi: 10.1016/j.gloplacha.2011.09.004
Cazenave A., Cozannet G. (2014). Sea Level rise and its coastal impacts. Earth’s Futur. 2, 15–34. doi: 10.1002/2013ef000188
Cazenave A., Dieng H. B., Meyssignac B., Von Schuckmann K., Decharme B., Berthier E. (2014). The rate of sea-level rise. Nat. Clim. Change 4, 358–361. doi: 10.1038/nclimate2159
Cazenave A., Llovel W. (2010). Contemporary sea level rise. Ann. Rev. Mar. Sci. 2, 145–173. doi: 10.1146/annurev-marine-120308-081105
Cha S. C., Moon J. H., Song Y. T. (2018). A recent shift toward an El niño-like ocean state in the tropical pacific and the resumption of ocean warming. Geophys. Res. Lett. 45, 11,885–11,894. doi: 10.1029/2018GL080651
Chang Y. T., Du L., Zhang S. W., Huang P. F. (2013). Sea Level variations in the tropical pacific ocean during two types of recent El niño events. Glob. Planet. Change 108, 119–127. doi: 10.1016/j.gloplacha.2013.06.001
Di Lorenzo E., Cobb K. M., Furtado J. C., Schneider N., Anderson B. T., Bracco A., et al. (2010). Central pacific El niño and decadal climate change in the north pacific ocean. Nat. Geosci. 3, 762–765. doi: 10.1038/ngeo984
Duchon C. E. (1979). Lanczos filtering in one and two dimensions. J. Appl. Meteorol 18 (8), 1016–1022. doi: 10.1175/1520-0450(1979)018<1016:LFIOAT>2.0.CO;2
Elvan Ampou E., Johan O., Menkes C. E., Niño F., Birol F., Ouillon S., et al. (2017). Coral mortality induced by the 2015-2016 El-niño in Indonesia: The effect of rapid sea level fall. Biogeosciences 14, 817–826. doi: 10.5194/bg-14-817-2017
Guo H., Chen Z., Wang J. Z., Yang H. (2022). Opposite responses of sea level variations to ENSO in the northwestern pacific: A transition latitude at 20°N. Dyn. Atmos. Ocean. 98, 101288. doi: 10.1016/j.dynatmoce.2022.101288
Hamlington B. D., Cheon S. H., Thompson P. R., Merrifield M. A., Nerem R. S., Leben R. R., et al. (2016). An ongoing shift in pacific ocean sea level. J. Geophys. Res. Ocean. 121, 5084–5097. doi: 10.1002/2016JC011815
Hamlington B. D., Gardner A. S., Ivins E., Lenaerts J. T. M., Reager J. T., Trossman D. S., et al. (2020). Understanding of contemporary regional Sea-level change and the implications for the future. Rev. Geophys. 58 (3), e2019RG000672. doi: 10.1029/2019RG000672
Han W., Meehl G. A., Hu A., Alexander M. A., Yamagata T., Yuan D., et al. (2014). Intensification of decadal and multi-decadal sea level variability in the western tropical pacific during recent decades. Clim. Dyn. 43, 1357–1379. doi: 10.1007/s00382-013-1951-1
Huang N. E., Shen Z., Long S. R., Wu M. C., Snin H. H., Zheng Q., et al. (1998). The empirical mode decomposition and the Hubert spectrum for nonlinear and non-stationary time series analysis. Proc. R. Soc A Math. Phys. Eng. Sci. 454, 903–995. doi: 10.1098/rspa.1998.0193
Huang N. E., Wu Z. (2008). A review on Hilbert-Huang transform: Method and its applications to geophysical studies. Rev. Geophys. 46 (2), RG2006. doi: 10.1029/2007RG000228
Jeong Y., Nam S. H., Kwon J., Uppara U., Jo Y. H. (2022). Surface warming slowdown with continued subsurface warming in the East Sea (Japan Sea) over recent decades, (2000–2014). Front. Mar. Sci. 9. doi: 10.3389/fmars.2022.825368
Lee T., McPhaden M. J. (2008). Decadal phase change in large-scale sea level and winds in the indo-pacific region at the end of the 20th century. Geophys. Res. Lett. 35 (1), L01605. doi: 10.1029/2007GL032419
Lyu K., Zhang X., Church J. A., Hu J., Yu J. Y. (2017). Distinguishing the quasi-decadal and multidecadal sea level and climate variations in the pacific: Implications for the ENSO-like low-frequency variability. J. Clim. 30, 5097–5117. doi: 10.1175/JCLI-D-17-0004.1
Mcgregor S., Gupta A.S., England M. H. (2012). Constraining wind stress products with sea surface height observations and implications for pacific ocean sea level trend attribution. J. Clim. 25, 8164–9176. doi: 10.1175/JCLI-D-12-00105.1
Meehl G. A., Hu A., Arblaster J. M., Fasullo J., Trenberth K. E. (2013). Externally forced and internally generated decadal climate variability associated with the interdecadal pacific oscillation. J. Clim. 26, 7298–7310. doi: 10.1175/JCLI-D-12-00548.1
Meng L., Zhuang W., Zhang W., Ditri A., Yan X. H. (2019). Decadal sea level variability in the pacific ocean: Origins and climate mode contributions. J. Atmos. Ocean. Technol. 36, 689–698. doi: 10.1175/JTECH-D-18-0159.1
Merrifield M. A. (2011). A shift in western tropical pacific sea level trends during the 1990s. J. Clim. 24, 4126–4138. doi: 10.1175/2011JCLI3932.1
Mitchum G. T., Nerem R. S., Merrifield M. A., Gehrels W. R. (2010). “Modern Sea-Level-Change estimates,” in Understanding Sea-level rise and variability, 122–142. doi: 10.1002/9781444323276.ch5
Moon J. H., Song Y. T., Bromirski P. D., Miller A. J. (2013). Multidecadal regional sea level shifts in the pacific over 1958-2008. J. Geophys. Res. Ocean. 118, 7024–7035. doi: 10.1002/2013JC009297
Moon J. H., Song Y. T., Lee H. K. (2015). PDO and ENSO modulations intensified decadal sea level variability in the tropical pacific. J. Geophys. Res. Ocean. 120, 8229–8237. doi: 10.1002/2015JC011139
Nicholls R. J., Lincke D., Hinkel J., Brown S., Vafeidis A. T., Meyssignac B., et al. (2021). A global analysis of subsidence, relative sea-level change and coastal flood exposure. Nat. Clim. Change 11, 338–342. doi: 10.1038/s41558-021-00993-z
Nidheesh A. G., Lengaigne M., Vialard J., Unnikrishnan A. S., Dayan H. (2013). Decadal and long-term sea level variability in the tropical indo-pacific ocean. Clim. Dyn. 41, 381–402. doi: 10.1007/s00382-012-1463-4
Oppenheimer M., Glavovic B., Hinkel J., de Wal R., Magnan A. K., Abd-Elgawad A., et al. (2019). Sea Level rise and implications for low-lying islands, coasts and communities, IPCC special report on the ocean and cryosphere in a changing climate Vol. 355. Eds. Pörtner H.-O., Roberts D. C. (Intergov. Panel Clim. Chang). Available at: https://www.ipcc.ch/site/assets/uploads/sites/3/2019/11/SROCC_Ch04-SM_FINAL.pdf
Palanisamy H., Cazenave A., Delcroix T., Meyssignac B. (2015). Spatial trend patterns in the pacific ocean sea level during the altimetry era: the contribution of thermocline depth change and internal climate variability. Ocean Dyn. 65, 341–356. doi: 10.1007/s10236-014-0805-7
Ren Q., Li Y., Zheng F., Wang F., Duan J., Li R. (2020). Asymmetry of interannual Sea level variability in the Western tropical pacific: Responses to El niño and la niña. J. Geophys. Res. Ocean. 125 (10), e2020JC016616. doi: 10.1029/2020JC016616
Stammer D., Cazenave A., Ponte R. M., Tamisiea M. E. (2013). Causes for contemporary regional sea level changes. Ann. Rev. Mar. Sci. 5, 21–46. doi: 10.1146/annurev-marine-121211-172406
Sullivan A., Luo J. J., Hirst A. C., Bi D., Cai W., He J. (2016). Robust contribution of decadal anomalies to the frequency of central-pacific El niño. Sci. Rep. 6, 38540. doi: 10.1038/srep38540
Sun C., Kucharski F., Li J., Jin F. F., Kang I. S., Ding R. (2017). Western Tropical pacific multidecadal variability forced by the Atlantic multidecadal oscillation. Nat. Commun. 8, 15998. doi: 10.1038/ncomms15998
Taburet G., Sanchez-Roman A., Ballarotta M., Pujol M. I., Legeais J. F., Fournier F., et al. (2019). DUACS DT2018: 25 years of reprocessed sea level altimetry products. Ocean Sci. 15, 1207–1224. doi: 10.5194/os-15-1207-2019
Timmermann A., McGregor S., Jin F. F. (2010). Wind effects on past and future regional sea level trends in the southern indo-pacific. J. Clim. 23, 4429–4437. doi: 10.1175/2010JCLI3519.1
Wenzel M., Schröter J. (2014). Global and regional sea level change during the 20th century. J. Geophys. Res. Ocean. 119, 7493–7508. doi: 10.1002/2014JC009900
Wu Z., Huang N. E. (2009). Ensemble empirical mode decomposition: A noise-assisted data analysis method. Adv. Adapt. Data Anal. 1, 1–41. doi: 10.1142/S1793536909000047
Wu Z., Huang N. E., Chen X. (2009). The multi-dimensional ensemble empirical mode decomposition method. Adv. Adapt. Data Anal. 1, 339–372. doi: 10.1142/S1793536909000187
Keywords: sea level rise, Northwest Pacific, EEMD, ENSO, satellite altimeter measurements
Citation: Uppara U, Moon J-H, Jang CJ and Jo Y-H (2023) Interannual modulations in sea level rise over tropical Northwest Pacific in satellite altimeter measurements. Front. Mar. Sci. 10:1071333. doi: 10.3389/fmars.2023.1071333
Received: 16 October 2022; Accepted: 20 February 2023;
Published: 08 March 2023.
Edited by:
Lichuan Wu, Uppsala University, SwedenReviewed by:
Yong Fang, Shandong University of Science and Technology, ChinaEnhui Liao, Shanghai Jiao Tong University, China
Copyright © 2023 Uppara, Moon, Jang and Jo. This is an open-access article distributed under the terms of the Creative Commons Attribution License (CC BY). The use, distribution or reproduction in other forums is permitted, provided the original author(s) and the copyright owner(s) are credited and that the original publication in this journal is cited, in accordance with accepted academic practice. No use, distribution or reproduction is permitted which does not comply with these terms.
*Correspondence: Young-Heon Jo, joyoung@pusan.ac.kr