Risk assessment of offshore oil spill in the northern South China Sea: A stochastic scenario modeling approach
 Bingxu Geng
 Wen Zhou
 Lingyan Lu4
  Qian Cao
- 1Marine Environmental Engineering Center, South China Sea Institute of Oceanology, Chinese Academy of Sciences, Guangzhou, China
- 2Southern Marine Science and Engineering Guangdong Laboratory (Guangzhou), Guangzhou, China
- 3South China Institute of Environmental Sciences, Ministry of Ecology and Environment of the People's Republic of China, Guangzhou, China
- 4Guangdong Center for Marine Development Research, Guangzhou, China
The coastal area in the northern South China Sea (nSCS) is one of China’s most economically active regions. The fast-growing industry of marine sector and the shipping has increased the probability of oil spill accidents. An oil spill is a usually unexpected incident that is harmful to the ecological environment and marine organisms of the coastal area. As a result, utilizing a numerical model to simulate the fate and transport trajectory of spilled oil and to assess the potential risk of an oil spill accident to the coastal marine environment is of great necessity. The present study aimed to examine the impact of the risk of oil spills on the coastal environment in the nSCS. We built a hydrodynamic model and an oil spill dispersion model based on MIKE21 FM to study the tidal dynamics and oil spill dispersion in the coastal area in the nSCS. Moreover, the stochastic approach was used to simulate and predict the fastest arrival time and the probability distribution of the pollution of the oil film to the surrounding environment in the coastal regions of the nSCS. We examined the mechanisms for the influences of tides and wind on the fastest arrival time of oil film and the spatial distribution of the pollution probability of oil spill incidents at different locations in the nSCS based on the model. The results showed that the wind direction has a dominating effect on the direction of the oil dispersion. Due to the differences in the tidal dynamics in different regions, the migration and dispersion of the oil are also affected by the tidal current. This research provides guidance on the risk assessment of oil spill accidents for marine environmental management.
Introduction
Oil exploration and transportation activities have been promoted due to the increase in petroleum demand and consumption in recent decades. The frequent production and transportation activities on the sea increase the potential for the risk of oil spills to the marine environment. Man-made errors and failures, such as collisions of construction and shipping vessels, ship groundings, and crude oil pipeline ruptures, emit tons of crude oil to the ocean (Chen et al., 2019). A sudden oil spill accident can have a devastating effect on the marine environment and marine ecosystem because of the high concentration of the contaminants and the difficulties with treatment (Law and Hellou, 1999; Fisher et al., 2016; Wang et al., 2020). The oil film spreading on the sea surface will hinder water reaeration and decrease the dissolved oxygen concentration in the water column and would finally deteriorate the bottom hypoxia (Rabalais et al., 2018). Generally, oil spills harm ocean life in two ways: via fouling/oiling (Alkhatib et al., 2021) or oil toxicity (Demiguel-Jiménez et al., 2021). Fouling or oiling happens when oil physically harms plants or animals (Camphuysen and Heubeck, 2015; Troisi et al., 2016; Chen et al., 2020). It can cover a bird’s wings, causing it to be unable to fly. Additionally, oil has many different toxic compounds that lead to severe health problems (Ferguson et al., 2020). Thus, the prediction and risk assessment of oil spill incidents are important for marine environment protection. The coastal area of the northern South China Sea (nSCS), centered on the Greater Bay Area (Guangdong–Hong Kong–Macao Great Bay Area), is one of the most active areas in China’s national economic development (Yu, 2021). A lot of marine constructions are built to provide offshore services, leading to intense maritime traffic carrying oil and petroleum during shipping (Chen et al., 2018). Any leakage of the oil into the environment can cause the long-term contamination to the environment and finally spoil the delicate balance of the offshore ecology. Meanwhile, the research indicates that oil spill incidents that occurred many years ago still affect the environment and impact the local ecosystems (Beyer et al., 2016; Gao et al., 2018). Major concerns were raised about the potential influence of oil spilling accidents on the marine environment. Thus, the study on the impact of offshore oil spills in the nSCS can provide basic knowledge for offshore environmental protection.
A numerical simulation of the trajectory of an oil spill is the main method for the analysis and assessment of oil spill hazards (Prasad et al., 2018; Balogun et al., 2021). Depending on different hydrodynamic and meteorological conditions, the numerical simulation of oil spill risk is generally divided into a typical scenario simulation and a stochastic scenario simulation (Keramea et al., 2021). Among them, a typical scenario simulation is more widely used (Kampouris et al., 2021). Generally, a dominant and unfavorable wind direction are the only two conditions that are considered in a typical scenario simulation. Tidal dynamic conditions only include flooding and ebb-tidal periods. The above meteorological and hydrological conditions are combined into several typical scenarios. The oil spill trajectory model is used to predict the drift trajectory of the oil film and the fastest time for the oil spill to reach the environmentally sensitive regions forced by the meteorological and hydrological conditions given for each typical scenario. Samuels et al. (2013) developed an oil spill modeling system that can be applied on a global scale. Prakash et al. (2015) used oil weathering processes to predict critical slick properties such as viscosity and density.
However, the hydrographic and meteorological conditions of the ocean change at any time, and the occurrence of oil spills is random. The deterministic approach cannot reflect the oil spills’ stochasticity and the uncertain impact of oil spills on the marine environment. Therefore, more and more researchers have started to use the stochastic approach to simulate and assess the pollution risk of oil spills to the sea in recent years (Al-Rabeh et al., 1989; Amir-Heidari et al., 2019; Saçu et al., 2021). The stochastic scenario simulation is a method developed based on probability theory by numerically simulating the oil spill drift trajectory with hundreds of random scenario combinations for potential oil spill incidents. Meteorological and hydrological conditions were randomly selected from the wind and tidal fields at any time in the past years with uncertainty in the time of the occurrence of each random scenario. For each stochastic scenario, data such as the elapsed time of pollutants and oil film thickness at each moment are calculated and recorded for each model grid (Toz, 2017). Finally, with the statistical information on the probability of pollution and the fastest arrival time of the oil film for each model grid under the influence of the oil spill, combined with the distribution location of sensitive environmental targets around the study area, we can obtain the pollution probability and the fastest arrival time of the oil film for each sensitive environmental target or the oil spill (Zacharias et al., 2021).
From the above analysis, it can be seen that the use of the stochastic approach and the combined use of stochastic and typical scenario simulation methods to predict the impact of oil spills on the marine ecosystem have been widely used in recent years (Niu et al., 2016; Saçu et al., 2021). However, the existing research lacks in-depth studies on the dynamic mechanisms of the spatial distribution of pollution probability and the fastest arrival time of the oil film in oil spill accidents obtained from the simulation of the stochastic scenario method, which cannot provide a scientific basis for the marine management department to formulate scientific and effective countermeasures for the risk management of oil spill accidents.
Therefore, this study used a stochastic approach to predict the pollution probability and shortest arrival time of the nearshore oil spill incident in the nSCS to the surrounding marine environment. The driving mechanism of tidal dynamics, the wind field on the spatial distribution of pollution probability and the shortest arrival time were analyzed to provide a deeper understanding of oil’s impact on the nSCS. This can be used to improve the accuracy of the risk assessment of coastal oil spills in the nSCS and the decision support for the marine management department to develop effective risk management countermeasures for oil spill incidents.
Methodology
This research selected the coastal area near Shantou in the nSCS to study the impact of oil spill risk based on a stochastic scenario simulation. The MIKE21 FM model was used to numerically simulate the tidal dynamics and the oil spill trajectory in the study area. This section will briefly introduce the tidal dynamic model, the oil spill dispersion model, and the setup of the stochastic scenario simulation.
Hydrodynamic model setup and validation
Figure 1 shows the model domain and model grid in the coastal area of the nSCS. The model used an unstructured triangular mesh. The entire model domain consists of 2840 nodes and 5091 triangular cells, with a minimum horizontal resolution of ~25 m. The coastline and water depth of the model were obtained by digitizing and interpolating the latest nautical chart data. The open boundary of the model is driven by the hourly tidal elevation. The driving data are interpolated from the global tidal inversion model (TPXO7.2) developed by Oregon State University (OSU) in the USA. The model’s simulation period starts from 1 September 2020 to 30 September 2020.
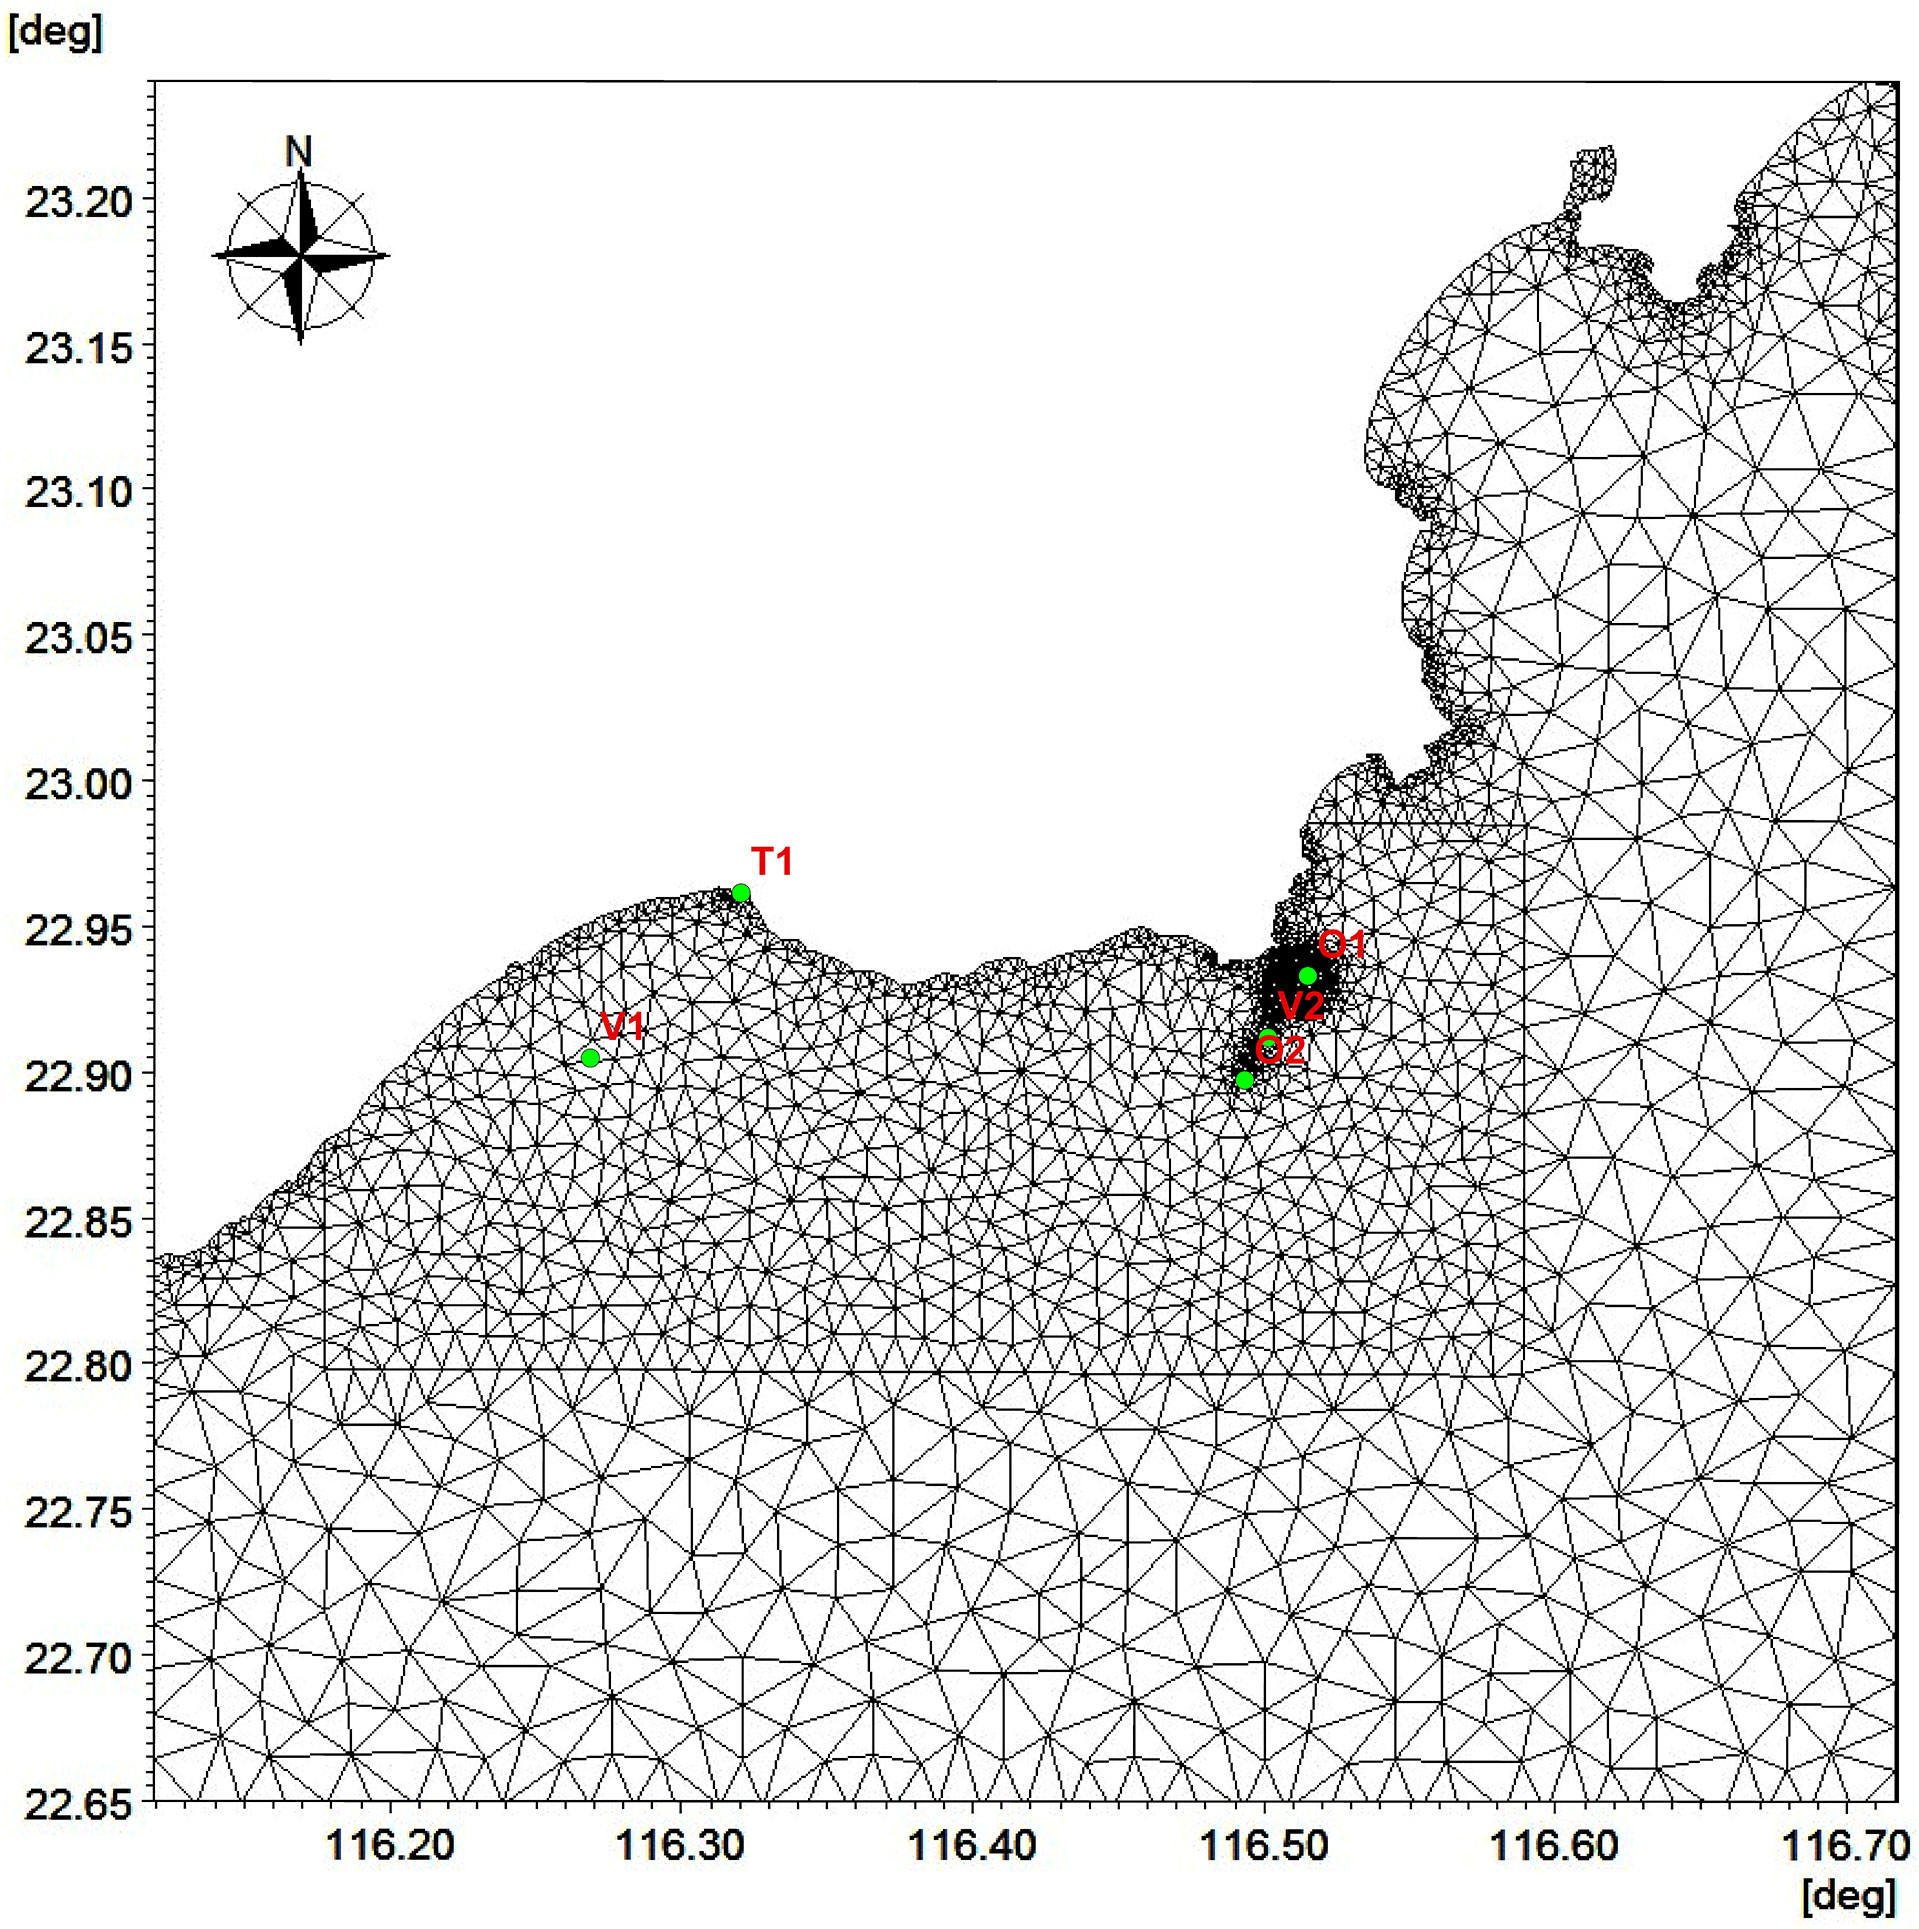
Figure 1 Model domain and model grid of the coastal tidal dynamic model in the northern South China Sea.
A 25-hour tidal elevation series at station T1, and a 25-hour tidal current with observations of the direction and velocity at stations V1 and V2 was used to validate the tidal dynamic model in the nSCS. The location of each station is shown in Figure 1. The modeled time-series of the tidal elevation, velocity and direction of tidal currents were compared with the observed data, and the results are shown in Figures 2, 3. The time-series distribution of the tidal elevation and current velocity simulated by the tidal dynamics model is consistent with the distribution trends observed in the field. The model successfully simulates the trends of high and low tides at the observed stations. Quantitative statistics show that the average error of the tide level is 0.08 m. Overall, the hydrodynamic model in the nSCS can better reproduce the tidal dynamic process in our model domain. The results can be applied to the nearshore oil spill trajectory and the oil spill risk assessment study in the nSCS.
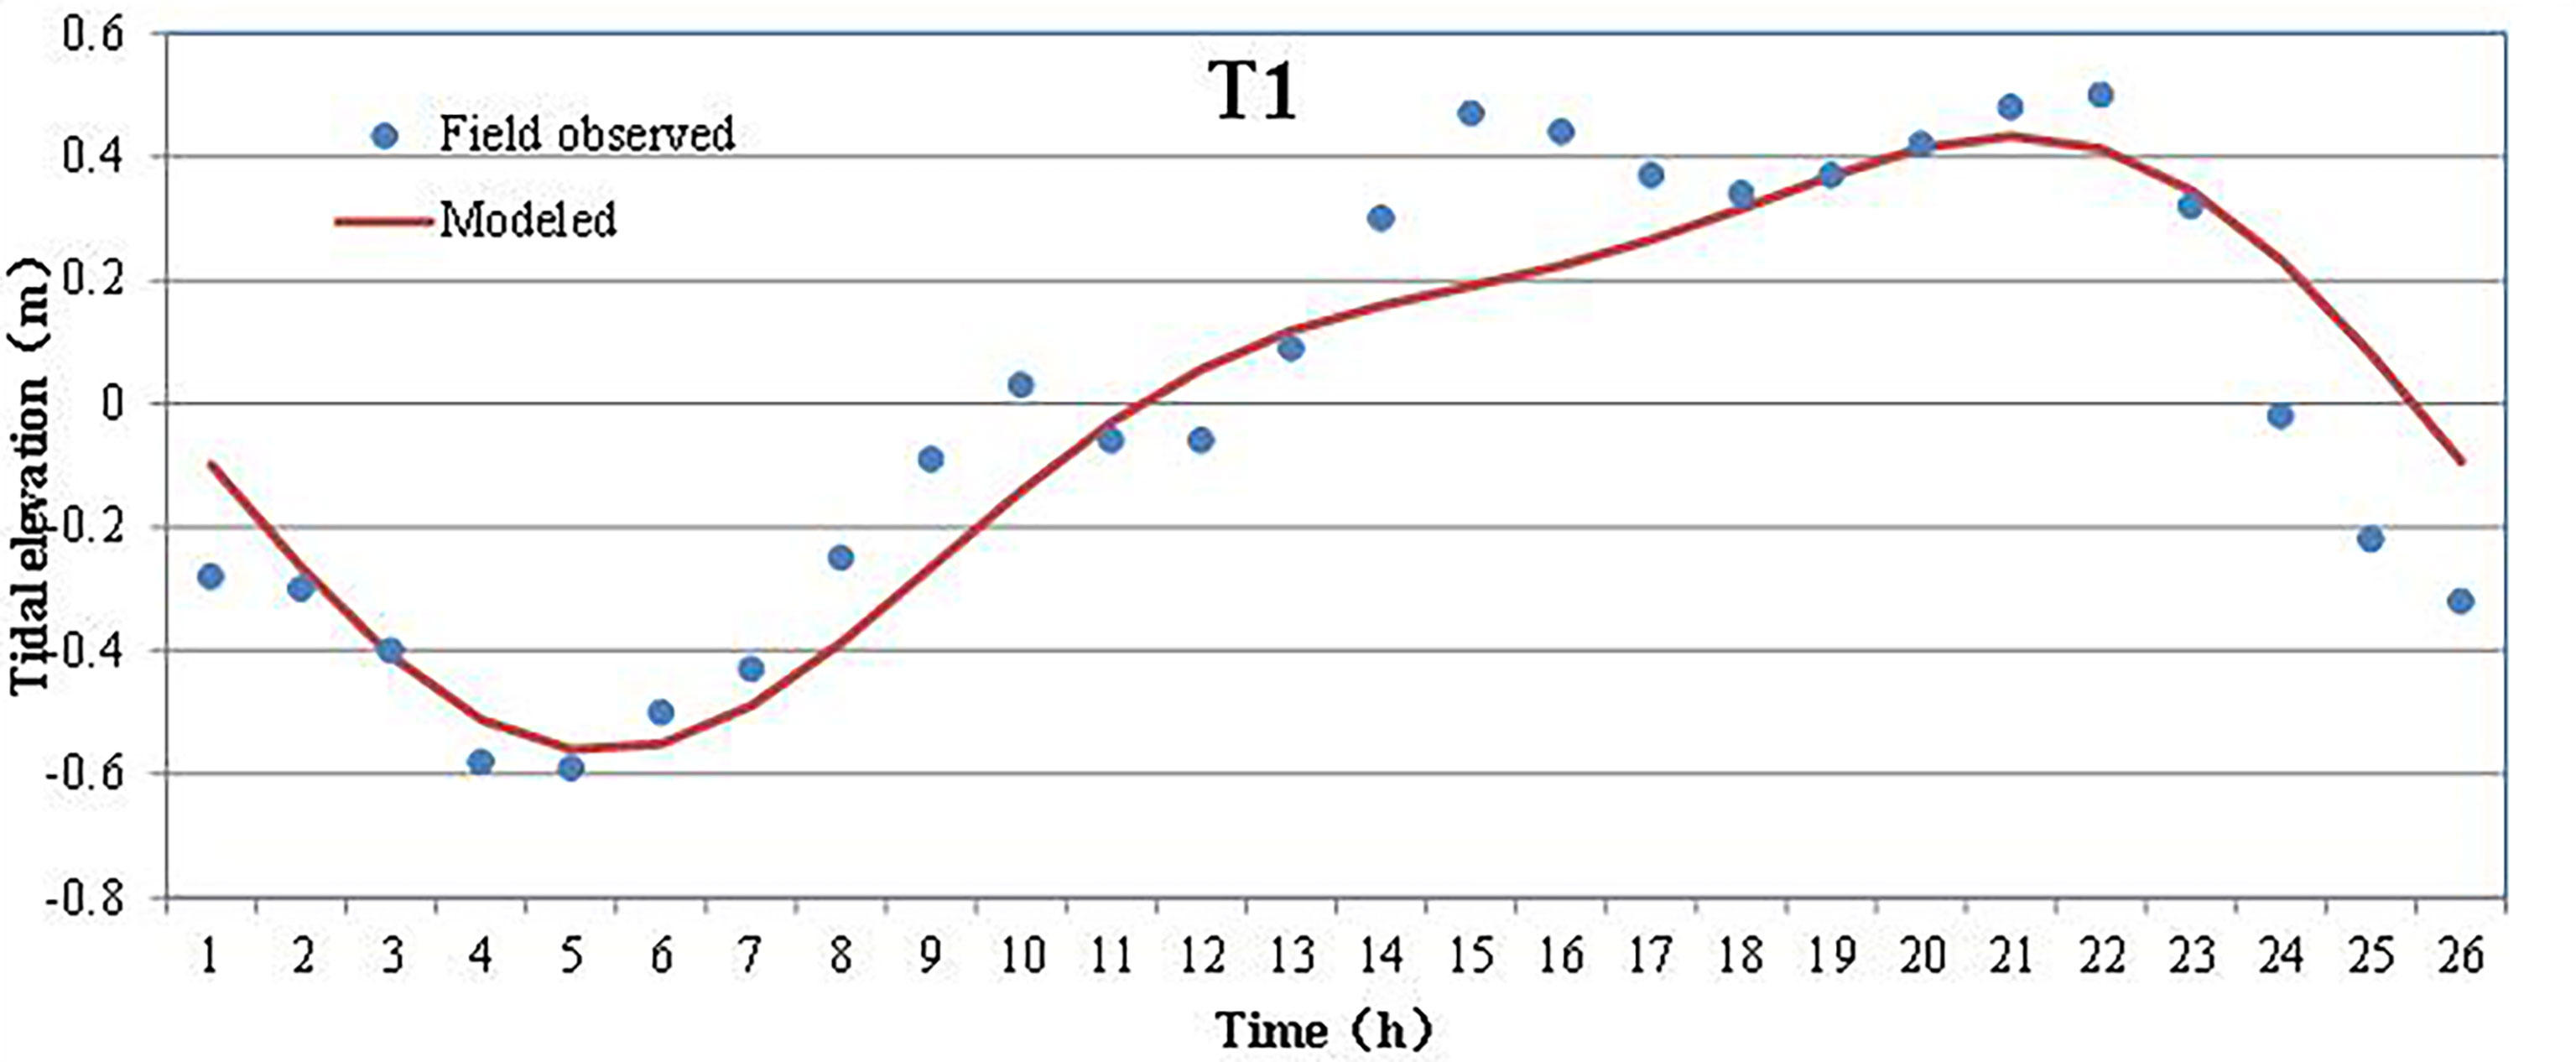
Figure 2 Comparison of the hourly tide levels calculated by the tidal model with the tide levels observed at station T1.
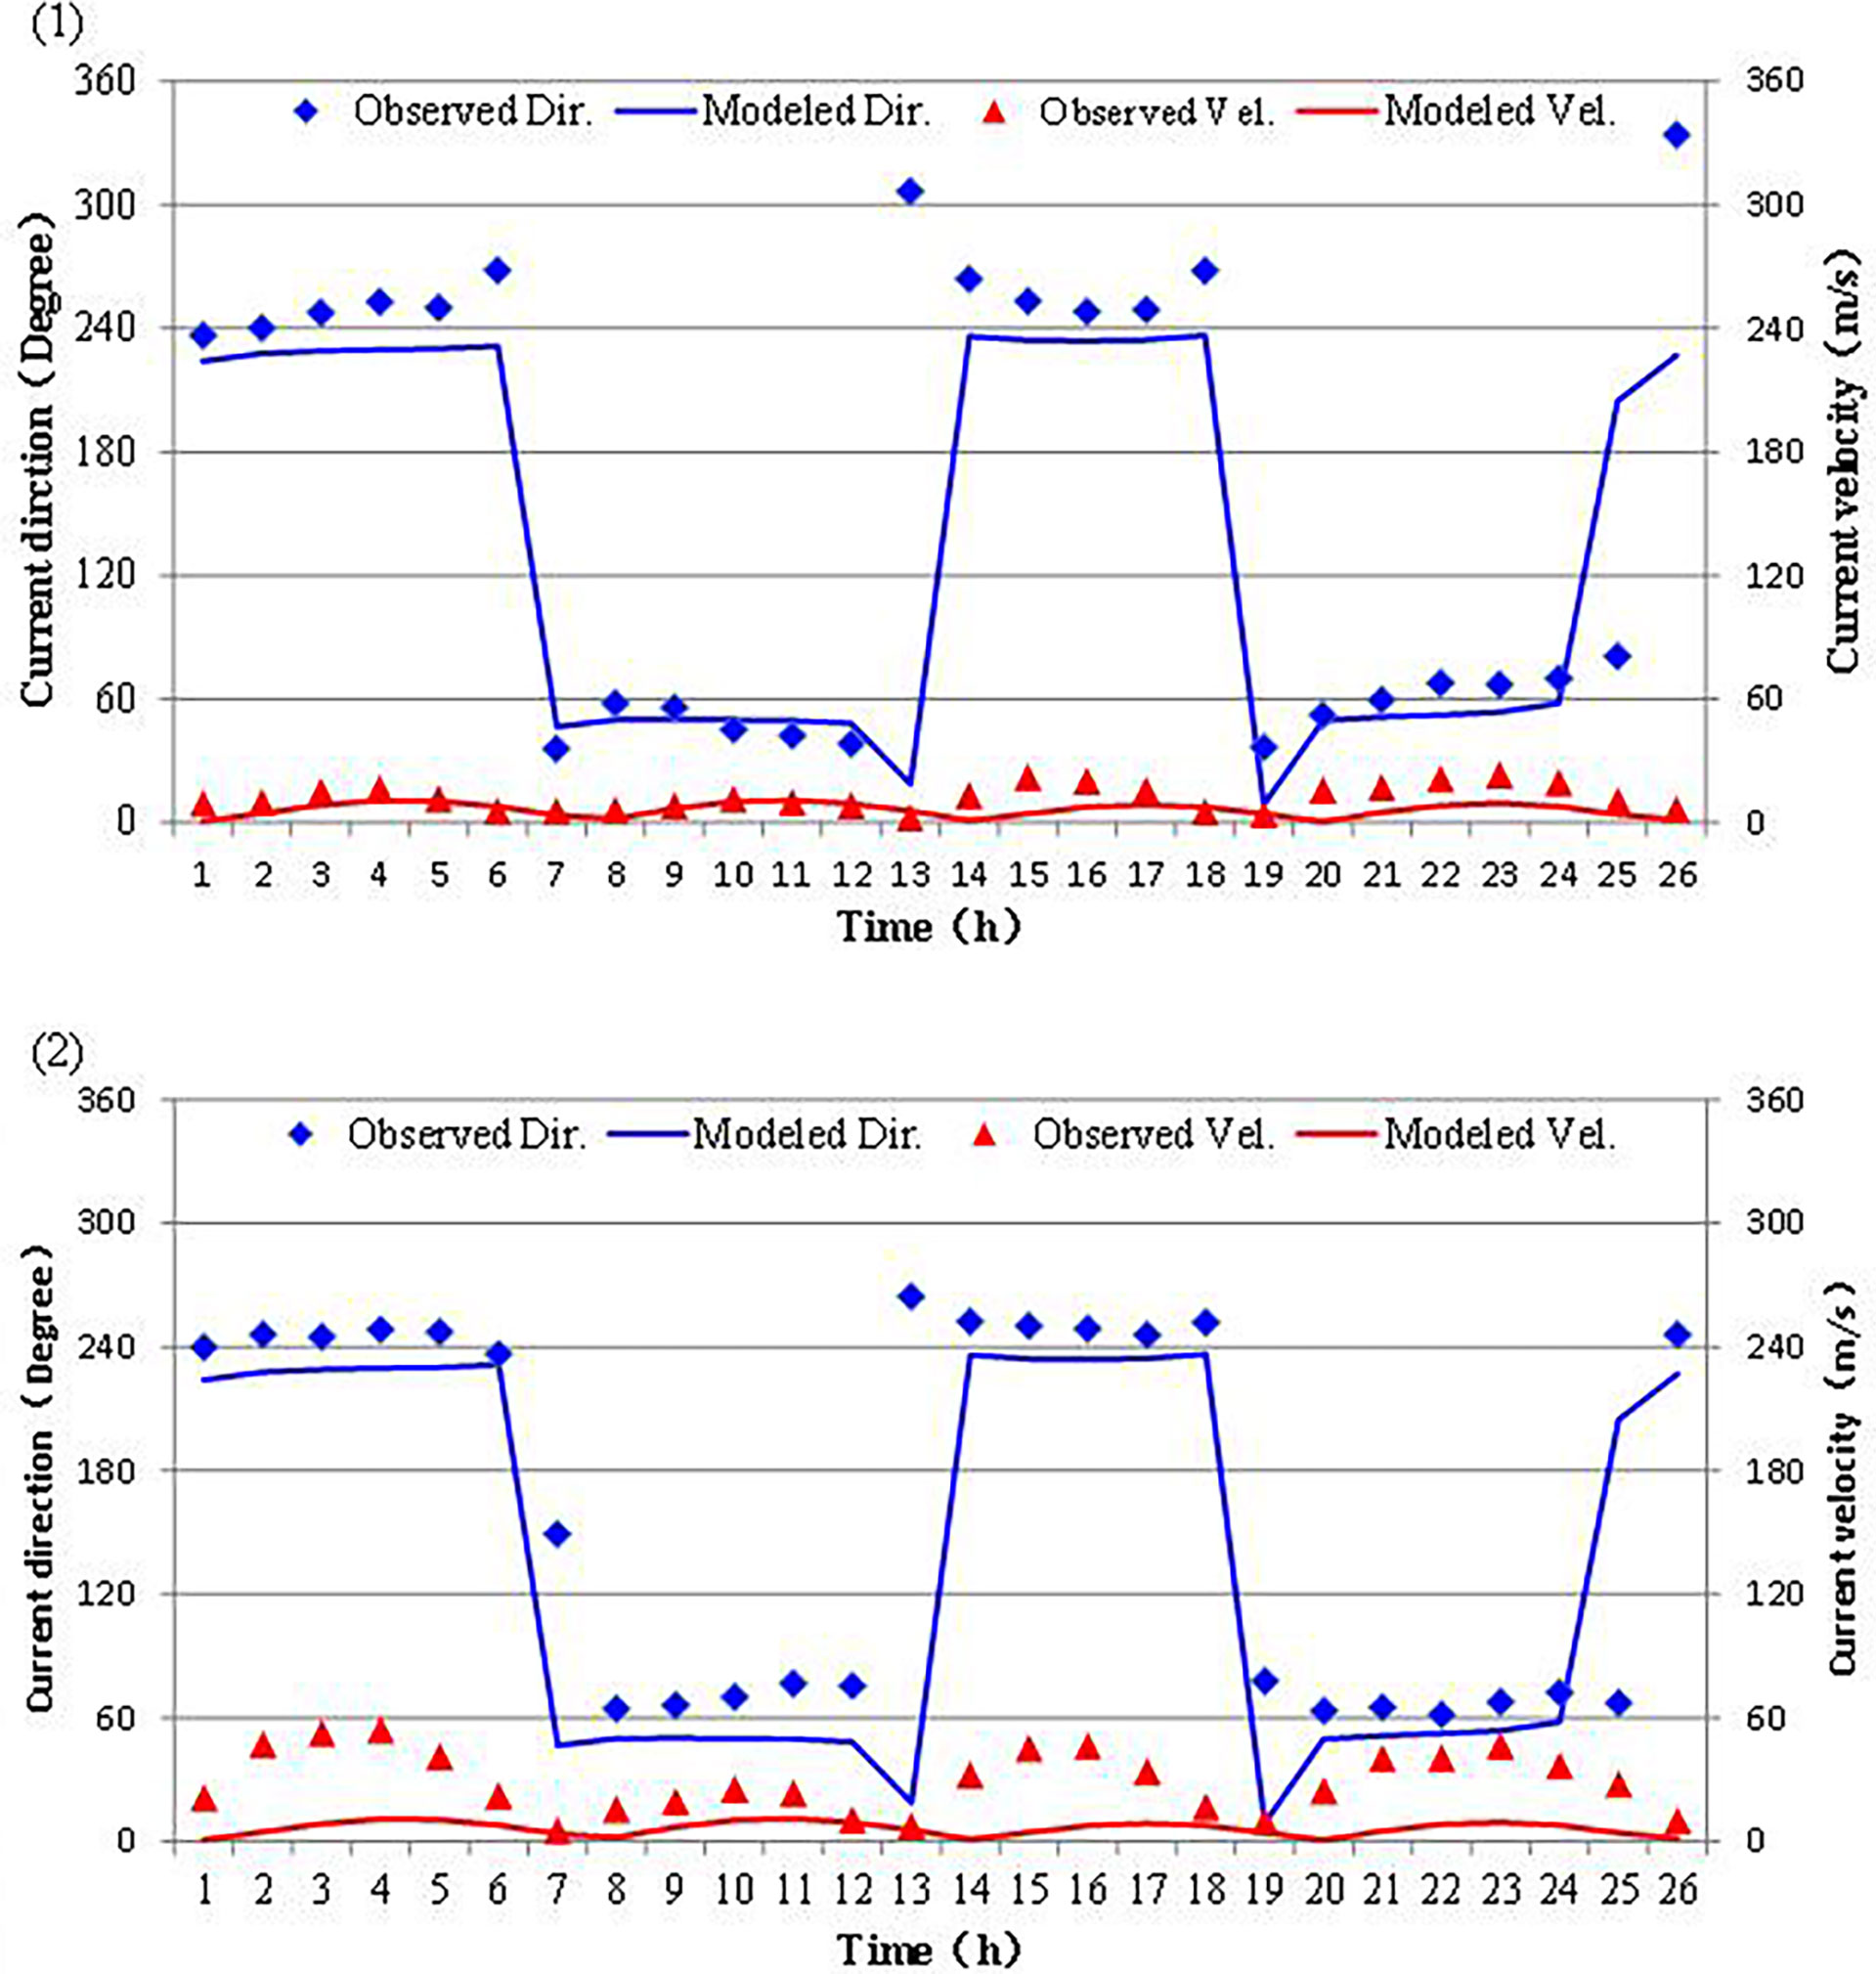
Figure 3 Comparison of tidal flow velocity and direction calculated by the tidal model with the observations conducted at a) Station V1 and b) Station V2.
Setup of the oil spill model
We use the MIKE model’s OS oil spill model to simulate the accidental oil spill’s fate and transport trajectory. In our oil spill model, the oil spill enters the water body after the oil spill accident. It first expands in all directions due to gravity, inertia force, viscosity, and surface tension, forming a large area of oil film. After that, it starts drifting and spreading under the effect of environmental factors such as tidal currents and sea surface wind. The oil from the spilling accident contains various components with different vapor pressure, solubility, viscosity, and surface tension. The highly volatile components evaporate quickly, some of the lighter carbon components will gradually dissolve in water, and the non-volatile parts will remain on the sea surface. After the accident happens, the oil film spreads and migrates on the sea surface affected by the wind and tide, while evaporation, emulsification, and dissolution processes occur.
The oil spill model is based on the model of “oil particles”, which treats the oil spill as being many oil spill particles. It uses the Lagrange random walk approach and the particle cloud principle to describe the process of oil spill diffusion and considers the processes of the evaporation, emulsification, dissolution, and biodegradation of the oil spill. The hydrodynamic field calculated by the tidal model provides the corresponding turbulent diffusion coefficients for the oil spill model to simulate oil particles’ drift and diffusion processes. Since the offshore wind conditions (wind speed and direction) significantly influence the motion of the oil film, the effect of wind on the motion of the oil film is considered in the simulation.
In this paper, the oil spill is set to occur at two locations, named O1 and O2 in Figure 1, and the accidental oil spill volume is assumed to be 3000 tons. The oil spill is taken as the continuous point source with a duration of 1 hour.
Setup of the stochastic oil spill risk scenario
Based on the tidal dynamics and the oil spill model constructed in the previous section, this section sets up stochastic scenarios for oil spills occurring at stations O1 and O2. About 300 stochastic scenarios with random hydrodynamics and wind forcing fields were set up. For each stochastic scenario, 6-day continuous hydrodynamic data were randomly selected from the 30-day hourly field of tidal dynamics calculated by the hydrodynamic model. Moreover, a 6-day continuous wind speed and direction were randomly selected from the daily average wind vectors at the sea surface over 3 years (1 January 2017–31 December 2019) of NCEP/NCAR data. The above randomly selected tidal dynamic field and sea surface wind field boundary conditions were used as the lateral open and surface momentum boundary conditions of the model, respectively, to simulate the oil spill dispersion at O1 and O2 for each stochastic scenario. In each stochastic scenario simulation, we record information on the oil film thickness for each grid of the model to determine whether the grid is contaminated by the oil spill and the time when the oil spill reaches the grid. Finally, the oil spill contamination probability (P) and the fastest oil spill arrival time (T) are statistically calculated for each grid based on the results of 300 simulations of random scenarios. The following equations are used to calculate P and T:
where i is the grid cell number of the model; P(i) is the probability of the pollution of grid cell i by the oil spill; n is the total number of simulations (n=300); M(i) is the number of times the accidental oil spill contaminated grid cell i in N runs of the simulation; and T(i) is the minimum time for the oil spill to spread to grid cell i in N runs of the simulation.
Results and discussion
Distribution of the tidal currents
This study analyzes the spatial distribution characteristics of nearshore tidal dynamics in the nSCS based on the modeled hourly tidal field. Figures 4, 5 show the model’s simulated tidal velocity vectors and speed distributions during peak flood and ebb-tidal periods. The study area is dominated by SW and NE directions of the flood and ebb tidal currents, and the tidal current is mainly a reciprocal flow. Among them, the tidal flood flow is mainly in the SW direction and the ebb-tidal flow is mainly in the NE direction. The spatial distribution of tidal currents is significantly influenced by the coastline and topography, and the direction of tidal currents is basically parallel to the coastline. The maximum tidal velocity at the flood and ebb tide is about 0.5 m/s. The maximum tidal flow at the ebb tide is slightly higher than that at the flood tide.
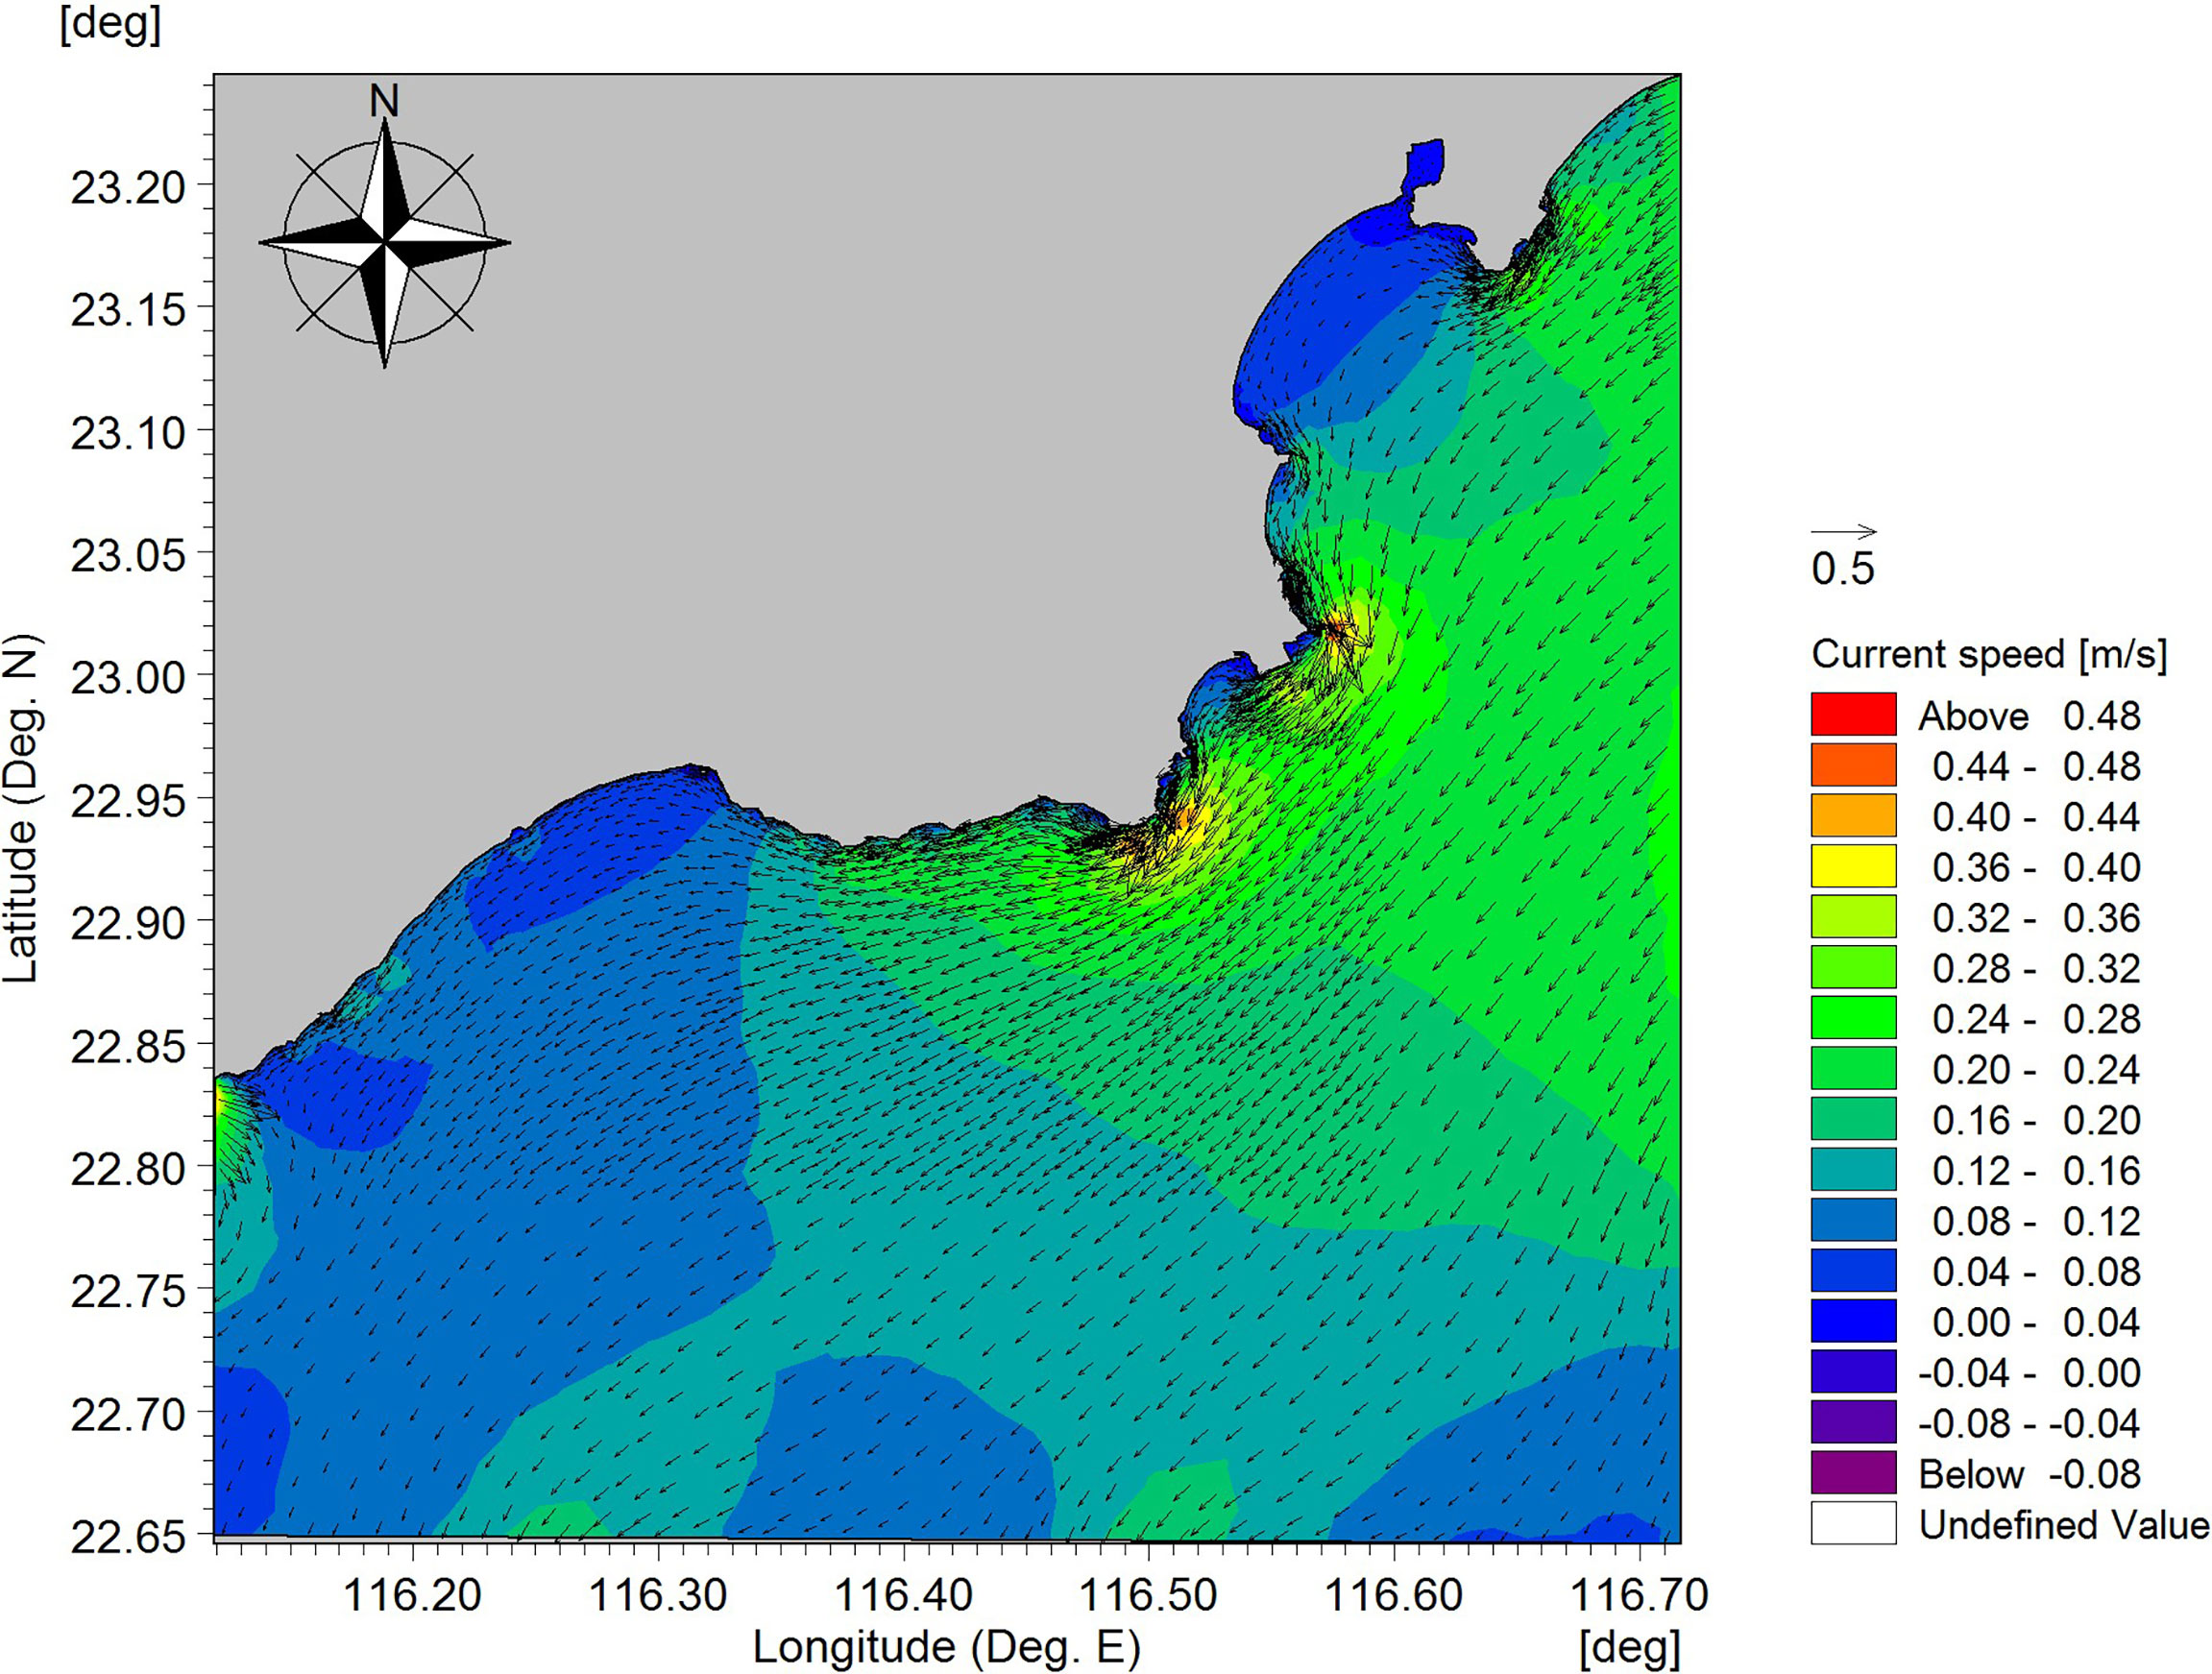
Figure 4 Tidal current distribution during the peak flood tidal period in the northern South China Sea calculated by tidal model (The arrow is the tidal velocity vector, and the color filled graph is the current speed distribution).
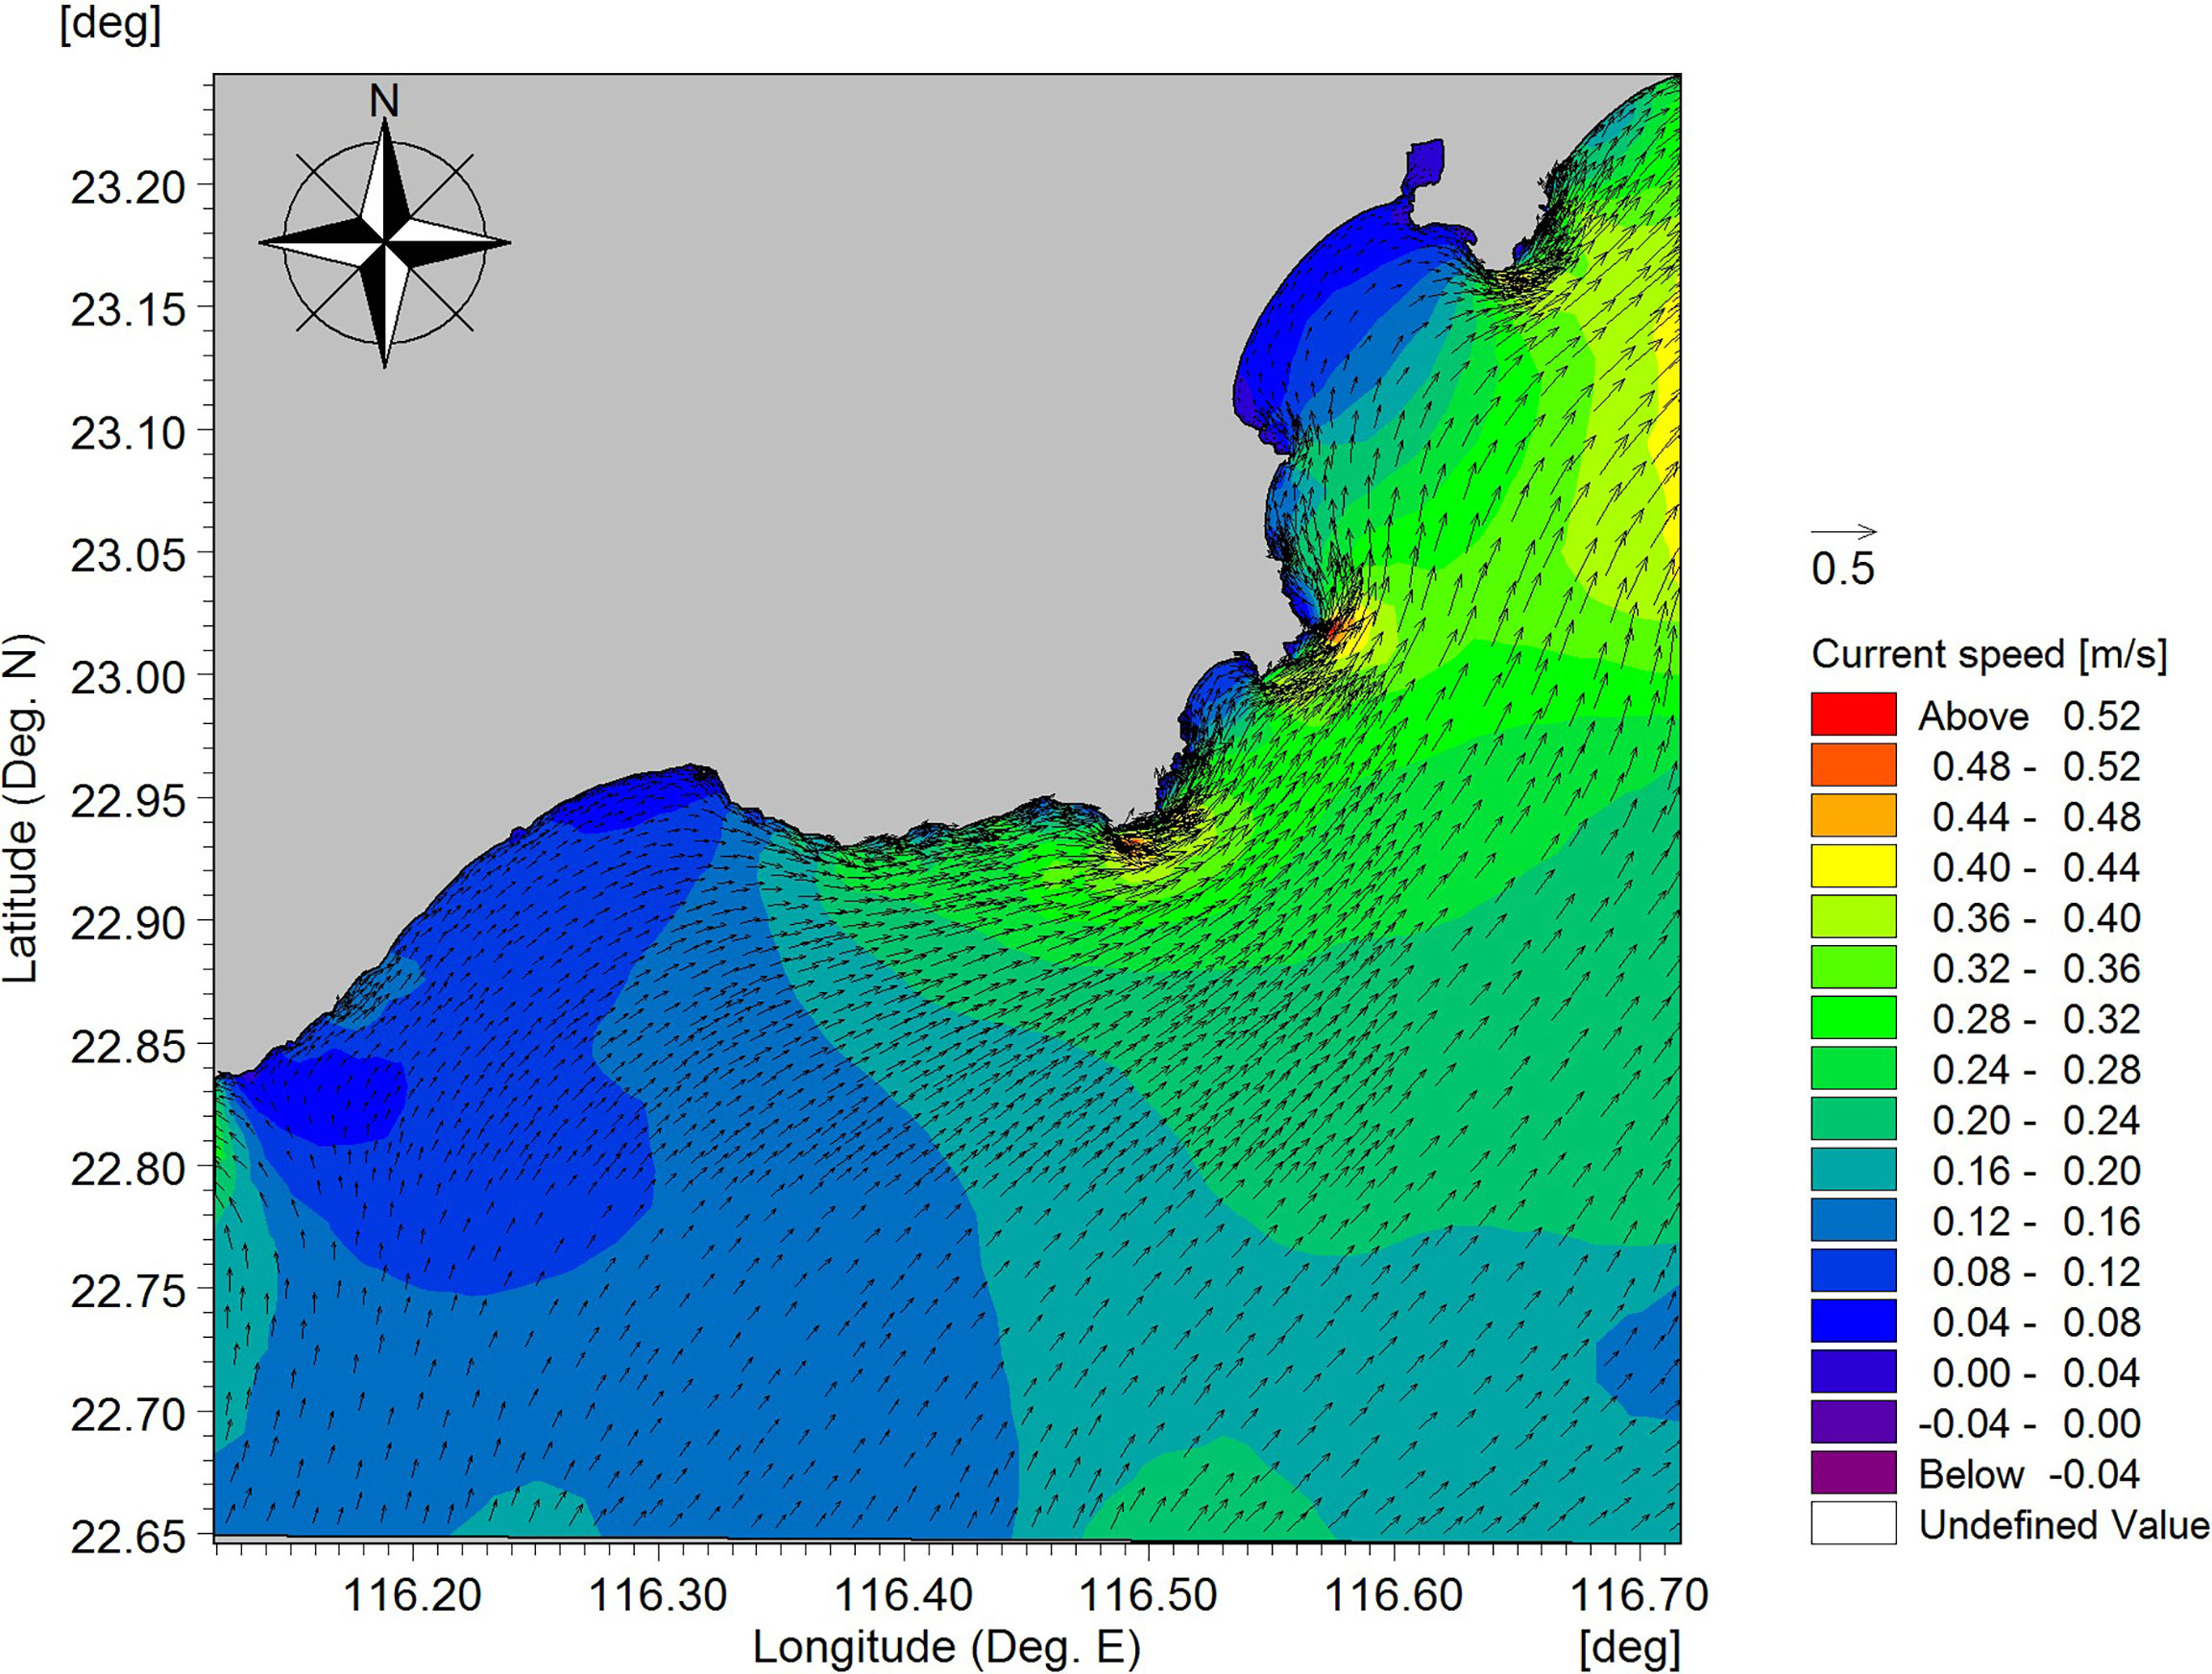
Figure 5 Tidal current distribution during the peak ebb tidal period in the northern South China Sea calculated by tidal model (The arrow is the tidal velocity vector, and the color filled graph is the current speed distribution).
Results of the stochastic stimulation
Figures 6–9 show the distribution of the fastest arrival time (T) and pollution probability (P) of the oil film caused by the oil spill incident at sites O1 and O2, respectively, based on the stochastic simulation. From the prediction results, when an oil spill occurs at point O1, both the northeast and southwest sea areas at the spill location have a higher probability of being contaminated by the oil spill (maximum contamination probability >10%), and the time for the oil film to reach the area is shorter.
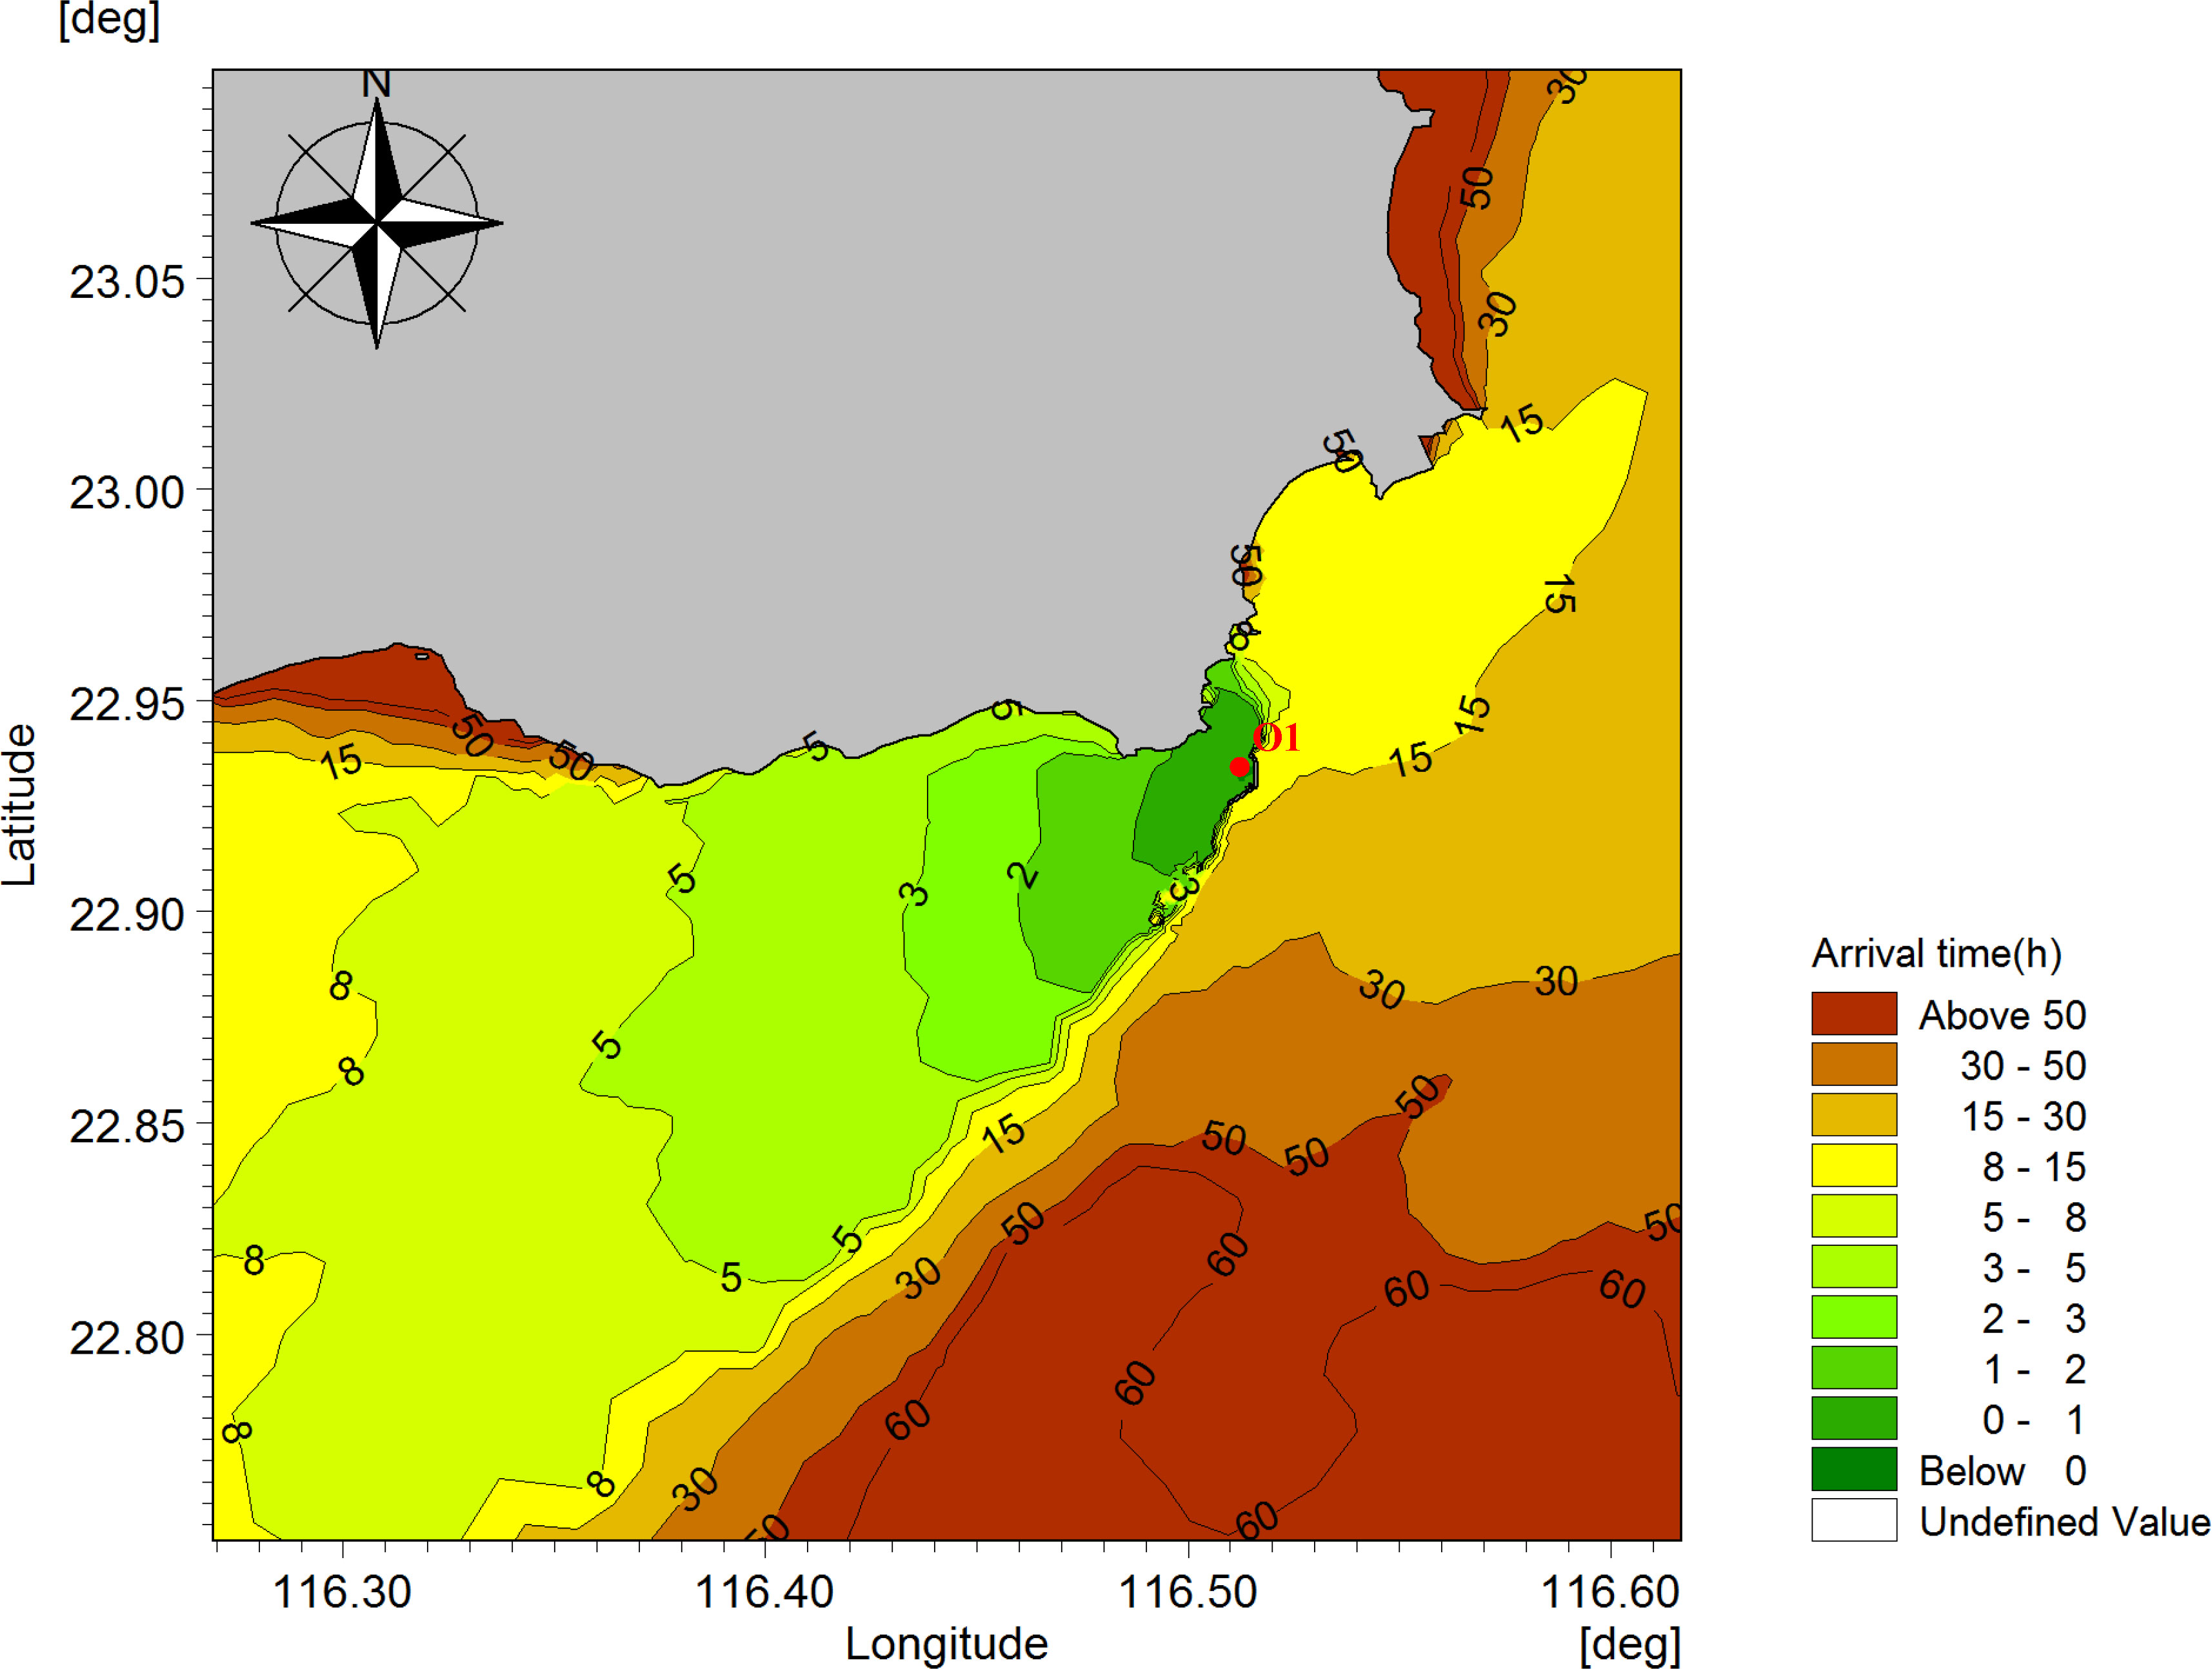
Figure 6 Distribution of the fastest arrival time (T) for the oil film from the oil spill accident occurred at site O1.
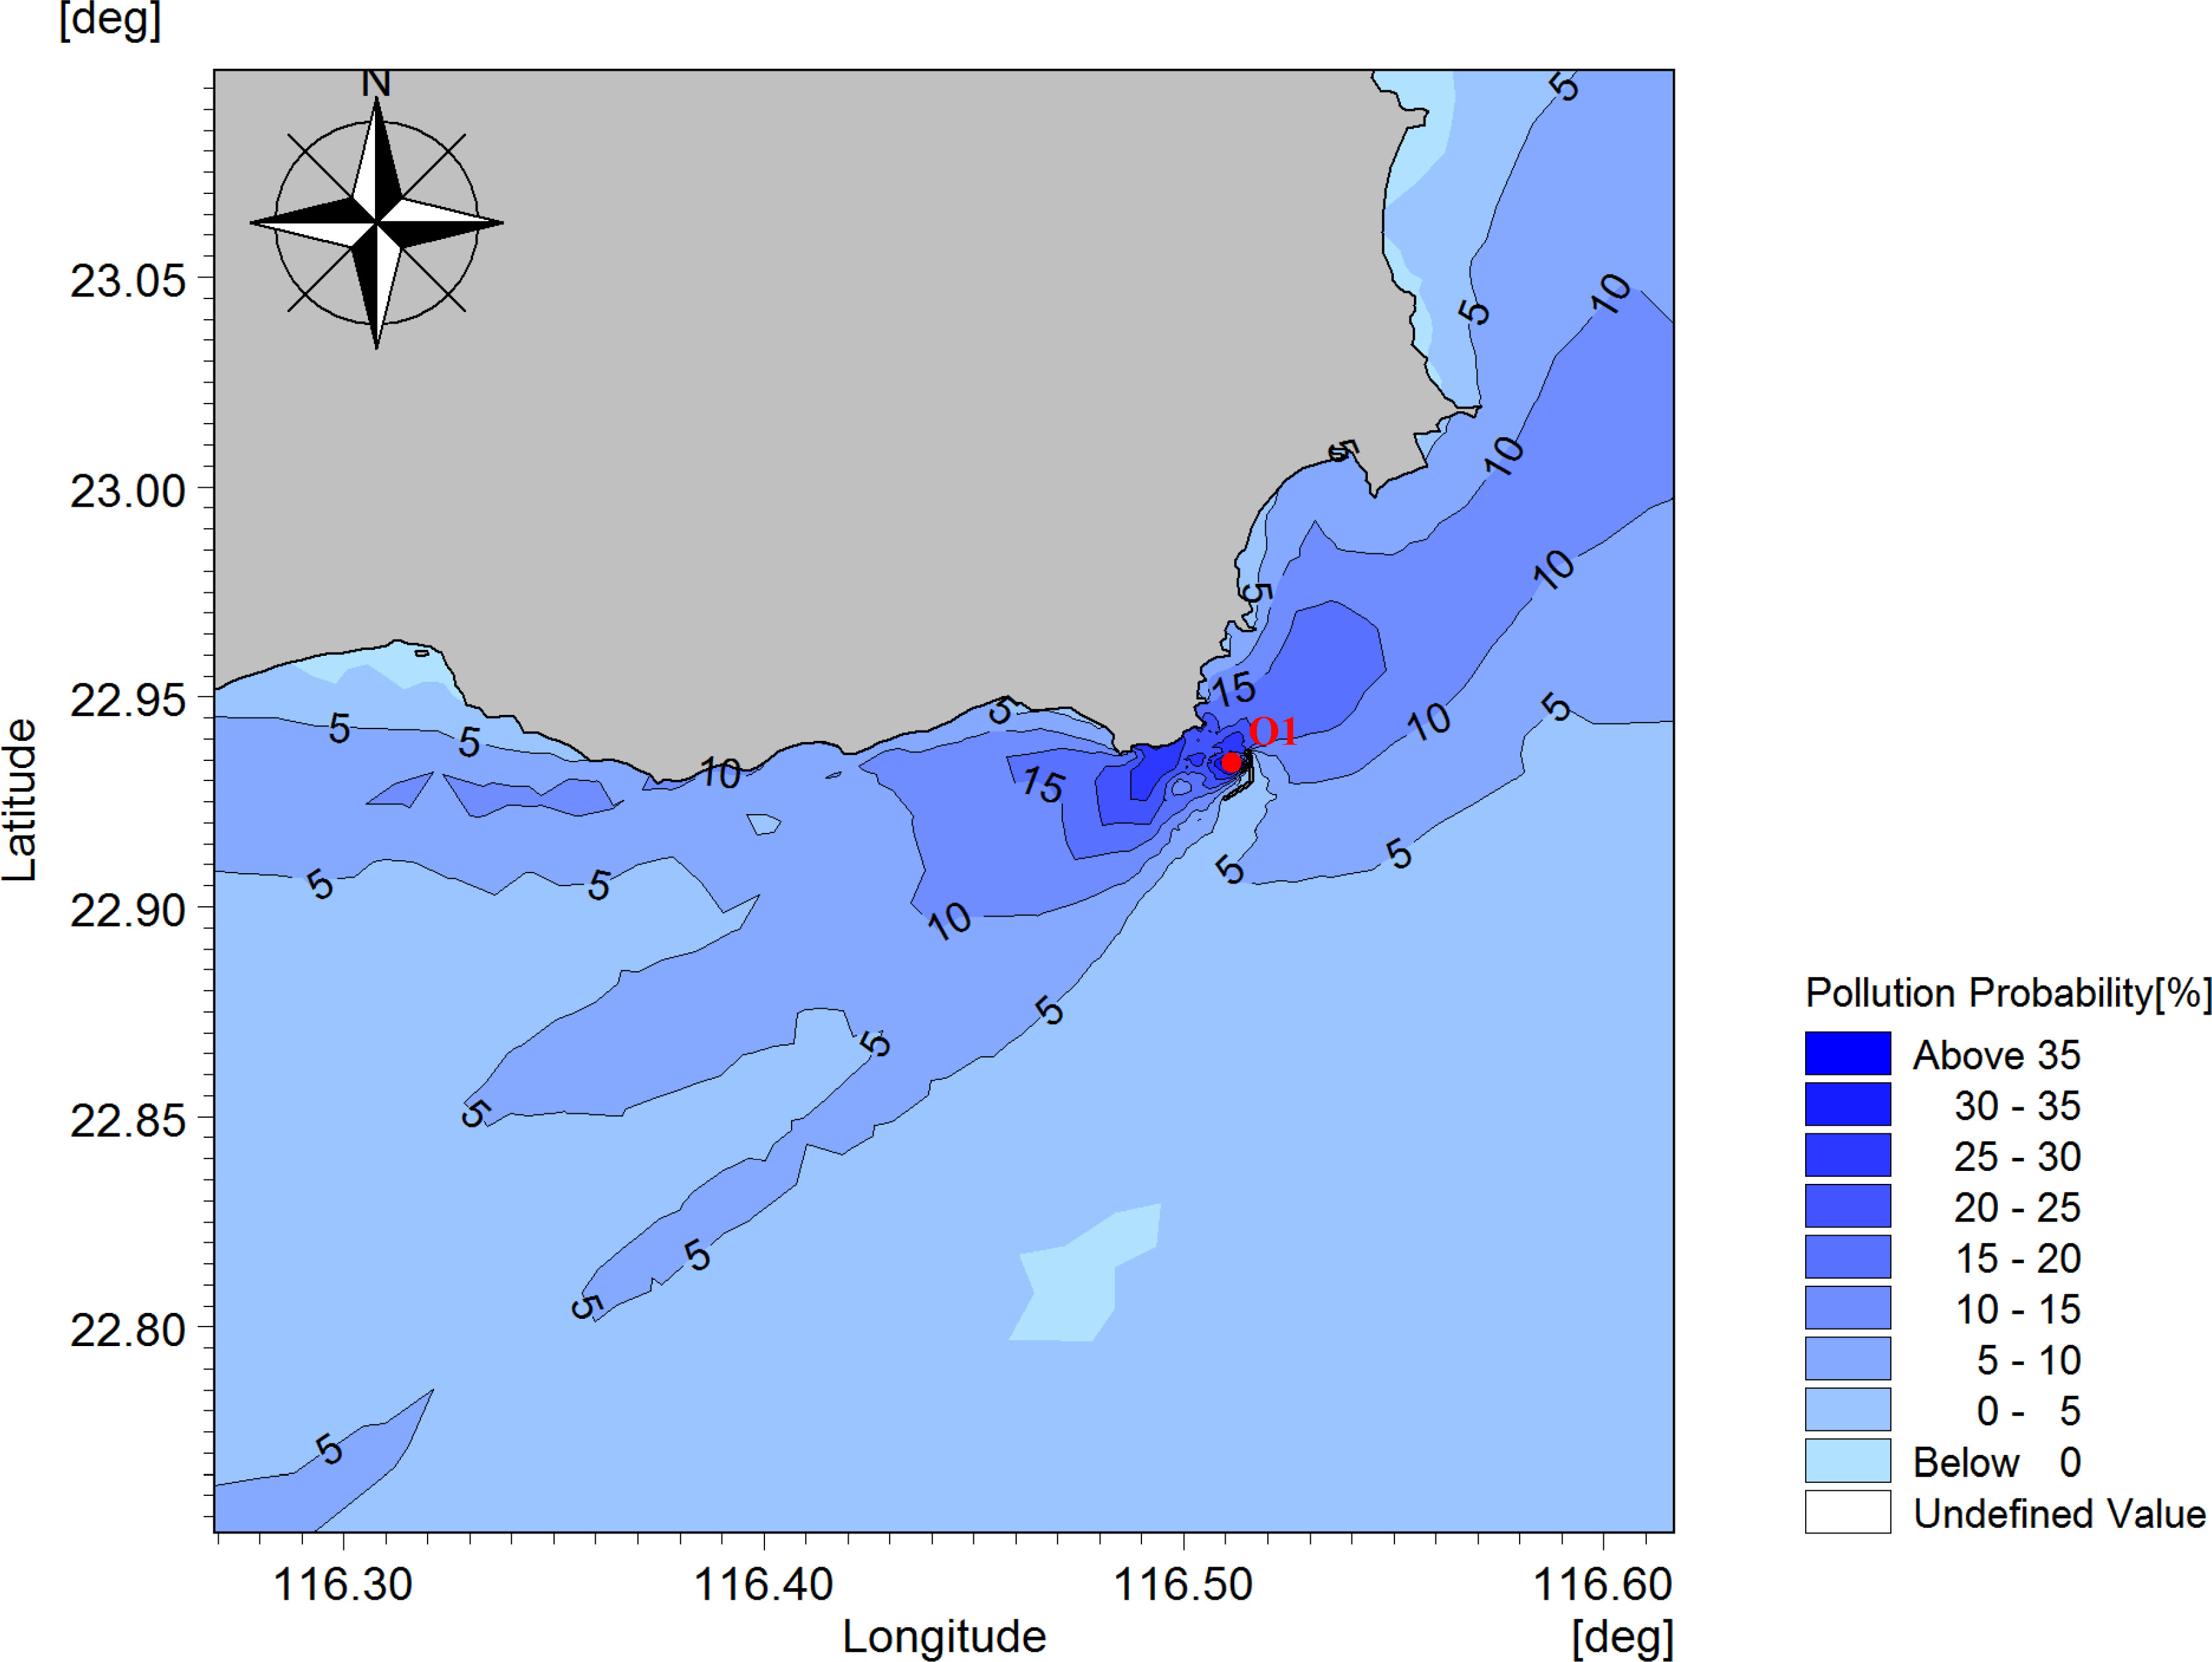
Figure 7 Distribution of pollution probability (P) for the oil film from the oil spill accident occurred at site O1.
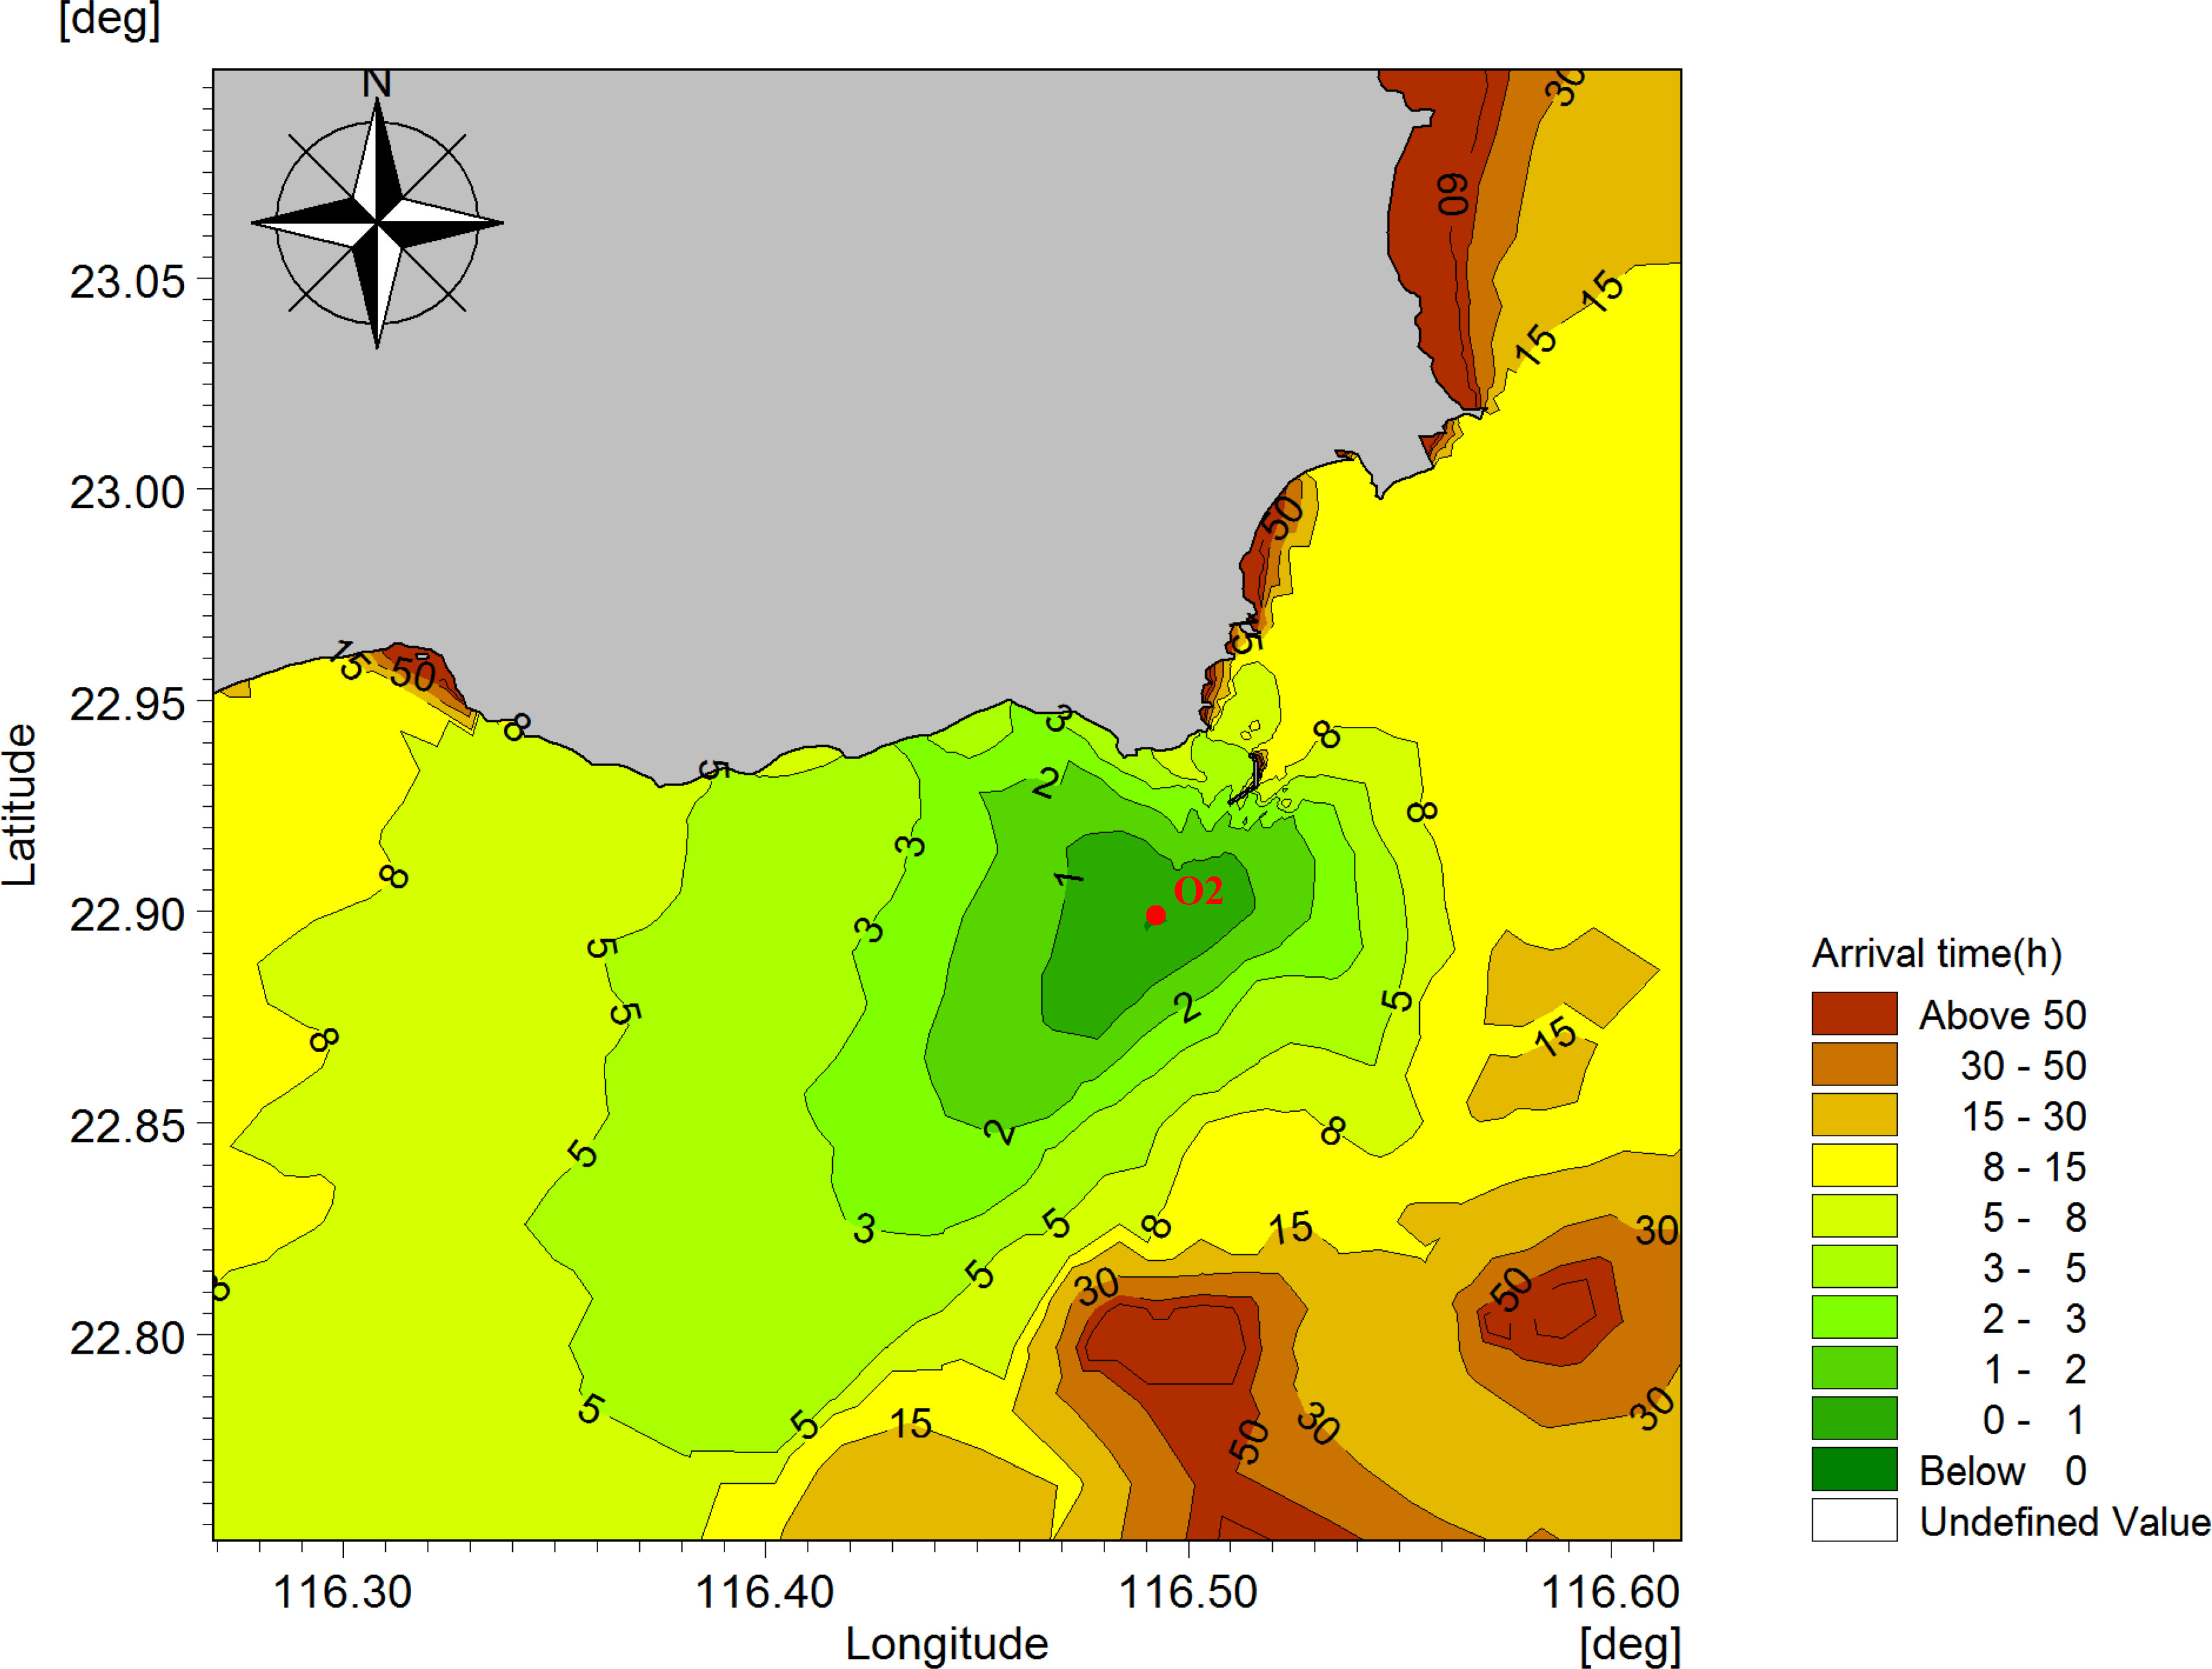
Figure 8 Distribution of the fastest arrival time (T) for the oil film from the oil spill accident occurred at site O2.
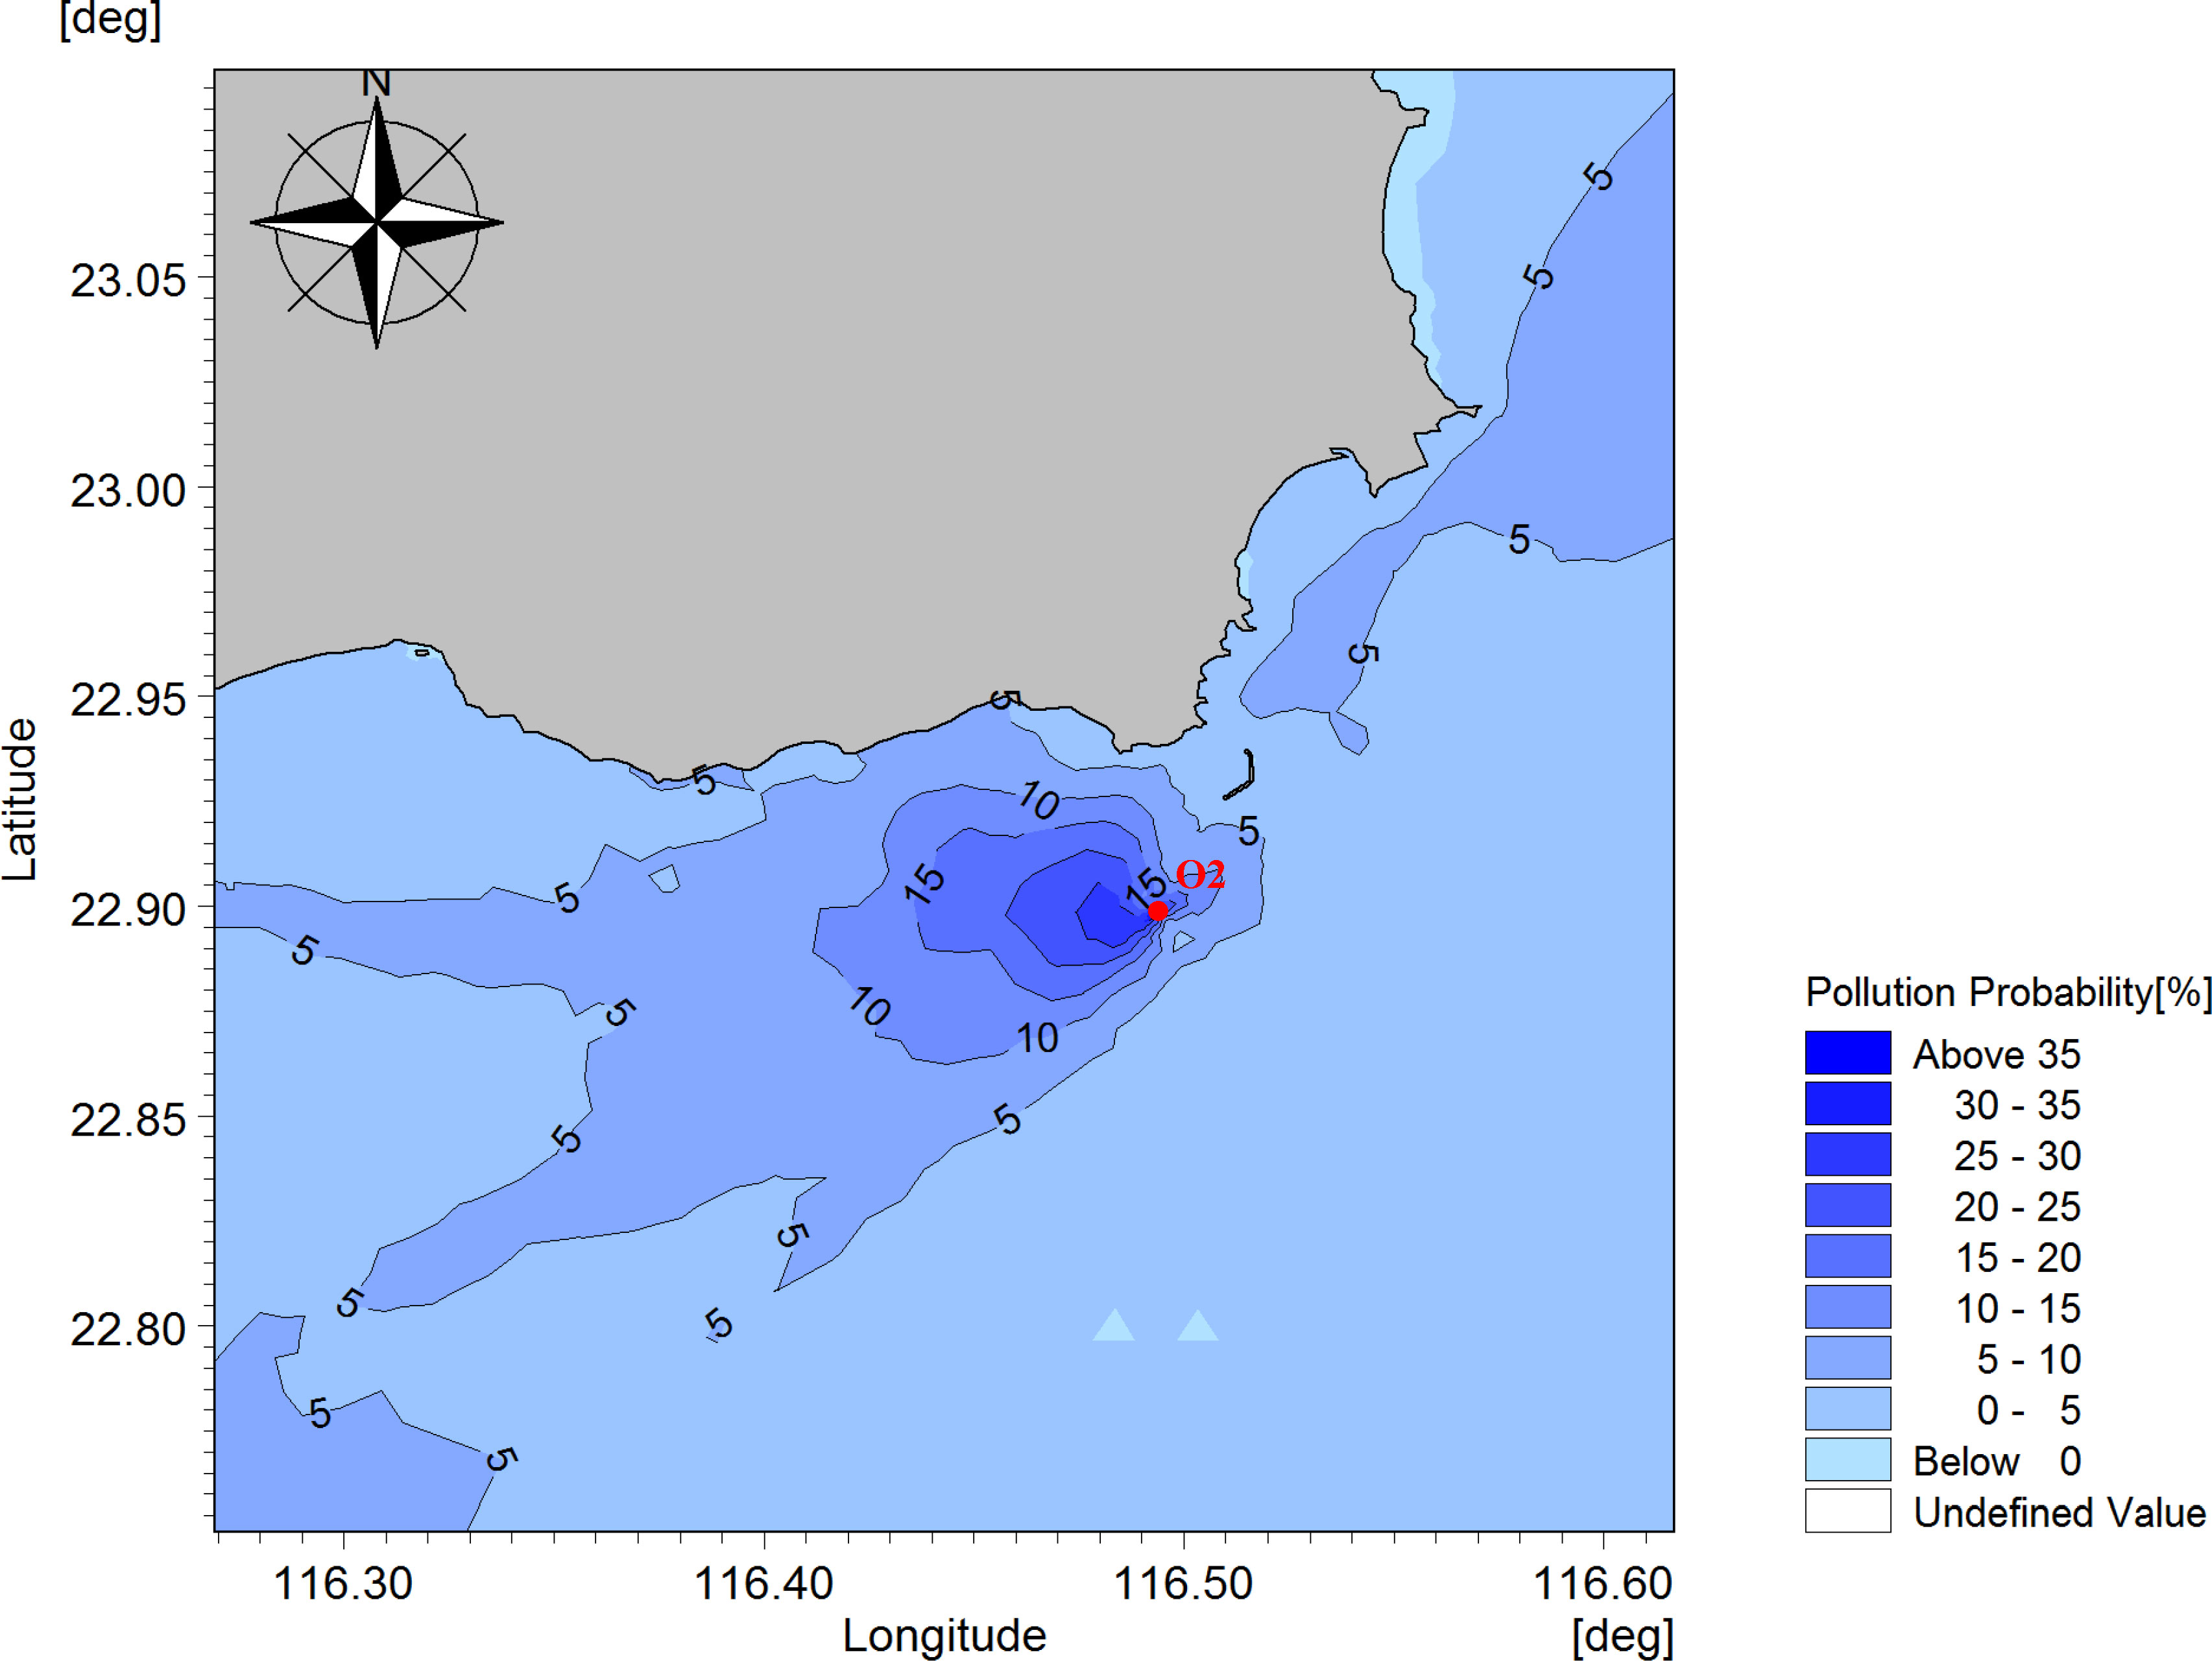
Figure 9 Distribution of pollution probability (P) for the oil film from the oil spill accident occurred at site O2.
When an oil spill occurs at the O2 site, the southwest area of the spill location has a higher probability of being contaminated by the oil spill and has a shorter time for the oil film to reach the area.
Mechanism analysis
Based on the wind speed and direction data of 300 randomly selected cases from the above 3-year daily averaged NCEP/NCAR wind field data, the wind frequency of the study area, and the average wind speed within the corresponding wind frequency were statistically obtained to form the wind rose diagram (Figure 10). The maximum wind frequency in the study area is northeast, and the wind frequency in this direction is greater than 8%. The maximum wind frequency corresponds to the maximum speed. The maximum wind speed in the northeast direction exceeds 10 m/s. In general, the prevailing wind direction in the study area is northeast, and the wind speed is high.
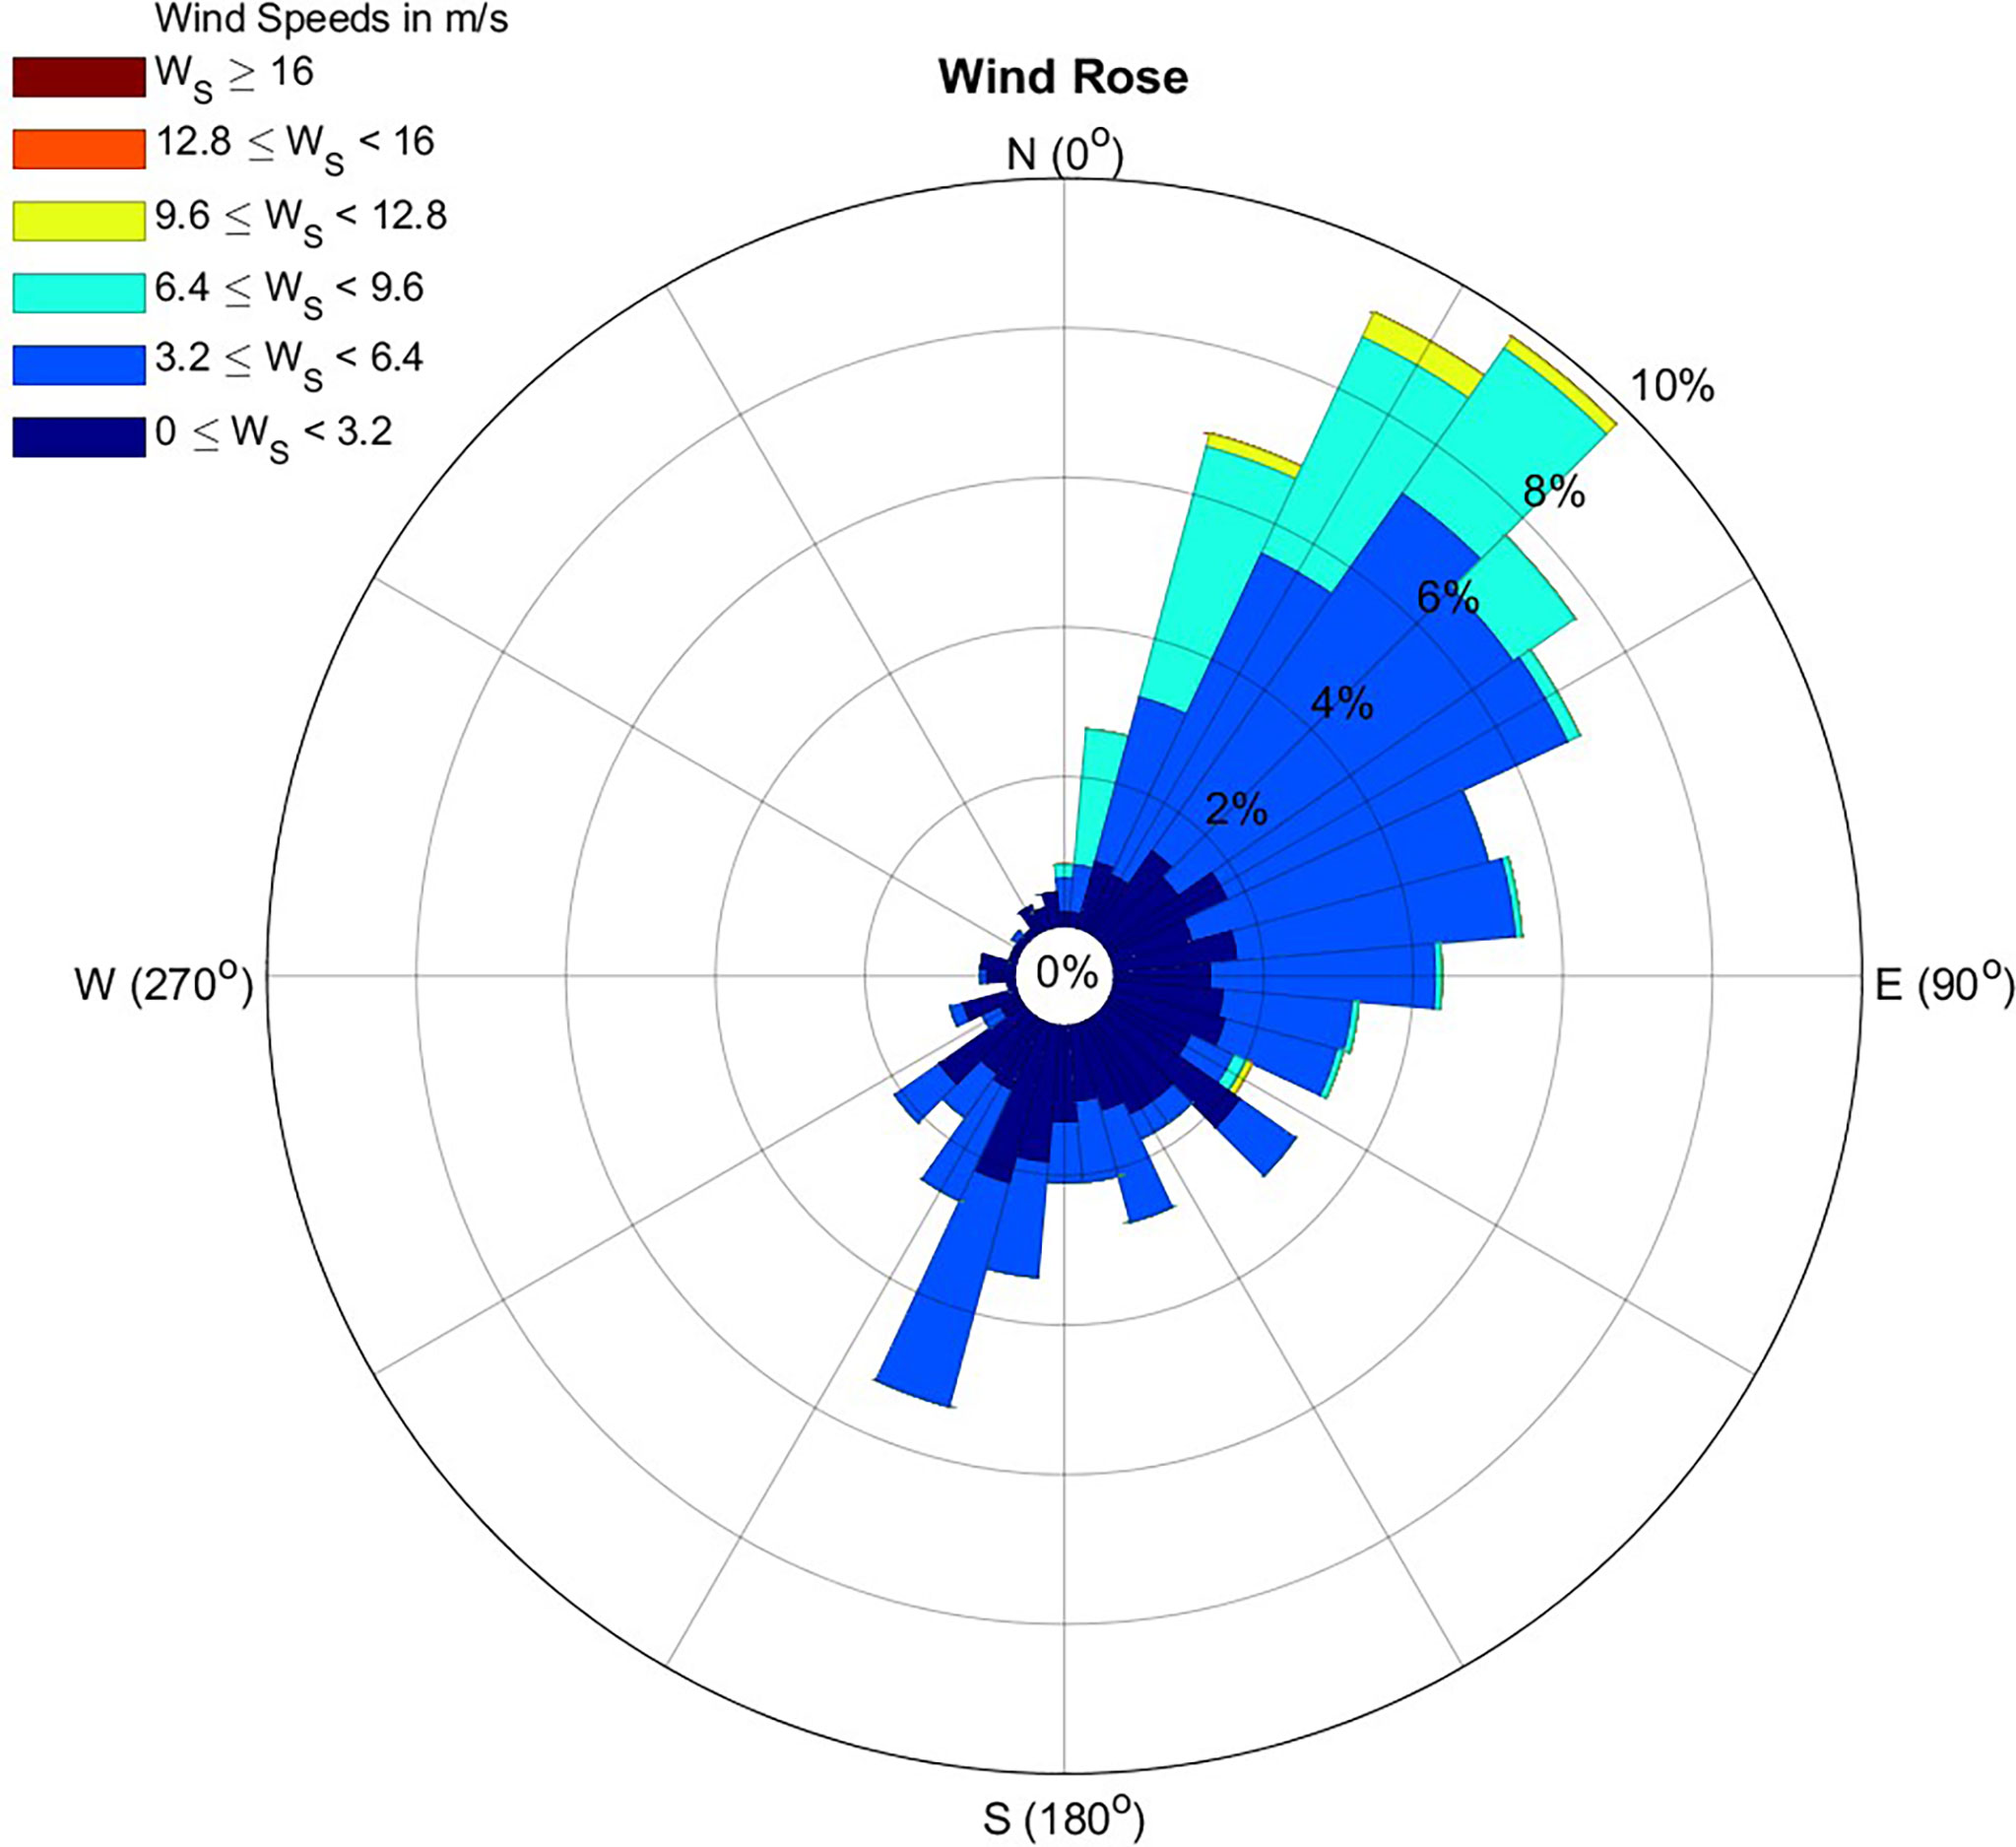
Figure 10 Wind rose diagram based on 300 randomly selected scenarios from 3-year daily averaged NCEP/NCAR wind data.
The distribution of the fastest arrival time of the oil film and the probability of the contamination of the oil spill at the two stations are consistent with the distribution of the prevailing wind direction in the region. Under the influence of the prevailing wind (northeast wind), the oil spill mainly spreads to the southwest, and the southwest of the accident site has a high probability of being contaminated by the oil spill. The wind direction has a significant effect on the direction of the dispersion of the oil spill. However, the probability of oil spill contamination at site O1 and the fastest arrival time of the oil film are also larger to the northeast of the spill site. It indicates that some of the oil film also spreads to the northeast of the accident site, which is opposite to the prevailing wind direction, indicating that the tidal dynamic process in the region may also play a role in the spread of the oil film.
Figure 11 shows the distribution of 30-day hourly tidal currents at stations O1 and O2 calculated by the tidal model in the nSCS. The tidal current distribution in site O1 and site O2 demonstrates significant differences. The breakwater built to the northeast of site O1 has resulted in a change in the tide at that location. The tide at site O1 flows mainly in the north–west direction, and the maximum tidal current velocity is about 0.25 m/s. The tidal current at site O2 is a typical reciprocal flow, flowing southwestward at high tide and northeastward at low tide. The tidal current velocity is high, with a maximum speed greater than 0.3 m/s. The relatively strong northwesterly tidal current velocity at site O1 has an influence on the spread of the oil spill, causing part of the oil spill at this site to spread to the northeast. Although the reciprocal flow is more dominant at site O2, the spreading of the oil spill at this site is mainly affected by the wind.
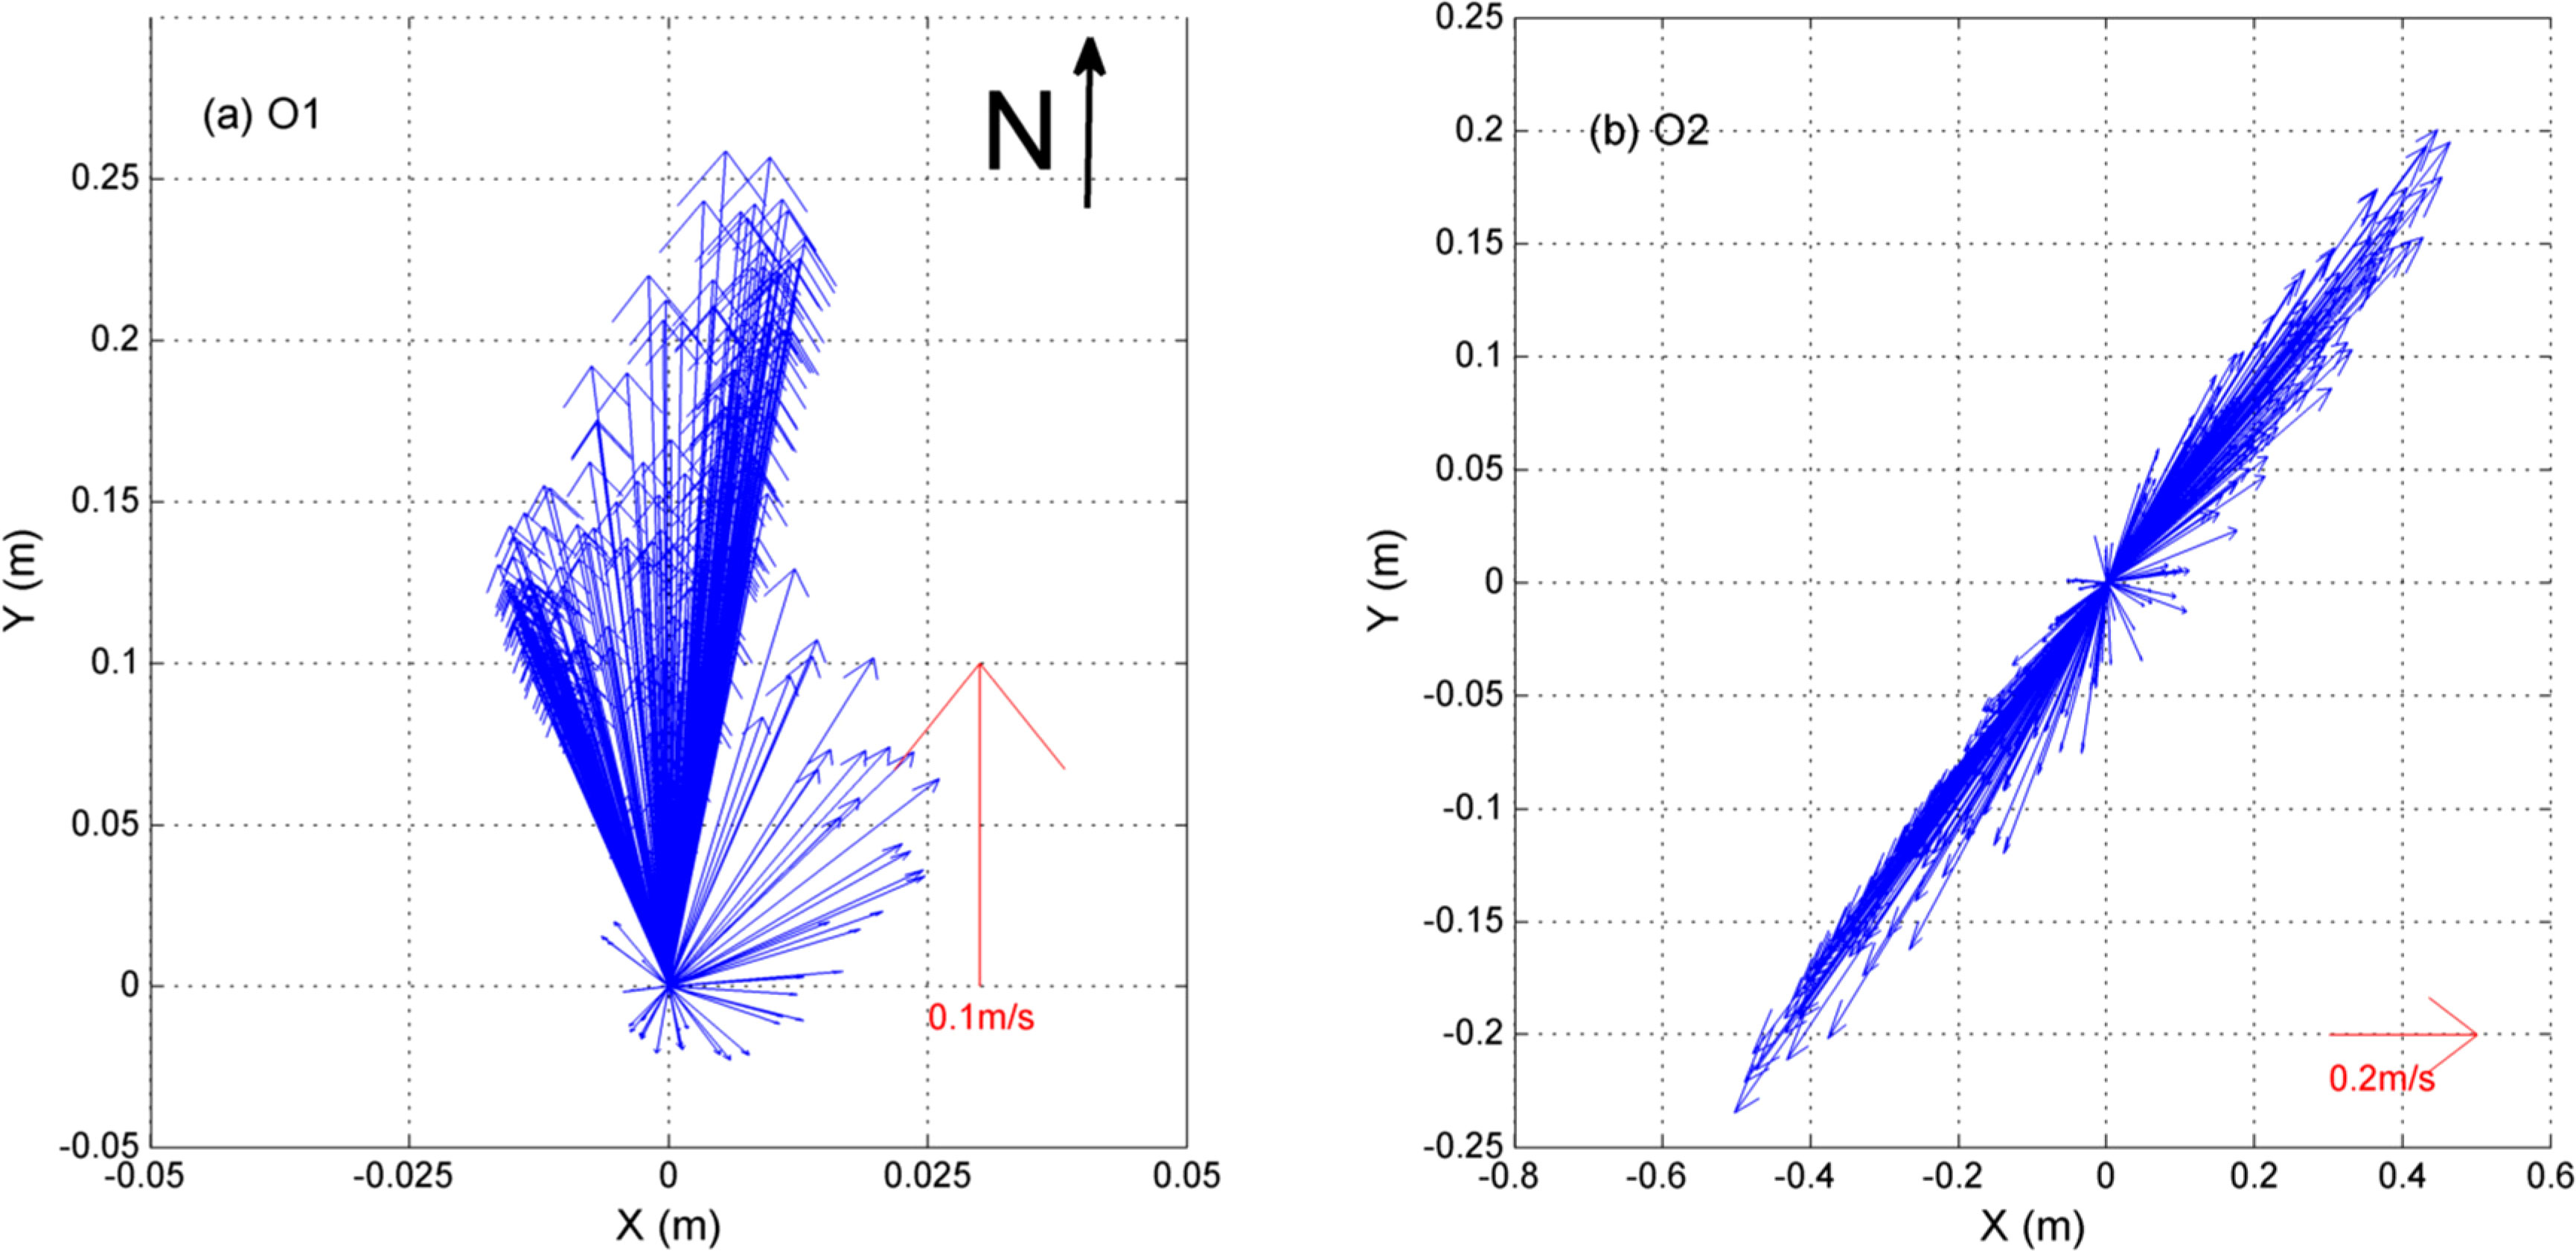
Figure 11 30-day hourly tidal current distributions at stations: (a) O1 and (b) O2, calculated by tidal model in the northern South China Sea.
In summary, the oil film dispersion caused by the nearshore oil spill accident in the nSCS is mainly influenced by the wind. Due to the difference in tidal dynamic conditions in different regions, the dispersion of oil spills from accidents in some regions is also influenced by tidal processes.
Conclusion
In the present study, a coastal tidal dynamics model was developed for the nSCS, and the model was validated using the field observed data. An oil spill dispersion forecasting model based on “oil particles” was built. Based on the above models, the stochastic approach was used to simulate the fastest arrival time of the oil film and the probability of contamination distribution to the surrounding marine environment from oil spills at the nearshore O1 and O2 sites in the nSCS.
Based on the simulation results of the fastest arrival time of the oil film (T) and the probability of contamination (P), the accidental oil spill, affected by wind forcing and tidal dynamic processes, mainly influences the northeast and southwest areas of the accidental site. The wind has a significant effect on the dispersion direction of the accidental oil spill, and both the migration and dispersion of accidental oil spills in some regions are also influenced by tidal processes.
We suggest using a stochastic scenario approach to predict the potential threat of an accidental oil spill to the surrounding marine environment and develop a scientific risk management strategy.
Data availability statement
The raw data supporting the conclusions of this article will be made available by the authors, without undue reservation.
Author contributions
BG: Conceptualization, Methodology, Writing - Original Draft. WZ: Methodology, Writing - Original Draft. LL: Data Curation. QC: Writing - Review & Editing. MH: Investigation. DW: Formal analysis. All authors contributed to the article and approved the submitted version.
Funding
This study is supported by the Guangdong Basic and Applied Basic Research Foundation (No. 2019A1515012108), the research fund from the State Key Laboratory of Tropical Oceanography (LTOZZ2101), and by the Key Special Project for Introduced Talents Team of Southern Marine Science and Engineering Guangdong Laboratory (Guangzhou) (GML2019ZD0404).
Conflict of interest
The authors declare that the research was conducted in the absence of any commercial or financial relationships that could be construed as a potential conflict of interest.
Publisher’s note
All claims expressed in this article are solely those of the authors and do not necessarily represent those of their affiliated organizations, or those of the publisher, the editors and the reviewers. Any product that may be evaluated in this article, or claim that may be made by its manufacturer, is not guaranteed or endorsed by the publisher.
References
Alkhatib A., Ayari M. A., Hawari A. H. (2021). Fouling mitigation strategies for different foulants in membrane distillation. Chem. Eng. and Processing Process Intensification 167, 108517. doi: 10.1016/j.cep.2021.108517
Al-Rabeh A., Cekirge H., Gunay N. (1989). A stochastic simulation model of oil spill fate and transport. Appl. Math. Model. 13, 322–329. doi: 10.1016/0307-904X(89)90134-0
Amir-Heidari P., Arneborg L., Lindgren J. F., Lindhe A., Rosén L., Raie M., et al. (2019). A state-Of-The-Art model for spatial and stochastic oil spill risk assessment: A case study of oil spill from a shipwreck. Environ. Int. 126, 309–320. doi: 10.1016/j.envint.2019.02.037
Balogun A.-L., Yekeen S. T., Pradhan B., Yusof K. B. W. (2021). Oil spill trajectory modelling and environmental vulnerability mapping using gnome model and gis. Environ. pollut. 268, 115812. doi: 10.1016/j.envpol.2020.115812
Beyer J., Trannum H. C., Bakke T., Hodson P. V., Collier T. K. (2016). Environmental effects of the deepwater horizon oil spill: A review. Mar. pollut. Bull. 110, 28–51. doi: 10.1016/j.marpolbul.2016.06.027
Camphuysen K., Heubeck M. (2015). Beached bird surveys in the north Sea as an instrument to measure levels of chronic oil pollution. Oil pollut. In North Sea 41, 193–208. doi: 10.1007/698_2015_435
Chen Q., Bao B., Li Y., Liu M., Zhu B., Mu J., et al. (2020). Effects of marine oil pollution on microbial diversity in coastal waters and stimulating indigenous microorganism bioremediation with nutrients. Regional Stud. In Mar. Sci. 39, 101395. doi: 10.1016/j.rsma.2020.101395
Chen J., Zhang W., Li S., Zhang F., Zhu Y., Huang X. (2018). Identifying critical factors of oil spill in the tanker shipping industry worldwide. J. Of Cleaner Production 180, 1–10. doi: 10.1016/j.jclepro.2017.12.238
Chen J., Zhang W., Wan Z., Li S., Huang T., Fei Y. (2019). Oil spills from global tankers: Status review and future governance. J. Of Cleaner Production 227, 20–32. doi: 10.1016/j.jclepro.2019.04.020
Demiguel-Jiménez L., Etxebarria N., Lekube X., Izagirre U., Marigómez I. (2021). Influence of dispersant application on the toxicity to Sea urchin embryos of crude and bunker oils representative of prospective oil spill threats in Arctic and Sub-Arctic seas. Mar. pollut. Bull. 172, 112922. doi: 10.1016/j.marpolbul.2021.112922
Ferguson A., Solo-Gabriele H., Mena K. (2020). Assessment for oil spill chemicals: Current knowledge, data gaps, and uncertainties addressing human physical health risk. Mar. pollut. Bull. 150, 110746. doi: 10.1016/j.marpolbul.2019.110746
Fisher C. R., Montagna P. A., Sutton T. T. (2016). How did the deepwater horizon oil spill impact deep-Sea ecosystems? Oceanography 29, 182–195. doi: 10.5670/oceanog.2016.82
Gao W., Yin X., Mi T., Zhang Y., Lin F., Han B., et al. (2018). Microbial diversity and ecotoxicity of sediments 3 years after the jiaozhou bay oil spill. Amb Express 8, 1–10. doi: 10.1186/s13568-018-0603-6
Kampouris K., Vervatis V., Karagiorgos J., Sofianos S. (2021). Oil spill model uncertainty quantification using an atmospheric ensemble. Ocean Sci. 17, 919–934. doi: 10.5194/os-17-919-2021
Keramea P., Spanoudaki K., Zodiatis G., Gikas G., Sylaios G. (2021). Oil spill modeling: A critical review on current trends, perspectives, and challenges. J. Of Mar. Sci. and Eng. 9, 181. doi: 10.3390/jmse9020181
Law R. J., Hellou J. (1999). Contamination of fish and shellfish following oil spill incidents. Environ. Geosci. 6, 90–98. doi: 10.1046/j.1526-0984.1999.08039.x
Niu H., Li S., King T., Lee K. (2016). “Stochastic modeling of oil spill in the salish Sea,” in The 26th International Ocean And Polar Engineering Conference, International Society of Offshore and Polar Engineers, 758–754
Prakash B., Kedia A., Mishra P. K., Dubey N. (2015). Plant essential oils as food preservatives to control moulds, mycotoxin contamination and oxidative deterioration of agri-food commodities–potentials and challenges. Food Control 47, 381–391. doi: 10.1016/j.foodcont.2014.07.023
Prasad S., Nair B., Rahaman H., Shenoi S., Vijayalakshmi T. (2018). An assessment on oil spill trajectory prediction: Case study on oil spill off ennore port. J. Of Earth System Sci. 127, 1–8. doi: 10.1007/s12040-018-1015-3
Rabalais N. N., Smith L. M., Turner R. E. (2018). The deepwater horizon oil spill and gulf of Mexico shelf hypoxia. Continental Shelf Res. 152, 98–107. doi: 10.1016/j.csr.2017.11.007
Saçu Ş., Şen O., Erdik T. (2021). A stochastic assessment for oil contamination probability: A case study of the bosphorus. Ocean Eng. 231, 109064. doi: 10.1016/j.oceaneng.2021.109064
Samuels W. B., Amstutz D. E., Bahadur R., Ziemniak C. (2013). Development of a global oil spill modeling system. Earth Sci. Res. 2, 52. doi: 10.5539/esr.v2n2p52
Toz A. C. (2017). Modelling oil spill around bay of samsun, Turkey, with the use of oilmap and adios software systems. Polish Maritime Res. 3 (95), 115–125. doi: 10.1515/pomr-2017-0096
Troisi G., Barton S., Bexton S. (2016). Impacts of oil spills on seabirds: Unsustainable impacts of non-renewable energy. Int. J. Of Hydrogen Energy 41, 16549–16555. doi: 10.1016/j.ijhydene.2016.04.011
Wang Y., Lee K., Liu D., Guo J., Han Q., Liu X., et al. (2020). Environmental impact and recovery of the bohai Sea following the 2011 oil spill. Environ. pollut. 263, 114343. doi: 10.1016/j.envpol.2020.114343
Yu H. (2021). The guangdong-Hong Kong-Macau greater bay area in the making: Development plan and challenges. Cambridge Rev. Of Int. Affairs 34, 481–509. doi: 10.1080/09557571.2019.1679719
Keywords: oil spill accident, The northern South China Sea, risk assessment, stochastic scenario simulation, Numerical modeling
Citation: Geng B, Zhou W, Lu L, Cao Q, Hong M and Wen D (2022) Risk assessment of offshore oil spill in the northern South China Sea: A stochastic scenario modeling approach. Front. Mar. Sci. 9:986379. doi: 10.3389/fmars.2022.986379
Received: 05 July 2022; Accepted: 15 August 2022;
Published: 02 September 2022.
Edited by:
Dilip Kumar Jha, National Institute of Ocean Technology, IndiaReviewed by:
Qiao Yongmin, Jinan University, ChinaFeng Jiang, Sun Yat-sen University, China
Balasubramaniam Sujatha, Pachaiyappa’s College for Men, India
Copyright © 2022 Geng, Zhou, Lu, Cao, Hong and Wen. This is an open-access article distributed under the terms of the Creative Commons Attribution License (CC BY). The use, distribution or reproduction in other forums is permitted, provided the original author(s) and the copyright owner(s) are credited and that the original publication in this journal is cited, in accordance with accepted academic practice. No use, distribution or reproduction is permitted which does not comply with these terms.
*Correspondence: Wen Zhou, zhouwen@scies.org