H3K4me3 CUT&Tag and Transcriptome Analysis Reveal the Epigenetic Regulatory Landscape in Gill Tissue of Large Yellow Croaker (Larimichthys crocea) Under Low Salinity Stress
 Jian Yang
 Minhai Liu1
  Qi Li
Qi Li- 1Ninghai Institute of Mariculture Breeding and Seed Industry, Zhejiang Wanli University, Ningbo, China
- 2Key Laboratory of Mariculture, Ministry of Education, Ocean University of China, Qingdao, China
- 3Ningbo Academy of Oceanology and Fishery, Ningbo, China
H3K4me3 is an important histone modification that could influence DNA replication and RNA translation in response to abiotic stress. Here, RNA-seq analyses were conducted in gill tissues of large yellow croaker to identify the function of H3K4me3 under low salinity stress. Additionally, CUT&Tag analyses were performed to identify the genome-wide dynamic changes in H3K4me3 and explore the mechanisms by which H3K4me3 regulates gene expression. A total of 201 differentially expressed genes (DEGs) were identified between the 5‰ low salinity group (S-group) and 25‰ normal salinity group (C-group), among which 23 DEGs (11 up-regulated H3K4me3 targets and 12 down-regulated targets) were directly regulated by H3K4me3. Our findings thus describe the epigenetic regulatory landscape of H3K4me3 in gill of large yellow croaker during low salinity stress, and provide novel insights into the regulation mechanisms of H3K4me3 mediating the responses of aquatic animals to abiotic stress.
Introduction
Environmental salinity is a crucial factor that can significantly alter the physiological and endocrine status of marine fish, thereby influencing growth, reproduction, and ultimately survival. Extreme weather events (e.g., heavy precipitation) are becoming increasingly frequent worldwide (Peter et al., 2019). In conjunction with surface runoff, these events can severely affect the salinity of inshore aquaculture ponds and jeopardize the culture of marine organisms. Large yellow croaker is the most productive marine fish artificially cultured in China, and coastal cage-culture is the most widely implemented aquaculture model for this species. However, the expansion of large yellow croaker cultivation spaces has become severely restricted due to constant fluctuations in salinity and poor water exchange capacity. Thus, studies on the salinity regulatory mechanisms of large yellow croaker and the selection of varieties capable of adapting to low salinity have recently garnered increasing attention. Most studies on low salinity adaptation of large yellow croaker have mainly focused on ion osmoregulation, energy metabolism, and immune response using omics technology and related molecular biological techniques and methods (Zeng et al., 2017; Lu et al., 2020; Teng et al., 2022). Nevertheless, few studies have assessed the role of epigenetic regulation mechanisms, particularly histone modifications, in marine fish under low salinity stress.
Histone methylation is an important posttranslational modification, which can occur in any components of the nucleosome octamer, but mainly occur on lysine residues, particularly lysine 4 of histone H3 (H3K4), lysine 9 of histone H3 (H3K9), lysine 27 of histone H3 (H3K27), and lysine 36 of histone H3 (H3K36) (Zhang and Reinberg, 2001; Rodriguez and Esteller, 2011). Furthermore, histone methylation levels can also vary (e.g., monomethylation, dimethylation, and trimethylation) and different types of methylated histone can exhibit different biological functions (Bannister et al., 2002; Sims et al., 2003; Esteller, 2007). H3K4 monomethylation (H3K4me1) and H3K4 dimethylation (H3K4me2) sites are more widely distributed than H3K4 trimethylation (H3K3me3) sites, however H3K4me3 plays a critical role in the growth and development of living organisms due to its significantly higher methylation level compared to H3K4me1 and H3K4me2 (Pinon et al., 2017; An et al., 2018). Previous studies have reported that H3K4me3 was highly enriched in the transcription initiation sites (TSS) of genes; and H3K4me3 could both bind with transcription-activated and transcription-inhibited promoters. H3K4me3 binding promoters often have RNA polymerase II binding sites, and therefore the methylation status of H3K4 could significantly influence the transcription initiation of related genes (Mikkelsen et al., 2007; Guenther et al., 2007). Other studies have reported that the methylation status of H3K4 significantly changed under stressful conditions, which in turn induced the expression of stress response-associated genes (Chen and Wu, 2010; Hu et al., 2011; Seibel et al., 2014). H3K4 methylation is a critical driver of the stress response; however, the mechanisms that regulate this phenomenon remain unclear.
Cleavage Under Targets and Tagmentation (CUT&Tag) is a novel method that enables the characterization of the interaction between proteins and chromatin (Hatice et al., 2019). Unlike ChIP-seq, CUT&Tag is highly sensitive due to the high efficiency of tethered Tn5 integration, which also simplifies the library construction and increases the signal-to-noise ratio. This technology thus makes it possible to profile histone modifications and transcription factors on small cell numbers and single cells (Hatice et al., 2020).
Given the quantitative nature of low salinity adaptation, this study comparatively analyzed the dynamic transcriptional and epigenetic changes in gill tissues of large yellow croaker under low salinity stress. By combining CUT&Tag and RNA-seq analyses, this study provides the first comprehensive characterization of transcriptome and epigenome dynamics in marine fish exposed to low salinity stress, thereby enabling a better understanding of the low salinity adaptation mechanisms of large yellow croaker.
Materials and Methods
Animal Experiments and Sample Collection
Large yellow croaker specimens were collected from aquaculture cages at Ningbo Academy of Oceanology and Fishery in Xiangshan Bay, Zhejiang Province, China. Before the experiment, 150 individuals were temporarily cultured in a 25‰ salinity seawater tank (3-m diameter) for 15 days to acclimate to the experimental environment. The fish was fed daily with commercial mixed feed and the water was exchanged once per day to eliminate residual feed and excrement. Next, 60 healthy similarly sized fish (body weight 76.41 ± 9.55 g, body length 175.01 ± 7.24 mm) were randomly selected and transferred into 6 tanks (1-m diameter; 10 individuals per tank with 500 L 25‰ seawater). After 7 days of acclimation, all of the fish in the 6 tanks were transferred into 6 new tanks respectively which with two salinity treatments [5‰ (S-group) and 25‰ (C-group)] conducted in triplicate. During the experiment, the fish was kept at 22–23°C and DO 8.1–8.7 mg L−1, fed with commercial mixed feed once per day, and 1/3 of the water was exchanged daily. After 7 days, three individuals from each tank were randomly selected and anesthetized with 50 mg/L MS-222. The gill tissues were then dissected and immediately flash-frozen in liquid nitrogen. The gill samples in each tank were divided into three sections to conduct gene expression, RNA-seq, and CUT&Tag analyses.
Gene Expression Assay
The total RNA of gill tissues was extracted using the TRIzol reagent (Invitrogen, CA, USA), the first strand cDNA was synthesized using the High Capacity cDNA Reverse Transcription Kit (Roache, CA, USA). Quantitative real-time PCR (qRT-PCR) primers were designed using the Primer3 program (Table 1). qRT-PCR was performed using the TB Green Premix Ex Taq II Kit (TaKaRa, Dalian, China). The amplification program consisted of a 95°C pre-denaturation step for 60 s, followed by 40 cycles each of a 95°C denaturation step for 15 s, and a 60°C extension step for 30 s. The expression of target genes was normalized against 18s, which was used as a reference gene.
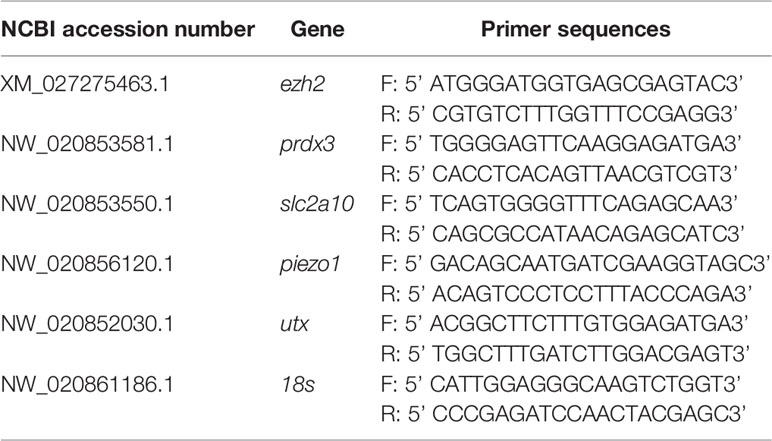
Table 1 Primers used in this study.
Transcriptome Sequencing
To characterize the transcriptional dynamics in gill tissues during low salinity exposure, six gill samples from the S-group (5‰) and C-group (25‰) (i.e., triplicate in each group) were collected 7 days after the experimental period. The total RNA of the gill tissues was extracted using the TRIzol reagent (Thermo Fisher Scientific, MA, USA). Total RNA concentrations were measured using the Qubit® RNA Assay Kit coupled with a Qubit® 2.0 Fluorometer, and its integrity was assessed using an RNA Nano 6000 Assay Kit (Agilent Technologies, CA, USA). The sequencing libraries were constructed using the NEB Next UltraTM RNA Library Prep Kit (New England Biolabs, MA, USA) following the manufacturer’s instructions. The libraries were sequenced on an Illumina NovaSeq platform and 150 bp paired-end reads were generated.
In order to evaluate the similarity and variability of S-group and C-group, we used DESeq2 software to compare the difference of gene expression among the two salinity group. The clean RNA-seq data were mapped to the reference genome (accession number: GCF_000972845.2). The visual volcano map and DEG heat map was constructed by Ggplot2 software package and pheatmap software package in the R software, respectively. All the differentially expressed genes (DEGs) were mapped to the gene ontology (GO) database and KEGG database using Blast2GO and BLASTx software, respectively. GO and KEGG enrichment analysis was conducted using GOseq R package and KOBAS software, the selection criterion of enriched KEGG pathways was set as P-value < 0.05.
H3K4me3 CUT&Tag Analysis
CUT&Tag analysis was performed using the CUT&Tag 2.0 High-Sensitivity Kit for Illumina (Catalog number: N259, Novoprotein, China) as described by the manufacturers, with some modifications (Hatice et al., 2019). The three gill samples obtained from the S-group (5‰) and C-group (25‰) were then respectively pooled. Briefly, nuclei were extracted from the gill tissues, which were incubated with H3K4me3-specific primary antibodies (AB_2615077) with IgG antibody as a control (normal rabbit IgG, Millipore cat. no. 12-370), followed by the secondary antibody (anti-rabbit IgG antibody, Millipore AP132). A diluted pA-Tn5 adapter complex was then added to the above system, after which DNA was recovered from each of the samples for library construction. Library sequencing was performed on an Illumina NovaSeq platform at Jiayin Biotechnology Ltd. (Shanghai, China).
The FastQC and MultiQC software was used to examine library quality, and the Cutadapt software was used to remove joint sequences and obtain clean sequencing data. Sequence alignment was conducted using the BWA-MEM algorithm of the BWA software, after which sequences were filtered and repetitions were removed using the SAMtools suite. Peak calling and screening were conducted using Macs2 software with a q-value threshold of < 0.05.
Integrated Analysis of CUT&Tag and RNA-Seq Data
To clarify the relationship between H3K4me3 histone modification and related gene expression regulation, we used BETA software (Version 1.0.7) to identify H3K4me3 target genes displaying significant changes that might be attributable to H3K4me3 regulation activity according to a previous study (Wang et al., 2013). Motif analysis was conducted using findMotifsGenome.pl of HOMER software in 200bp up- and down-stream of peaks area; then the predicted motifs were matched to the reported motifs in HOMER and JASPAR database to identify enriched DNA sequences in H3K4me3 binding summits. Further, using the H3K4me3 binding sequence to identify its target genes via comparing with the reference genome of large yellow croaker. Whereafter, the overlapping analysis of the DEGs in RNA-seq and predicted H3K4me3 target genes in CUT&Tag analysis was performed to identify the target DEGs regulated by H3K4me3.
Statistical Analyses
The relative gene expression was calculated using the 2 -△△CT method (Livak and Schmittgen, 2001). Gene expression differences between the C-group and S-group were analyzed via two-way ANOVA followed by Bonferroni’s post hoc test.
Results
Expression of Genes Associated With Osmotic Regulation and Histone Methylation
The relative expression of five osmotic regulation and histone methylation related genes (ezh2, prdx3, slc2a10, piezo1, and utx) in the gills of large yellow croaker were calculated after 7 days of low salinity exposure. Our findings indicated that the expression level of these genes were significantly higher in S-group (5‰) compared with C- group (25‰) (Figure 1). Peroxiredoxin (prdx3) is a ubiquitous multifunctional and evolutionarily conserved hyperoxide reductase, which protects cells from reactive oxygen species (ROS)-induced damage (Zhang et al., 2007). Facilitative glucose transporter 10 (slc2a10) is a transmembrane transport protein that mediates the transport of glucose, hexose, and ascorbic acid (Lee et al., 2010). Piezo1 is an evolutionarily conserved electropositive ion transport protein that is involved in cell volume maintenance (Moroni et al., 2018). The changes in the expression levels of prdx3, slc2a10, and piezo1 indicated that the antioxidant level, energy metabolism, and ion transport in the gill of large yellow croaker exhibited adaptive changes during low salinity exposure.
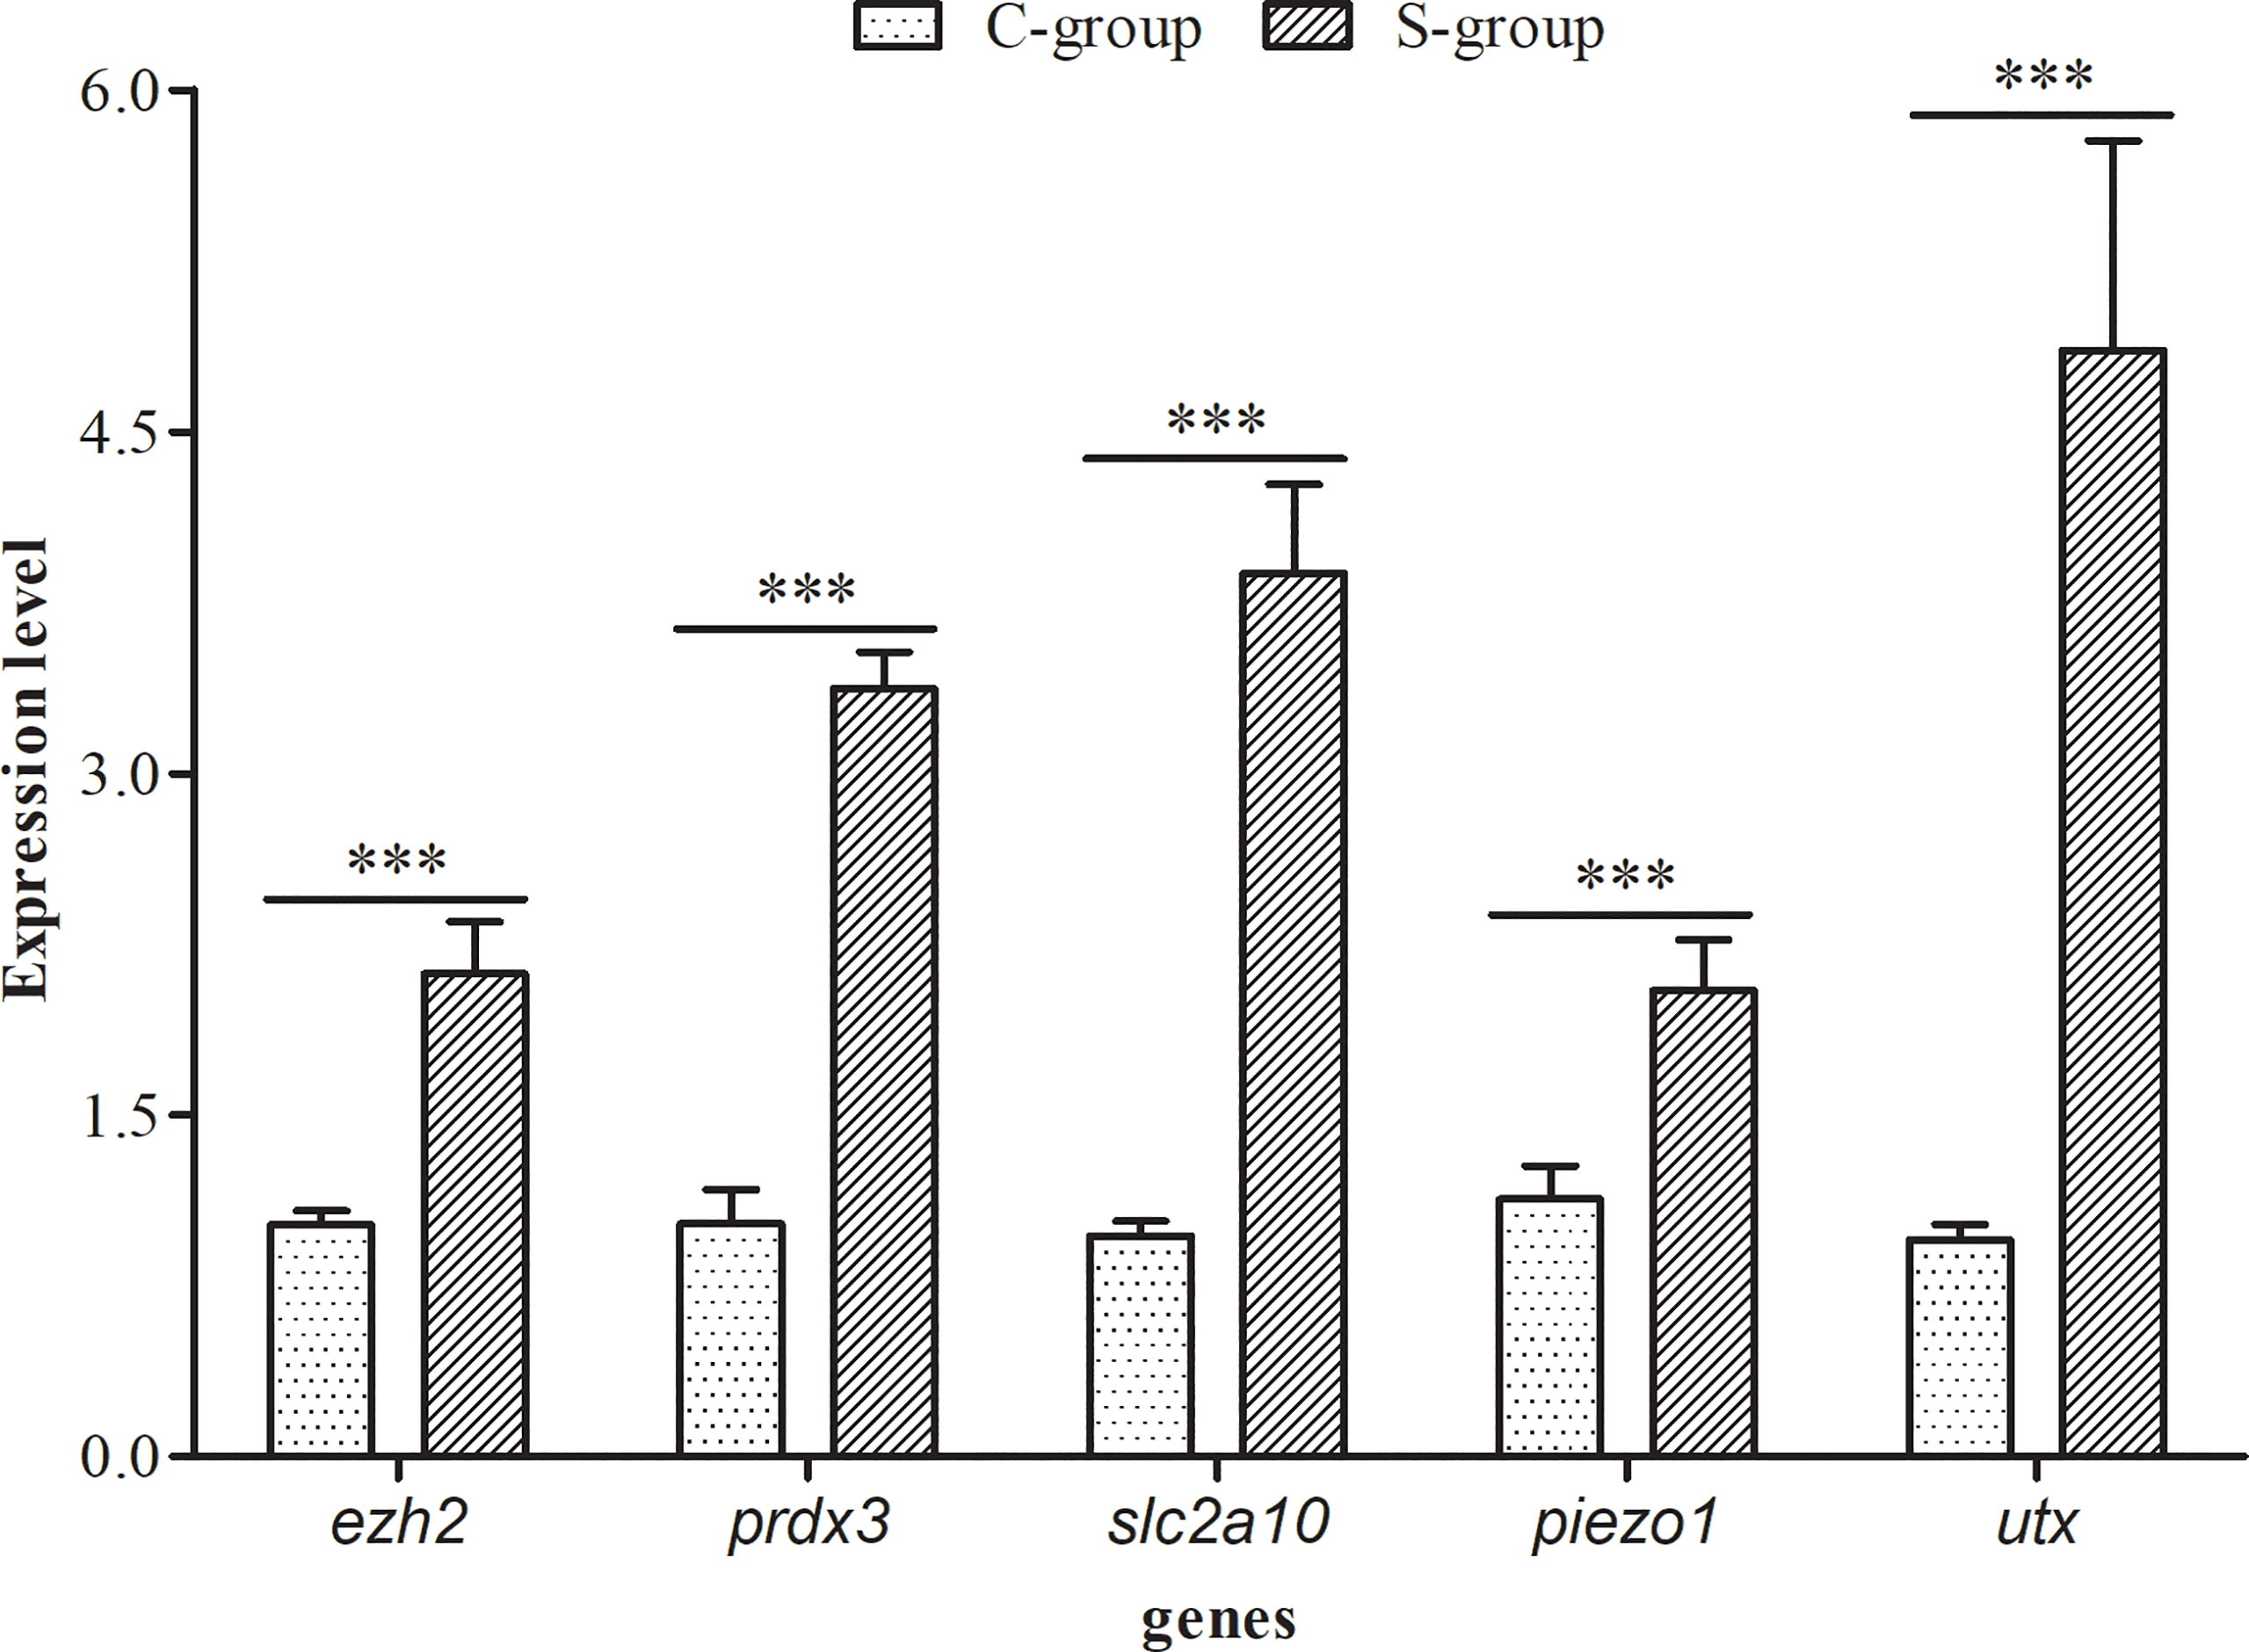
Figure 1 Effects of low salinity exposure on gene expression in gills of large yellow croaker. The data represent the means and the error bars indicate the standard deviation (n = 3), ***p < 0.05.
Transcriptional Dynamics in Gill Under Low Salinity Stress
After filtering and removing low quality raw reads, a total of 11.58 million clean reads in the C-group and 11.89 million clean reads in S-group were obtained. For each sample, 6 GB of clean bases were generated. The clean reads of each sample were mapped to the reference genome of large yellow croaker with a 92.45% alignment efficiency, and the ratio of clean reads with unique position in the reference genome exceeded 89.04% (Table 2), with Q30 bases accounting for more than 96% of all samples, confirming that the obtained sequences were high-qualified and could thus be used in downstream alignment steps and analyses.
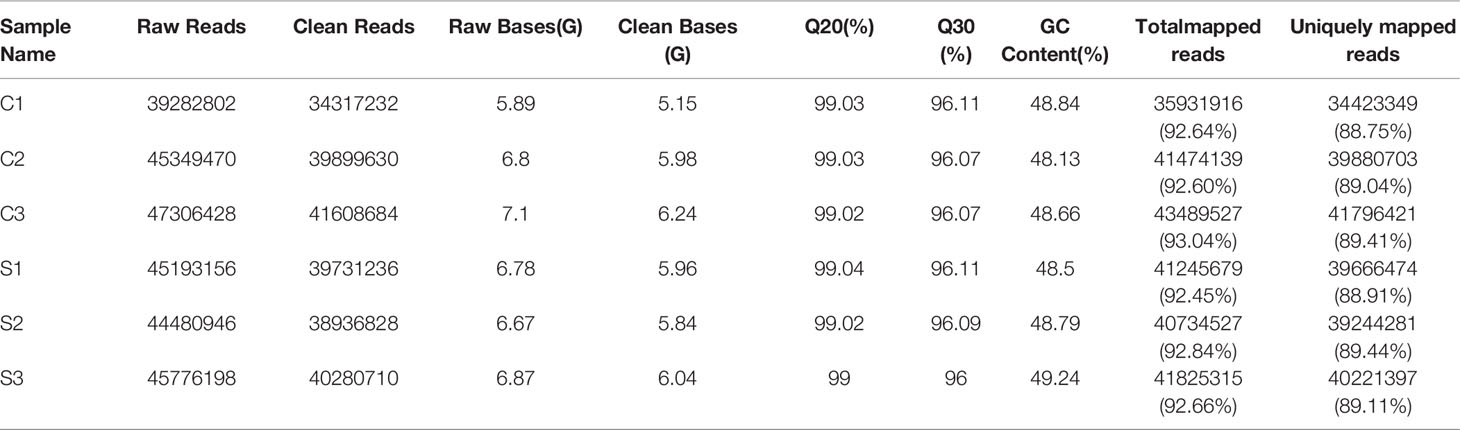
Table 2 RNA-seq data summary of large yellow croaker gill tissue.
The three replicate samples were grouped together in the cluster analyses, indicating that salinity was the principal stress factor (Figure 2A). Compared with C-group, a total of 201 DEGs (|log2FC| > 1, p-value < 0.05) were identified in the S-group. Among these DEGs, 88 were up-regulated and 113 were down-regulated (Figure 2B). Interestingly, more genes were down-regulated, indicating that most DEGs were suppressed in gills in response to low salinity stress.
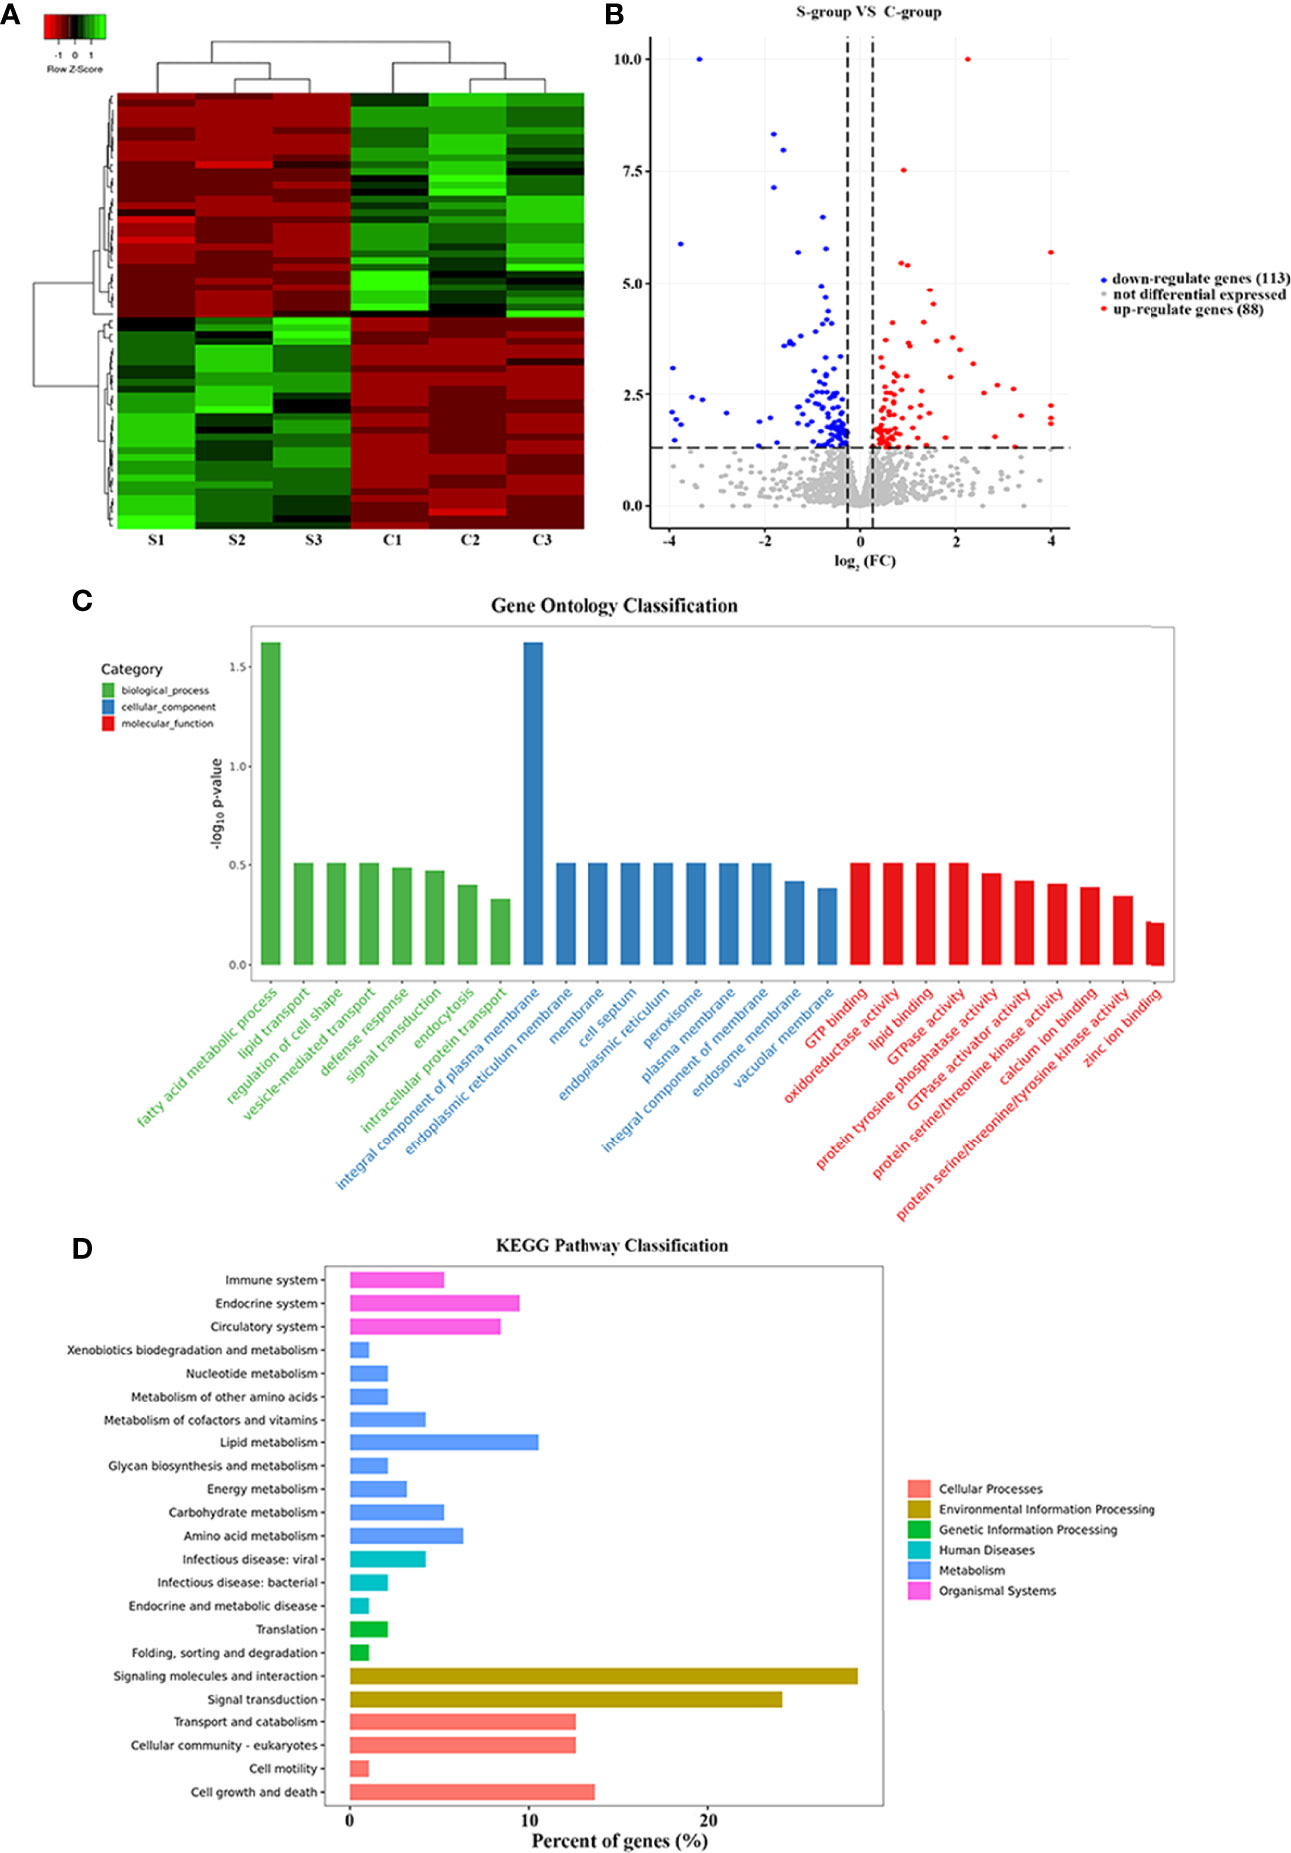
Figure 2 Transcriptional analysis of low salinity exposure in gill of large yellow croaker. (A) Heatmap of the DEGs between the C- and S-group; red represents up-regulated genes, green represents down-regulated genes, and black represents genes with no significant differences. (B) Volcano plot of the gene expression differences between groups C and S; red represents up-regulated genes, blue represents down-regulated genes, and gray represents genes with no significant differences. (C) GO enrichment of DEGs. The DEGs were annotated into three major functional categories: biological process, cellular component, and molecular function; the x-axis indicates the names of the GO terms and the y-axis indicates the number of DEGs; red represents the total genes between the C and S groups; blue represents the DEGs between the C and S groups. (D) KEGG pathway enrichment analysis. The x-axis indicates the percentage of DEGs in each category; the y-axis indicates the KEGG pathway categories.
GO terms were categorized as biological process (BP), molecular function (MF), and cellular component (CC). A total of 25,957 unigenes were annotated into 91 sub-categories of the three major GO functional categories, including 36 BP categories, 13 CC categories, and 42 MF categories. The details of gene annotations for the three major categories are illustrated in Figure 2C. The fatty acid metabolic process (GO: 0006631) of the BP category and integral component of plasma membrane (GO: 0005887) of the CC category were significantly enriched. Further, DEGs were significantly enriched into different GO terms with a standard of p-value < 0.02 (Table 3).
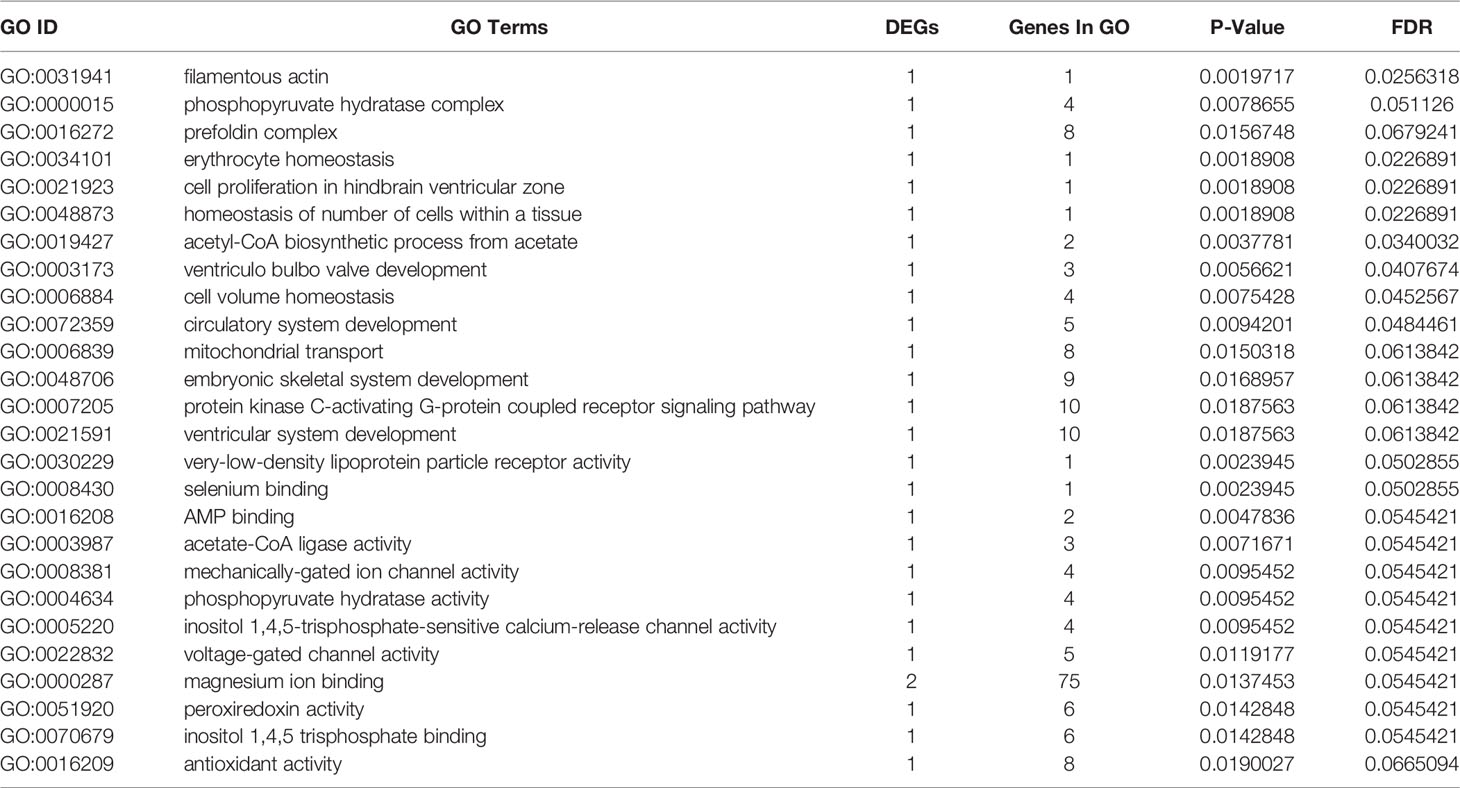
Table 3 Significant GO enrichments with significantly annotated DEGs in large yellow croaker gill tissue for comparisons of S-group and C-group.
Based on DEGs annotation, KEGG analysis provided more detailed information of the biological processes in gill tissues of large yellow croaker in responses to low salinity stress. Compared with the C-group, the DEGs were mainly enriched in the “environmental information process”, “cellular process”, and “metabolism” KEGG pathway clusters (Figure 2D). Particularly, five pathways were significantly enriched after 7 days of low salinity exposure: Cell adhesion molecules (CAMs) (path: lco04514), Cytokine-cytokine receptor interaction (path: lco04060), Tight junction (path: lco04530), PPAR signaling pathway (path: lco03320), and Ferroptosis (path: lco04216), with a standard of p-value <0.05 (Table 4).
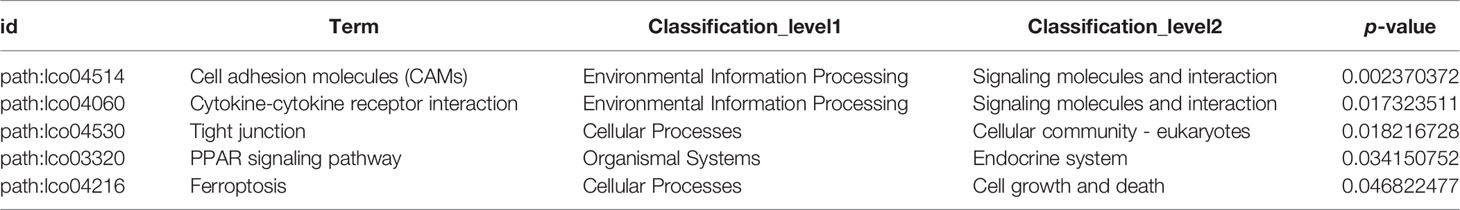
Table 4 KEGG pathway enrichment of large yellow croaker gill tissue.
H3K4me3 Modification Changes in Gill Under Low Salinity Stress
In this work, gill samples were collected from large yellow croaker individuals in S-group and C-group after 7 days of exposure. A CUT&Tag analysis was then conducted to evaluate the role of H3K4me3 histone modification in low salinity adaptation of large yellow croaker. Qubit analysis was performed after PCR enrichment and purification, and the results indicated that the quality and quantity of the nuclei of the two samples satisfied the requirement of the CUT&Tag reaction. Next generation sequencing (NGS) was then performed, after which 8.53 million and 6.74 million sequences were mapped in the C- and S-groups, respectively (Table 5). The number of called peaks in the S-group and C-group was 2,423 and 6,346, respectively. Further, more than 86% of the reads were mapped to the reference genome for the H3K4me3 histone modification samples. Analysis of the read distribution across genes indicated that the obtained reads count of S-group was significantly higher than that of C-group, and the enriched reads, namely the H3K4me3 binding sites, were mainly distributed in the transcriptional start sites (TSSs) (Figures 3A–C). Moreover, most of the reads across peaks in both the S- and C-group were distributed near the peak center, which confirmed the quality and features of the H3K4me3 CUT&Tag data (Figures 3D–F).
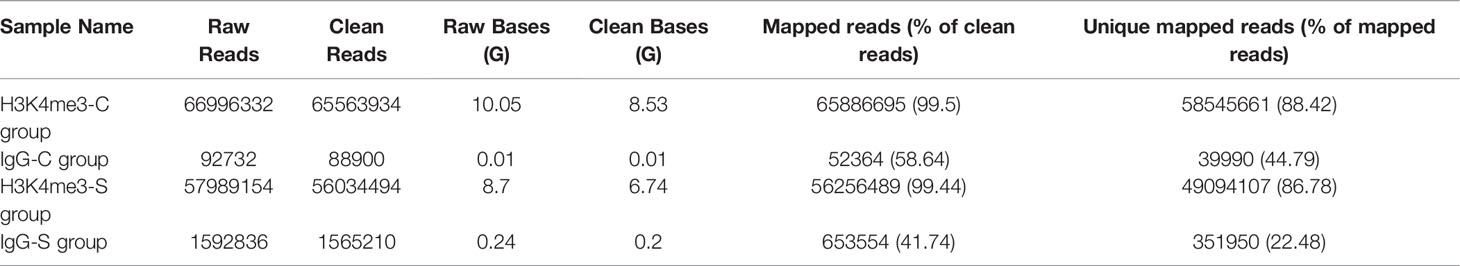
Table 5 H3K4me3 CUT&Tag data summary of large yellow croaker gill tissue.
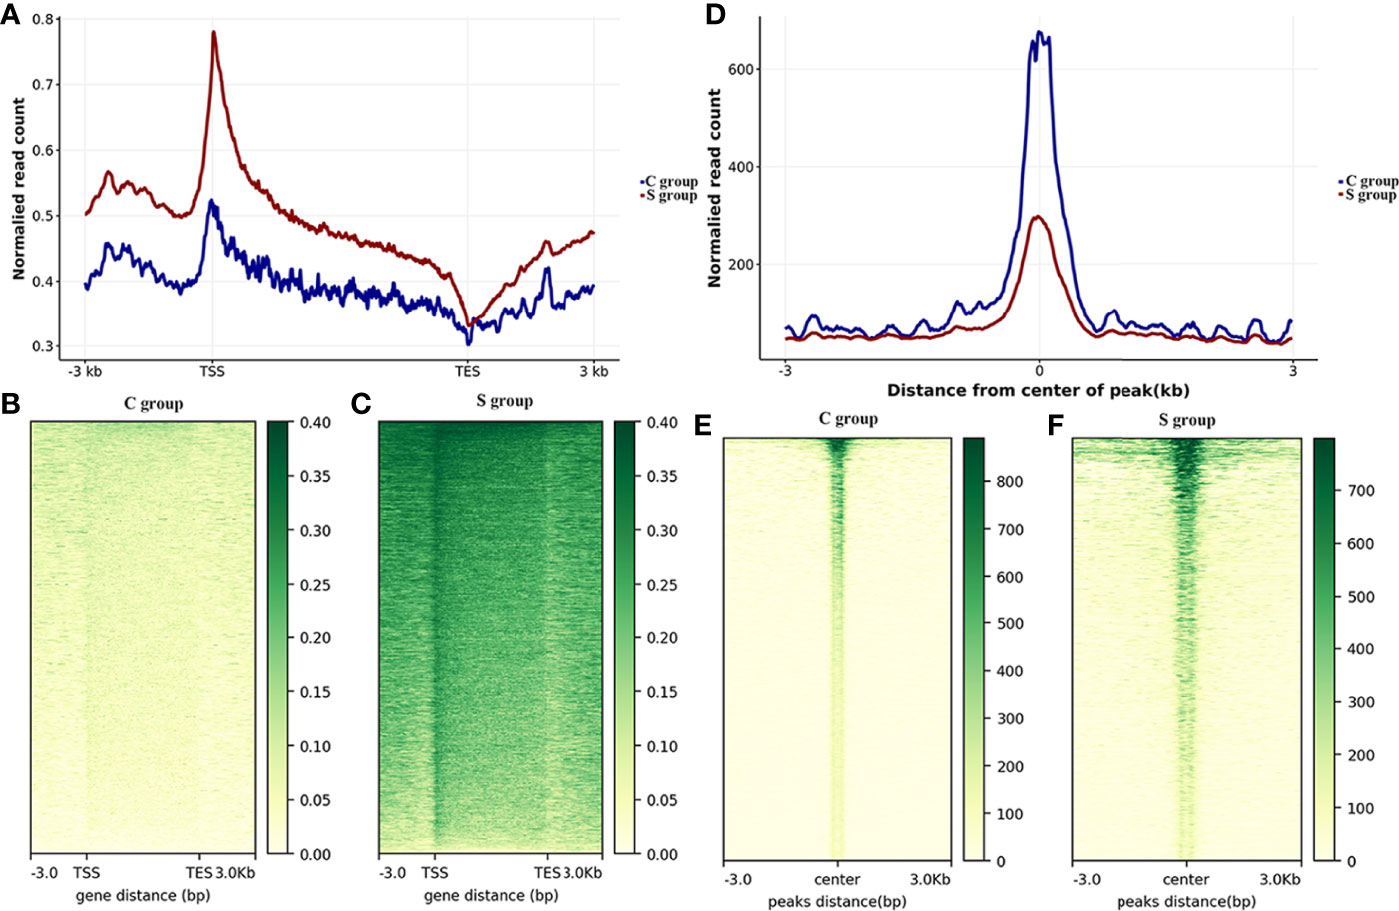
Figure 3 Genome-wide CUT&Tag analysis of histone H3K4me3 in the gills of large yellow croaker during low salinity stress. (A) Read distributions across genomic regions. The x-axis represents the genetic structure; the y-axis represents the normalized read counts. TSS: transcriptional start site; TES: transcriptional end site; -3.0: 3 kb upstream of TSS; 3.0: 3 kb downstream of TES. (B) Heatmap of read distributions across genomic regions in the C group. (C) Heatmap of read distributions across genomic regions in the S group. (D) Read distributions across peaks. The x-axis represents regions near peaks; the y-axis represents the normalized read counts. 0: peak center; -3: 3 kb upstream of the peak center, 3: 3 kb downstream of the peak center. (E) Heatmap of read distributions across peaks in the C-group. (F) Heatmap of read distributions across peaks in the S-group.
The genomic locations of the peaks were divided into eight categories, including intergenic, intron, exon, 3’ UTR, 5’ UTR, promoter (<=1kb), promoter (1–2 kb), and promoter (2–3 kb). The H3K4me3 signals were mainly enriched in the intergenic, promoter (<= 1kb), and intron categories in both the S- and C-groups. However, there were significant differences in the percentage of each category between the S- and C-groups (Figures 4A, B). Computational analysis of H3K4me3 CUT&Tag in large yellow croaker gill tissue under low salinity stress resulted in 1,505 up-regulated peak signals and 4,673 down-regulated peak signals (|log2 (fold change)| >1, p-value < 0.05). Table 6 shows the location of the lowest 31 peaks ranked by P value. Figures 4C, D show the top five binding motifs of H3K4me3 down- and up-regulated targets, respectively. The total significant binding motif number of down- and up-regulated targets was 43 and 39, respectively (enrichment statistics were based on the p-value).
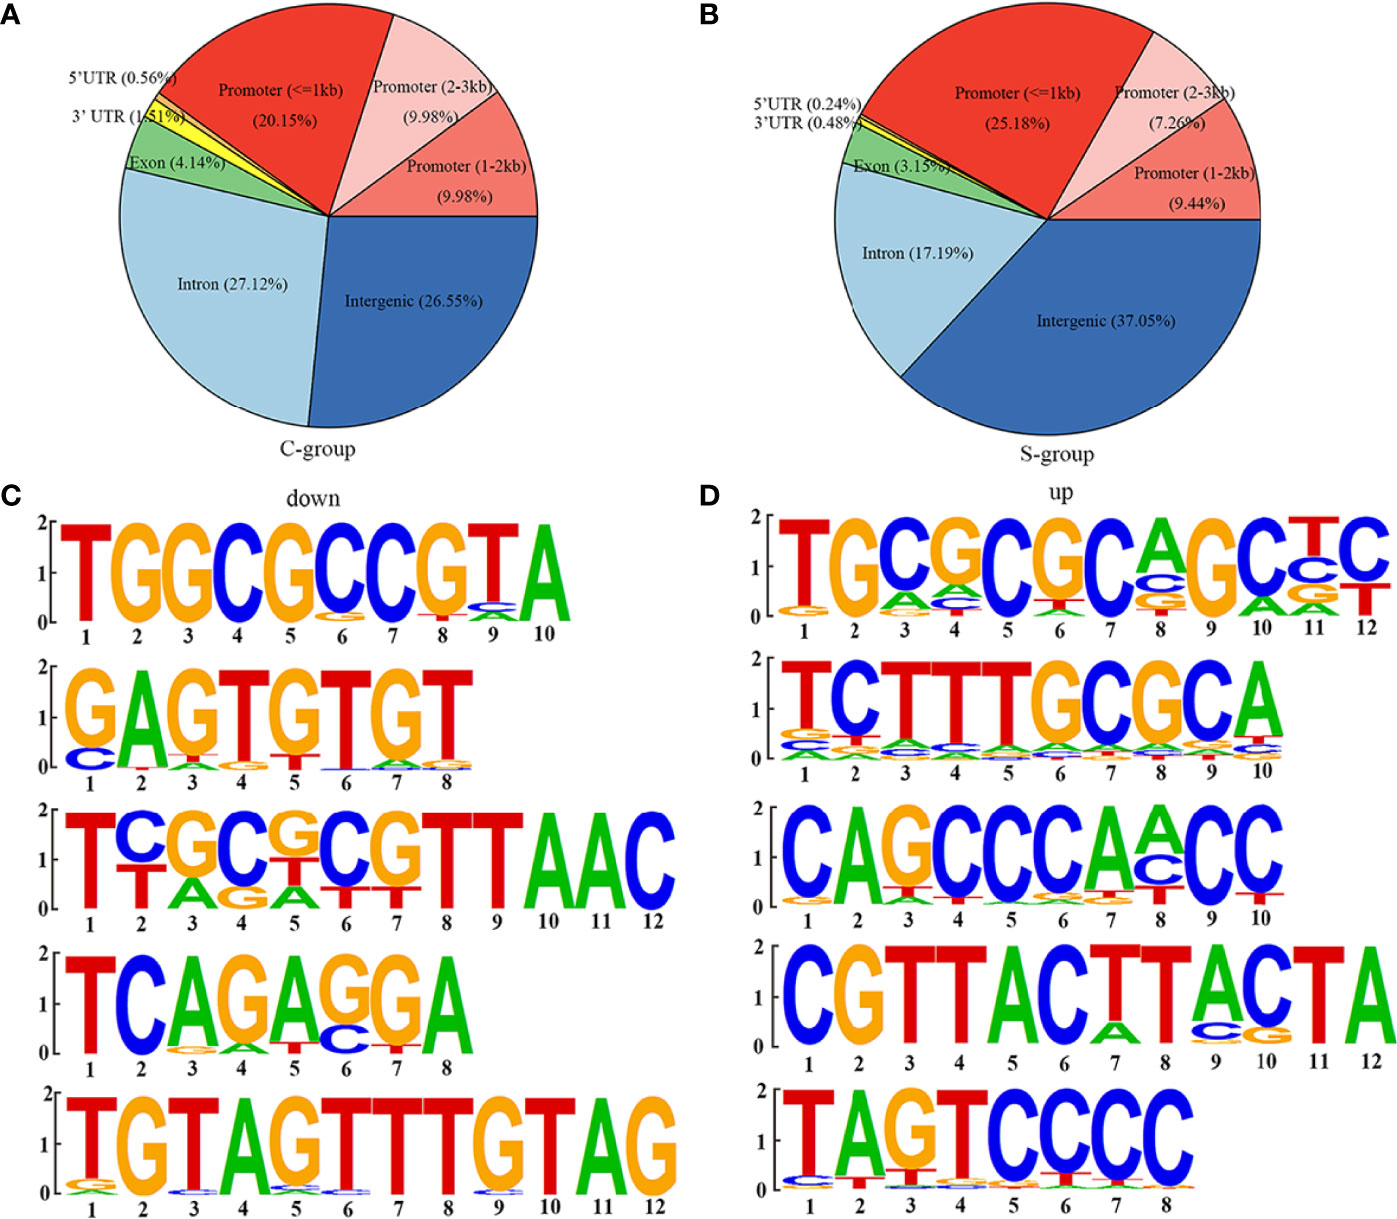
Figure 4 H3K4me3 CUT&Tag analysis of large yellow croaker gills during low salinity exposure. (A) Percentage of peaks among the functional regions of genes in the C-group. (B) Percentage of peaks among the functional regions of genes in the S-group. (C) Top five motifs of down-regulated peak signals. (D) Top five motifs of up-regulated peak signals.
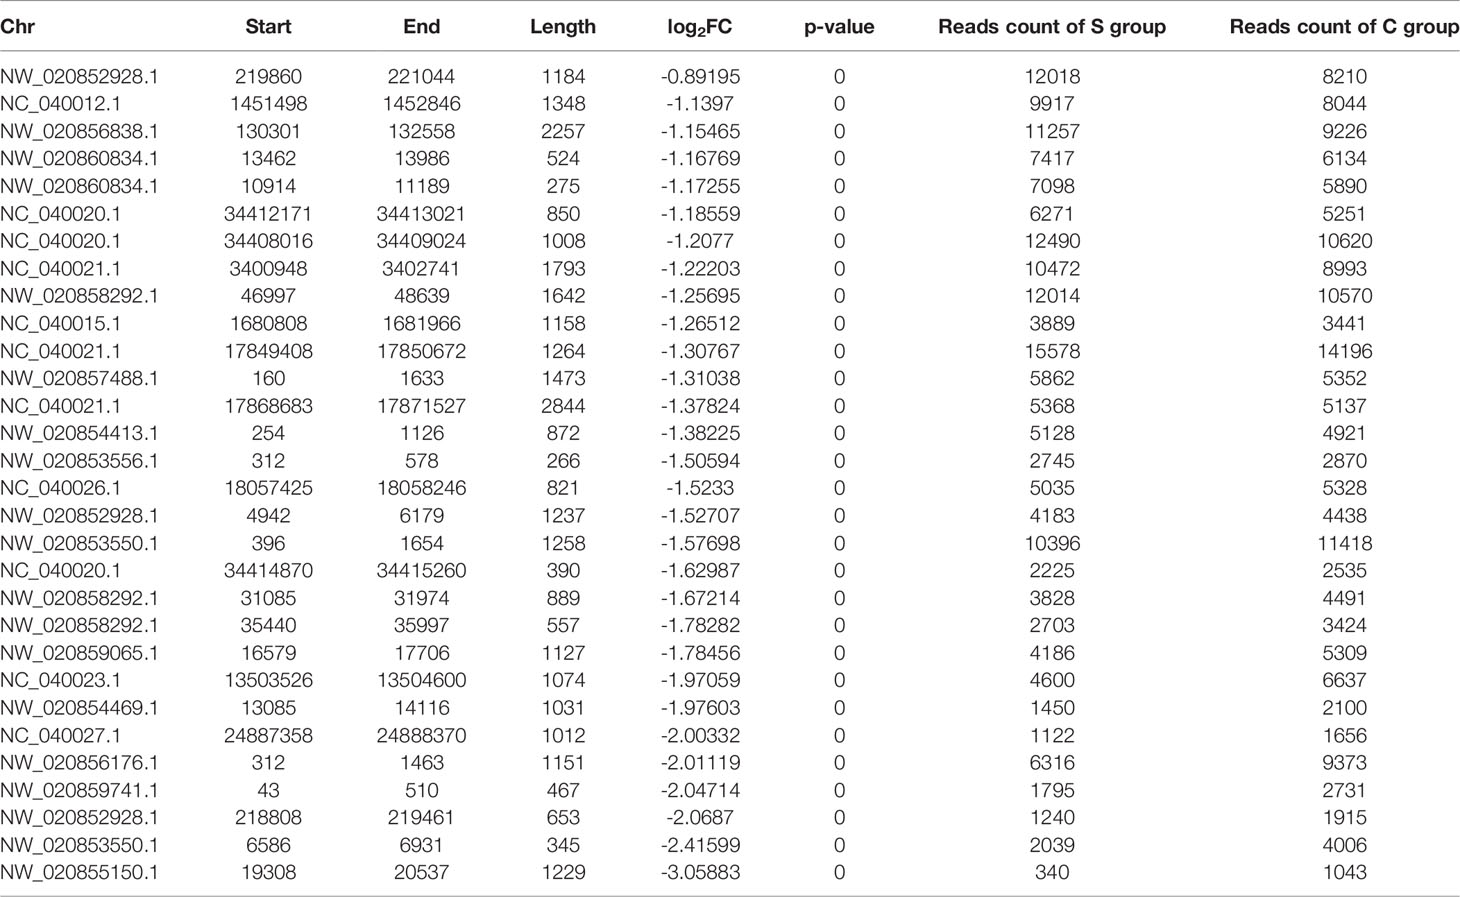
Table 6 Output from MACS2 listing the lowest 31 peaks ranked by p-value.
H3K4me3 target genes were predicted via binding and expression target analysis (BETA). A total of 156 predicted H3K4me3 targets were up-regulated and 290 were down-regulated, with binding sites within +/- 5 kb from TSS.
Low Salinity Stress Significantly Changes H3K4me3 in Gill Tissues of Large Yellow Croaker
The binding sites of H3K4me3 in large yellow croaker genome were characterized via CUT&Tag. However, this is not sufficient to determine the regulatory landscape of H3K4me3. Thus, an integrative approach using CUT&Tag and RNA-seq data was used to analyze the relationship of H3K4me3 and the target genes expression. The integrated analysis showed that there were 11 up-regulated and 12 down-regulated H3K4me3 target DEGs being identified by overlap the up- and down-regulated DEGs in RNA-seq with the H3K4me3 signal increased and decreased target genes in CUT&Tag, respectively (Figures 5A, B).
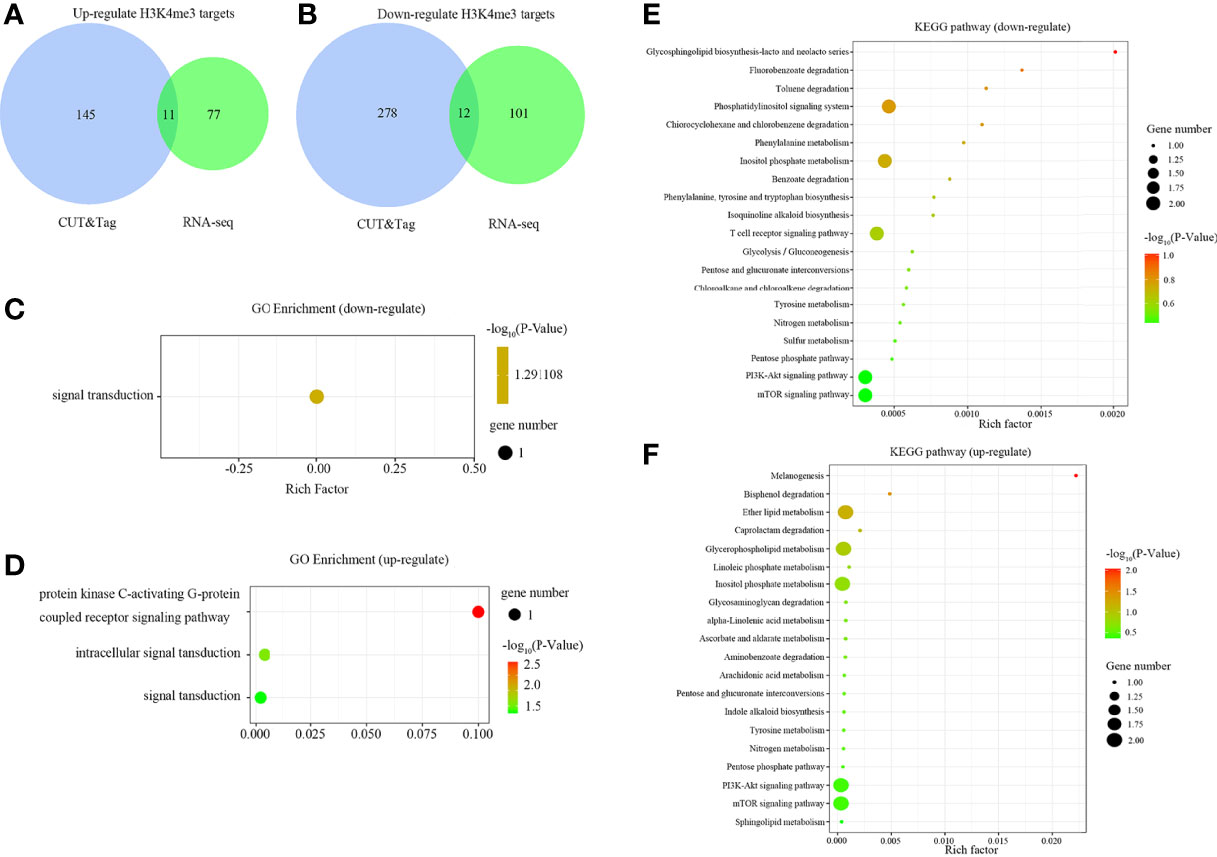
Figure 5 Comparison of predicted target DEGs of enriched peaks in gills of large yellow croaker during low salinity exposure. (A) Venn diagram of up-regulated DEGs according to RNA-seq analysis and up-regulated targets of CUT&Tag peaks. (B) Venn diagram of down-regulated DEGs and down-regulated targets of CUT&Tag peaks. (C) GO enrichment of predicted targets of down-regulated peaks. (D) GO enrichment of predicted targets of up-regulated peaks. (E) KEGG pathway enrichment of predicted targets of down-regulated peaks. (F) KEGG pathway enrichment of predicted targets of up-regulated peaks.
GO enrichment analysis indicated that the down-regulated H3K4me3 target genes were associated with signal transduction (Figure 5C), whereas the up-regulated targets were mainly enriched in the protein kinase C-activating G-protein coupled receptor signaling pathway, intracellular signal transduction, and signal transduction (Figure 5D). Further, the top 20 KEGG pathways enriched with the target genes were illustrated in Figures 5E, F. The down-regulated targets were mainly enriched in the phosphatidylinositol signaling pathway, inositol phosphate metabolism, T cell receptor signaling pathway, PI3K-Akt signaling pathway, and mTOR signaling pathway. The up-regulated targets were mainly enriched in the ether lipid metabolism, glycerophospholipid metabolism, inositol phosphate metabolism, PI3K-Akt signaling, and mTOR signaling pathways.
The twelve down-regulated H3K4me3 targets were LOC104934797 (inhbaa), LOC104935487 (plxnb3), LOC104935823, LOC104935843, LOC104936006 (vamp8), LOC104939201 (elavl1a), LOC104939545, cdh26, htra1, sh3bp2, ubl3 and wdr7. The eleven up-regulated targets were LOC104922642, LOC104927102 (cdh11), LOC104930302 (plxnb1b), LOC104938030, LOC109137647, LOC113744740 (lhfpl4b), LOC113745309, LOC113745578, dcst1, dgkh, and vldlr. These target genes could be candidate regulate factors of low salinity adaptation in large yellow croaker. Figures 6, 7 illustrated the relationship of H3K4me3 signal changes with its target DEGs expression between the S- and C-groups, respectively.
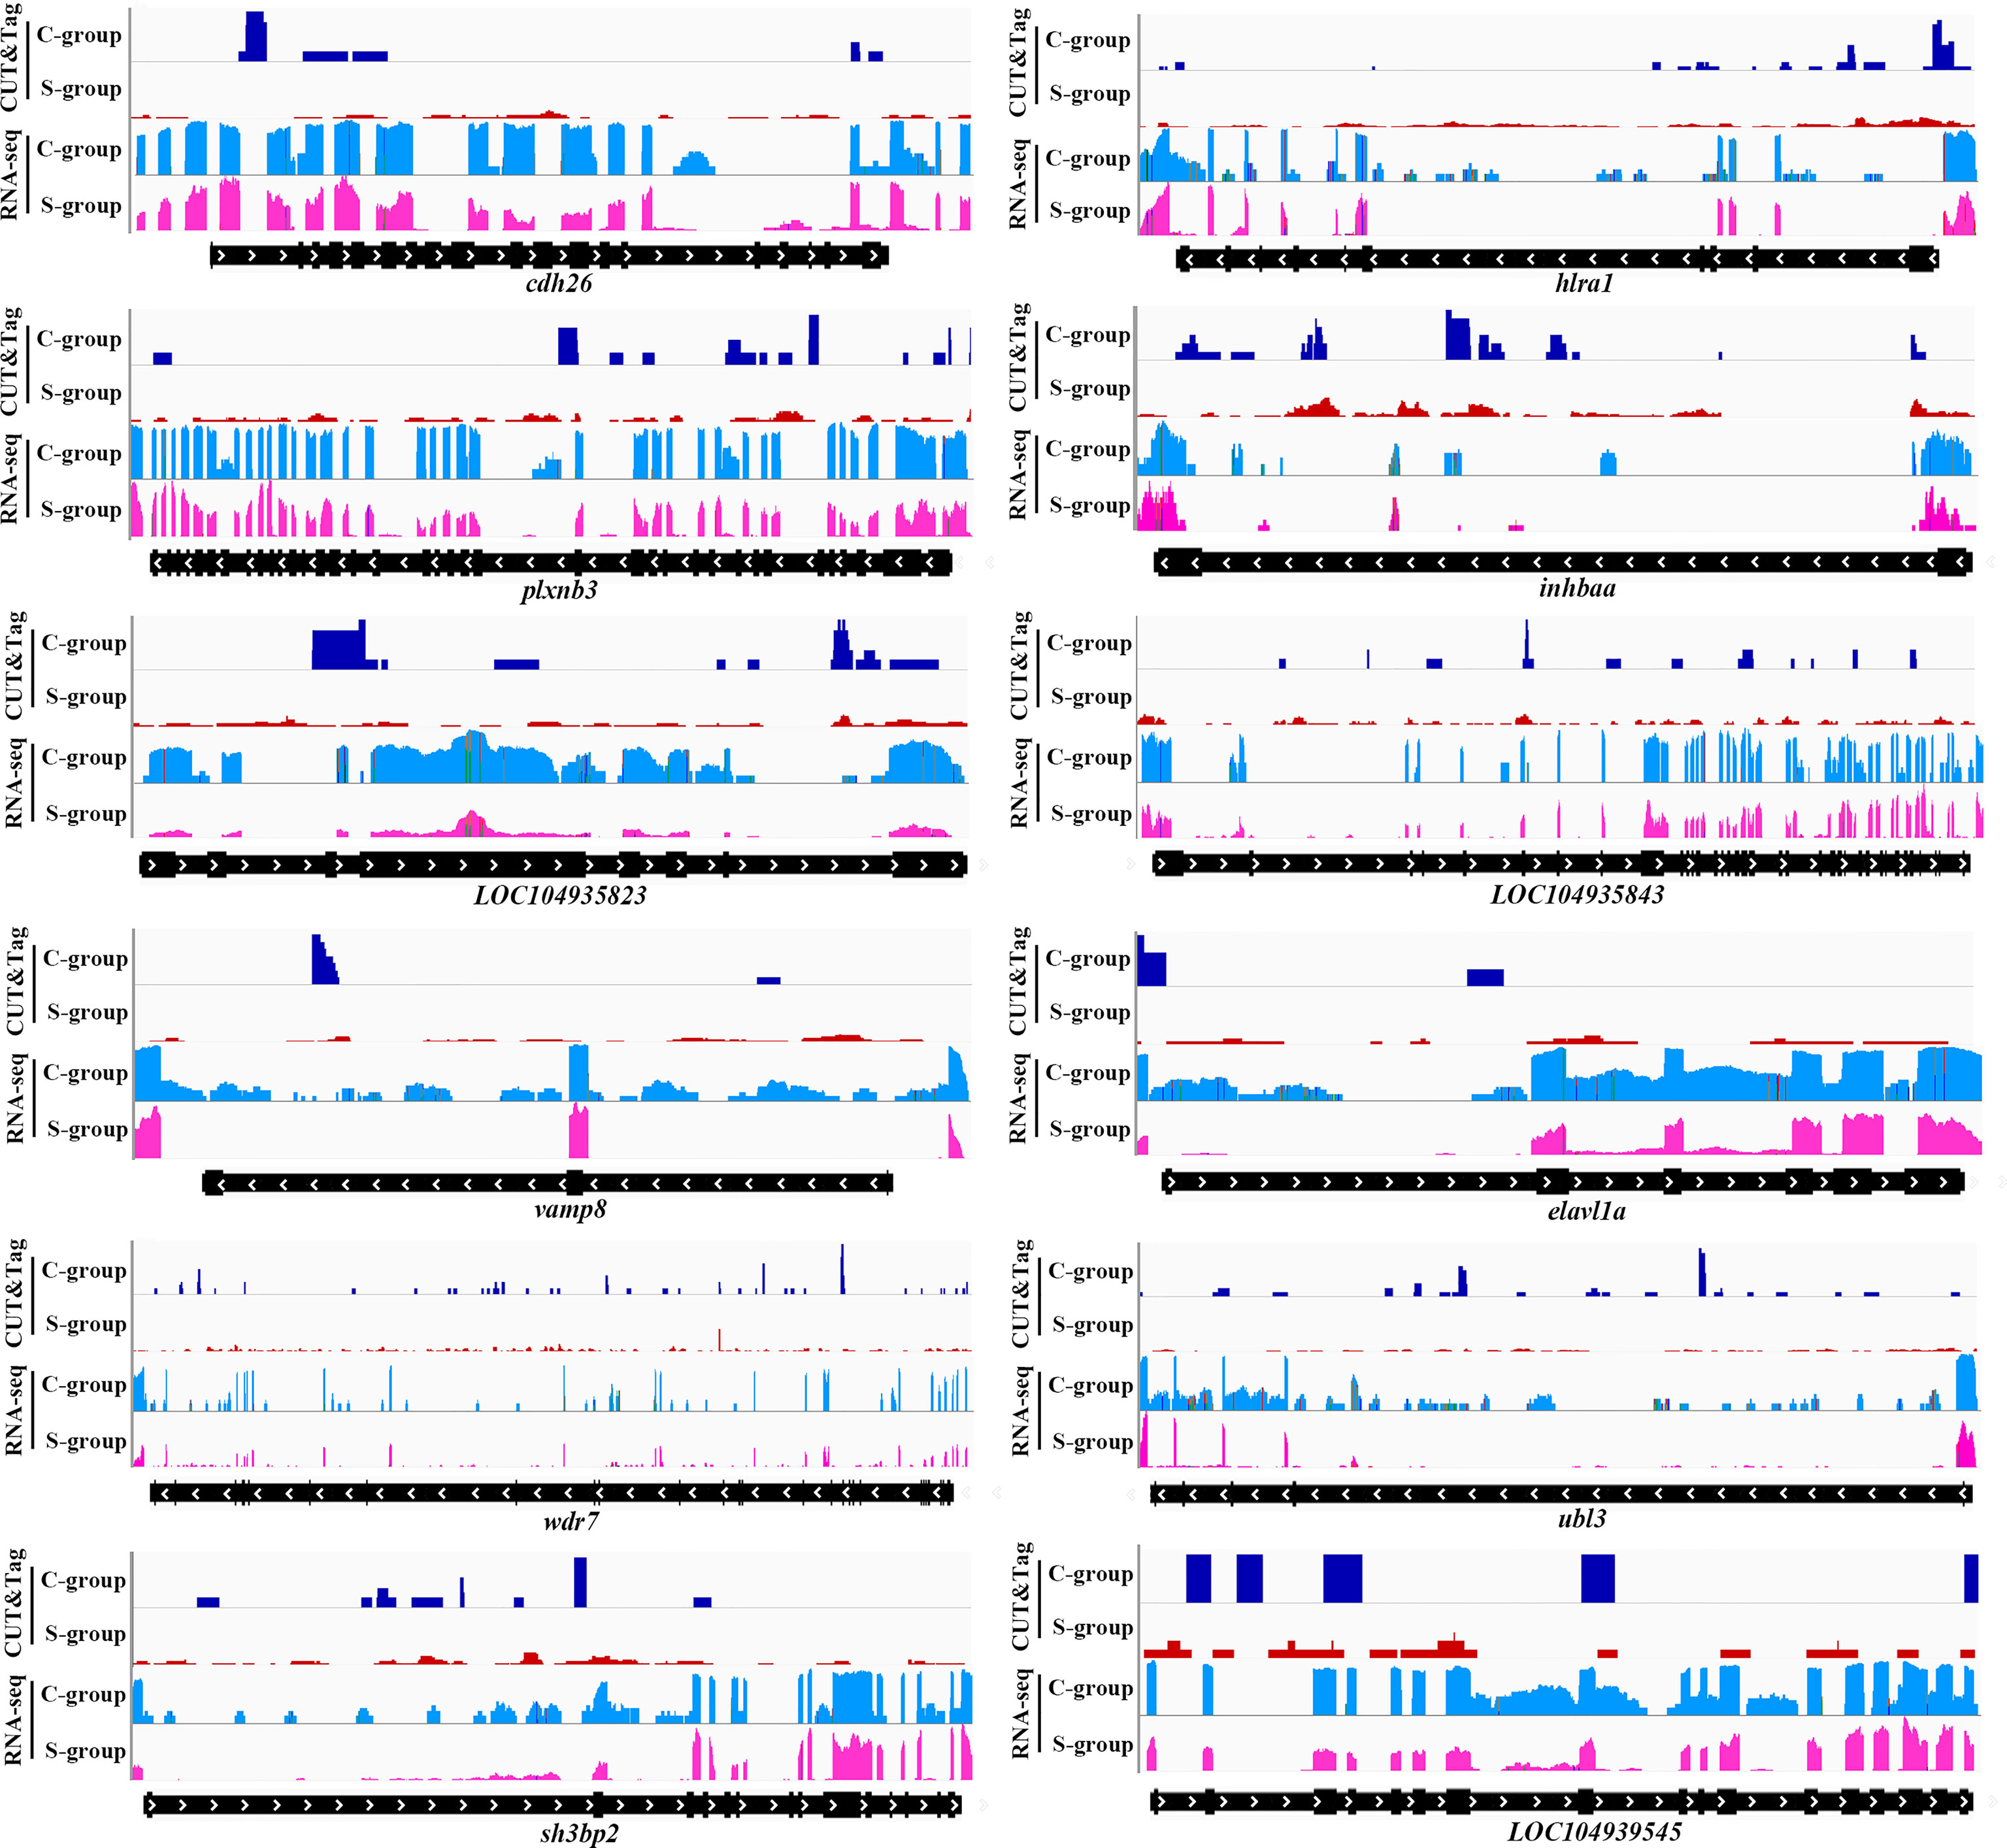
Figure 6 Genome browser tracks showing the 12 down-regulated targets of H3K4me3 peaks in the gills of large yellow croaker during low salinity exposure. The S- and C-groups are represented in red and blue, respectively.
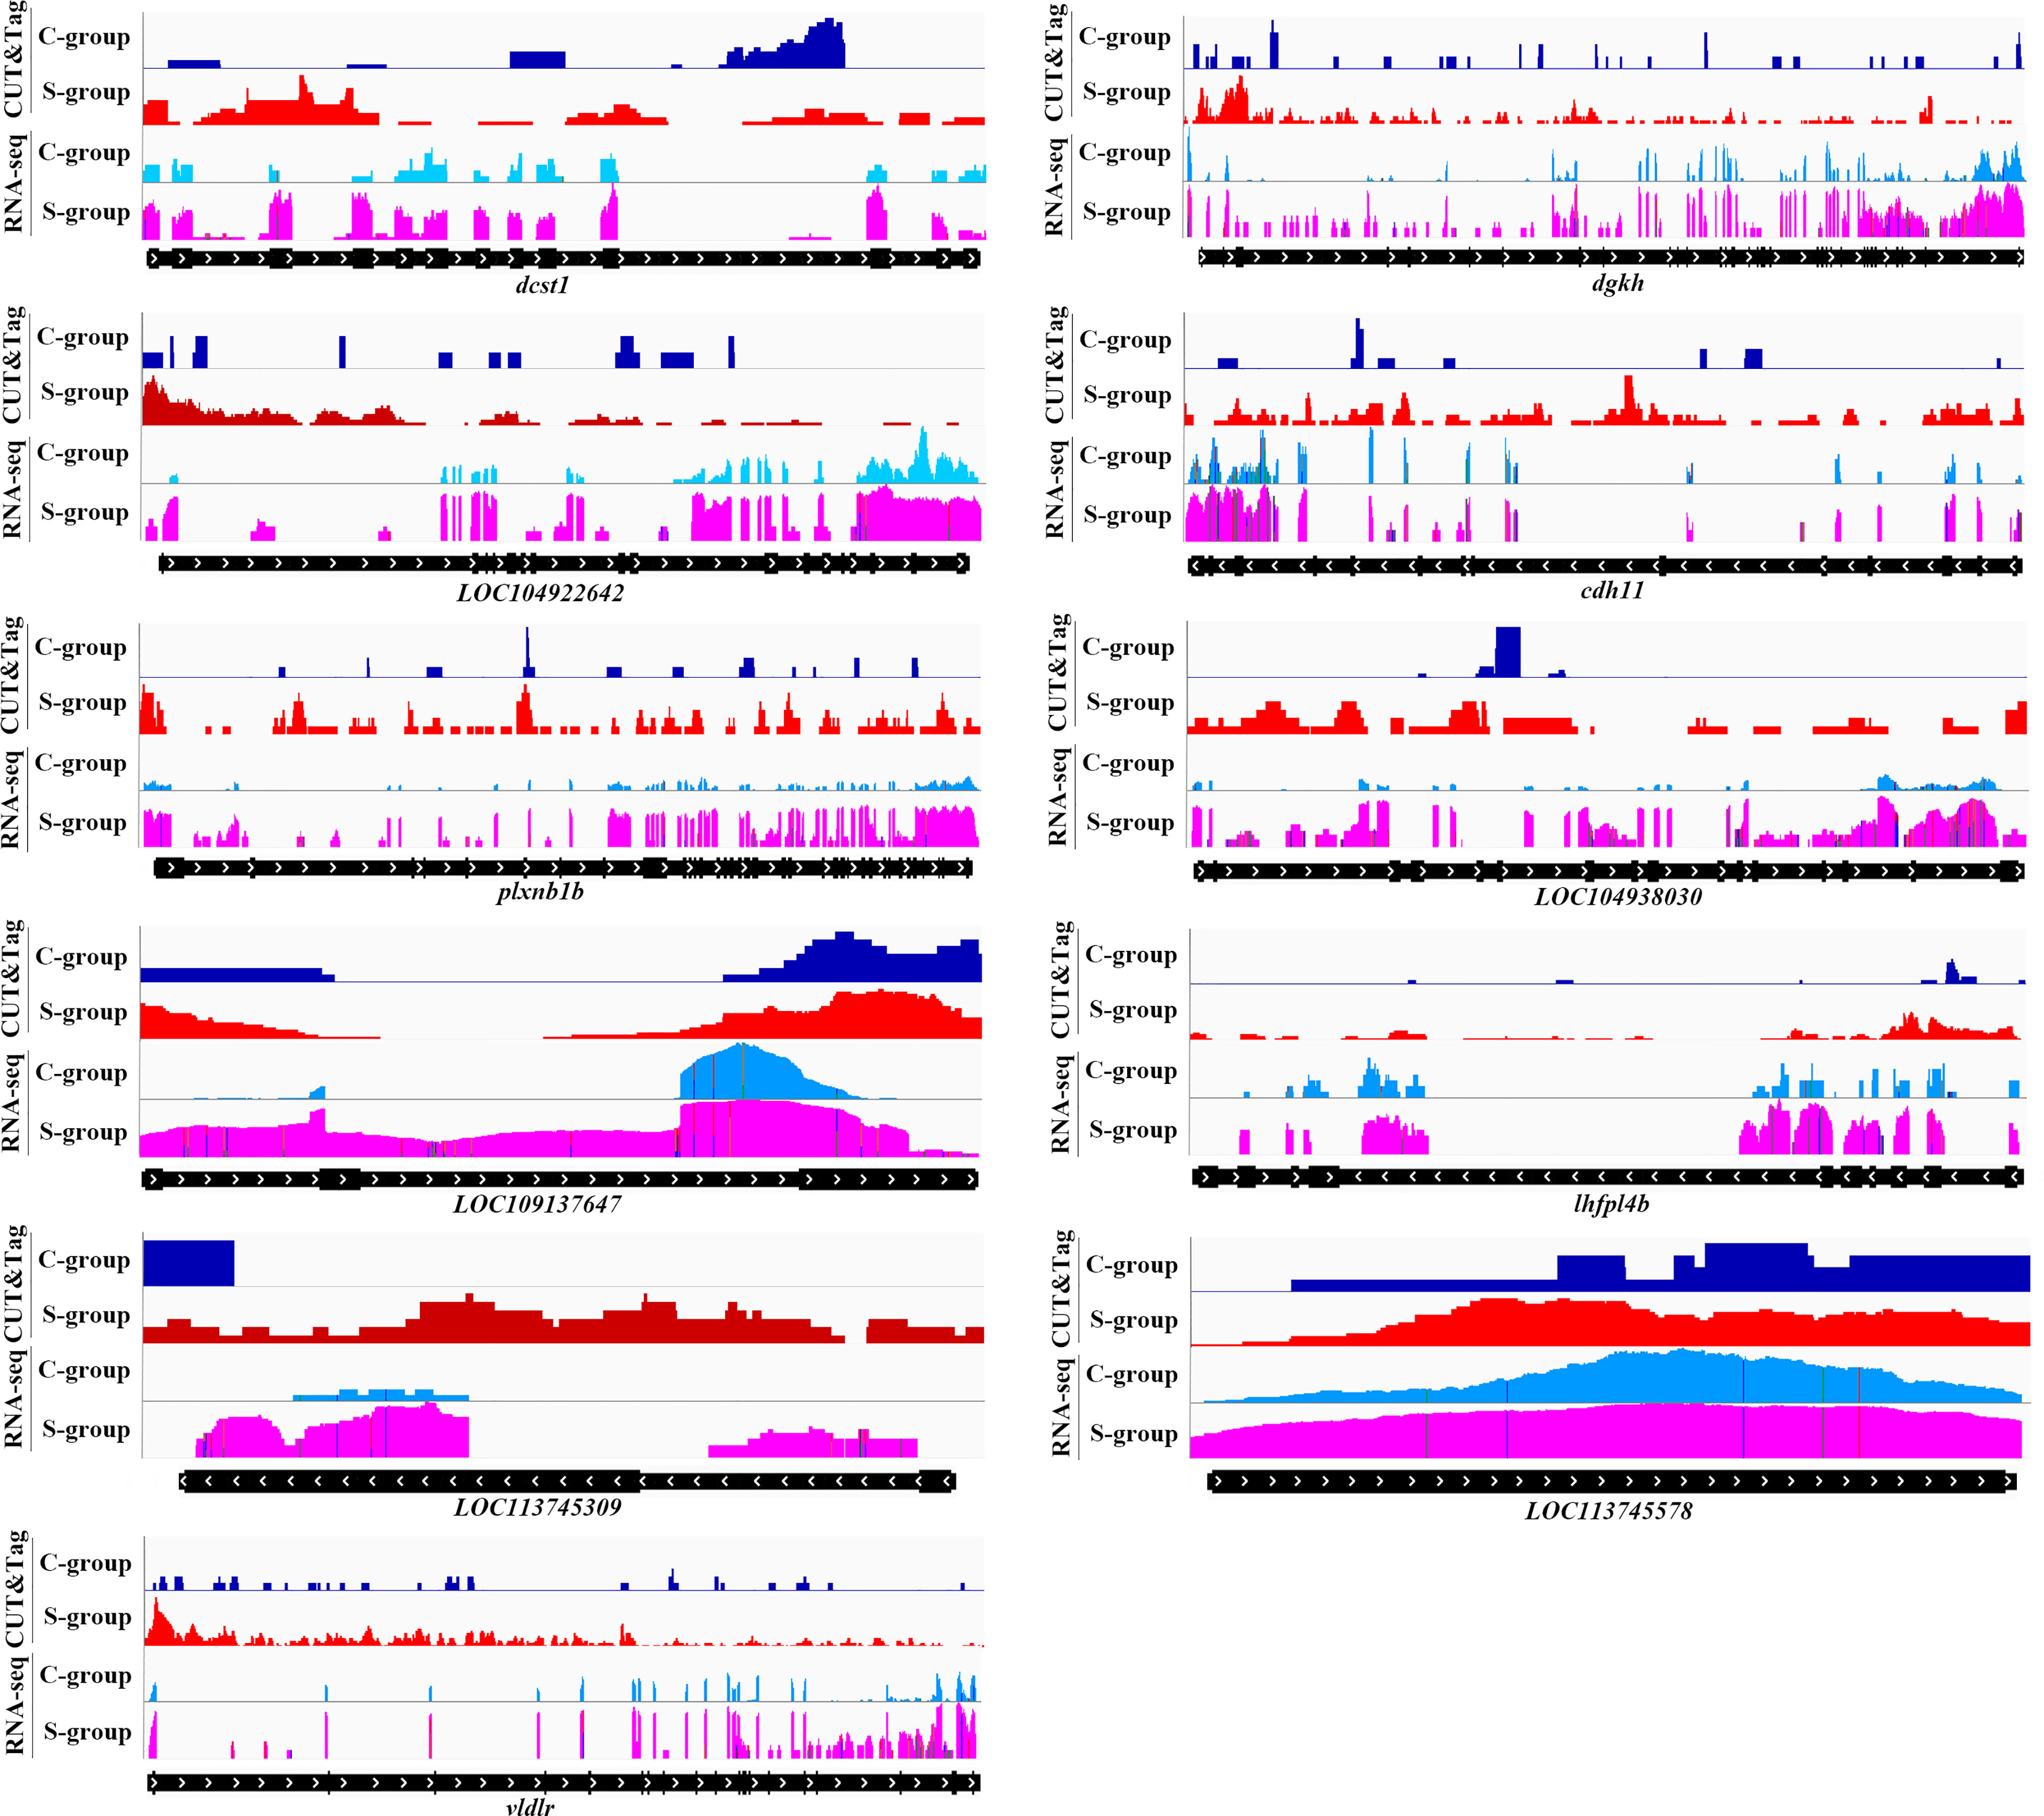
Figure 7 Genome browser tracks showing the 11 up-regulated targets of H3K4me3 peaks in gills of large yellow croaker during low salinity exposure. The S- and C-groups are represented in red and blue, respectively.
Discussion
Previous studies have reported that epigenetic modifications could regulate gene expression, genomic rearrangement, and the evolution rate of genomic DNA sequences to acclimate to external environmental pressures (Kim et al., 2005; Asensi et al., 2017). Among the different types of epigenetic modifications, histone modification, DNA methylation, and their interactions have been shown to be major drivers of the acclimatization process (Cedar and Bergman, 2009). Particularly, posttranslational modification of histone plays a vital role in gene transcriptional activation in response to environmental stress, as well as in growth and development. Histone methylation, an important histone modification, is closely associated with gene expression and which is continuously and dynamically regulated by histone methyltransferases (HMTs) and histone demethylases (HDMs). Enhancer of zeste of homolog 2 (ezh2) is a member of polycomb repressive complex 2 (prc2), which possesses histone methyltransferase activity and mediates chromatin transcriptional silencing (Batool et al., 2019). In the present study, ezh2 was significantly activated in the gills of large yellow croaker under low salinity stress, which coincided with changes in histone methylation. Furthermore, utx, a demethylase of H3K27me3, could specifically remove the methylated modification of the lysine residue on H3K27 and promote the transcriptional activation of related genes (Lee et al., 2012). In this study, utx was also significantly up-regulated upon low salinity exposure, indicating that the H3K27me3 histone modification state was also noticeably changed. Therefore, salinity stress could cause a series of histone modification changes in chromatin; however, the functions of these histone modification changes remain unclear.
Studies in other organisms have indicated that H3K4me3 could serve as an indicator of gene activation during the environmental stress adaptation process, and H3K4 methylation could significantly change under environmental pressure (Zong et al., 2013; Singh et al., 2014; Xi et al., 2020). Other studies have indicated that almost 90% of genes in Arabidopsis thaliana carry at least one H3K4 methylated modification under drought stress, and 63% of the genes sites had significant changes of H3K4 trimethylation induced by drought stress (Van et al., 2010). Interestingly, H3K4me3 binding sites are also low standard DNA methylated modification sites, and the interaction of these two epigenetic modifications further enhances chromatin opening and gene transcriptional activation (Du et al., 2015). Very few studies have reported thus far on the functions of H3K4me3 in aquatic animals under environmental stress, and therefore its functional mechanisms remain unclear. The present study provides the first characterization of dynamic transcriptome and epigenome changes in the gills of large yellow croaker under low salinity stress by integrating CUT&Tag and RNA-seq analyses.
The previous studies of low salinity stress were mainly focused on the expression regulation of ion channel and hormone secretion et c. (Larsen et al., 2012; Seale et al., 2014). In this work, GO enrichment analysis indicated that the DEGs in RNA-seq were mainly enriched in metabolism and cellular process and other GO sub-clusters. Thereinto, filamentous actin (F-actin) is the key component of eukaryotic cytoskeleton which plays an important role in cell shape maintenance. Researches indicated that low salinity stress can cause significant morphological changes in gill lamella of large yellow croaker (Teng et al., 2022); the adaptive expression of F-actin can change the structure of fibroid actin microfilament which might be the main cause of morphological change in gill. Phosphopyruvate hydratase is a key enzyme in glucose metabolism which expresses in cytoplasm of almost all organs (Pancholi, 2001). During low salinity adaption, glycolmetabolism related genes’ expression in gill could provide adequate energy supply for osmotic regulation, etc. Prefoldin complex is capable of delivering unfolded proteins to cytosolic chaperonin which also plays a vital role in the regulation of chromatin dynamics during transcription elongation (Millán et al., 2013). Besides, low salinity stress has also influenced greatly on erythrocyte homeostasis and homeostasis of number of cells within a gill tissue which is critical in oxygen transport and ion exchange, especially in circulatory system. Previous researches indicated that cell volume recovery under hypotonic stress might rely on calcium signaling pathway; ATP release induced free calcium increase in cell which combined with purinergic receptors in membrane and regulate cell volume recovery (Ollivier et al., 2006). Thereinto, calcium binding proteins is critical in cell volume maintaining, and GTP binding protein has a potential in the regulation of cell calcium concentration (Yuge et al., 2003). Similarly, KEGG pathway analysis indicated that the DGEs enriched in Cell adhesion molecules (CAMs) and Cytokine-cytokine receptor interaction pathway were critical in signal transduction and interaction; and the one in tight junction and ferroptosis is potential in maintenance of cell structure and cell apoptosis; besides, the DEGs enriched in PPAR signaling pathway were significantly in expression regulation of related key enzymes in glucose and fatty acid metabolism. Summing up the above, the energy metabolism, signal transduction, and cell function maintenance in gill of large yellow croaker was notably impacted under low salinity stress.
Histone modifications, like H3K4me3, have highly and flexibly response to different environmental stress in the regulation of chromatin remodeling through spatial pattern distribution, and the change of modification condition in specific histone marker genes’ promoter region could regulate the expression of environment adaption related genes (Berger, 2007; Zong et al., 2013; Santos et al., 2017). The activation of drought stress related genes in Arabidopsis thaliana was closely associated with H3K4me3 signal enrichment in gene coding region during drought resistance (Kim et al., 2008). In this work, genome-wide profiling of H3K4me3 data showed that H3K4me3 binding sites were mainly enriched in TSSs, which is consistent with the findings of previous studies (Barski et al., 2007; Fromm and Avramova, 2014), and this distribution pattern is closely related to gene expression and regulation. H3K4me3 could bind to activated and suppressed transcription promoters, thereby up- or down-regulating gene expression (Guenther et al., 2007). Unlike transcript factors (TF) which commonly have unique binding motif (Jairo et al., 2020), H3K4me3 have many binding motifs, and the binding motifs were different from each other between H3K4me3 down- and up-regulated target gene region; this finding gives proof for the flexibility of H3K4me3 regulation to target genes. These dynamic genome-wide H3K4me3 modifications might enable large yellow croaker to adapt to low salinity environments.
The integrative analysis of RNA-seq and H3K4me3 CUT&Tag showed that 11 up-regulated and 12 down-regulated H3K4me3 target genes were identified during low salinity exposure of large yellow croaker. According to the GO and KEGG pathway analyses of the H3K4me3 target genes, H3K4me3 modification plays a critical role in signal transduction and energy metabolism, which is consistent with RNA-seq findings. Besides, the H3K4me3 modification condition is closely associated with target genes expression. Unlike H3K46me3, H3K4me3 can both up- and down-regulate target genes’ expression. The dynamic changes of H3K4me3 provide flexibility for large yellow croaker in gene’s differentially expression under low salinity stress.
In this study, the characterization of transcriptome and epigenome dynamics provided novel insights into the potential mechanisms through which H3K4me3 mediates low salinity adaptation in large yellow croaker. This study thus confirms that histone H3K4me3 modification could participate in the molecular processes that mediate the low salinity adaptation by directly regulating the activation or inhibition of related genes. As to the identified H3K4me3 target DEGs, further research and exploration of the H3K4me3 dynamics and the targets’ expression regulation in the low salinity adaptation of large yellow croaker will enable better insights into the underlying H3K4me3 regulating mechanism.
Data Availability Statement
The datasets presented in this study can be found in online repositories. The names of the repository/repositories and accession number(s) can be found below: https://www.ncbi.nlm.nih.gov/, PRJNA798588; https://www.ncbi.nlm.nih.gov/, PRJNA798531.
Ethics Statement
The animal study was reviewed and approved by Care and Use of laboratory animals of Zhejiang Wanli University. Written informed consent was obtained from the owners for the participation of their animals in this study.
Author Contributions
Conceptualization: JY, ZL, and QL. Data curation: JY and TZ. Formal analysis: ML and WS. Funding acquisition: ZL. Methodology: JY. Original manuscript writing: JY. Manuscript review and editing: ZL and QL. All authors contributed to the article and approved the submitted version.
Conflict of Interest
The authors declare that the research was conducted in the absence of any commercial or financial relationships that could be construed as a potential conflict of interest.
Publisher’s Note
All claims expressed in this article are solely those of the authors and do not necessarily represent those of their affiliated organizations, or those of the publisher, the editors and the reviewers. Any product that may be evaluated in this article, or claim that may be made by its manufacturer, is not guaranteed or endorsed by the publisher.
References
An K., Du F. X., Meng H., Li G. C., Zhang M. J., Liu Z. Z., et al. (2018). Transgenerational Analysis of H3K4me3 and H3K27me3 by ChIP-Seq Links Epigenetic Inheritance to Metabolism. J. Genet. Genomics 45 (03), 169–172. doi: 10.1016/j.jgg.2017.11.004
Asensi F. M. A., Amtmann A., Perrella G. (2017). Plant Responses to Abiotic Stress: The Chromatin Context of Transcriptional Regulation. Biochim. Biophys. Acta (BBA) - Gene Regul. Mech. 1860 (1), 106–122. doi: 10.1016/j.bbagrm.2016.07.015
Bannister A. J., Schneider R., Kouzarides T. (2002). Histone Methylation: Dynamic or Static? Cell 109 (7), 801–806. doi: 10.1016/S0092-8674(02)00798-5
Barski A., Cuddapah S., Cui K., Roh T. Y., Schones D. E., Wang Z., et al. (2007). High-Resolution Profiling of Histone Methylations in the Human Genome. Cell 129 (4), 823–837. doi: 10.1016/j.cell.2007.05.009
Batool A., Jin C., Liu Y. X. (2019). Role of EZH2 in Cell Lineage Determination and Relative Signaling Pathways. Front. Biosci. 24, 947–960. doi: 10.2741/4760
Berger S. L. (2007). The Complex Language of Chromatin Regulation During Transcription. Nature 447 (7143), 407–412. doi: 10.1038/nature05915
Cedar H., Bergman Y. (2009). Linking DNA Methylation and Histone Modification: Patterns and Paradigms. Nat. Rev. Genet. 10, 295–304. doi: 10.1038/nrg2540
Chen L. T., Wu K. (2010). Role of Histone Deacetylases HDA6 and HDA19 in ABA and Abiotic Stress Response. Plant Signaling Behav. 5 (10), 1318–1320. doi: 10.4161/psb.5.10.13168
Du J., Johnson L. M., Jcobsen S. E., Patel D. J. (2015). DNA Methylation Pathways and Their Crosstalk With Histone Methylation. Nat. Rev. Mol. Cell Biol. 16 (9), 519–532. doi: 10.1038/nrm4043
Esteller M. (2007). Cancer Epigenomics: DNA Methylomes and Histone-Modification Maps. Nat. Rev. Genet. 8 (4), 286–298. doi: 10.1038/nrg2005
Fromm M., Avramova Z. (2014). ATX1/At COMPASS and the H3K4me3 Marks: How do They Activate Arabidopsis Genes? Curr. Opin. Plant Biol. 21 (21), 75–82. doi: 10.1016/j.pbi.2014.07.004
Guenther M. G., Levine S. S., Boyer L. A., Jaenisch R., Young R. A. (2007). A Chromatin Landmark and Transcription Initiation at Most Promoters in Human Cells. Cell 130 (1), 77–88. doi: 10.1016/j.cell.2007.05.042
Hatice S. K., Janssens D. H., Henikoff J. G., Kami A., Steven H. (2020). 5Efficient Low-Cost Chromatin Profiling With CUT&Tag. Nat. Protoc. 15, 3264–3283. doi: 10.1038/s41596-020-0373-x
Hatice S. K., Steven J. W., Christine A. C., Erica S. P., Terri D. B., Jorja G. H., et al. (2019). CUT&Tag for Efficient Epigenomic Profiling of Small Samples and Single Cells. Nat. Commun. 10 (2), 814–827. doi: 10.1038/s41467-019-09982-5
Hu Y., Zhang L., Zhao L., Li J., He S. B., Zhou K., et al. (2011). Trichostain A Selectively Suppresses the Cold-Induced Transcription of the ZmDREB1 Gene in Maize. PloS One 81 (1-2), 175–188. doi: 10.1371/journal.pone.0022132
Jairo R., Quentin F., Deodutta R. (2020). Integrated Chip-Seq and RNA-Seq Data Analysis Coupled With Bioinformatics Approaches to Investigate Regulatory Landscape of Transcription Modulators in Breast Cancer Cells. Methods Mol. Biol. 2102, 35–59. doi: 10.1007/978-1-0716-0223-2_3
Kim T. H., Barrera L. O., Zheng M., Qu C., Singer M. A., Richmond T. A., et al. (2005). A High-Resolution Map of Active Promoters in the Human Genome. Nature 436 (7052), 876–880. doi: 10.1038/nature03877
Kim J. M., To T. K., Ishida J., Morosawa T., Kawashima M., Matsui A., et al. (2008). Alterations of Lysine Modifications on the Histone H3 N-Tail Under Drought Stress Conditions in Arabidopsis Thaliana. Plant Cell Physiol. 49 (10), 1580–1588. doi: 10.1093/pcp/pcn133
Larsen P. F., Nielsen E. E., Meier K. (2012). Differences in Salinity Tolerance and Gene Expression Between Two Populations of Atlantic Cod (Gadus Morhua) in Response to Salinity Stress. Biochem. Genet. 50, 454–466. doi: 10.1007/s10528-011-9490-0
Lee Y. C., Huang H. Y., Chang C. J., Cheng C. H., Chen Y. T. (2010). Mitochondrial GLUT10 Facilitates Dehydroascorbic Acid Import and Protects Cells Against Oxidative Stress: Mechanistic Insight Into Arterial Tortuosity Syndrome. Hum. Mol. Genet. 19, 3721–3733. doi: 10.1093/hmg/ddq286
Lee S., Lee J. W., Lee S. K. (2012). UTX, a Histone H3-Lysine 27 Demethylase, Acts as a Critical Switch to Activate the Cardiac Developmental Program. Dev. Cell 22 (1), 25–37. doi: 10.1016/j.devcel.2011.11.009
Livak K.J., Schmittgen T. D. (2001). Analysis of Relative Gene Expression Data Using Real-Time Quantitative PCR and the 2-△△CT Method. Methods 25, 402–408. doi: 10.1006/meth.2001.1262
Lu Z., Huang W. Q., Wang S., Shan X. J., Jia C. L., Wu H. F. (2020). Liver Transcriptome Analysis Reveals the Molecular Responses to Low-Salinity in Large Yellow Croaker Larimichthys Crocea. Aquaculture 517 (C), 734827. doi: 10.1016/j.aquaculture.2019.734827
Mikkelsen T. S., Ku M., Jaffe D. B., Issac B., Lieberman E., Giannoukos G., et al. (2007). Genome-Wide Maps of Chromatin State in Pluripotent and Lineage-Committed Cells. Nature 448 (7153), 553–560. doi: 10.1038/nature06008
Millán Z. G., Gil A. R., Peñate X., de Miguel J. L., Morillo H. M., Krogan N., et al. (2013). The Prefoldin Complex Regulates Chromatin Dynamics During Transcription Elongation. PloS Genet. 9 (9), e1003776. doi: 10.1371/journal.pgen.1003776
Moroni M., Servin V. M. R., Fleischer R., Sánchez C. O., Lewin G. R. (2018). Voltage Gating of Mechanosensitive PIEZO Channels. Nat. Commun. 9 (1), 1096. doi: 10.1038/s41467-018-03502-7
Ollivier H., Pichavant R. K., Puill S. E., Calvès P., Nonnotte L., Nonnotte G. (2006). Effects of Hypo-Osmotic Stress on ATP Release in Isolated Turbot (Scophthalmus Maximus) Hepatocytes. Biol. Cell 98 (7), 427–437. doi: 10.1042/BC20050077
Pancholi V. (2001). Multifunctional Alpha-Enolase: Its Role in Diseases. Cell. Mol. Life Sci. 58 (7), 902–920. doi: 10.1007/PL00000910
Peter P., Carl F. S., Kai K., Dim C. (2019). Summer Weather Becomes More Persistent in a 2 °C World. Nat. Climate Change 9, 666–671. doi: 10.1038/s41558-019-0555-0
Pinon V., Yao X., Dong A., Shen W. H. (2017). SDG2-Mediated H3K4me3 Is Crucial for Chromatin Condensation and Mitotic Division During Male Gametogenesis in Arabidopsis. Plant Physiol. 174, 1205–1215. doi: 10.1104/pp.17.00306
Rodriguez P. M., Esteller M. (2011). Cancer Epigenetics Reaches Mainstream Oncology. Nat. Med. 17 (3), 330–339. doi: 10.1038/nm.2305
Santos A. P., Ferreira L. J., Oliveira M. M. (2017). Concerted Flexibility of Chromatin Structure, Methylome, and Histone Modifications Along With Plant Stress Responses. Biol. (Basel) 6 (1), 3. doi: 10.3390/biology6010003
Seale A. P., Stagg J. J., Yamaguchi Y., Breves J. P., Soma S., Watanabe S., et al. (2014). Effects of Salinity and Prolactin on Gene Transcript Levels of Ion Transporters, Ion Pumps and Prolactin Receptors in Mozambique Tilapia Intestine. Gen. Comp. Endocrinol. 206, 146–154. doi: 10.1016/j.ygcen.2014.07.020
Seibel B. A., Häfker N. S., Trübenbach K., Zhang J., Tessier S. N., Pörtner H. O., et al. (2014). Metabolic Suppression During Protracted Exposure to Hypoxia in the Jumbo Squid, Dosidicus Gigas, Living in an Oxygen Minimum Zone. J. Exp. Biol. 217 (14), 2555–2568. doi: 10.1242/jeb.100487
Sims R. J., Nishioka K., Reinberg D. (2003). Histone Lysine Methylation: A Signature for Chromatin Function. Trends Genet. 19 (11), 629–639. doi: 10.1016/j.tig.2003.09.007
Singh P., Yekondi S., Chen P. W., Tsai C. H., Yu C. W., Wu K., et al. (2014). Environmental History Modulates Arabidopsis Pattern-Triggered Immunity in a Histone Acetyltransferase1-Dependent Manner. Plant Cell 26, 2676–2688. doi: 10.1105/tpc.114.123356
Teng G. L., Huang W. Q., Ji C. L., Chen Y. L., Shan X. J. (2022). Morphological Changes and Variations in Na+/K+-ATPase Activity in the Gills of Juvenile Large Yellow Croaker (Larimichthys Crocea) at Low Salinity. Aquac. Fish. 7 (3), 313–320. doi: 10.1016/j.aaf.2020.08.003
Van D. K., Ding Y., Malkaram S., Riethoven J. J., Liu R., Yang J., et al. (2010). Dynamic Changes in Genome-Wide Histone H3 Lysine 4 Methylation Patterns in Response to Dehydration Stress in Arabidopsis Thaliana. BMC Plant Biol. 10 (1), 238. doi: 10.1186/1471-2229-10-238
Wang S., Sun H. F., Ma J., Zang C., Wang C., Wang J., et al. (2013). Target Analysis by Integration of Transcriptome and ChIP-Seq Data With BETA. Nat. Protoc. 8 (12), 2502–2515. doi: 10.1038/nprot.2013.150
Xi Y. P., Park S. R., Kim D. H., Kim E. D., Sung S. (2020). Transcriptome and Epigenome Analyses of Vernalization in Arabidopsis Thaliana. Plant J.: Cell Mol. Biol. 103 (4), 1490–1502. doi: 10.1111/tpj.14817
Yuge S., Inoue K., Hyodo S., Takei Y. (2003). A Novel Guanylin Family (Guanylin, Uroguanylin, and Renoguanylin) in Eels: Possible Osmoregulatory Hormones in Intestine and Kidney. J. Biol. Chem. 278 (25), 22726–22733. doi: 10.1074/jbc.M303111200
Zeng L., Ai C. X., Wang Y. H., Zhang J. S., Wu C. W. (2017). Abrupt Salinity Stress Induces Oxidative Stress via the Nrf2-Keap1 Signaling Pathway in Large Yellow Croaker Pseudosciaena Crocea. Fish Physiol. Biochem. 43 (4), 955–964. doi: 10.1007/s10695-016-0334-z
Zhang Q., Li F., Zhang J., Wang B., Gao H., Huang B., et al. (2007). Molecular Cloning, Expression of a Peroxiredoxin Gene in Chinese Shrimp Fenneropenaeus Chinensis and the Antioxidant Activity of its Recombinant Protein. Mol. Immunol. 44 (14), 3501–3509. doi: 10.1016/j.molimm.2007.03.014
Zhang Y., Reinberg D. (2001). Transcription Regulation by Histone Methylation: Interplay Between Different Covalent Modifications of the Core Histone Tails. Genes Dev. 15 (18), 2343–2360. doi: 10.1101/gad.927301
Keywords: low salinity stress, H3K4me3, large yellow croaker, Cut&Tag, transcriptome
Citation: Yang J, Liu M, Shen W, Zhou T, Wu X, Li Q and Lin Z (2022) H3K4me3 CUT&Tag and Transcriptome Analysis Reveal the Epigenetic Regulatory Landscape in Gill Tissue of Large Yellow Croaker (Larimichthys crocea) Under Low Salinity Stress. Front. Mar. Sci. 9:906337. doi: 10.3389/fmars.2022.906337
Received: 29 March 2022; Accepted: 25 May 2022;
Published: 17 June 2022.
Edited by:
Youji Wang, Shanghai Ocean University, ChinaReviewed by:
Shan He, Huazhong Agricultural University, ChinaWanbo Li, Jimei University, China
Jing-Xia Liu, Huazhong Agricultural University, China
Copyright © 2022 Yang, Liu, Shen, Zhou, Wu, Li and Lin. This is an open-access article distributed under the terms of the Creative Commons Attribution License (CC BY). The use, distribution or reproduction in other forums is permitted, provided the original author(s) and the copyright owner(s) are credited and that the original publication in this journal is cited, in accordance with accepted academic practice. No use, distribution or reproduction is permitted which does not comply with these terms.
*Correspondence: Zhihua Lin, zhihua9988@126.com