Multiple Trophic Tracer Analyses of Subarctic Rhodolith (Lithothamnion glaciale) Bed Trophodynamics Uncover Bottom-Up Forcing and Benthic-Pelagic Coupling
 Sean Hacker Teper
  Christopher C. Parrish
 Patrick Gagnon
- Department of Ocean Sciences, Memorial University of Newfoundland, St. John’s, NL, Canada
We paired a survey of cryptofaunal abundance and rhodolith morphology with lipid, fatty acid, and stable isotope analyses to quantify nutritional patterns and trophic linkages of six dominant echinoderm, bivalve, gastropod, and polychaete species, two macroalgal species, seawater, and underlying sediment in a large (>500 m2) rhodolith (Lithothamnion glaciale) bed in southeastern Newfoundland (Canada). We found high densities of chitons (Tonicella marmorea and T. rubra) and daisy brittle star (Ophiopholis aculeata), and overall species composition, rhodolith morphology (shape and size), and total rhodolith biomass were consistent with other studies of the bed, indicating high temporal stability. Our lipid and fatty acid analyses revealed high levels of phospholipids and unsaturated fatty acids combined with low sterols in all animal species, suggesting adaptation for enhanced cell membrane fluidity in a cold-water environment. They also showed that most taxa sampled feed on a shared resource; diatoms, and that (non-kelp) macroalgal detritus are a key food source within rhodolith communities. Our stable isotope analysis uncovered three distinct trophic levels; producers, suspension/filter feeders and grazers, and predators, and unveiled potential resource partitioning between first- (H. arctica) and second- (O. aculeata and Tonicella spp.) order consumers, whereby differences in feeding strategies enable utilization of specific components of the same organic and inorganic material. The unprecedented analytical resolution enabled by the combined use of three trophic tracers indicate that bottom-up forcing (as a mechanism of trophic control) and benthic-pelagic coupling (as a pathway of nutrient and energy flow) operate simultaneously, at least seasonally, in subarctic rhodolith beds.
1 Introduction
Trophic ecology is the study of feeding relationships and energy transfers among organisms interacting in a community. In all ecosystems, energy is transferred through feeding from primary producers to primary and higher-order consumers. This transfer is often unclear in marine benthic ecosystems partly because of the broad diets of many species, a large detritus pool, and, sometimes, complex benthic-pelagic relationships, which can also vary seasonally (Kharlamenko et al., 2001; Pitt et al., 2009; Kelly and Scheibling, 2012). Trophic relationships can be studied with analysis of lipid classes, fatty acids (FA), and stable isotopes. Lipids are the densest form of energy (cal/g) in marine ecosystems, essential for structural integrity, storage, and signaling of molecules in cell membranes (Parrish et al., 2000; Parrish, 2009). Lipids and FAs can be used as biomarkers for food sources and nutrition because their composition can show input, cycling, and loss of material within food webs (Kelly and Scheibling, 2012). The intake, accumulation, and transferability of lipids and FAs make them an excellent tool to study trophic pathways (Richoux et al., 2005; Drazen et al., 2008b; Drazen et al., 2008a). Bulk stable isotope analysis is a useful approach to pair with FA analysis to help identify trophic relationships (Michener, 1994; Connelly et al., 2014), food and carbon sources (Carreón-Palau et al., 2013; Trueman et al., 2014), and food web structure (Grall et al., 2006; Linnebjerg et al., 2016).
Rhodoliths (free-living, non-geniculate red coralline algae growing as balls, branched twigs, or rosettes) often form dense aggregations, known as “rhodolith beds”, at depths of up to 150 m in tropical to polar seas (Foster, 2001; Foster et al., 2007). Rhodolith beds, along with seagrass meadows, kelp beds and forests, and mangrove forests, are one of the four major types of marine benthic primary producers (Foster, 2001; Foster et al., 2007). The relatively complex morphology of rhodoliths creates suitable habitats for attachment (Kamenos et al., 2004a; Steller and Cáceres-Martínez, 2009; Riosmena-Rodríguez and Medina-López, 2010), reproduction (Kamenos et al., 2004b; Steller and Cáceres-Martínez, 2009; Gagnon et al., 2012), and feeding (Steneck, 1986; Gagnon et al., 2012; Riosmena-Rodríguez et al., 2017) of highly diverse algal and faunal assemblages. The important contribution of rhodolith beds to marine biodiversity (Steller et al., 2003; Gagnon et al., 2012; Riosmena-Rodríguez et al., 2017) and global calcium carbonate (CaCO3) production (Amado-Filho et al., 2012; Harvey et al., 2017; Teed et al., 2020) has, in part, triggered the recent increase in studies of factors and processes regulating their structure and function (Marrack, 1999; Hinojosa-Arango et al., 2009; Millar and Gagnon, 2018) and growth resilience to natural and anthropogenic stressors (Bélanger and Gagnon, 2020; Bélanger and Gagnon, 2021; Arnold et al., 2021)
Knowledge about trophodynamics in rhodolith beds is limited to only a couple of studies in northeastern Atlantic (Grall et al., 2006) and eastern Pacific (Gabara, 2014) systems, that together suggest suspended particulate organic matter (SPOM), sediment organic matter (SOM), and macroalgae are important components of rhodolith bed food webs. Both studies’ findings are based on use of bulk stable isotope analysis, in particular consideration of organisms’ carbon (δ13C) and nitrogen (δ15N) isotopic signatures (DeNiro and Epstein, 1978; DeNiro and Epstein, 1981; Minagawa and Wada, 1984) to identify primary producers (Peterson and Fry, 1987; Post, 2002; Bouillon et al., 2011) and trophic levels of consumers (Iken et al., 2001; Post, 2002). As noted by Newell et al. (1995) and Kelly and Scheibling (2012), benthic food webs with significant macroalgal and bacterial components are often too complex to be characterized uniquely with stable isotope analysis. This is likely the case for rhodolith beds, in particular those in seasonal seas, where phytoplankton blooms and growth of microalgal and bacterial films on the surface of benthic organisms occur seasonally. In such cases, FA and stable isotope analyses can, in principle, simultaneously help distinguish algal and bacterial inputs (Sargent et al., 1987; Kharlamenko et al., 2001; Kelly and Scheibling, 2012).
The present study aims to resolve a part of the trophic ecology of a large (>500 m2), well-studied, cold-water rhodolith (Lithothamnion glaciale) bed in southeastern Newfoundland (eastern Canada). Specifically, we combine stable isotope, lipid, and FA analyses to: (1) identify lipid compositions of organisms to better understand functional strategies in relation to environmental characteristics; (2) delineate trophic linkages among organisms to understand the nutritional value of their diets and the extent of benthic-pelagic coupling versus strictly benthic interactions; and (3) document specific challenges and requirements for future lipid- and stable isotope-based studies of feeding relationships in rhodolith beds. In doing so, we test the overall hypotheses that: (1) the lipid composition of rhodolith epifauna generally reflects the predominantly cold-ocean conditions of Newfoundland; and (2) the rhodolith bed food web is mainly controlled from the bottom up by planktivores and detritivores as reflected by high abundance of planktonic and bacterial biomarkers.
2 Materials and Methods
2.1 Study Site and Selection of Focal Species
Our study was carried out during the spring of 2017 in a rhodolith (Lithothamnion glaciale) bed, which extends ~5 to 30 m in depth along the coast of St. Philip’s, southeastern Newfoundland, Canada. Consistent with our broader objective of characterizing spatial and temporal variability in rhodolith bed trophodynamics, we chose to study the section of the bed fringing Broad Cove (47° 35′ 36.5″ N, 52° 53′ 31.0″ W; Figure 1A) because of presumed differences in marine environmental conditions in this area. Broad Cove is connected to a marina, which is the end point of a river originating from several large ponds in the centre of the northern Avalon Peninsula. Volumes of freshwater entering Broad Cove vary seasonally and are generally lowest in summer, when precipitations (ECCC, 2019), and hence river discharge, decrease (P. Gagnon, personal observations). Our study focuses on the southernmost of two sites, i.e. the “South” site (Figure 1A), which represents a relatively stable environment for the rhodoliths because of low hydrodynamic forces and sedimentation, and nearly unchanged rhodolith size structure over the past few years, as documented in the present and other studies of the bed (Figure 1B; Gagnon et al., 2012; Millar and Gagnon, 2018). We include the “North” site (Figure 1A) in a follow up study of trophic variability (Hacker Teper, 2022) because of the presumably greater environmental variability at this site resulting from greater proximity to freshwater input from the marina. The present study, therefore, focuses on trophic interactions at one site based on a single point in time, and serves as a baseline for expansion of spatial and temporal dimensions in a follow-up study (Hacker Teper, 2022).
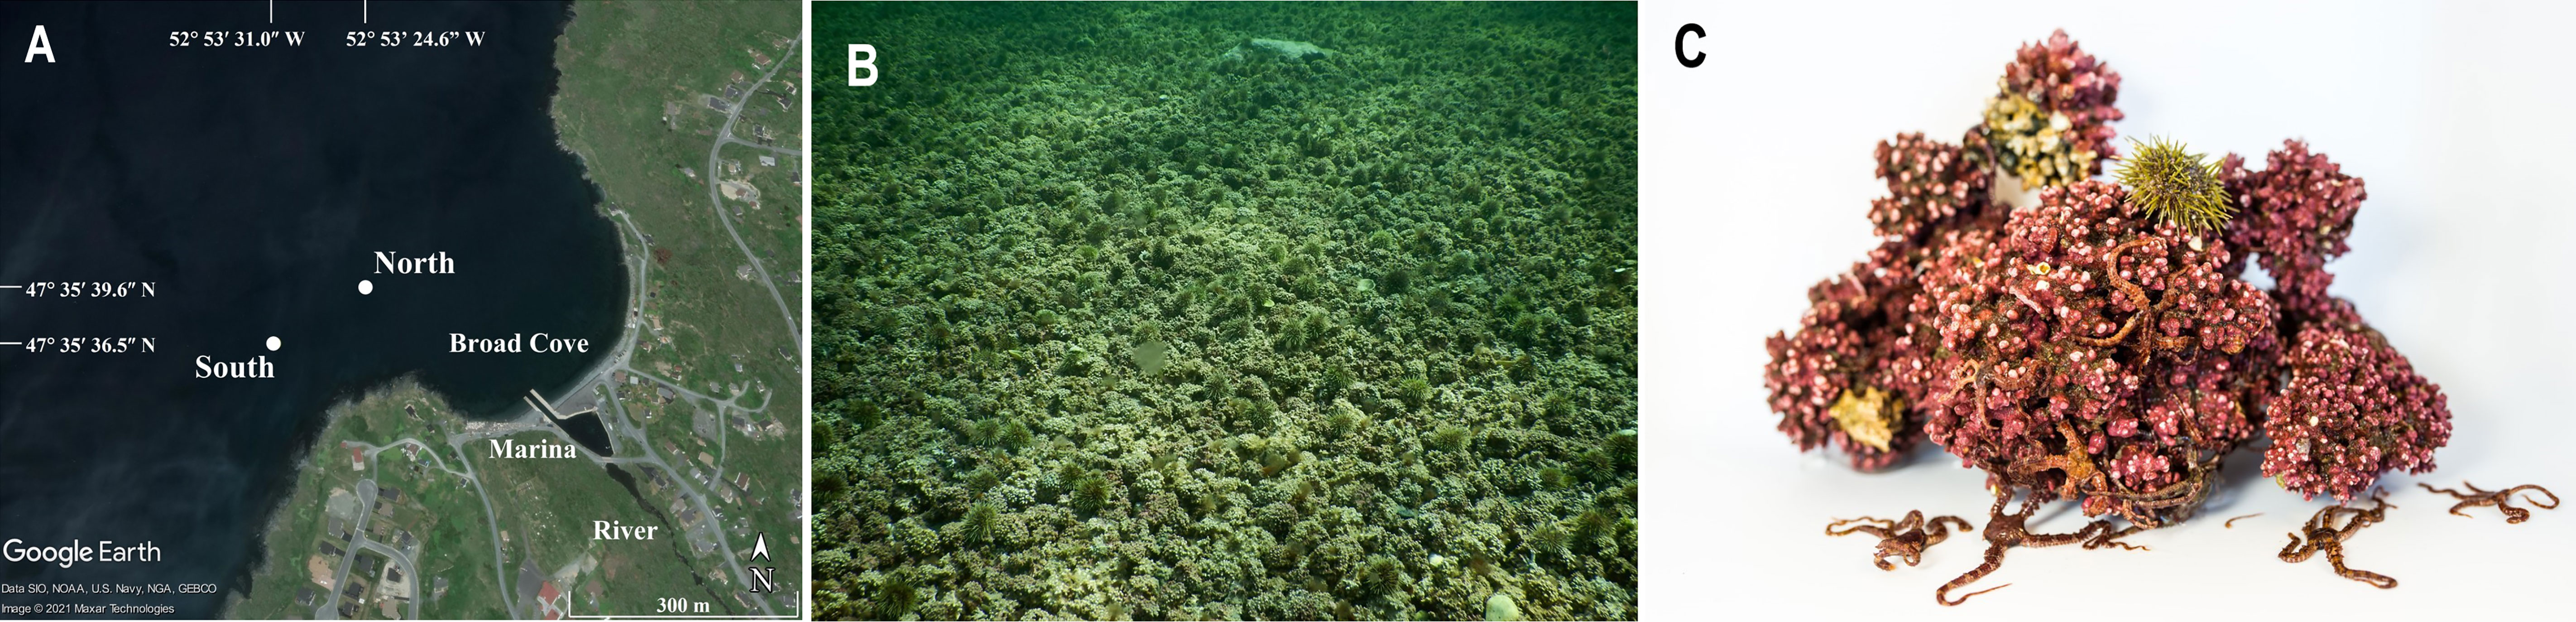
Figure 1 (A) Location of the two study sites within the rhodolith (Lithothamnion glaciale) bed fringing St. Philip’s (southeastern Newfoundland) used to study rhodolith bed trophodynamics. The present study focuses on the food web at the “South” site in the spring of 2017. The “North” site is included in a follow up study (Hacker Teper, 2022) examining spatial and temporal variability in food web structure. Both sites are located at the periphery of Broad Cove, which receives seasonally variable volumes of freshwater from the adjacent marina and river to which it is connected (Image: Google Earth). (B) Section of the rhodolith bed at the South site at a depth of ~15 m. Rhodoliths are tightly aggregated, with very little to no epiphytes and a relatively high abundance of green sea urchins (S. droebachiensis) moving on the bed surface (the biggest urchins are ~6 cm in test diameter) (Image: Patrick Gagnon). (C) Staged photograph of rhodoliths (Lithothamnion glaciale) and associated macrofauna (visible: Ophiopholis aculeata, Strongylocentrotus droebachiensis, cryptic: Tonicella spp.) out of water from a laboratory bench at the Ocean Sciences Centre. (Image: Sean Hacker Teper).
Our food web analyses (described below) focused on the following six animal (1-6; Figures 1C, 2A−F), two macroalgal (7-8), and two environmental (9-10) components inside (1-6, 8, 10) or outside (7, 9) of the bed: (1) common sea star, Asterias rubens; (2) wrinkled rock-borer, Hiatella arctica [bivalve]; (3) juvenile Nereis spp. [polychaetes]; (4) daisy brittle star, Ophiopholis aculeata; (5) green sea urchin, Strongylocentrotus droebachiensis; (6) red molted chiton, Tonicella marmorea, and Atlantic red chiton, T. rubra, which were too difficult to distinguish morphologically, and hence were pooled to genus Tonicella spp.; (7) pieces of Laminaria digitata [kelp] from nearby kelp beds; (8) Lithothamnion glaciale [rhodoliths]; (9) seawater [containing seston] from a few meters above the rhodolith bed; and (10) sediment [containing infauna] underlying the rhodoliths. We chose these six animal species because they exhibit different dominant feeding strategies defined as per Macdonald et al. (2010), namely suspension/filter feeding (2, 4), grazing (5, 6), and predation (1, 3), but occur in sufficient abundance to quickly provide enough biological material for the analyses as per cryptofaunal diversity and abundance studies for this bed (Gagnon et al., 2012; Bélanger, 2020). Pieces of kelp (8), seawater from above the rhodolith bed (9), and sediment underlying the rhodolith bed (10) were sampled to explore possible benthic-pelagic coupling.
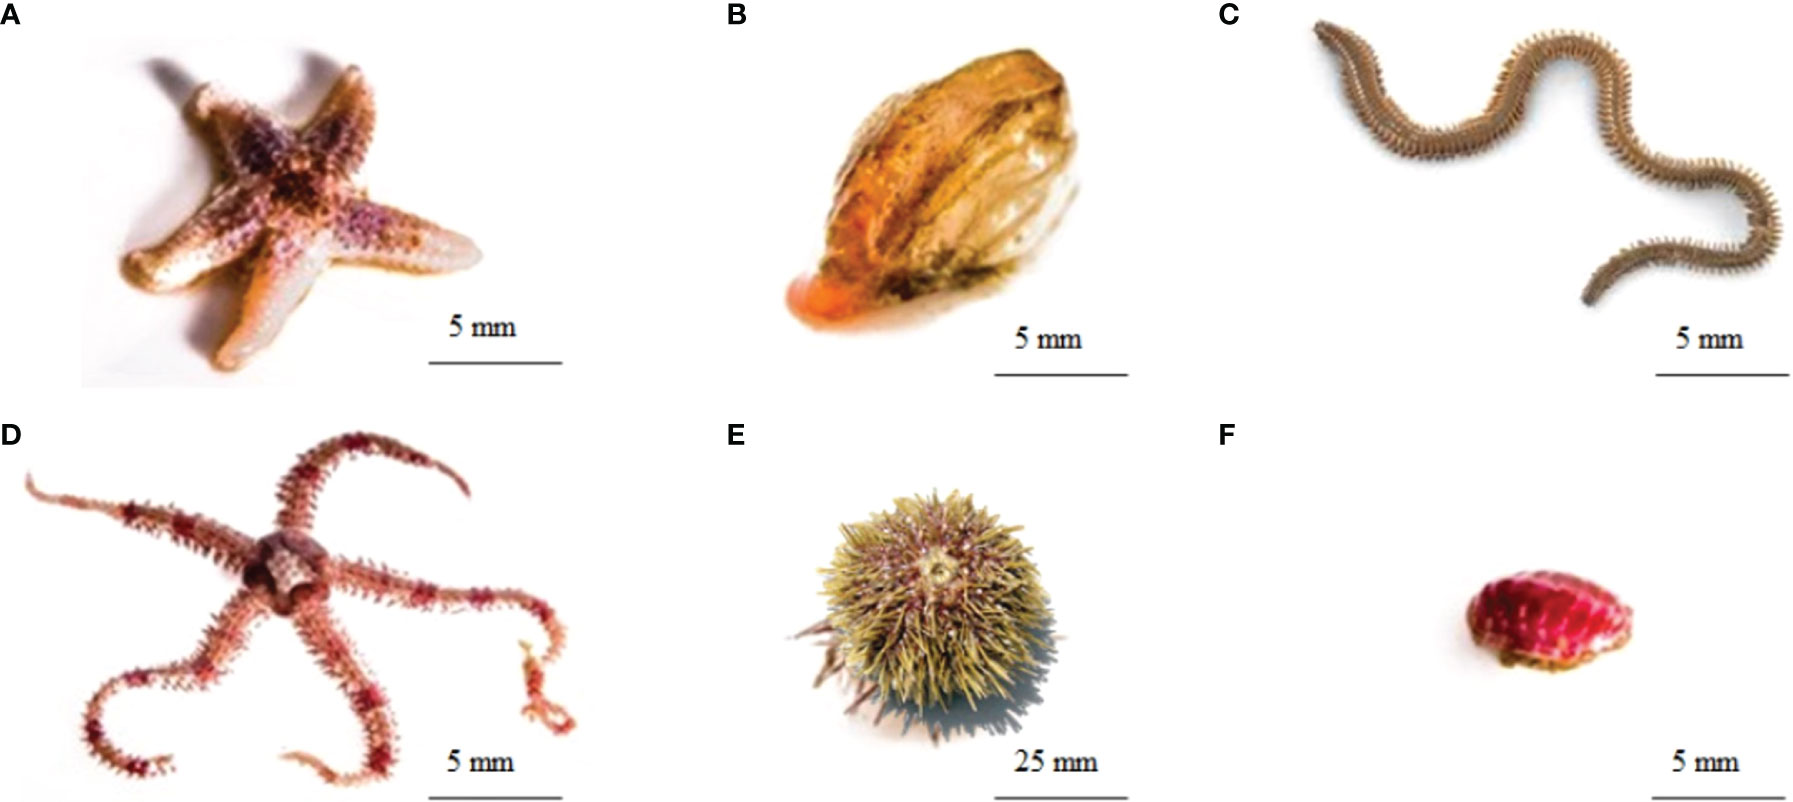
Figure 2 The six animal species included in the present study’s food web analyses; (A) common sea star, Asterias rubens; (B) wrinkled rock-borer, Hiatella arctica [bivalve]; (C) Nereis spp. [polychaete]; (D) daisy brittle star, Ophiopholis aculeata; (E) green sea urchin, Strongylocentrotus droebachiensis and (F) Atlantic red chiton, Tonicella rubra (Images: (A, B, D, F) - Sean Hacker Teper; (C) https://www.enasco.com/p/Sandworm-Clam-Worm-Nereis%2C-Preserved%2BLS01292; (E) https://pugetsoundsealife.sseacenter.org/pugetsoundsealife.com/puget_sound_sea_life/Green_Sea_Urchin.html.
2.2 Timing of Sampling
To increase the likelihood of detecting benthic-pelagic coupling, we sampled the rhodolith bed during the annual spring phytoplankton bloom in southeastern Newfoundland, when diatom abundance in the water column was predictably highest (Budge and Parrish, 1998; Parrish et al., 2005). We collected fluorescence data at the study site with a CTD (conductivity, temperature, and depth) profiler equipped with PAR (photosynthetically active radiation) and fluorescence sensors to monitor the progression and confirm the occurrence of the bloom (Appendix A). The bloom began in the last few days of March 2017 and continued until at least 23 April, 2017 (Figure A.1A), when we sampled the rhodolith community and collected rhodoliths for food web analyses.
2.3 Rhodolith Community
To broadly characterize the rhodolith community at our collection/study site, scuba divers hand collected, on 23 April, 2017, all the rhodoliths from one 30 x 30 cm quadrat placed every 5 m along a 30-m long transect at a depth of ~15 m at the South site (for a total of seven quadrats sampled). We chose to sample this section of the bed because of the relatively homogenous distribution and high abundance of rhodoliths there (Gagnon et al., 2012; Millar and Gagnon, 2018); Figure 1B). Rhodoliths and their associated cryptofauna were deposited in labelled, sealable plastic bags, with several bags per quadrat. Bags were sealed under water, placed in mesh collection bags, and lifted to a boat where they were stored in plastic bins filled with seawater collected at the site. They were transported to the Ocean Sciences Centre (OSC) of Memorial University of Newfoundland (MUN) within 4 h of collection and placed in large (320-L) holding tanks supplied with running seawater pumped in from the adjacent Logy Bay.
Lengths of the longest, intermediate, and shortest axes, as well as gross weight of the 247 rhodoliths collected were measured with calipers (precision of 0.1 mm) and a balance (precision of 0.1 g; PB3002-S/FACT; Mettler Toldeo). Each rhodolith’s linear dimensions and number of rhodoliths in each of the seven quadrats were subsequently used to calculate each rhodolith’s sphericity (as per Graham and Midgley [2000] and Sneed and Folk [1958]) or to estimate rhodolith abundance (density) in the bed. We plotted rhodolith shape with the spreadsheet TRIPLOT (https://www.lboro.ac.uk/microsites/research/phys-geog/tri-plot/tri-plot_v1-4-2.xls) (Sneed and Folk, 1958; Graham and Midgley, 2000) as described by Gagnon et al. (2012). All cryptofauna on the external surface and inside of each rhodolith were extracted with tweezers and forceps, breaking rhodoliths in pieces with a screwdriver and a hammer to extract hidden specimens when needed. We placed organisms in labeled specimen cups filled with a 4% formalin solution prior to permanent changeover after three days into a 70% ethanol solution. Over the following few weeks, preserved cryptofauna were identified and counted with a stereomicroscope (DMW-143-N2GG; Motic) at 10 or 20X magnification and weighed with a balance (precision of 0.1 g; PB3002-S/FACT; Mettler Toldeo). Epiphytes and encrusting invertebrates such as bryozoans and sponges were present in trace amounts, and hence excluded from the analysis. For each quadrat, we subsequently subtracted total cryptofaunal weight from gross rhodolith weight to obtain net rhodolith weight, which we used to calculate rhodolith abundance (biomass) in the bed.
2.4 Collection and Preparation of Samples for Food Web Analyses
To limit influences of manipulation of rhodoliths and their cryptofaunal content on data quality, we used a different group of rhodoliths for food web analyses than those sampled to characterize the rhodolith bed community. On 23 April, 2017, divers hand collected ~150 live rhodoliths measuring 8 to 10 cm along the longest axis from the same area where we sampled the associated bed community. Broken rhodoliths and rhodoliths partially buried in sediment or with blackened or whitened tissue on their surface (indicative of stress or necrosis) were not collected because of potential influences on the abundance, diversity, and chemical composition of resident cryptofauna. Preliminary analysis indicated that common sea star and green sea urchin biomasses within the rhodoliths were too low to provide the minimum amount of tissues required to run the lipid and stable isotope analyses (see below). We resolved this requirement by collecting an additional ~10 small individuals (1-2 cm in diameter) from atop the bed for each species. The fronds of three, ~1 m long kelp (L. digitata) growing on rocks at a depth of ~2 m near the rhodolith bed were also hand collected. Rhodoliths and kelp fronds were placed in plastic bags sealed underwater. We collected seawater a few centimeters above the rhodolith bed with two, 12-L Niskin bottles that we deployed gently to prevent resuspension of sediment from the bed. Water from the bottles was transferred (on the boat) to plastic containers pre-rinsed with distilled water, from which a total of 17 L of seawater was subsequently taken to meet the requirements of the various analyses (see below). Three sediment samples were also scooped from the top (~10 cm) layer of muddy sediment underneath rhodoliths with 15-mL centrifuge tubes.
All rhodoliths and their cryptofaunal content, as well as kelp fronds, were transported to the OSC as described above (see section 2.3). At the OSC we transferred all the rhodoliths in their sealed plastic bags to large (320-L) holding tanks supplied with running seawater to keep water temperature in the bags naturally low (~0.5°C), while retaining all cryptofauna. Bags were kept sealed in the tanks for 24 h to (1) facilitate stomach emptying of focal species; (2) prevent hypoxia and degradation of biological tissues; and (3) avoid mixing water from St. Philip’s [in the bags] with water from Logy Bay [in the holding tanks]. This procedure reduced the likelihood of contaminating the original lipid class, FA, and isotopic signatures of the focal species. After this 24-h resting phase, we removed bags from the tanks and processed them one by one with pre-cleaned/sterilized tools and glassware manipulated with frequently changed nitrile gloves, again to avoid contamination of samples. Test tubes and scintillation vials were heated in an oven for 8 h at 425°C to remove lipid material, then labeled and weighed. Test tube caps and the tools used to break rhodoliths (hammer, screwdriver, mortar, and pestle) and extract and separate cryptofauna (tweezers, forceps, filters) were lipid-cleaned with three rinses each of methanol and chloroform to remove any residual lipids. We rinsed collection and storage items (sealable plastic bags and containers, centrifuge tubes) with distilled water.
We extracted the six focal animal species from the surface of rhodoliths with tweezers and forceps, breaking rhodoliths in pieces with a screwdriver and a hammer to extract cryptic specimens when needed. For lipid class and FA analyses, we obtained three replicates of 0.5 to 1.5 g of tissue each (wet weight) for each species from one or several individuals (i.e. pooling tissue as needed). We included whole individuals (i.e. shells, exoskeletons, and internal organs) in the wet weight of lipid class and FA analysis samples. Each replicate was placed in a 40-mL test tube (one replicate per tube) and stored on ice in a cooler until we had collected all replicates. Test tubes were then filled with 8 mL of chloroform, flushed under a gentle stream of nitrogen, capped, sealed with Teflon tape, stored in freezers at -20°C, and their content analyzed within two months. For stable isotope analysis, we collected ~5 g of tissue, excluding shells and exoskeletons, into one 20-mL scintillation vial for each species to be split into three replicates once dry (see section 2.7). Due to the randomness of availability of material of the small, pooled organisms and because lipid extraction may affect δ15N data (Post et al., 2007), we did not use the same organism material between lipid-extraction and stable isotope analysis (see section 2.9 for statistical implications). After oven drying for 24 h at 60°C, at least 1 to 1.5 mg of tissue remained for each replicate. Each scintillation vial was capped with tin foil and a cap, stored in freezers at -80°C, and their content analyzed within 12 months.
Upon arrival at the OSC, kelp fronds and sediment samples were immediately stored in their individual, sealed plastic bags (kelp) or centrifuge tubes (sediment) in freezers at -80°C. We used the same procedures as above to prepare rhodolith, kelp, and sediment samples for lipid class, FA, and stable isotope analyses, with the following modifications. Rhodoliths were first gently scrubbed by hand to remove epibionts, broken off with a screwdriver and a hammer, and ground into a powder with a mortar and a pestle. Rhodolith powder was analyzed; within two (lipid class and FA analyses) or 12 (stable isotopes) months. Kelp fronds (blades and stipes) were gently scrubbed by hand to remove epibionts. Each replicate of sediment for the lipid class and FA analyses weighed 6 to 8 g (wet weight). We also analyzed kelp and sediment samples within two (lipid class and FA analyses) or 12 (stable isotopes) months.
We processed seawater samples immediately upon arrival at the OSC. The two plastic containers holding the seawater were shaken to re-suspend any settled materials. We transferred this water and its content with 250- to 500-mL graduated cylinders to a mechanized filtration system, which suctioned water with an aspirator through a 47-mm diameter GF/C filter (Whatman; General Electric) at the bottom of a Büchner funnel. During suction, we washed the contents of graduated cylinders onto the filters with filtered seawater to transfer all lipid material. Visual inspection of the first filter indicated an acceptable accumulation of suspended materials upon completing the filtration of the first 3 L of seawater. Given the total volume of water available (~17 L), we created three replicates for the lipid class and FA analyses; one per each 3 L of filtered seawater. We also filtered the remaining water, 8 L, yielding three replicates for the stable isotope analysis; one per each 2.5 L of filtered seawater. Each filter used was rolled with tweezers and placed in a 40-mL test tube (one filter per tube) for the lipid class and FA analyses, or in a 20-mL scintillation vial (one filter per vial) for the stable isotope analysis. Test tubes were filled with 8 mL of chloroform, flushed under a gentle stream of nitrogen, capped, sealed with Teflon tape, stored in freezers at -20°C, and their content analyzed within two months. Vials were capped with tin foil and a cap, stored in freezers at -80°C, and their content analyzed within 12 months.
2.5 Extraction and Characterization of Lipid Classes
Extraction of lipids followed protocols by Folch et al. (1957) with modifications by Parrish (1999). We took samples in their test tubes out of the freezers and handled 8 to 16 at a time. Each tube was held in ice and contents were immediately ground to a pulp with a metal-ended rod washed into the tube with ~1 mL of chloroform:methanol (2:1) and 0.5 mL of chloroform-extracted water. We sonicated the tube for 4 min and centrifuged it for 3 min at 3000 rpm. The resulting organic layer at the bottom of the tube was completely removed and transferred to a 15-mL vial with a double pipetting technique to bypass the upper aqueous layer and transfer only the lower aqueous layer. After three repetitions, we washed both pipettes into the 15-mL vial with 3 mL of chloroform. All vials were flushed under a gentle stream of nitrogen, capped, sealed with Teflon tape, and stored in freezers at -20°C. We subsequently transferred each vial’s content to a 2-mL, lipid-clean vial with three or more rinses of 0.5 mL of chloroform, until the chloroform in the 15-mL tube remained transparent. Each 2-mL vial was flushed under a gentle stream of nitrogen, capped, sealed with Teflon tape, and stored in freezers at -20°C.
We used thin-layer chromatography with flame ionization detection (TLC-FID) to characterize lipid classes (Parrish, 1987). Separation of lipid classes followed a 3-step development method in which four solvent solutions of different polarities were used to obtain three chromatograms per rod (Parrish, 1987). In a first step, we created calibration curves (against which samples were compared) with a 9-component standard (nonadecane, hydrocarbon; cholesteryl palmitate, steryl ester; 3-hexdecanone, ketone; tripalmitin, triacylglycerol; palmitic acid, free fatty acid; cetyl alcohol, alcohol; cholesterol, sterol; monopalmitoyl glycerol, acetone mobile polar lipid; phosphatidylcoline dipalmitoyl, phospholipid; Sigma Chemicals). Prior to applying samples, silicic acid-coated quartz rods (Chromarods, Type SV; Iatron Laboratories Inc.) were blank scanned (the process of cleaning and activating rods by burning off any residual lipids from previous samples) three times in an Iatroscan TLC-FID system (Mark VI; Iatron Laboratories Inc.). We operated the Iatroscan with a hydrogen flow between 195 and 199 mL min-1 and an air flow of 2 L min-1 at a room temperature of ~20°C. After sample application (spotting) and before each development, the rods were dried and conditioned for 5 min in a constant humidity chamber (30%). We spotted samples individually onto one of 10 rods in each of 2 racks (for a total of 20 rods) with a 25-μL Hamilton syringe (Hamilton Co.). Depending on the lipid concentration of each sample (estimated by colour and confirmed by trial and error), we spotted 0.5 to 10 μL was spotted at the origin of each rod. Both racks were then dipped twice into a 100% acetone solution and were removed each time when acetone reached the spotted samples. We then double-developed rods in a hexane:diethyl ether:formic acid (98.95:1:0.05) solution, for 25 min, and then for another 20 min to separate hydrocarbons (HC), steryl esters (SE), and ethyl and methyl ketones (KET). We scanned each rod in the Iatroscan beyond the KET peak to obtain the first chromatogram showing lipid quantities of HC, SE, and KET in each sample.
In a second step, we developed rods for 40 min in a hexane:diethyl ether:formic acid (79:20:1) solution to separate diacyl glyceryl ethers, triacylglycerols (TAG), free fatty acids (FFA), alcohols (ALC), sterols (ST), and diacylglycerols (DG). We scanned each rod beyond the DG peak to obtain the second chromatogram showing lipid quantities of TAG, FFA, ALC, ST, and DG in each sample. In a third step, we double-developed rods twice, first in a 100% acetone solution for 15 min each, then in a chloroform:methanol:chloroform-extracted water (5:4:1) solution for 10 min each to separate the most polar lipid classes, acetone-mobile polar lipids (AMPL), and phospholipids (PL). Finally, each rod was completely scanned to obtain the third and final chromatogram showing lipid quantities of AMPL and PL.
2.6 Preparation and Characterization of Fatty Acid Methyl Esters (FAME)
We prepared fatty acid methyl esters (FAME) of lipids by transesterification of extracts following a modified procedure described by Christie (1982) and Hamilton (1992). We took extracted lipid samples in their 2-mL vials from the freezer and held them in ice. Depending on each sample’s lipid concentration (estimated by colour and confirmed by trial and error), we transferred 20 to 1000 µL of lipid extract with a 20 to 100 µL Drummond microdispenser (Drummond Scientific) into a lipid-clean, 15-mL vial. We evaporated the transferred extract to dryness under a stream of nitrogen gas, then we added 1.5 mL of dichloromethane and 3 mL of prepared Hilditch reagent (an alkylation derivatization reagent, 1.5 H2SO4: 98.5 MeOH). Each vial was vortexed, sonicated for 4 min, flushed with nitrogen, heated at 100°C for one hour, cooled to room temperature, filled with 0.5 mL of a supersaturated sodium bicarbonate solution and 1.5 mL of hexane, and agitated vigorously. This process created an organic layer containing fatty acids transesterified to fatty acid methyl esters (FAME), which we transferred with a pipette to a lipid-clean, 2-mL vial, and evaporated to dryness under a stream of nitrogen. Each 2-mL vial was then filled with ~0.5 mL of hexane, flushed with nitrogen, capped, sealed with Teflon tape, and stored in freezers at -20°C.
We used gas chromatography and flame ionization detection (GC-FID) to measure fatty acids (Ackman, 1986; Christie, 1989; Budge et al., 2006). FAME samples were analyzed in a HP 6890 GC equipped with an Agilent 7683 autosampler. The GC column was a 30-m long ZB wax+ (Phenomenex) with an internal diameter of 0.32 mm. We introduced each FAME sample individually into a heated injector at 150°C. A stream of hydrogen then carried the sample at a rate of 2 mL min-1 through the GC column, which retained FAME depending on structure. This selective retention resulted in the detection of individually eluted FAME by the FID. The GC column temperature started at 65°C for 30 s before it was increased to 195°C at a rate of 40°C min-1, held there for 15 min, then increased again to 220°C at a rate of 2°C min-1, and held there for 45 s. The initial injector temperature of 150°C increased to a final temperature of 250°C at a rate of 120°C min-1. The detector (FID) temperature remained constant at 260°C. We identified FA peaks by comparing retention times in the GC column with those from various standards: FAME mix (47885-U; Supelco), Bacterial acid methyl ester mix (47080-U; Supelco); PUFA 1 (47033; Supelco); and PUFA 3 (47085-U; Supelco). We integrated chromatogram peaks with Varian Galaxie Chromatography Data System V1.9.3.2 software.
2.7 Stable Isotope Preparation and Analysis
We removed samples in scintillation vials from the freezer and thawed and oven dried them at 60°C for 24 h. Each sample was split equally by weight into three new, 20-mL scintillation vials. Each triplicate was ground with a mortar and pestle and rinsed three times with acetone. We then split each ground sample into two equal parts: one for analysis of carbon content, the other for nitrogen. Vials with samples for nitrogen analysis were each rinsed three times with distilled water to remove salt because halides interfere with the Elemental Analyzer (described below). We acidified samples for carbon analysis to remove inorganic carbon by adding drops of 1 M HCl to the vials until no bubbles formed. Vials were left with lids off in a fume hood overnight, rinsed three times with distilled water to remove both HCl and halides, dried again at 60°C for 24 h, transferred to desiccators, and subsequently taken to The Earth Resources Research and Analysis (TERRA) facility at MUN for analysis. We used tools and tin capsules pre-cleaned with acetone to extract, weigh, and hold the following quantities of solidified samples from each vial: 1 to 1.5 mg for animals; 4 to 4.5 mg for rhodolith and kelp; 14 to 15 mg for sediment; 5 to 7 mg of filter for seawater δ13C and carbon content; and 8 to 10 mg of filter for seawater δ15N and nitrogen content. We held tin capsules and their content in a desiccator and processed them within a month as per the following procedure.
We analyzed bulk stable isotopes and complementary C and N elemental proportions (%) in an Elemental Analyzer (EA) system (NA1500; Carlo-Erba) consisting of an autosampler, an oxidation reactor (oven), a reduction reactor, a water trap, a gas chromatography (GC) column, and a thermal conductivity meter (TCD). The entire EA was flushed continuously with helium at a rate of 90 to 110 mL min-1. We dropped each tin capsule and its content individually onto the oxidation reactor at a temperature of 1050°C, with simultaneous injection of oxygen and quick flushing with He. This sequence triggered a flash combustion at 1800°C between the tin capsule and oxygen, creating combustion gases that were pushed through an oxidation catalyst (chromium trioxide, CrO3) to ensure complete oxidation of the sample and silvered cobaltous/cobaltic oxide, which removes halides and SO2. The resulting gas mixture passed through the reduction reactor (reduced copper) at 650°C, which reduces nitrogen oxides to nitrogen gas and absorbs oxygen. The gases then passed through a magnesium perchlorate Mg(ClO4)2 water trap, after which the remaining gases (N2, CO2) entered a 3-m GC column (QS 50/80; Poropak) at 40 to 100°C. The individual gases were on the GC column. Upon reaching the TCD, they were detected as separate gas peaks; first N2, then CO2. From the TCD, He carried the gases to a ConFloIII interface (Finnigan, Thermo Electron Corporation), which has split tubes, open to the atmosphere, which allow a portion of the He and combustion gases to enter directly into the ion source of the mass spectrometer (MS) (DeltaVPlus; Thermo Scientific). During operation, He from the EA flowed continuously into the MS. Internal and external reference material was used to calibrate MS data. We used EDTA #2 and D-Fructose for carbon isotope calibration, and IAEA-N-1 ((NH4)2SO4) and IAEA-N-2 ((NH4)2SO4) for nitrogen isotope calibration. We used NBS-18 (CaCO3), B2150 (high organic sediment), B2151 (high organic sediment), and B2105 (Cystine) to aid data interpretation of carbon isotope analyses, and sorghum flour, B2153 (low organic soil), USGS-25 ((NH4)2SO4), USGS-26 ((NH4)2SO4), sulfanilamide, and BBOT to aid data interpretation of nitrogen isotope analyses. L-glutamic acid and B2155 (protein) were used for both carbon and nitrogen elemental calibration.
2.8 Trophic Magnification of Fatty Acids
Stable isotope ratios are expressed in the conventional (δ) notation as parts per thousand (‰) as per the equation of Minagawa and Wada (1984):
where Rsample and Rstandard are the ratios of 13C/12C or 15N/14N of a given sample and corresponding standard, respectively. Results are reported relative to atmospheric N2 for nitrogen stable isotopes, and Vienna PeeDee Belemnite (VPDB) for carbon stable isotopes. Species trophic position (TPconsumer) was calculated with the equation used by Gale et al. (2013), and developed originally by Cabana and Rasmussen (1996):
where δ15Nconsumer is the mean stable N isotope ratio of each species, and Δ15N is the fractionation factor which, to be consistent with rhodolith food web studies, is 3.4‰ (Grall et al., 2006). δ15Nbase and TPbase represent the nitrogen stable isotope composition and trophic positions from the base of the food web, respectively. We then calculated a trophic magnification factor (TMF) for fatty acids (FA) correlated with δ15N. This factor quantitatively represents the biomagnification of compounds along a food web (Borgå et al., 2012; Connelly et al., 2014). Compound concentrations often change across trophic levels, thus the equation:
or
and, therefore,
where m and b are the slope and intercept of the linear relationship (which strength was determined with conventional Spearman Rank-Order correlation tests) between loge FA% and trophic position (TP), respectively. Positive values of m and TMF imply biomagnification throughout the food web, whereas negative values denote proportional depletion. To this extent, we did not use TMF as a tool to see changing concentrations of FAs through direct predator-prey relationships among organisms. Instead, we used TMF as a method to assess biomagnification and depletion of FAs by comparing FAs to one another and to help confirm the presence of key identified biomarkers throughout the food web (Connelly et al., 2014).
2.9 Statistical Analysis
2.9.1 Lipid Classes
We used a one-way permutational MANOVA (PERMANOVA) (Euclidean distance matrices with 9999 permutations) with the factor Component (nine of the 10 components of the food web studied [six animal species, kelp, sediment, and seawater]) to examine differences in proportions of lipid classes among samples (N=25, accounting for accidental loss of two samples during the analyses). We excluded the rhodolith component because of insufficient rhodolith tissue for lipid extraction. To limit extraneous data variability while focusing on the most significant lipid classes, our analysis included only lipid classes present in over 50% of the samples. Sample sizes for each food web component (N=2 or 3) was too low to examine differences among specific components. Consequently, for comparison purposes only, we pooled the data into the five following functional groups reflecting the three dominant feeding strategies of the six animal species, one macroalgal species, and two environmental components: (1) suspension/filter feeders [two species]; (2) grazers [two species]; (3) predators [two species]; (4) kelp; and (5) seawater/sediment [samples combined because of expected benthic-pelagic coupling and to achieve a sufficient sample size for statistical analysis] (see section 2.1 for details). We then ran a one-way PERMANOVA with the factor Functional Group (the five groups explained above). This approach yielded statistically reliable comparisons, except with kelp, for which sample size was too low and could not be pooled with any of the four other groups because of its unique nature. We therefore do not present comparisons with kelp. We examined relationships between total lipid and each of the major lipid classes with conventional Spearman Rank-Order Correlation tests (Zar, 1999).
2.9.2 Fatty Acids
To examine differences in the proportions of FAs among samples (N=25), we used the same statistical approach (two one-way PERMANOVAs; one with Component as factor followed by one with Functional Group as factor) with the same data exclusion and grouping as for the lipid classes analysis. We then used a one-way SIMPER analysis (run on untransformed data with a Bray-Curtis similarity matrix) with the factor Component (nine of the 10 components of the food web studied [six animal species, kelp, sediment, and seawater], to identify potential food sources and the main FAs contributing to the lipid composition of each component (Kelly and Scheibling, 2012; Gabara, 2014). To limit extraneous data variability while focusing on the most significant FAs, we included only FAs contributing to over 70% of the similarities in the SIMPER analysis. We used a follow-up principal coordinates analysis (PCO; also run on untransformed data with a Bray-Curtis similarity matrix) with the factor Component (same as above), mainly for visualization of the feeding relationships among specific groups of organisms (Guest et al., 2008; Drazen et al., 2009). To increase clarity on the PCO, we plotted only samples with a Pearson coefficient of correlation >65% (plus DHA; 22:6ω3, because of its importance as an essential FA).
2.9.3 Stable Isotopes
We examined differences in carbon (δ13C) and nitrogen (δ15N) isotope ratios with two one-way PERMANOVAs (one for each type of ratio; both types based on Euclidean distance matrices with 9999 permutations) with Component as factor. The δ13C isotope ratio analysis (N=27, accounting for accidental loss of three samples during the analyses) included all taxa (six animal species, kelp, and rhodoliths) and both environmental components (seawater and sediment). We included both environmental components and all except one taxon (Nereis spp., for which we lacked sufficient amounts of tissues for quantification of stable isotope ratios) in the δ15N isotope ratio analysis (N=26, accounting for accidental loss of one sample during the analyses). Due to our using separate samples for lipid-extract and stable isotope analyses, we used the averages of stable isotope results of individual components to make comparisons to lipid and FA data. To group and map, in the form of a dendrogram, statistically different components of the food web, we also carried out a cluster analysis using “Group Average” clustering on δ13C and δ15N isotope ratios simultaneously, and complementary SIMPROF test (Euclidian distance matrix with 9999 permutations) (N=23 because of a few unmatched pairs of δ13C and δ15N ratios) (Grall et al., 2006; Gabara, 2014). Four main isotopic groups emerged from the SIMPROF test. We therefore ran follow-up one-way PERMANOVAs (one with both isotopic ratios combined, followed by one for each type of isotopic ratio) and complementary one-way ANOVAs and post-hoc tests with the factor Group to identify differences among these four main trophic groups.
2.9.4 General Aspects of Statistical Tests
In all PERMANOVAs, data were untransformed and computed on Bray-Curtis similarity or Euclidian distance matrices (9999 permutations) to meet the assumptions of multivariate normal (Gaussian) distribution and homogeneity of the covariance matrices (Budge et al., 2006; Clarke et al., 2006; Hair et al., 2006). All FA multivariate data were computed using Bray-Curtis similarity matrices, while lipid and stable isotope multivariate data were computed using Euclidean distance matrices due to its better ability to handle missing data. Contrary to the recommendation from Kelly and Scheibling (2012), we used untransformed data because the dispersion of variance was equivalent to transformed data and it avoided artificial weighting of FAs with smaller proportions on our results compared to transformed data (Carreón-Palau et al., 2017). We used PERMDISP (9999 permutations) to inform our decision (p=0.391); we tested for homogeneity of multivariate variances and confirmed all variances were homogenous. We used PCO (principal coordinates analysis) instead of PCA (principal components analysis) to more efficiently account for missing data (Rohlf, 1972). In all ANOVAs, we verified homogeneity of variance and normality of residuals by examining the distribution of the residuals and the normal probability plot of the residuals, respectively (Snedecor and Cochran, 1994). We used a significance level of 0.05 in all analyses and report all means with standard deviation (mean ± SD) unless stated otherwise. We used standard error where applicable for consistency with corresponding literature (Gagnon et al., 2012; Connelly et al., 2014; Parzanini et al., 2018). We used PRIMER v7 with PERMANOVA+ for multivariate statistical analyses, Minitab 18 for univariate statistical analyses, and Microsoft Excel for descriptive statistics.
3 Results
3.1 Rhodolith Community
Rhodolith biomass at the study site averaged 19.5 ± 0.9 (SE) kg m-2. The 247 rhodoliths sampled varied in size from 11.3 to 65.6 mm, and 24.0 to 116.2 mm along the shortest and longest axes, respectively. Those rhodoliths were predominantly spheroidal and compact (~61%), but otherwise platy (~12%), bladed (~19%), or elongate (~8%) Figures 3A, B). Total cryptofaunal biomass averaged 34.5 ± 4.3 g kg-1 rhodoliths. The 1191 animals extracted from the rhodoliths belonged to at least 21 species under six phyla, with echinoderms (452.7 ± 47.0 individuals kg-1 rhodoliths) and molluscs (427.6 ± 39.6 individuals kg-1 rhodoliths) as the two numerically dominant groups (Table 1). Species included in the biochemical analyses were particularly abundant, including Ophiopholis aculeata (336.7 ± 30.8 individuals kg-1 rhodoliths), Tonicella spp. (191.6 ± 27.2 individuals kg-1 rhodoliths) and Hiatella arctica (152.8 ± 23.2 individuals kg-1 rhodoliths). A few species not included in the analyses were also relatively abundant, including the brittle star, Ophiura robusta (72.7 ± 13.8 individuals kg-1 rhodoliths), the caridean shrimp, Pandalus borealis (36.9 ± 7.5 individuals kg-1 rhodoliths), and the polychaete, Potamilla reniformis (30.0 ± 10.3 individuals kg-1 rhodoliths).
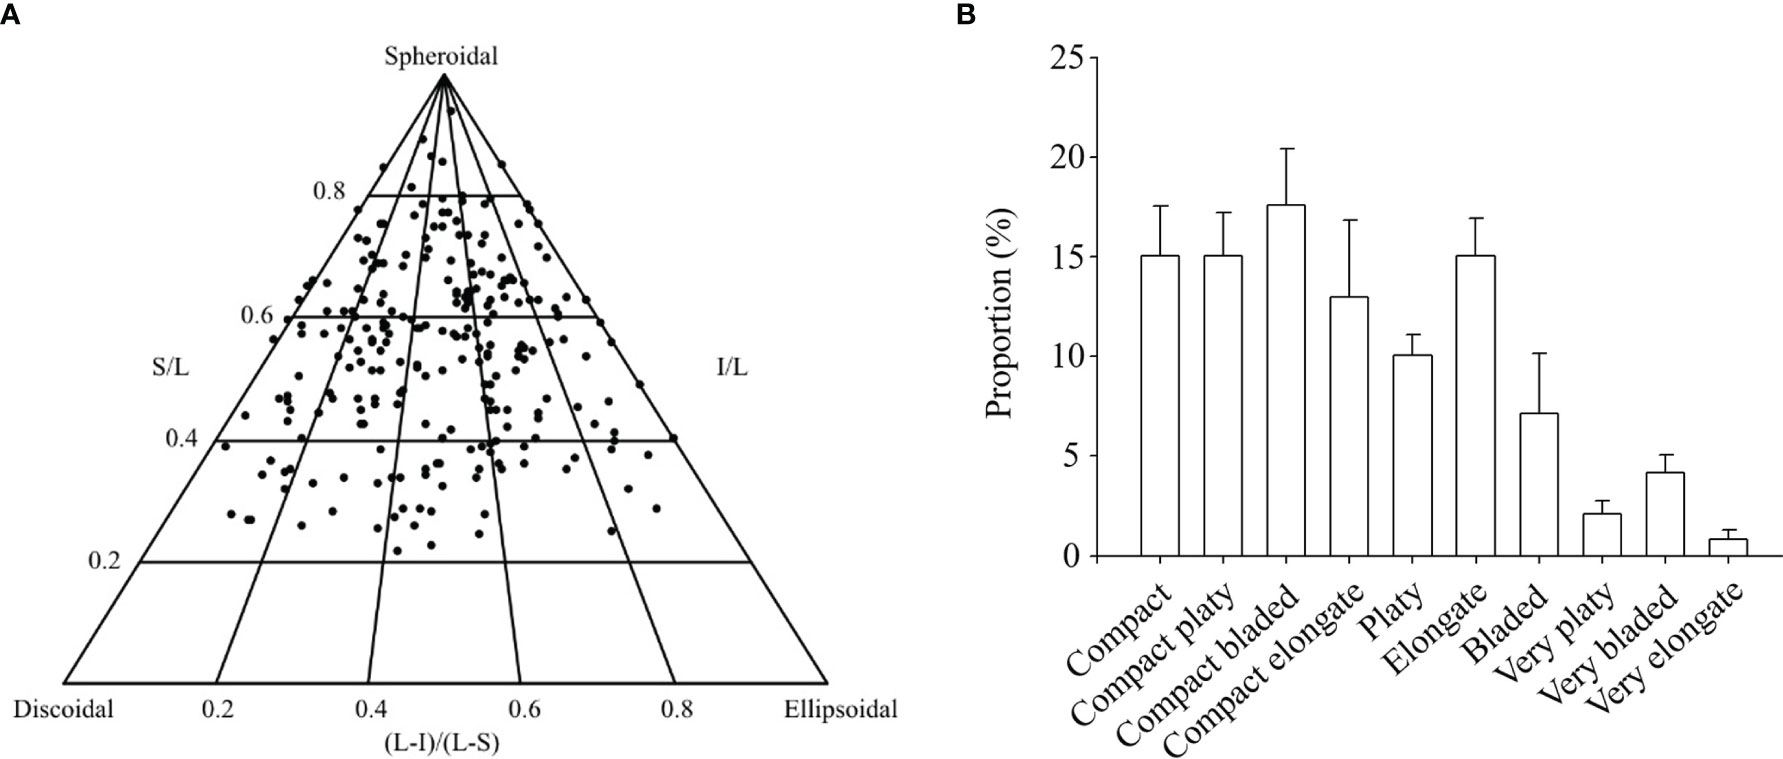
Figure 3 (A) Ternary diagram of rhodolith [Lithothamnion glaciale] shape relative to purely spheroidal, discoidal, and ellipsoidal rhodoliths [N=247; one solid circle per rhodolith]. Rhodoliths were collected in April 2017 at the South site (see Figure 1A). The position of each rhodolith in the diagram is determined by its sphericity, calculated from the length of its longest [L], intermediate [I], and shortest [S] axes. (B) Corresponding proportion of rhodoliths under each of 10 finer shape categories as defined by Sneed and Folk (1958).
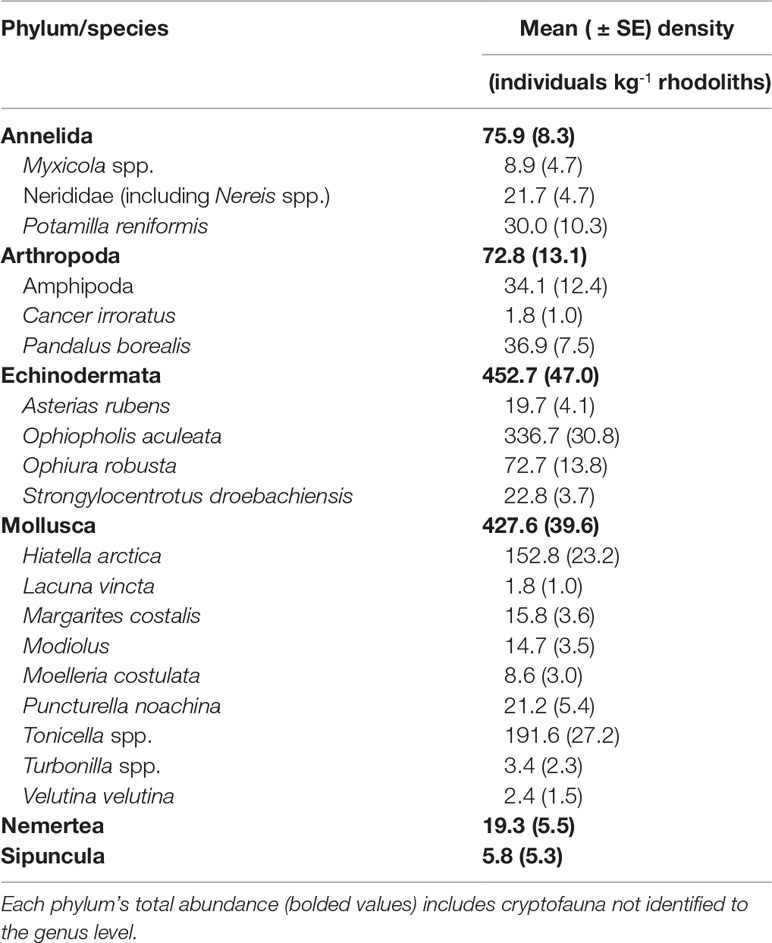
Table 1 Taxonomical breakdown and abundance of invertebrate cryptofauna associated with rhodoliths (Lithothamnion glaciale) collected in April 2017 at the South site (see Figure 1A).
3.2 Total Lipid Content and Lipid Classes
Of the nine food web components included in the lipid analysis, the three echinoderm species exhibited the highest concentrations of total lipids, ranging from 8.5 ± 2.2 mg g-1 (ww) in A. rubens, to 13.2 ± 3.7 mg g-1 in O. aculeata (Table 2). The molluscs H. arctica and Tonicella spp. had, respectively, similarly high and slightly lower concentrations of total lipids, with 6.7 ± 1.6 mg g-1 in Tonicella spp. (Table 2). The polychaete Nereis spp. exhibited the lowest concentration among animals, with 6.0 ± 1.9 mg g-1. Kelp (L. digitata), seston (from seawater samples), and sediment had significantly lower total lipid concentrations than O. aculeata (Tukey HSD, p<0.01 in all cases) (Table 2). The nine food web components contained nine lipid classes (PL, TAG, FFA, ST, AMPL, HC, SE, KET, and ALC), with six (PL, TAG, FFA, ST, AMPL, and HC) present in >50% of all samples (Table 2). PL was the dominant lipid class in every component, with a proportional contribution to total lipid concentration of 48% in O. aculeata to 76% in A. rubens (Table 2). Animal species contained the highest proportion of TAG, ST, and AMPL, with 34% in H. arctica, 19% in Nereis spp., and 16% in S. droebachiensis, respectively. FFA was highest (31%) in seston, lowest (2%) in A. rubens, and not detected (0%) in S. droebachiensis (Table 2). Kelp and seston contained no measurable TAG. Seston lipids were largely PL (50%), FFA (31%), ST (11%), and AMPL (12%). Sediment was dominated by PL (53%), followed by TAG (16%) and AMPL (13%). All components contained PL, ST, and AMPL. Overall, lipid class composition differed significantly among the nine food web components (PERMANOVA; Pseudo-F8,24 = 5.732, P (perm)=0.0003) and five functional groups (suspension/filter feeder, grazer, predator, kelp, and seawater/sediment) studied (PERMANOVA; Pseudo-F4,24= 3.504, P (perm)=0.0059). Specifically, lipid class composition differed between grazers and predators (t=2.485, p=0.018), and between suspension/filter feeders and predators (t=4.450, p=0.003). Total lipid concentration correlated with ST proportion only (r=-0.469, p=0.018, N=25).
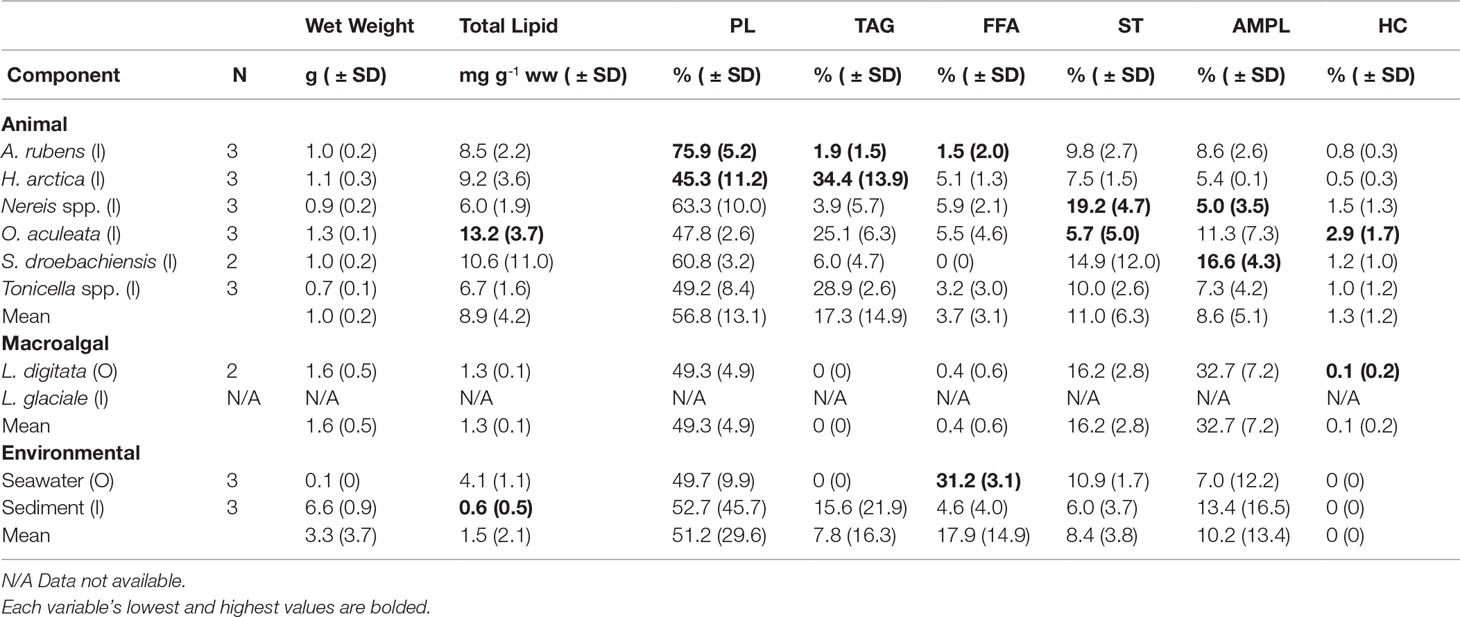
Table 2 Sample size (N), mean wet weight, mean total lipid, and mean proportion (%) of the six dominant lipid classes (PL, phospholipid; TAG, triacylglycerol; FFA, free fatty acid; ST, sterol; AMPL, acetone mobile polar lipid; and HC, hydrocarbon) in the six animal species (common sea star, Asterias rubens; wrinkled rock-borer, Hiatella arctica [bivalve]; Nereis spp. [polychaetes]; daisy brittle star, Ophiopholis aculeata; green sea urchin, Strongylocentrotus droebachiensis; and chitons, Tonicella spp.), two macroalgal species (Laminaria digitata [kelp] and Lithothamnion glaciale [rhodoliths]), and two environmental components (seawater and sediment) sampled inside (I) or outside (O) of the South site (see Figure 1A).
3.3 Fatty Acid Profiles
The nine food web components included in the FA analysis contained 63 FA, with 43 present in >50% of all samples. Each component exhibited a distinct set of dominant FAs and biomarkers (Table S.1 and Figure 4). With a proportional contribution to FA profiles ranging from 19% in H. arctica to 32% in A. rubens, EPA (eicosapentaenoic acid, 20:5ω3; a typical diatom biomarker) was the dominant FA within each of the six animal species sampled (Table S.1). ARA (arachidonic acid, 20:4ω6; a kelp and amphipod biomarker), palmitoleic acid (16:1ω7; a diatom biomarker), and palmitic acid (16:0; a flagellate, bacteria, and marine vegetation biomarker) were the next most prominent FA among the animals, with a contribution between 11% and 20% (Table S.1). Kelp contained mainly palmitic acid (18%), eicosatetraenoic acid (20:4ω3; 14%) and oleic acid (18:1ω9, 13%; a crustacean, detritus, dinoflagellate, and brown seaweed biomarker). Seston FA were largely oleic acid (33%), palmitic acid (22%), and stearic acid (18:0, 18%; a detritus biomarker). Sediment was dominated by palmitoleic acid (21%), palmitic acid (15%), and vaccenic acid (18:1ω7, 9%; an aerobic microorganism, bacteria, and vegetation biomarker) (Table S.1). Overall, FA composition differed significantly among the nine food web components (PERMANOVA, Pseudo-F8,24 = 26.278, P (perm)<0.001) and five functional groups studied (PERMANOVA, Pseudo-F4,24 = 7.6664, P (perm)=0.001), except kelp whose composition was similar to that of any of the four other functional groups.
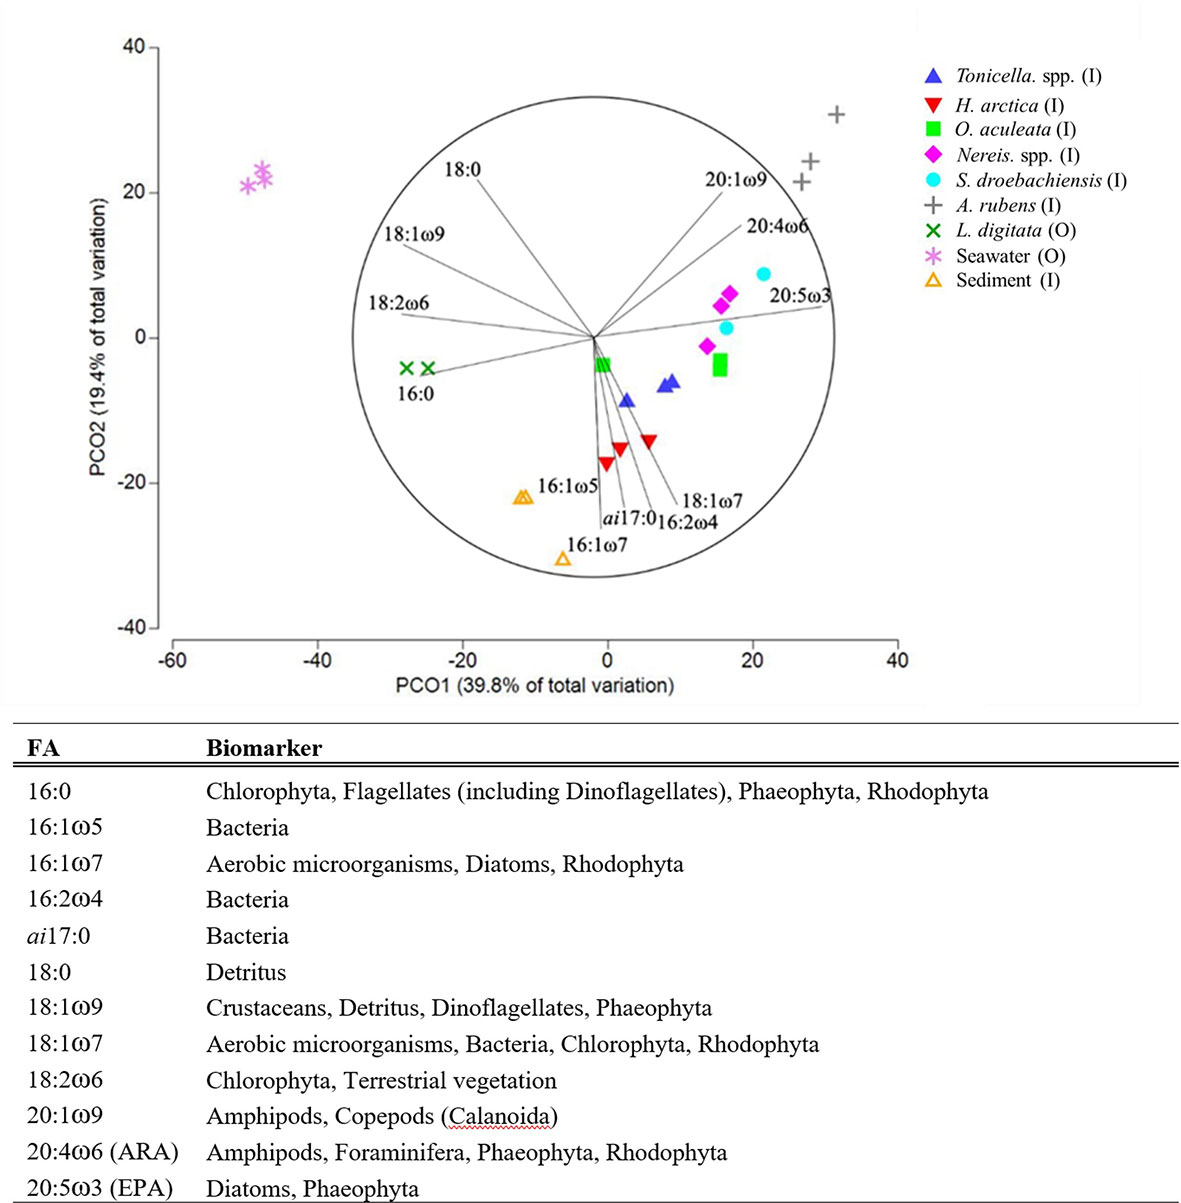
Figure 4 (A) PCO plot (based on Bray-Curtis similarity matrices) of the 12 fatty acids exhibiting at least 70% correlation in the six animal species, two macroalgal species, and two environmental components (see Table 1 for species list) sampled inside or outside of the South site (see Figure 1A). (B) Typical fatty-acid trophic biomarkers for those fatty acids included in the analysis (adapted from Parrish (2013) and Legeżyńska et al. (2014).
Of the three essential FAs (EPA, DHA [docosahexaenoic acid], and ARA), EPA was the most prevalent, present in all food web components except kelp and particularly abundant among the six animal species (Table S.1). ARA was in all components except seston, peaking in A. rubens (20%) and S. droebachiensis (15%) (Table S.1). Together, EPA and ARA contributed to 46% and 62% of the similarities in S. droebachiensis and A. rubens diets, respectively (Table B.1). DHA was present in all components except kelp, and was nevertheless less abundant than EPA and ARA, peaking at 9% in H. arctica (Table S.1).Animal and kelp FA profiles were generally dominated by polyunsaturated FA (PUFA), which ranged from 44% in Tonicella spp. to 65% in S. droebachiensis, and to a lesser extent by monounsaturated FA (MUFA), which varied from 17% in L. digitata and S. droebachiensis to 30% in Tonicella spp. (Table 3).
Animals and kelp contained lower levels of saturated FA (SFA), with lowest and highest proportions in respectively A. rubens (11%) and O. aculeata (27%) (Table 3). Conversely, seston and sediment contained more MUFA (37.9% and 42.5%, respectively) than PUFA (20.2% and 25.9%, respectively) (Table 3). SFA levels were higher in seston (41.6%) than sediment (24.2%) (Table 3). Animals exhibited the highest ratio of polyunsaturated to unsaturated FA (P/S; 3%), followed by kelp (2%), and seston and sediment (1%) (Table 3). All components, except for seawater, had a higher proportion of ω3 (omega-3) FAs than ω6 (omega-6). Animals and kelp contained about 3 times as many ω3 FAs (37.1% and 29.7%, respectively) than ω6 (11.9% and 10.5%, respectively) and sediment about twice as many ω3 FAs (13.0%) than ω6 (6.5%), while seston contained about half as many ω3 FAs (2.6%) than ω6 (5.3%) (Table 3). The DHA/EPA ratio was highest in seston (0.9), intermediate in sediment, A. rubens, H. arctica, and S. droebachiensis (0.1 to 0.5), low in Nereis spp., O. aculeata, and Tonicella spp. (0.02 to 0.03), and null (0) in kelp (Table 3).
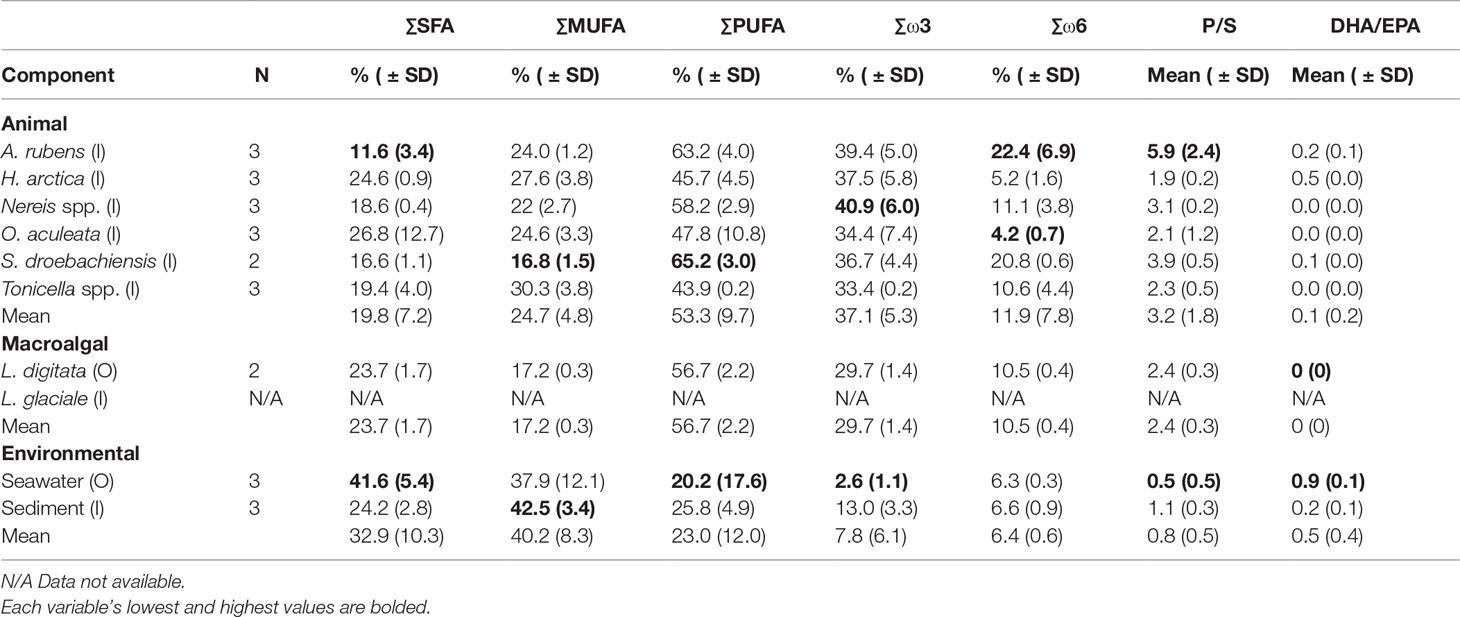
Table 3 Sample size (N), mean proportional sum (Σ) of saturated (SFA), monounsaturated (MUFA), polyunsaturated (PUFA), ω3 (omega-3), and ω6 (omega-6) fatty acids, and mean ratios of polyunsaturated:saturated (P/S) and DHA EPA (DHA/EPA), in the six animal species, two macroalgal species, and two environmental components (see Table 1 for species list) sampled inside (I) or outside (O) of the South site (see Figure 1A).
3.4 Stable Isotopes and Trophic Magnification
Stable carbon isotope ratio (δ13C) differed significantly among the ten food web components included in the carbon isotope analysis (PERMANOVA, Pseudo-F9,26 = 40.241, P (perm)<0.001), ranging from most depleted in seawater (-26.6‰) to least depleted in L. glaciale and A. rubens (-18.9‰) (Table 4). The δ15N values, which were lowest in L. digitata (3.4‰) and highest in A. rubens (11.0‰) (Table 4), also differed significantly among the nine food web components included (i.e. all components except Nereis spp.; PERMANOVA, Pseudo-F8,25 = 130.64, P (perm)<0.001), indicating distinct trophic levels (see below). Hierarchical clustering analysis of δ13C and δ15N separated the latter nine components in four distinct groups (PERMANOVA, Psuedo-F3,22 = 53.25, P (perm)<0.001; Figures 5 and S.1). Two of these groups each contained all samples of a single food web component, namely seston and L. digitata (kelp), hereafter termed respectively Group 1 and Group 4 (Figure 5). Group 3 contained three subgroups, each also containing all samples of a single food web component: sediment (Group 3a), L. glaciale (rhodolith, Group 3b), and H. arctica (Group 3c) (Figure 5). Group 2 had four subgroups, of which two were monospecific: A. rubens (Group 2a) and O. aculeata (Group 2d), and two each contained two species; A. rubens and Tonicella spp. (Group 2b) and S. droebachiensis and Tonicella spp. (Group 2c) (Figure 5). Group 1 (seston) had a significantly lower δ13C than all other groups (Tukey HSD, p<0.001), yet its δ15N was similar to that of Group 3 (infauna, L. glaciale, H. arctica) (Tukey HSD, p=0.779) (Figure 5). Group 2 (A. rubens, O. aculeata, Tonicella spp., and S. droebachiensis) had a significantly higher δ15N than Group 1, Group 3, and Group 4 (L. digitata) (Tukey HSD, p<0.001). Group 2’s δ13C was also significantly more enriched than that of Group 1 (Tukey HSD, p<0.001) and Group 3 (Tukey HSD, p=0.021), but not Group 4 (Tukey HSD, p<0.062). Group 4 had a significantly lower δ15N than all other groups (Tukey HSD, p<0.001) (Figure 5).
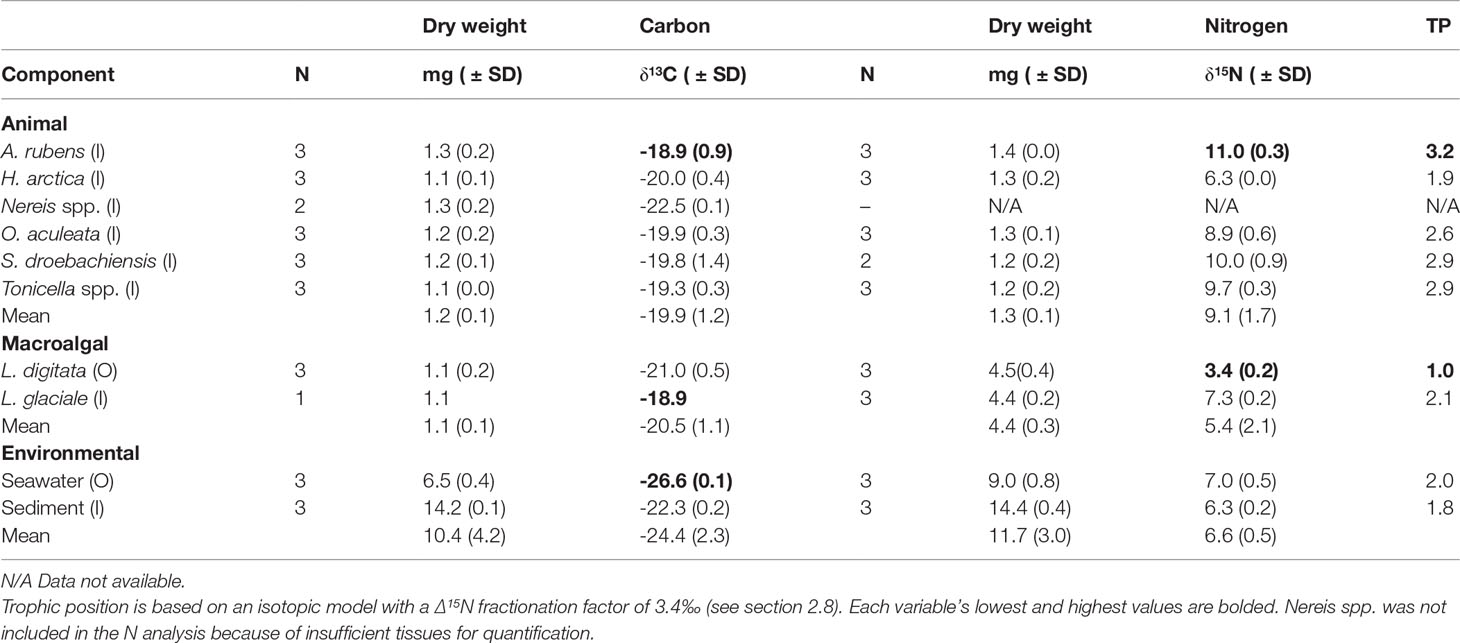
Table 4 Sample size (N), bulk stable isotope ratio (δ13C and δ15N; ‰), and relative trophic position (TP) in the six animal species, two macroalgal species, and two environmental components (see Table 1 for species list) sampled inside (I) or outside (O) of the South site (see Figure 1A).

Figure 5 Biplot of bulk carbon (δ13C) and nitrogen (δ15N) stable isotope ratios of five animal species, two macroalgal species, and two environmental components (see Table 1 for species list) sampled inside or outside of the South site (see Figure 1A). Nereis spp. was not included because of insufficient tissues for quantification in the N analysis. Components grouped (circled) based on agglomerative hierarchical cluster analysis (see Figure S.1).
At our assumed Δ15N fractionation factor of 3.4‰ (see section 2.8), the 10 food web components encompassed over three trophic positions (TP), with kelp (TP=1) and A. rubens (TP=3.2) at the base and top of the web, respectively (Table 4). Seston, sediment, rhodoliths (L. glaciale), and H. arctica occupied intermediate positions ranging from 1.8 to 2.1, whereas the three remaining animal species sampled had similarly high positions of 2.6 to 2.9 (Table 4). Thirty-seven (37) FAs correlated significantly with δ15N. Of those FAs, four (16:4ω3, 20:1ω11, 20:4ω6 [ARA], and 20:5ω3 [EPA]) exhibited a TMF > 1, and hence were biomagnified through trophic levels, whereas 33 had a TMF < 1, indicating biodilution (Table 5).
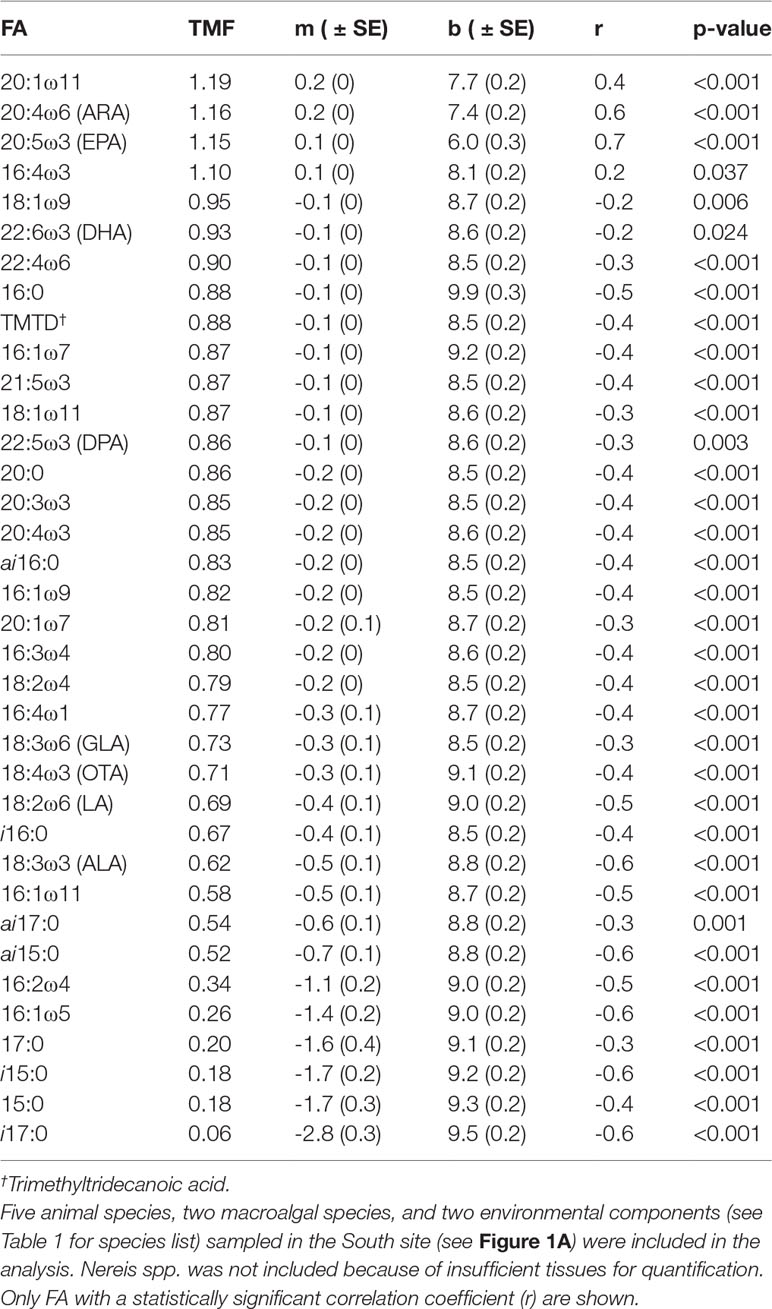
Table 5 Trophic multiplication factor (TMF) of 37 fatty acids (FA) as calculated from the slope (m) of corresponding linear relationship between FA concentration and bulk nitrogen (δ15N) stable isotope ratio (see section 2.8).
4 Discussion
Our study of the trophodynamics of a Newfoundland rhodolith bed is the first attempt to characterize nutritional patterns and trophic linkages of a rhodolith bed community with combined use of lipid, FA, and stable isotope analyses. Isotope-based rhodolith studies in the Northeast Atlantic (Grall et al., 2006) and California (Gabara, 2014) suggest macroalgae-based detritus are a key food source within rhodolith communities. Our comprehensive approach supported these findings, while showing that kelp may not be a significant food source among the 10 rhodolith bed components we considered. We identified three distinct trophic levels - producers, suspension/filter feeders and grazers, and predators - and discovered a potentially specific link between a macroalga-based diet and carbon source in mollusks and ophiuroids.
4.1 Rhodolith Community
Rhodolith communities vary globally in terms of numerically dominant cryptofauna, with gastropods dominating in the Maltese Islands (Sciberras et al., 2009), crustaceans in Santa Catalina Island (Gabara, 2014) and Ireland (de Grave and Whitaker, 1999), echinoderms and annelids in the Gulf of California (Foster et al., 2007), and polychaetes in South Australia (Harvey and Bird, 2008). In Newfoundland, chitons (Tonicella marmorea and T. rubra) and daisy brittle star (Ophiopholis aculeata) are the most common rhodolith epifauna (present study, Gagnon et al., 2012; Bélanger, 2020). The preponderance of chitons and daisy brittle stars at our study site, as well as overall species composition, aligned with the first detailed rhodolith bed biodiversity report from Newfoundland and Labrador (Gagnon et al., 2012). The consistency of chiton and brittle star abundances in conjunction with similar overall species composition in Newfoundland after over eight years, suggest high community stability within this bed. This notion is also supported by highly similar rhodolith morphological traits (shape and size) and biomass (19.5 kg m-2) between both studies (present study, Gagnon et al., 2012). In the present study, most observed rhodolith cryptofauna was juvenile-sized, supporting the view that rhodolith beds are nursery grounds for a number of marine invertebrates (Foster, 2001; Kamenos et al., 2004b; Steller and Cáceres-Martínez, 2009; Gagnon et al., 2012).
4.2 Lipid Content and Classes
Lipid structure can vary based on environmental conditions, food availability, metabolism, and reproductive strategies (Fraser, 1989; Lloret and Planes, 2003; Parzanini et al., 2018). Low temperatures affect organisms by inducing changes in cell membrane fluidity, structure, and function (Crockett, 1998; Parrish, 2013; Colombo et al., 2017). To accommodate cold temperatures, cold-water ectotherms exhibit homeoviscious adaptation, a process of reducing sterol molecules and lengthening and unsaturating phospholipids (Hazel et al., 1991) to change lipid structure (Hall et al., 2000; Copeman and Parrish, 2003; Parrish, 2009). In the present study, we showed that the lipid structure of all samples varied by component, with overall high proportions of phospholipids (45 – 76%) and unsaturated FAs (58 – 87%), low proportions of sterols (6 – 19%), and a correlation between total lipids and sterol proportions. These findings strongly suggest increased cell membrane fluidity, while supporting our hypothesis that the lipid composition of our study organisms generally reflects the predominantly cold-ocean conditions of Newfoundland (0.3°C in April in the present study).
Triacylglycerols are a key component of lipid structure and the primary energy storage molecules. They are important to organisms during stressful periods such as limited food availability or reproduction. High variability of TAG content among organisms can result from differences in allocation strategies (i.e. reproduction, growth, or survival) (Fraser, 1989; Lee et al., 2006; Parzanini et al., 2018). As such, elevated TAG levels in H. arctica (Lebour, 1938), Tonicella spp., and O. aculeata (Himmelman et al., 2008) likely correspond to an abundance of food (i.e. phytoplankton) or reproductive timing; organisms increase and maintain their energy storage as they prepare for the reproductive season (Vanderploeg et al., 1992). Given the timing of our study (during the April phytoplankton bloom), high levels of TAG in H. arctica (34%), Tonicella spp. (29%), and O. aculeata (25%) likely demonstrate this energy storage trend and potential benthic-pelagic coupling, utilizing phytoplankton from the water column in the benthos as it becomes seasonally available (Iken et al., 2001; Hacker Teper, 2022). However, low TAG levels and high PL and ST levels of predatory/omnivorous A. rubens (2%, 76%, 10%, respectively), Nereis spp. (4%, 63%, and 19%), and S. droebachiensis (6%, 61%, and 15%) probably link to organisms in search of food for rapid growth during harsh winter conditions (Luis and Passos, 1995; Lee Jr et al., 2006). Over prolonged periods, low TAG levels could indicate stress (Fraser, 1989).
While seemingly low, lipid content levels of animal samples (~1% g g-1 wet weight) were similar to those in other studies (Allen, 1968; Parzanini, 2018). In comparison to the animals, seston samples were mainly comprised of PL (50%) and FFA (31%), with no evidence of TAG (0%). This finding challenges previous reports of Newfoundland seston rich in AMPL and low in FFA (Parrish et al., 1995). Although rare, high levels of FFA could reflect degradation of lipids as a result of sewage runoff from St. Philip’s township (Parrish et al., 1992; Galois et al., 1996). Despite the unusual lipid profiles of our seston lipids, total lipid levels (~57 µg L-1) were comparable to samples collected from a nearby Newfoundland site in 1991 (Parrish et al., 1995), likely evidence of the annual phytoplankton bloom with fresh, lipid rich diatoms (Budge and Parrish, 1998; Kiriakoulakis et al., 2005; Parrish et al., 2005). A sample volume greater than the 3 L of seawater filtered likely would have helped lipid class analyses. We therefore recommend filtering at least 10 L of seawater for future studies. Total lipid content of L. digitata samples (~1.3 mg g-1 wet weight) were markedly lower than the wide range conveyed in the literature (~11 – 60 mg g-1) (Raven et al., 2002; Schaal et al., 2010). A small portion of this difference could be because of the different techniques employed; gravimetric assays are typically 10 to 15% higher than Iatroscan-derived lipids (Parrish, 2013). Such low lipid contents could also reflect chemical changes of L. digitata in response to sea-ice induced environmental changes. However, brown seaweeds in subarctic cold waters have significantly more total lipid than those in tropical warm waters (Terasaki et al., 2009; Nomura et al., 2013), and brown seaweeds increase their total lipids in winter and under low light conditions (Honya et al., 1994; Nelson et al., 2002; Nomura et al., 2013). This pattern suggests our noted low total lipid content in L. digitata could indicate issues with the extraction of L. digitata lipid.
54.3 Fatty Acids and Stable Isotopes
Higher levels of unsaturated FAs compared to saturated FAs typically result from cold-water conditions (Parrish, 2009). However, unlike lipid structure, which organisms solely regulate (Arts et al., 2009), FA composition also depends on diet, feeding strategy, and phylogeny (Dalsgaard et al., 2003; Makhutova et al., 2011). High levels of ω3 FAs eicosapentaenoic acid (EPA; 20:5ω3) and docosahexaenoic acid (DHA; 22:6ω3), and occasionally ω6 FA arachidonic acid (ARA; 20:4ω6), typically characterize the marine environment. Our results suggest that except for H. arctica (9%) and A. rubens (5%), only trace amounts of DHA occur within the Newfoundland rhodolith community. Hiatella arctica and A. rubens likely require more DHA because mollusks need it for growth (Wacker et al., 2002; Arts et al., 2009) and hatching in copepods (Arendt et al., 2005), which were abundant in the diet of A. rubens. The relatively high levels of DHA in H. arctica mirror findings of Copeman and Parrish (2003) who reported that bivalves conserve relatively higher levels of plankton-derived DHA, and lower ARA, than echinoderms. The enhanced trophic relationship (TMF > 1) between A. rubens and calanoid copepod-derived lipids such as 20:1ω9 and 20:1ω11 (TMF, 1.19), whether feeding directly or indirectly, follows the suggestion from Connelly et al. (2014) that organisms can maintain lipid-rich energy stores from copepod-derived lipids in the same way as from DHA. The trophic relationship also aligns with our diatom abundance findings because calanoids in Newfoundland also rely on a diatom-based diet in winter (Urban et al., 1992; Beaugrand et al., 2002). Based on its nitrogen (δ15N) signature (11.0) and TP (3.2), we identified A. rubens as the top consumer of the studied components in the rhodolith food web. While we cannot ascertain the sources of its diet, its similar FA composition to H. arctica, combined with the predatory lifestyle of A. rubens towards mollusks (Allen, 1983) suggests H. arctica may be a potential prey item.
Eicosapentaenoic acid was the most abundant FA in each of the six animals sampled (A. rubens, 32%; H. arctica, 19%; Nereis spp., 29%; O. aculeata, 27%; S. droebachiensis, 25%; and Tonicella spp., 22%), which suggests a compensatory role for DHA deficiency. High levels of essential FA typically reflect the dominant microalgal group (Dalsgaard et al., 2003); EPA levels are consistently high in diatom-dominated environments, whereas DHA prevails where dinoflagellates dominate. We conducted our study at the beginning of the spring phytoplankton bloom, so high concentrations of EPA (diatoms) might have overshadowed any presence of DHA, such as in H. arctica and A. rubens (Budge et al., 2001; Dalsgaard et al., 2003). As indicated by its prevalence in all diets, EPA has a high trophic magnification factor (TMF, 1.15). The biomagnification of EPA may confirm our hypothesis of a bottom-up food web in which most organisms rely on a shared resource (diatoms, EPA) passing from first order consumers onto second and third order consumers. The presence of diatom trophic biomarkers 16:0 and 16:1ω7 in sediment and in all animal diets, further points to diatoms as a major food source in this rhodolith community. Although synthesized biomarkers like 16:0 are less useful for understanding dietary intake than externally derived FAs like EPA, we recommend considering synthesized FA given their obvious accumulation in the present study (Wennberg et al., 2009). Interestingly, seston samples contained little EPA (1.2%) or 16:1ω7 (1.2%), but rather large proportions of 16:0 (21.7%; diatom and particulate macroalgae), 18:1ω9 (32.9%; zooplankton and particulate macroalgae), and 18:0 (18.2%; detrital) biomarkers (Wakeham and Canuel, 1988; Parrish, 2013; Legeżyńska, et al., 2014). This is in accordance with Bec et al. (2010) who concluded phytoplankton only explains 27% of the variance in seston. Because of our study site’s proximity to riverine input, some proportions of 18:1ω9 and 18:2ω6 (5.3%) could also be influenced by conifer pollen found in large quantities during spring (Masclaux et al., 2013; Lichti et al., 2017). Regardless, diatoms help support a rich infaunal community living underneath rhodoliths, which likely depends on deposition of organic material at the rhodolith-sediment interface (Steller et al., 2003; Grall et al., 2006; Berlandi et al., 2012). However, diatoms may provide more than just food to rhodolith beds, as per Steller and Cáceres-Martínez’s (2009) suggestion that diatom films on rhodoliths promote larval settlement of invertebrates (Morse et al., 1988; Daume et al., 1999; Huggett et al., 2006).
Although less abundant than EPA or DHA, at least some marine organisms also require ARA as an essential FA. ARA is particularly important for echinoderms (Copeman and Parrish, 2003) to regulate metabolic activities (Ciapa et al., 1995) and to maintain membrane structure and function (Parrish, 2009). In our study, ARA was highest in the echinoderms A. rubens (20%) and S. droebachiensis (15%). These high levels of ARA in sampled urchins were higher than those reported by Kelly et al. (2008) from both a coralline barren and kelp bed (Laminaria digitata). Laminaria digitata, a common food source for S. droebachiensis in eastern Canada, is typically rich in ARA (Fleurence et al., 1994; Schmid et al., 2014) and its low nitrogen (δ15N) signature (3.4) places it at the base of our food web (TP: 1.0). However, our kelp samples contained only 0.1% of ARA proportionally, making it an unlikely source of ARA across our food web. Nevertheless, high levels of a FA precursor to ARA, 18:2ω6 (9%), marked FA profiles of L. digitata. The ability of S. droebachiensis to synthesize ARA from 18:2ω6 complicates biomarker identification from algal FAs (Kelly et al., 2008). Combining FA analyses with stable isotope analyses can increase the resolution of organism diets. Thus, given some similarities of carbon (δ13C) signatures, S. droebachiensis (-19.8‰) may consume L. digitata (-21.0‰); however, δ13C signatures of L. digitata were degraded compared to literature (Raven et al., 2002; Schaal et al., 2010). Although we could not identify the dietary source of ARA among sampled components, we conclude amphipods represent a potential source of ARA in the rhodolith system because of both their high abundance in the rhodolith community and their typical ARA richness (Guerra-García et al., 2004). Given its biomagnification across diets (TMF, 1.16), ARA likely represents a key essential FA in the rhodolith food web and should be a focus of future studies.
Three potential photosynthetic carbon sources exist within a rhodolith bed: macroalgae (including the rhodoliths themselves), phytoplankton, and microphytobenthos (Grall et al., 2006). Similarly to S. droebachiensis, the (δ13C) signature (-19.3‰) of Tonicella spp. resembled that of rhodoliths (-18.9‰) and not kelp, suggesting that our focal grazing species feeds directly on coralline algae with little to no dietary input from kelp. Strongylocentrotus droebachiensis often leaves star-shaped tooth marks on rhodoliths (personal observations) and consumes coralline algae and microalgal films in coralline barrens, though limiting their bites to tips of rhodolith branches (Steneck, 1990; Scheibling et al., 1999; Lauzon-Guay and Scheibling, 2007). Tonicella spp. occurs in high abundance, often on the outside of rhodoliths. Although their bite marks are not as evident as those of S. droebachiensis, their articulating plates give them the unique ability to graze between rhodolith branches (Steneck, 1990). In addition to consuming corallines, these grazers can graze on diatom films on the surface of rhodoliths (James, 2000). Lipid concentrations were too low to confidently rely on our rhodolith lipid and FA results, therefore preventing comparisons with results for S. droebachiensis and Tonicella. spp. Contrary to Kelly et al. (2008) who sampled a blend of coralline algae taxa, our study is the first to explore lipids in a (presumably) single rhodolith species (L. glaciale). We were uncertain of the quantity of rhodolith material needed for our lipid analyses. We found that 3-5 g of rhodolith material yields negligible lipid concentrations. Based on our subsequent calculations and recent findings by Teed et al. (2020) that Newfoundland rhodoliths are 85% CaCO3 by weight (Teed et al., 2020), we recommend a minimum of 12-15 g of rhodolith material (organic and inorganic, combined) for future analyses. As mentioned above, δ13C signatures of L. digitata were lower than published accounts. We propose that sea ice contributed to carbon depletion in this species by causing bacterial degradation of kelp tissues or the production of new fronds on stored photosynthates containing little nutritional value, or by creating inadequate phytosynthetic conditions (Fredriksen, 2003; Vanderklift and Bearham, 2014). Furthermore, because δ15N signatures are influenced by light availability (Vanderklift and Bearham, 2014) and nutrient status (Gagné et al., 1982; Schaal et al., 2009), it is possible that sea ice also contributed to the unusually low δ15N signatures of L. digitata (3.4‰) (Raven et al., 2002; Schaal et al., 2010). This and the low total lipids in L. digitata require additional investigation.
Fatty acid profiles of H. arctica, O. aculeata, and Tonicella spp. were influenced by bacterial (16:2ω4 and i17:0) and red and green seaweed (18:1ω7) trophic biomarkers. δ15N signatures identified H. arctica (6.3‰) as a first order consumer and O. aculeata (9.0‰) and Tonicella spp. (9.7‰) as second order consumers. Though their trophic levels differed (TP, 1.9, 2.6, and 2.9, respectively), the similar δ13C signatures (-19.3 – -20.0‰) in the three species indicate similar carbon sources. In combining FA and stable isotope analyses, we identified similarities between the diets of non-predatory benthic organisms that suggest a resource partitioning relationship wherein animals consume different elements of the same foods (i.e. particulate algae, microphytobenthos, phytoplankton) at different times using different strategies (filter feeding, suspension feeding, and grazing, respectively), resulting in the effective use of the majority of the food source (Hines, 1982; Parrish et al., 2009). Accordingly, the feeding strategy of O. aculeata offers a possible explanation for the feeding relationship described above. Although brittle stars shared a nearly identical δ13C signature to H. arctica (-19.9‰ and -20.0‰, respectively), their stronger δ15N signature (9.0‰ versus 6.3‰, respectively) presumably originated from POM enrichment as POM settled on the seafloor (Iken et al., 2001). Therefore, O. aculeata likely consumes the same material as H. arctica, but as resuspended matter rather than through direct filter feeding, and thus benefits from the particulate leftover from H. arctica. Additionally, Tonicella spp. may graze on larger particulate material inaccessible to O. aculeata, potentially breaking it down into smaller pieces for consumption by O. aculeata. Indeed O. aculeata utilizes several different suspension feeding mechanisms to collect from the water column enriched, resuspended benthic particles (Labarbera, 1978). The species may therefore enhance benthic-pelagic coupling in transferring organic material from the pelagic zone to the benthos (Guerra-García et al., 2004). Our findings corroborate Grall et al.’s (2006) demonstration that rhodolith beds comprise both pelagic (Herman et al., 2000) and benthic, algae-based feeding relationships (Takai et al., 2004).
4.4 Conclusion and Future Research Directions
Our study supports the hypotheses that (1) the lipid composition of rhodolith cryptofauna generally reflects the predominantly cold-ocean conditions of Newfoundland; and (2) the rhodolith bed food web is mainly controlled from the bottom up by planktivores and detritivores as reflected by high abundance of planktonic and bacterial biomarkers. Our lipid and FA analyses revealed high levels of phospholipids and unsaturated FAs combined with low sterols in all animal species, suggesting adaptability for enhanced cell membrane fluidity in a cold-water environment. Our FA and stable isotope analyses showed that many taxa in the rhodolith community rely on a shared resource: diatoms. We also unveiled potential resource partitioning between first- (H. arctica) and second- (O. aculeata and Tonicella spp.) order consumers, whereby differences in feeding strategies enable utilization of specific components of the same organic and inorganic material.
Our study documents, for the first time, the specific diets of, and feeding relationships among, dominant animal taxa in a cold-ocean, Newfoundland rhodolith bed. The complexity of feeding relationships in benthic systems (Kharlamenko et al., 2001; Pitt et al., 2009; Kelly and Scheibling, 2012), temporal variability of benthic-pelagic coupling (Iken et al., 2001; Hacker Teper, 2022), and uncertainty in the amount of sample material required for some bed components (seawater and L. glaciale), limited the ability to decipher all possible linkages among and above the ten rhodolith bed components included in the present study. Future studies of rhodolith bed trophydynamics should use the aformentioned minimal sampling material requirements. We also recommend expanding the breadth of focal species to include, for example, pelagic organisms such as amphipods and copepods (Guerra-García et al., 2004; Pakhomov et al., 2004). The unknown contribution to trophodynamics of sediment and associated infauna underlying rhodoliths should be explored, particularly that of bacteria and microbes and their production of FAs (e.g. 16:0, 16:1ω7, and 18:1ω7) (Fullarton et al., 1995). The present study provides a snapshot of the feeding relationships in a subartcic rhodolith bed. A companion study at our study site suggests the feeding relationships reported in the present study are spatially and temporally stable with no appreciable intra annual changes outside of the spring phytoplankton bloom (Hacker Teper, 2022). Similar studies with broader spatial and temporal coverage would help further understand the diversity and stability of these relationships in rhodolith communities.
Data Availability Statement
The original contributions presented in the study are included in the article/Supplementary Material. Inquiries can be directed to the corresponding author.
Author Contributions
SHT: Conceptualization, Methodology, Software, Validation, Formal analysis, Investigation, Field Work, Data curation, Writing - original draft, Visualization, Project administration. CP: Conceptualization, Methodology, Investigation, Resources, Writing - original draft, Supervision, Project administration, Funding acquisition. PG: Conceptualization, Methodology, Investigation, Field work, Resources, Writing - original draft, Supervision, Project administration, Funding acquisition.
Funding
This research was funded by the Natural Sciences and Engineering Research Council of Canada (NSERC Discovery Grants to C. Parrish: RGPIN-2017-04639 and 16940: RGPIN-2015-05343), the Canada Foundation for Innovation (Leaders Opportunity Fund Grant to 16940), and the Research & Development Corporation of Newfoundland and Labrador (Ignite R&D Grant to 5003.070.002).
Conflict of Interest
The authors declare that the research was conducted in the absence of any commercial or financial relationships that could be construed as a potential conflict of interest.
Publisher’s Note
All claims expressed in this article are solely those of the authors and do not necessarily represent those of their affiliated organizations, or those of the publisher, the editors and the reviewers. Any product that may be evaluated in this article, or claim that may be made by its manufacturer, is not guaranteed or endorsed by the publisher.
Acknowledgments
We are grateful to Jeanette Wells and Alison Pye for assistance with laboratory work, David Bélanger, Anne Provencher St-Pierre, Samantha Trueman, and the Ocean Sciences Centre Field Services Unit for assistance with field work, and Paul Snelgrove for providing access to CTD equipment. We also thank Paul Snelgrove, Suzanne Dufour, and two anonymous reviewers for constructive comments that helped improve the manuscript.
Supplementary Material
The Supplementary Material for this article can be found online at: https://www.frontiersin.org/articles/10.3389/fmars.2022.899812/full#supplementary-material
References
Allen W. (1968). Fatty-Acid Synthesis in the Echinoderms: Asterias Rubens, Echinus Esculentus and Holothuria Forskali. J. Mar. Biol. Assoc. Unit. Kingd. 48, 521–533. doi: 10.1017/S0025315400034640
Allen P. L. (1983). Feeding Behaviour of Asterias Rubens (L.) on Soft Bottom Bivalves: A Study in Selective Predation. J. Exp. Mar. Biol. Ecol. 70, 79–90. doi: 10.1016/0022-0981(83)90150-8
Amado-Filho G. M., Moura R. L., Bastos A. C., Salgado L. T., Sumida P. Y., Guth A. Z., et al. (2012). Rhodolith Beds are Major CaCO3 Bio-Factories in the Tropical South West Atlantic. PLoS One 7, e35171. doi: 10.1371/journal.pone.0035171
Arendt K. E., Jónasdóttir S. H., Hansen P. J., Gärtner S. (2005). Effects of Dietary Fatty Acids on the Reproductive Success of the Calanoid Copepod Temora Longicornis. Mar. Biol. 146, 513–530. doi: 10.1007/s00227-004-1457-9
Arnold C. L., Bélanger D., Gagnon P. (2021). Growth Resilience of Subarctic Rhodoliths (Lithothamnion Glaciale, Rhodophyta) to Chronic Low Sea Temperature and Irradiance. J. Phycol. 251–266. doi: 10.1111/jpy.13231
Arts M. T., Brett M. T., Kainz M. J. (2009). Lipids in Aquatic Ecosystems. Lipids Aquat. Ecosyst., xv–xx. doi: 10.1007/978-0-387-89366-2
Historical Data - Climate - Environment and Climate Change Canada. Available at: https://climate.weather.gc.ca/historical_data/search_historic_data_e.html (Accessed September 19, 2019).
Beaugrand G., Ibañez F., Lindley J. A., Reid P. C. (2002). Diversity of Calanoid Copepods in the North Atlantic and Adjacent Seas: Species Associations and Biogeography. Mar. Ecol. Prog. Ser. 232, 179–195. doi: 10.3354/meps232179
Bec A., Perga M., Desvilettes C., Bourdier G. (2010). How Well can the Fatty Acid Content of Lake Seston be Predicted From its Taxonomic Composition? Freshw. Biol. 55, 1958–1972. doi: 10.1111/j.1365-2427.2010.02429.x
Bélanger D. (2020). Growth Controls of Rhodoliths (Lithothamnion Glaciale) and Relationships Between Structural Complexity and Macrofaunal Diversity in Subarctic Rhodolith Beds. doi: 10.48336/kfbg-f772
Bélanger D., Gagnon P. (2020). Low Growth Resilience of Subarctic Rhodoliths (Lithothamnion Glaciale) to Coastal Eutrophication. Mar. Ecol. Prog. Ser. 642, 117–132. doi: 10.3354/meps13312
Bélanger D., Gagnon P. (2021). High Growth Resilience of Subarctic Rhodoliths (Lithothamnion Glaciale) to Ocean Warming and Chronic Low Irradiance. Mar. Ecol. Prog. Ser. 663, 77–97. doi: 10.3354/meps13647
Berlandi R. M., de O. Figueiredo M. A., Paiva P. C. (2012). Rhodolith Morphology and the Diversity of Polychaetes Off the Southeastern Brazilian Coast. J. Coast. Res. 28, 280–287. doi: 10.2112/11T-00002.1
Borgå K., Kidd K. A., Muir D. C. G., Berglund O., Conder J. M., Gobas F. A. P. C., et al. (2012). Trophic Magnification Factors: Considerations of Ecology, Ecosystems, and Study Design. Integr. Environ. Assess. Manage. 8, 64–84. doi: 10.1002/ieam.244
Bouillon S., Connolly R. M., Gillikin D. P. (2011). 7.07 Use of Stable Isotopes to Understand Food Webs and Ecosystem Functioning in Estuaries. Treat. Estuar. Coast. Sci. 7. doi: 10.1016/B978-0-12-374711-2.00711-7
Budge S. M., Iverson S. J., Koopman H. N. (2006). Studying Trophic Ecology in Marine Ecosystems Using Fatty Acids: A Primer on Analysis and Interpretation. Mar. Mamm. Sci. 22, 759–801. doi: 10.1111/j.1748-7692.2006.00079.x
Budge S. M., Parrish C. C. (1998). Lipid Biogeochemistry of Plankton, Settling Matter and Sediments in Trinity Bay, Newfoundland. II. Fatty Acids. Org. Geochem. 29, 1547–1559. doi: 10.1016/S0146-6380(98)00177-6
Budge S. M., Parrish C. C., Mckenzie C. H. (2001). Fatty Acid Composition of Phytoplankton, Settling Particulate Matter and Sediments at a Sheltered Bivalve Aquaculture Site. Mar. Chem. 76, 285–303. doi: 10.1016/S0304-4203(01)00068-8
Cabana G., Rasmussen J. B. (1996). Comparison of Aquatic Food Chains Using Nitrogen Isotopes. Proc. Natl. Acad. Sci. 93, 10844–10847. doi: 10.1073/pnas.93.20.10844
Carreón-Palau L., Parrish C. C., del Angel-Rodríguez J. A., Pérez-España H., Aguiñiga-García S. (2013). Revealing Organic Carbon Sources Fueling a Coral Reef Food Web in the Gulf of Mexico Using Stable Isotopes and Fatty Acids. Limnol. Oceanogr. 58, 593–612. doi: 10.4319/lo.2013.58.2.0593
Carreón-Palau L., Parrish C. C., Pérez-España H. (2017). Urban Sewage Lipids in the Suspended Particulate Matter of a Coral Reef Under River Influence in the South West Gulf of Mexico. Water Res. 123, 192–205. doi: 10.1016/j.watres.2017.06.061
Christie W. W. (1982). A Simple Procedure for Rapid Transmethylation of Glycerolipids and Cholesteryl Esters. J. Lipid Res. 23, 1072–1075. doi: 10.1016/S0022-2275(20)38081-0
Christie W. W. (1989). Gas Chromatographic Analysis of Fatty Acid Derivatives. Gas. Chromatogr. Lipid.: Pract. Guid., 85–128. doi: 10.1533/9780857097866.159
Ciapa B., Allemand D., de Renzis G. (1995). Effect of Arachidonic Acid on Na+/H+ Exchange and Neutral Amino Acid Transport in Sea Urchin Eggs. Exp. Cell Res. 218, 248–254. doi: 10.1006/excr.1995.1153
Clarke K. R., Somerfield P. J., Chapman M. G. (2006). On Resemblance Measures for Ecological Studies, Including Taxonomic Dissimilarities and a Zero-Adjusted Bray–Curtis Coefficient for Denuded Assemblages. J. Exp. Mar. Biol. Ecol. 330, 55–80. doi: 10.1016/j.jembe.2005.12.017
Colombo S. M., Wacker A., Parrish C. C., Kainz M. J., Arts M. T. (2017). A Fundamental Dichotomy in Long-Chain Polyunsaturated Fatty Acid Abundance Between and Within Marine and Terrestrial Ecosystems. Environ. Rev. 25, 163–174. doi: 10.1139/er-2016-0062
Connelly T. L., Deibel D., Parrish C. C. (2014). Trophic Interactions in the Benthic Boundary Layer of the Beaufort Sea Shelf, Arctic Ocean: Combining Bulk Stable Isotope and Fatty Acid Signatures. Prog. Oceanogr. 120, 79–92. doi: 10.1016/j.pocean.2013.07.032
Copeman L. A., Parrish C. C. (2003). Marine Lipids in a Cold Coastal Ecosystem: Gilbert Bay, Labrador. Mar. Biol. 143, 1213–1227. doi: 10.1007/s00227-003-1156-y
Crockett E. L. (1998). Cholesterol Function in Plasma Membranes From Ectotherms: Membrane-Specific Roles in Adaptation to Temperature. Am. Zool. 38, 291–304. doi: 10.1093/icb/38.2.291
Dalsgaard J., St. John M., Kattner G., Müller-Navarra D., Hagen W. (2003). Fatty Acid Trophic Markers in the Pelagic Marine Environment. Adv. Mar. Biol. 46, 225–340. doi: 10.1016/S0065-2881(03)46005-7
Daume S., Brand-Gardner S., Woelkerling W. J. (1999). Settlement of Abalone Larvae (Haliotis Laevigata Donovan) in Response to non-Geniculate Coralline Red Algae (Corallinales, Rhodophyta). J. Exper. Mar. Biol. Ecol. 234, 125–143. doi: 10.1016/S0022-0981(98)00143-9
de Grave S., Whitaker A. (1999). A Census of Maërl Beds in Irish Waters. Aquat. Conserv. Mar. Freshw. Ecosyst. 9, 303–311. doi: 10.1002/(SICI)1099-0755(199905/06)9:3<303::AID-AQC350>3.0.CO;2-3
DeNiro M. J., Epstein S. (1978). Influence of Diet on the Distribution of Carbon Isotopes in Animals. Geochim. Cosmochim. 42, 495–506. doi: 10.1016/0016-7037(78)90199-0
DeNiro M. J., Epstein S. (1981). Influence of Diet on the Distribution of Nitrogen Isotopes in Animals. Geochim. Cosmochim. 45, 341–351. doi: 10.1016/0016-7037(81)90244-1
Drazen J. C., Phleger C. F., Guest M. A., Nichols P. D. (2008a). Lipid, Sterols and Fatty Acid Composition of Abyssal Holothurians and Ophiuroids From the North-East Pacific Ocean: Food Web Implications. Comp. Biochem. Physiol. Part B. Biochem. Mol. Biol. 151, 79–87. doi: 10.1016/j.cbpb.2008.05.013
Drazen J. C., Phleger C. F., Guest M. A., Nichols P. D. (2008b). Lipid, Sterols and Fatty Acids of Abyssal Polychaetes, Crustaceans, and a Cnidarian From the Northeast Pacific Ocean: Food Web Implications. Mar. Ecol. Prog. Ser. 372, 157–167. doi: 10.3354/meps07707
Drazen J. C., Phleger C. F., Guest M. A., Nichols P. D. (2009). Lipid Composition and Diet Inferences in Abyssal Macrourids of the Eastern North Pacific. Mar. Ecol. Prog. Ser. 387, 1–14. doi: 10.3354/meps08106
Fleurence J., Gutbier G., Mabeau S., Leray C. (1994). Fatty Acids From 11 Marine Macroalgae of the French Brittany Coast. J. @ Appl. Phycol. 6, 527–532. doi: 10.1007/BF02182406
Folch J., Lees M., Sloane Stanley G. H. (1957). A Simple Method for the Isolation and Purification of Total Lipides From Animal Tissues. J. Biol. Chem. 226, 497–509. doi: 10.1016/S0021-9258(18)64849-5
Foster M. S. (2001). Rhodoliths: Between Rocks and Soft Places. J. Phycol. 37, 659–667. doi: 10.1046/j.1529-8817.2001.00195.x
Foster M. S., McConnico L. C., Lundsten L., Wadsworth T., Kimball T., Brooks L. B., et al. (2007). Diversity and Natural History of a Lithothamnion Muelleri-Sargassum Horridum Community in the Gulf of California. Cienc. Mar. 33, 367–384. doi: 10.7773/cm.v33i4.1174
Fraser A. J. (1989). Triacylglycerol Content as a Condition Index for Fish, Bivalve, and Crustacean Larvae. Can. J. Fish. Aquat. Sci. 46, 1868–1873. doi: 10.1139/f89-235
Fredriksen S. (2003). Food Web Studies in a Norwegian Kelp Forest Based on Stable Isotope (δ13c and δ15n) Analysis. Mar. Ecol. Prog. Ser. 260, 71–81. doi: 10.3354/meps260071
Fullarton J. G., Dando P. R., Sargent J. R., Southwards A. J., Southward E. C. (1995). Fatty Acids of Hydrothermal Vent Ridgeia Piscesae and Inshore Bivalves Containing Symbiotic Bacteria. J. Mar. Biol. Assoc. Unit. Kingd. 75, 455–468. doi: 10.1017/S0025315400018300
Gabara S. S. (2014). Community Structure and Energy Flow Within Rhodolith Habitats at Santa Catalina Island, Ca. San Jose, CA: San Jose State University. doi: 10.31979/etd.eykc-3wp5
Gagné J. A., Mann K. H., Chapman A. R. O. (1982). Seasonal Patterns of Growth and Storage in Laminaria Longicruris in Relation to Differing Patterns of Availability of Nitrogen in the Water. Mar. Biol. 69, 91–101. doi: 10.1007/BF00396965
Gagnon P., Matheson K., Stapleton M. (2012). Variation in Rhodolith Morphology and Biogenic Potential of Newly Discovered Rhodolith Beds in Newfoundland and Labrador (Canada). Bot. Mar. 55, 85–99. doi: 10.1515/bot-2011-0064
Gale K. S. P., Hamel J.-F., Mercier A. (2013). Trophic Ecology of Deep-Sea Asteroidea (Echinodermata) From Eastern Canada. Deep. Sea. Res. Part I.: Oceanogr. Res. Pap. 80, 25–36. doi: 10.1016/j.dsr.2013.05.016
Galois R., Richard P., Fricourt B. (1996). Seasonal Variations in Suspended Particulate Matter in the Marennes-Oleron Bay, France, Using Lipids as Biomarkers. Estuar. Coast. Shelf. Sci. 43, 335–357. doi: 10.1006/ecss.1996.0074
Graham D. J., Midgley N. G. (2000). Graphical Representation of Particle Shape Using Triangular Diagrams: An Excel Spreadsheet Method. Earth Surf. Proc. Landf. 25, 1473–1477. doi: 10.1002/1096-9837(200012)25:13<1473::AID-ESP158>3.0.CO;2-C
Grall J., Leloch F., Guyonnet B., Riera P. (2006). Community Structure and Food Web Based on Stable Isotopes (δ15n and δ13c) Analysis of a North Eastern Atlantic Maërl Bed. J. Exp. Mar. Bio. Ecol. 338, 1–15. doi: 10.1016/j.jembe.2006.06.013
Guerra-García J. M., Martínez-Pita I., Pita M. L. (2004). Fatty Acid Composition of the Caprellidea (Crustacea: Amphipoda) From the Strait of Gibraltar. Sci. Mar. 68, 501–510. doi: 10.3989/scimar.2004.68n4501
Guest M. A., Nichols P. D., Frusher S. D., Hirst A. J. (2008). Evidence of Abalone (Haliotis Rubra) Diet From Combined Fatty Acid and Stable Isotope Analyses. Mar. Biol. 153, 579–588. doi: 10.1007/s00227-007-0831-9
Hacker Teper S. M. (2022). Assessing Trophodynamics of a Newfoundland Rhodolith (Lithothamnion Glaciale) Bed Using Lipid, Fatty Acid, and Stable Isotope Analyses. doi: 10.48336/20A6-SE49
Hair J. F., Black W. C., Babin B. J., Anderson R. E., Tatham R. (2006). “Multivariate Data Analysis,” in Uppersaddle River (NJ: Pearson Education).
Hall J. M., Parrish C. C., Thompson R. J. (2000). Importance of Unsaturated Fatty Acids in Regulating Bivalve and Finfish Membrane Fluidity in Response to Changes in Environmental Temperature. Seaf. Heal. Nutr. Sci. Publ. St. John’s Canad. 435–448.
Hamilton S. (1992). Extraction of Lipids and Derivative Formation. Lipid Analys. Pract. Approach., 13–64.
Harvey A. S., Bird F. L. (2008). Community Structure of a Rhodolith Bed From Cold-Temperate Waters (Southern Australia). Aust. J. Bot. 56, 437–450. doi: 10.1071/BT07186
Harvey A. S., Harvey R. M., Merton E. (2017). The Distribution, Significance and Vulnerability of Australian Rhodolith Beds: A Review. Mar. Freshw. Res. 68, 411–428. doi: 10.1071/MF15434
Hazel J. R., Williams E. E., Livermore R., Mozingo N. (1991). Thermal Adaptation in Biological Membranes: Functional Significance of Changes in Phospholipid Molecular Species Composition. Lipids 26, 277–282. doi: 10.1007/BF02537137
Herman P. M. J., Middelburg J. J., Widdows J., Lucas C. H., Heip C. H. R. (2000). Stable Isotopes as Trophic Tracers: Combining Field Sampling and Manipulative Labelling of Food Resources for Macrobenthos. Mar. Ecol. Prog. Ser. 204, 79–92. doi: 10.3354/meps204079
Himmelman J. H., Dumont C. P., Gaymer C. F., Vallières C., Drolet D. (2008). Spawning Synchrony and Aggregative Behaviour of Cold-Water Echinoderms During Multi-Species Mass Spawnings. Mar. Ecol. Prog. Ser. 361, 161–168. doi: 10.3354/meps07415
Hines A. H. (1982). Coexistence in a kelp forest: size, population dynamics, and resource partitioning in a guild of spider crabs (Brachyura, Majidae). Ecolog. Monog. 52, 179–198. doi: 10.2307/1942610
Hinojosa-Arango G., Maggs C. A., Johnson M. P. (2009). Like a Rolling Stone: The Mobility of Maërl (Corallinaceae) and the Neutrality of the Associated Assemblages. Ecology 90, 517–528. doi: 10.1890/07-2110.1
Honya M., Kinoshita T., Ishikawa M., Mori H., Nisizawa K. (1994). Seasonal Variation in the Lipid Content of Cultured Laminaria Japonica: Fatty Acids, Sterols, β-Carotene and Tocopherol. J. Appl. Phycol. 6, 25–29. doi: 10.1007/BF02185900
Huggett M. J., Williamson J. E., de Nys R., Kjelleberg S., Steinberg P. D. (2006). Larval Settlement of the Common Australian Sea Urchin Heliocidaris Erythrogramma in Response to Bacteria From the Surface of Coralline Algae. Oecologia 149, 604–619. doi: 10.1007/s00442-006-0470-8
Iken K., Brey T., Wand U., Voigt J., Junghans P. (2001). Food Web Structure of the Benthic Community at the Porcupine Abyssal Plain (NE Atlantic): A Stable Isotope Analysis. Prog. Oceanogr. 50, 383–405. doi: 10.1016/S0079-6611(01)00062-3
James D. W. (2000). Diet, Movement, and Covering Behavior of the Sea Urchin Toxopneustes Roseus in Rhodolith Beds in the Gulf of California, México. Mar. Biol. 137, 913–923. doi: 10.1007/s002270000423
Kamenos N. A., Moore P. G., Hall-Spencer J. M. (2004a). Attachment of the Juvenile Queen Scallop (Aequipecten Opercularis (L.)) to Maërl in Mesocosm Conditions; Juvenile Habitat Selection. J. Exp. Mar. Biol. Ecol. 306, 139–155. doi: 10.1016/j.jembe.2003.10.013
Kamenos N. A., Moore P. G., Hall-Spencer J. M. (2004b). Nursery-Area Function of Maërl Grounds for Juvenile Queen Scallops Aequipecten Opercularis and Other Invertebrates. Mar. Ecol. Prog. Ser. 274, 183–189. doi: 10.3354/meps274183
Kelly J. R., Scheibling R. E. (2012). Fatty Acids as Dietary Tracers in Benthic Food Webs. Mar. Ecol. Prog. Ser. 446, 1–22. doi: 10.3354/meps09559
Kelly J. R., Scheibling R. E., Iverson S. J., Gagnon P. (2008). Fatty Acid Profiles in the Gonads of the Sea Urchin Strongylocentrotus Droebachiensis on Natural Algal Diets. Mar. Ecol. Prog. Ser. 373, 1–9. doi: 10.3354/meps07746
Kiriakoulakis K., Fisher E., Wolff G.A., Freiwald A., Grehan A., Roberts J.M. (2005). Lipids and nitrogen isotopes of two deep-water corals from the North-East Atlantic: initial results and implications for their nutrition. Cold-Water Corals and Ecosystems, 715–729. doi: 10.1007/3-540-27673-4_37
Kharlamenko V. I., Kiyashko S. I., Imbs A. B., Vyshkvartzev D. I. (2001). Identification of Food Sources of Invertebrates From the Seagrass Zostera Marina Community Using Carbon and Sulfur Stable Isotope Ratio and Fatty Acid Analyses. Mar. Ecol. Prog. Ser. 220, 103–117. doi: 10.3354/meps220103
Labarbera M. (1978). Particle Capture by a Pacific Brittle Star: Experimental Test of the Aerosol Suspension Feeding Model. Science 201, 1147–1149. doi: 10.1126/science.201.4361.1147
Lauzon-Guay J.-S., Scheibling R. E. (2007). Seasonal Variation in Movement, Aggregation and Destructive Grazing of the Green Sea Urchin (Strongylocentrotus Droebachiensis) in Relation to Wave Action and Sea Temperature. Mar. Biol. 151, 2109–2118. doi: 10.1007/s00227-007-0668-2
Lebour M. (1938). Notes on the Breeding of Some Lamellibranchs From Plymouth and Their Larvae. J. Mar. Biol. Assoc. Unit. Kingd. 23, 119–144. doi: 10.1017/S002531540005400X
Lee J. R.E., Damodaran K., Yi S.-X., Lorigan G. A. (2006). Rapid Cold-Hardening Increases Membrane Fluidity and Cold Tolerance of Insect Cells. Cryobiology 52, 459–463. doi: 10.1016/j.cryobiol.2006.03.003
Lee R. F., Hagen W., Kattner G. (2006). Lipid Storage in Marine Zooplankton. Mar. Ecol. Prog. Ser. 307, 273–306. doi: 10.3354/meps307273
Legeżyńska J., Kędra M., Walkusz W. (2014). Identifying Trophic Relationships Within the High Arctic Benthic Community: How Much can Fatty Acids Tell? Mar. Biol. 161,821–836 doi: 10.1007/s00227-013-2380-8
Lichti D. A., Rinchard J., Kimmel D. G. (2017). Changes in Zooplankton Community, and Seston and Zooplankton Fatty Acid Profiles at the Freshwater/Saltwater Interface of the Chowan River, North Carolina. PeerJ 5, e3667. doi: 10.7717/peerj.3667
Linnebjerg J. F., Hobson K. A., Fort J., Nielsen T. G., Møller P., Wieland K., et al. (2016). Deciphering the Structure of the West Greenland Marine Food Web Using Stable Isotopes (δ13c, δ15n). Mar. Biol. 163, 230. doi: 10.1007/s00227-016-3001-0
Lloret J., Planes S. (2003). Condition, Feeding and Reproductive Potential of White Seabream Diplodus Sargus as Indicators of Habitat Quality and the Effect of Reserve Protection in the Northwestern Mediterranean. Mar. Ecol. Prog. Ser. 248, 197–208. doi: 10.3354/meps248197
Luis O. J., Passos A. M. (1995). Seasonal Changes in Lipid Content and Composition of the Polychaete Nereis (Hediste) Diversicolor. Comp. Biochem. Physiol. Part B. Biochem. Mol. Biol. 111, 579–586. doi: 10.1016/0305-0491(95)00029-8
Macdonald T. A., Burd B. J., Macdonald V. I., van Roodselaar A. (2010). “Taxonomic and Feeding Guild Classification for the Marine Benthic Macroinvertebrates of the Strait of Georgia, British Columbia,” in Fisheries and Oceans Canada= Pêches Et Océans Canada. Sidney, B.C.: Canadian Technical Report of Fisheries and Aquatic Sciences 2874.
Makhutova O. N., Sushchik N. N., Gladyshev M. I., Ageev A., Pryanichnikova E. G., Kalachova G. S. (2011). Is the Fatty Acid Composition of Freshwater Zoobenthic Invertebrates Controlled by Phylogenetic or Trophic Factors? Lipids 46, 709–721. doi: 10.1007/s11745-011-3566-9
Marrack E. C. (1999). The Relationship Between Water Motion and Living Rhodolith Beds in the Southwestern Gulf of California, Mexico. Palaios 14, 159–171. doi: 10.2307/3515371
Masclaux H., Perga M.-E., Kagami M., Desvilettes C., Bourdier G., Bec A. (2013). How Pollen Organic Matter Enters Freshwater Food Webs. Limnol. Oceanogr. 58, 1185–1195. doi: 10.4319/lo.2013.58.4.1185
Michener M. (1994). Stable Isotope Ratios as Tracers in Marine Aquatic Food Webs. Stable. Isot. Ecol. Environ. Sci., 138–186.
Millar K. R., Gagnon P. (2018). Mechanisms of Stability of Rhodolith Beds: Sedimentological Aspects. Mar. Ecol. Prog. Ser. 594, 65–83. doi: 10.3354/meps12501
Minagawa M., Wada E. (1984). Stepwise Enrichment of 15N Along Food Chains: Further Evidence and the Relation Between δ15n and Animal Age. Geochim. Cosmochim. Acta 48, 1135–1140. doi: 10.1016/0016-7037(84)90204-7
Morse D. E., Hooker N., Morse A. N. C., Jensen R. A. (1988). Control of Larval Metamorphosis and Recruitment in Sympatric Agariciid Corals. J. Exp. Mar. Biol. Ecol. 116, 193–217. doi: 10.1016/0022-0981(88)90027-5
Nelson M. M., Phleger C. F., Nichols P. D. (2002). Seasonal Lipid Composition in Macroalgae of the Northeastern Pacific Ocean. Bot. Mar. 45, 58–65. doi: 10.1515/BOT.2002.007
Newell R. I. E., Marshall N., Sasekumar A., Chong V. C. (1995). Relative Importance of Benthic Microalgae, Phytoplankton, and Mangroves as Sources of Nutrition for Penaeid Prawns and Other Coastal Invertebrates From Malaysia. Mar. Biol. 123, 595–606. doi: 10.1007/BF00349238
Nomura M., Kamogawa H., Susanto E., Kawagoe C., Yasui H., Saga N., et al. (2013). Seasonal Variations of Total Lipids, Fatty Acid Composition, and Fucoxanthin Contents of Sargassum Horneri (Turner) and Cystoseira Hakodatensis (Yendo) From the Northern Seashore of Japan. J. Appl. Phycol. 25, 1159–1169. doi: 10.1007/s10811-012-9934-x
Pakhomov E. A., McClelland J. W., Bernard K., Kaehler S., Montoya J. P. (2004). Spatial and Temporal Shifts in Stable Isotope Values of the Bottom-Dwelling Shrimp Nauticaris Marionis at the Sub-Antarctic Archipelago. Mar. Biol. 144, 317–325. doi: 10.1007/s00227-003-1196-3
Parrish C. C. (1987). Time Series of Particulate and Dissolved Lipid Classes During Spring Phytoplankton Blooms in Bedford Basin, a Marine Inlet. Mar. Ecol. Prog. Ser. 35, 10. doi: 10.3354/meps035129
Parrish C. C. (1999). Determination of Total Lipid, Lipid Classes, and Fatty Acids in Aquatic Samples. Lipids Freshw. Ecosyst., 4–20. doi: 10.1007/978-1-4612-0547-0
Parrish C. C. (2009). ““Essential Fatty Acids in Aquatic Food Webs,”,” in Lipids in Aquatic Ecosystems, 309–326. doi: 10.1007/978-0-387-89366-2_13
Parrish C. C. (2013). Lipids in Marine Ecosystems. ISRN Oceanogr. 2013, 1–16. doi: 10.5402/2013/604045
Parrish C. C., Abrajano T., Budge S. M., Helleur R. J., Hudson E. D. (2000). Lipid and Phenolic Biomarkers in Marine Ecosystems : Analysis and Applications. Handb. Environ. Chem. 5, 193–223. doi: 10.1007/10683826
Parrish C. C., Bodennec G., Macpherson E. J., Ackman R. G. (1992). Seawater Fatty Acids and Lipid Classes in an Urban and a Rural Nova Scotia Inlet. Lipids 27, 651. doi: 10.1007/BF02536127
Parrish C. C., Deibel D., Thompson R. J. (2009). Effect of Sinking Spring Phytoplankton Blooms on Lipid Content and Composition in Suprabenthic and Benthic Invertebrates in a Cold Ocean Coastal Environment. Mar. Ecol. Prog. Ser. Springer, New York: Parrish, 2009, 391, 33–51. doi: 10.3354/meps08148
Parrish C. C., McKenzie C. H., MacDonald B. A., Hatfield E. A. (1995). Seasonal Studies of Seston Lipids in Relation to Microplankton Species Composition and Scallop Growth in South Broad Cove, Newfoundland. Mar. Ecol. Prog. Ser. 129, 151–164. doi: 10.3354/meps129151
Parrish C. C., Thompson R. J., Deibel D. (2005). Lipid Classes and Fatty Acids in Plankton and Settling Matter During the Spring Bloom in a Cold Ocean Coastal Environment. Mar. Ecol. Prog. Ser. 286, 57–68. doi: 10.3354/meps286057
Parzanini C. (2018). An Integrated Approach to Studying the Trophic Ecology of a Deep-Sea Faunal Assemblage From the Northwest Atlantic. St. John's, NL: PhD thesis published online through Memorial University of Newfoundland.
Parzanini C., Parrish C. C., Hamel J.-F., Mercier A. (2018). Functional Diversity and Nutritional Content in a Deep-Sea Faunal Assemblage Through Total Lipid, Lipid Class, and Fatty Acid Analyses. PloS One 13, e0207395. doi: 10.1371/journal.pone.0207395
Peterson B. J., Fry B. (1987). Stable Isotopes in Ecosystem Studies. Annu. Rev. Ecol. Syst. 18, 293–320. doi: 10.1146/annurev.es.18.110187.001453
Pitt K. A., Connolly R. M., Meziane T. (2009). Stable Isotope and Fatty Acid Tracers in Energy and Nutrient Studies of Jellyfish: A Review. Hydrobiologia, 616: 119–132. doi: 10.1007/s10750-008-9581-z
Post D. M. (2002). Using Stable Isotopes to Estimate Trophic Position: Models, Methods, and Assumptions. Ecology 83, 703–718. doi: 10.1890/0012-9658(2002)083[0703:USITET]2.0.CO;2
Post D. M., Layman C. A., Arrington D. A., Takimoto G., Quattrochi J., Montana C. G. (2007). Getting to the Fat of the Matter: Models, Methods and Assumptions for Dealing With Lipids in Stable Isotope Analyses. Oecologia 152, 179–189. doi: 10.1007/s00442-006-0630-x
Raven J. A., Johnston A. M., Kübler J. E., Korb R., McInroy S. G., Handley L. L., et al. (2002). Mechanistic Interpretation of Carbon Isotope Discrimination by Marine Macroalgae and Seagrasses. Funct. Plant Biol. 29, 355–378. doi: 10.1071/PP01201
Richoux N. B., Deibel D., Thompson R. J., Parrish C. C. (2005). Seasonal and Developmental Variation in the Fatty Acid Composition of Mysis Mixta (Mysidacea) and Acanthostepheia Malmgreni (Amphipoda) From the Hyperbenthos of a Cold-Ocean Environment (Conception Bay, Newfoundland). J. Plankt. Res. 27, 719–733. doi: 10.1093/plankt/fbi045
Riosmena-Rodríguez R., Medina-López M. A. (2010). “The Role of Rhodolith Beds in the Recruitment of Invertebrate Species From the Southwestern Gulf of California, Mexico,”,” in Seaweeds and Their Role in Globally Changing Environments (Berlin: Springer), 127–138. doi: 10.1007/978-90-481-8569-6_8
Riosmena-Rodríguez R., Nelson W., Aguirre J. (2017). Rhodolith/maërl Beds: A Global Perspective (Florida: Springer).
Rohlf F. J. (1972). An Empirical Comparison of Three Ordination Techniques in Numerical Taxonomy. Syst. Zool. 21, 271–280. doi: 10.1093/sysbio/21.3.271
Sargent J. R., Parkes R. J., Mueller-Harvey I., Henderson R. J. (1987). Lipid Biomarkers in Marine Ecology. Microbes Sea., 119–138.
Schaal G., Riera P., Leroux C. (2009). Trophic Significance of the Kelp Laminaria Digitata (Lamour.) for the Associated Food Web: A Between-Sites Comparison. Estuar. Coast. Shelf. Sci. 85, 565–572. doi: 10.1016/j.ecss.2009.09.027
Schaal G., Riera P., Leroux C. (2010). Trophic Ecology in a Northern Brittany (Batz Island, France) Kelp (Laminaria Digitata) Forest, as Investigated Through Stable Isotopes and Chemical Assays. J. Sea. Res. 63, 24–35. doi: 10.1016/j.seares.2009.09.002
Scheibling R. E., Hennigar A. W., Balch T. (1999). Destructive Grazing, Epiphytism, and Disease: The Dynamics of Sea Urchin-Kelp Interactions in Nova Scotia. Can. J. Fish. Aquat. Sci. 56, 2300–2314. doi: 10.1139/f99-163
Schmid M., Guihéneuf F., Stengel D. B. (2014). Fatty Acid Contents and Profiles of 16 Macroalgae Collected From the Irish Coast at Two Seasons. J. Appl. Phycol. 26, 451–463. doi: 10.1007/s10811-013-0132-2
Sciberras M., Rizzo M., Mifsud J. R., Camilleri K., Borg J. A., Lanfranco E., et al. (2009). Habitat Structure and Biological Characteristics of a Maërl Bed Off the Northeastern Coast of the Maltese Islands (Central Mediterranean). Mar. Biodivers. 39, 251–264. doi: 10.1007/s12526-009-0017-4
Snedecor G. W., Cochran W. G. (1994). “Statistical Methods,” in Affiliated East, 8th edn. Ames: Iowa State University Press.
Sneed E. D., Folk R. L. (1958). Pebbles in the Lower Colorado River, Texas a Study in Particle Morphogenesis. J. Geol. 66, 114–150. doi: 10.1086/626490
Steller D. L., Cáceres-Martínez C. (2009). Coralline Algal Rhodoliths Enhance Larval Settlement and Early Growth of the Pacific Calico Scallop Argopecten Ventricosus. Mar. Ecol. Prog. Ser. 396, 49–60. doi: 10.3354/meps08261
Steller D. L., Riosmena-Rodríguez R., Foster M. S., Roberts C. A. (2003). Rhodolith Bed Diversity in the Gulf of California: The Importance of Rhodolith Structure and Consequences of Disturbance. Aquat. Conserv. Mar. Freshw. Ecosyst. 13, 5–20. doi: 10.1002/aqc.564
Steneck R. S. (1986). The Ecology of Coralline Algal Crusts: Convergent Patterns and Adaptative Strategies. Annu. Rev. Ecol. Syst. 17, 273–303. doi: 10.1146/annurev.es.17.110186.001421
Steneck R. S. (1990). ““Herbivory and the Evolution of Nongeniculate Coralline Algae (Rhodophyta, Corallinales) in the North Atlantic and North Pacific,”,” in Evolutionary Biogeography of the Marine Algae of the North Atlantic (Berlin: Springer), 107–129. doi: 10.1007/978-3-642-75115-8_6
Takai N., Yorozu A., Tanimoto T., Hoshika A., Yoshihara K. (2004). Transport Pathways of Microphytobenthos-Originating Organic Carbon in the Food Web of an Exposed Hard Bottom Shore in the Seto Inland Sea, Japan. Mar. Ecol. Prog. Ser. 284, 97–108. doi: 10.3354/meps284097
Teed L., Bélanger D., Gagnon P., Edinger E. (2020). Calcium Carbonate (CaCO3) Production of a Subpolar Rhodolith Bed: Methods of Estimation, Effect of Bioturbators, and Global Comparisons. Estuar. Coast. Shelf. Sci. 242, 106822. doi: 10.1016/j.ecss.2020.106822
Terasaki M., Hirose A., Narayan B., Baba Y., Kawagoe C., Yasui H., et al. (2009). Evaluation of Recoverable Functional Lipid Components of Several Brown Seaweeds (Phaeophyta) From Japan With Special Reference to Fucoxanthin and Fucosterol Contents 1. J. Phycol. 45, 974–980. doi: 10.1111/j.1529-8817.2009.00706.x
Trueman C. N., Johnston G., O’Hea B., MacKenzie K. M. (2014). Trophic Interactions of Fish Communities at Midwater Depths Enhance Long-Term Carbon Storage and Benthic Production on Continental Slopes. Proc. R. Soc B. Biol. Sci. 281. doi: 10.1098/rspb.2014.0669
Urban J. L., McKenzie C. H., Deibel D. (1992). Seasonal Differences in the Content of Oikopleura Vanhoeffeni and Calanus Finmarchicus Faecal Pellets: Illustrations of Zooplankton Food Web Shifts in Coastal Newfoundland Waters. Mar. Ecol. Prog. Ser. 84, 255–264. doi: 10.3354/meps084255
Vanderklift M. A., Bearham D. (2014). Variation in δ13c and δ15n of Kelp is Explained by Light and Productivity. Mar. Ecol. Prog. Ser. 515, 111–121. doi: 10.3354/meps10967
Vanderploeg H. A., Bolsenga S. J., Fahnenstiel G. L., Liebig J. R., Gardner W. S. (1992). Plankton Ecology in an Ice-Covered Bay of Lake Michigan: Utilization of a Winter Phytoplankton Bloom by Reproducing Copepods. Hydrobiologia 243, 175–183. doi: 10.1007/BF00007033
Wacker A., Becher P., von Elert E. (2002). Food Quality Effects of Unsaturated Fatty Acids on Larvae of the Zebra Mussel Dreissena Polymorpha. Limnol. Oceanogr. 47, 1242–1248. doi: 10.4319/lo.2002.47.4.1242
Wakeham S. G., Canuel E. A. (1988). Organic Geochemistry of Particulate Matter in the Eastern Tropical North Pacific Ocean: Implications for Particle Dynamics. J. Mar. Res. 46, 183–213. doi: 10.1357/002224088785113748
Wennberg M., Vessby B., Johansson I. (2009). Evaluation of Relative Intake of Fatty Acids According to the Northern Sweden FFQ With Fatty Acid Levels in Erythrocyte Membranes as Biomarkers. Public Health Nutr. 12, 1477–1484. 10.1017/S1368980008004503.
Keywords: Rhodolith, Food web, Trophic ecology, Fatty acid, Lipid classes, Stable isotope, Biomarker, Diatom
Citation: Hacker Teper S, Parrish CC and Gagnon P (2022) Multiple Trophic Tracer Analyses of Subarctic Rhodolith (Lithothamnion glaciale) Bed Trophodynamics Uncover Bottom-Up Forcing and Benthic-Pelagic Coupling. Front. Mar. Sci. 9:899812. doi: 10.3389/fmars.2022.899812
Received: 19 March 2022; Accepted: 30 May 2022;
Published: 12 July 2022.
Edited by:
Laurie Carol Hofmann, Alfred Wegener Institute Helmholtz Centre for Polar and Marine Research (AWI), GermanyReviewed by:
Alberto Sánchez-González, Instituto Politécnico Nacional (IPN), MexicoErwann Legrand, Norwegian Institute of Marine Research (IMR), Norway
Copyright © 2022 Hacker Teper, Parrish and Gagnon. This is an open-access article distributed under the terms of the Creative Commons Attribution License (CC BY). The use, distribution or reproduction in other forums is permitted, provided the original author(s) and the copyright owner(s) are credited and that the original publication in this journal is cited, in accordance with accepted academic practice. No use, distribution or reproduction is permitted which does not comply with these terms.
*Correspondence: Patrick Gagnon, pgagnon@mun.ca