Towards a Fleet of Robots for Orientation, Imaging, and Morphometric Analyses of Planktonic Foraminifera
 Michael Knappertsbusch1,2*
  Jean Eisenecker1
- 1Natural History Museum Basel, Basel, Switzerland
- 2Departement Umweltwissenschaften, Universität Basel, Basel, Switzerland
Morphometric shell measurements help to quantify the evolutionary patterns of planktonic foraminifera (marine, calcite-secreting, and floating protists). The study of shell variations of these organisms requires observations at high stratigraphic resolution, which entails morphometric measurements from thousands of specimens. The collection of such data is time-consuming because specimens need to be oriented prior to imaging. In our studies about menardiform, globorotalids through time automatic devices were developed to orientate and image specimens under incident light. A first prototype—Automated Measurement system for shell mORphology (AMOR)—was realized in 2009 and was proven to be advantageous for gathering morphometric data. AMOR consists of a motorized universal tilting stage enabling an automatic orientation of specimens in a multicellular slide under a motorized binocular microscope. After the collection of images from the oriented specimens, shell parameters can be extracted and analyzed using separate digital imaging and morphometric software. AMOR was strongly tuned to Globorotalia menardii, a species with a quasi-symmetrical biconvex geometry in a keel view and often with a non-circular periphery in an equatorial view. Improvements of the software driving AMOR now allow the orientation of spiro- and umbilico-convex profiles and with circular forms in an equatorial view such as in phylogenetically related species like Globorotalia miocenica and Globorotalia multicamerata. Program AMOR v. 3.28 was given more flexibility using a scripting language for automatic control of the Windows graphical user interface. This approach was used to allow combinations of fix orienting functions in AMOR, which released us from reprogramming of the sophisticated LabView code. Scripting of core functions enables developing “portfolios” of adapted recipes for processing the morphologies that are beyond the menardiform morphogroup. To further expand on this concept, a follow-up robot—System AMOR 2—was completed in March 2020. It integrates the modified hardware, a newer digital camera, the updated software (AMOR v. 4.2), and improved functions. The present contribution describes the development from old AMOR to its newer twin, with the perspective of building a fleet of robots for the imaging of the oriented foraminifera in parallel.
Introduction
“Evolutionary prospection” is a conceptional program to investigate the pattern, biogeography, and dynamics through the time of morphological evolution in planktonic foraminifera (marine floating protists that produce a calcareous shell). The motivation of this effort is the notorious lack of detailed quantitative information about the worldwide morphological variability of shells in these organisms through geological time (Knappertsbusch, 2011, 2016, 2022). Such information is required for a profound understanding of evolution and environmental influences on planktonic foraminiferal shell morphology within a species’ global paleobiogeography. Biostratigraphic applications rely on the recognition of evolutionary bases and extinction of species in deep time (Aze, 2011; Aze et al., 2011), but the empirical documentation of morphological splitting of descendents from ancestors—as attempted in Knappertsbusch (2016; Figure 1)—is often challenging.
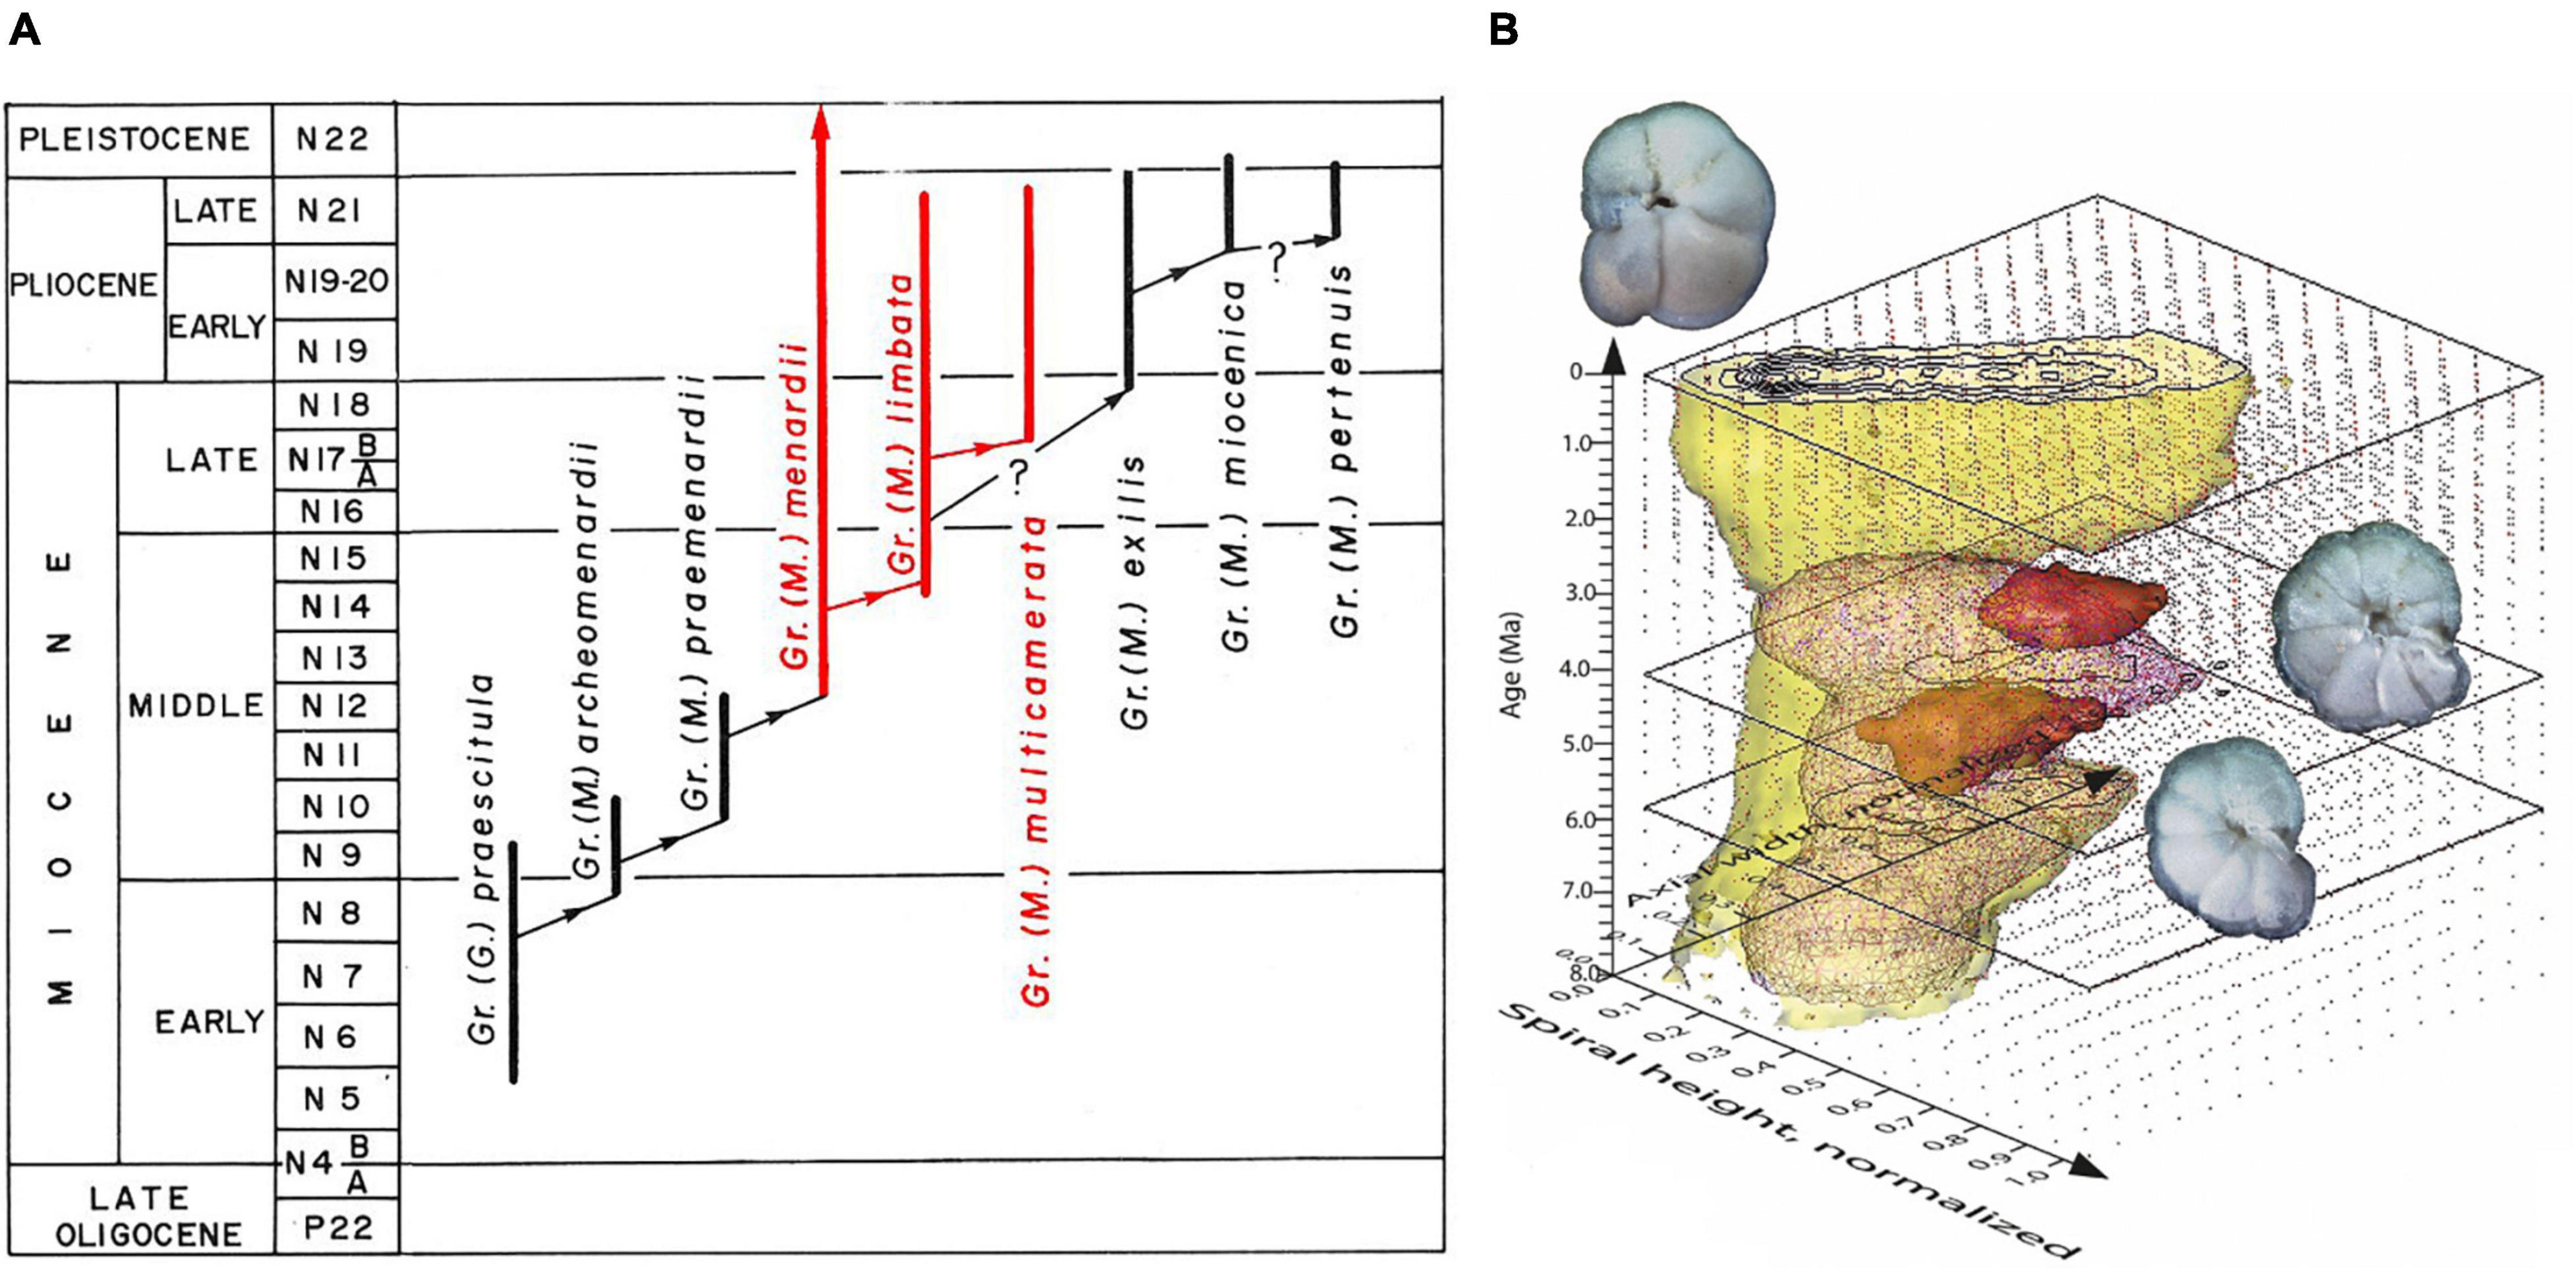
Figure 1. The evolution of menardiform globorotalids (planktonic foraminifera) during the Miocene through Quaternary. (A) Phylogenetic scheme redrawn from Text Figure 14 on p. 121 in Kennett and Srinivasan (1983), with permission from the authors. (B) Volume-density diagram (VDD) for the Globorotalia menardii-limbata-multicamerata lineage during the past 8 million years at ODP Hole 925B based on length vs. width measurements of the shells in a keel view (from Knappertsbusch, 2016, 2022). One of the goals in that study was to find empirical evidence for the morphological splitting of G. limbata–G. multicamerata from ancestral G. menardii. For more information about the development of VDDs; see also Knappertsbusch and Mary (2012).
From a species’ splitting or budding off until the moment where divergence gets morphologically detectable, closely related species often exhibit a high degree of morphological intergradation. This status lasts for a longer time, the slower shell diversification occurs, and eventually leads to a macroscopic separation. It is thus desirable that in macroevolutionary phylogenetic diagrams the widening “empty space” between branching morphospecies can be quantified, as suggested in Ezard et al. (2012).
Equally important is the geographic mapping of an intraspecific variation of morphospecies, as shown in Brown (2007), Mary and Knappertsbusch (2015), or recently in Rillo (2019) and Rillo et al. (2020). By doing both—mapping geographically and through time—the immigration of ecophenotypic variants of a species from an adjacent niche or a remote regional habitat can be disentangled from overlapping morphotypes within the same lineage. Immigration and splitting from an ancestral branch involve different processes that can lead to similar morphological trends in the geological record, which can be misinterpreted.
Investigation of macroevolutionary dynamics is particularly attractive in planktonic foraminifera and other pelagic microfossils (Lazarus, 2011). Such studies call for statistical analysis of shell parameters from thousands of oriented individuals through time and geography. Just imagine the gain of new insights, if the records of morphological variability of microfossils would arrive at a resolution that is nowadays standard in paleoceanography and oxygen isotope stratigraphy! In reality, such highly resolved morphometric data sets are still utopic with the current instrumentation and during a single researcher’s work life. The purpose of the present contribution is to report about efforts to develop new tools for these tasks, their strength, and limitations.
First Automated Measurement System for Shell mORphology
Mass imaging of foraminifers and other microfossils using automats has been applied since 2002 (the system ALPHA in Bollmann et al., 2002; Schmidt, 2002; Bollmann et al., 2004; Le Villain, 2011; the system SYRACO in de Garidel-Thoron, 2002). Meanwhile, there exist elegant solutions for efficient scanning of microfossils under reflected or transmitted light, and imaging systems are increasingly combined with classification and species identification software (Schulze et al., 2013; de Garidel-Thoron et al., 2019; Hsiang et al., 2019; Mitra et al., 2019; Itaki et al., 2020; Marchant et al., 2020; Tetard et al., 2020) or are applied in virtually reflected light microscopy (VRLM) reconstruction of shells (Harrison et al., 2011). These solutions are applicable to the specimens that are randomly strewn in a picking tray or embedded in glass slides. However, imaging systems exist only for horizontal positioning stages under a microscope. Imaging in this way allows a very fast sample throughput but the measurements preclude a morphological analysis from the oriented specimens. Because of these limitations, a robot prototype called AMOR (from the Automated Measurement system for shell mORphology) has been developed at NMB several years ago (Knappertsbusch et al., 2009; see Figure 2).
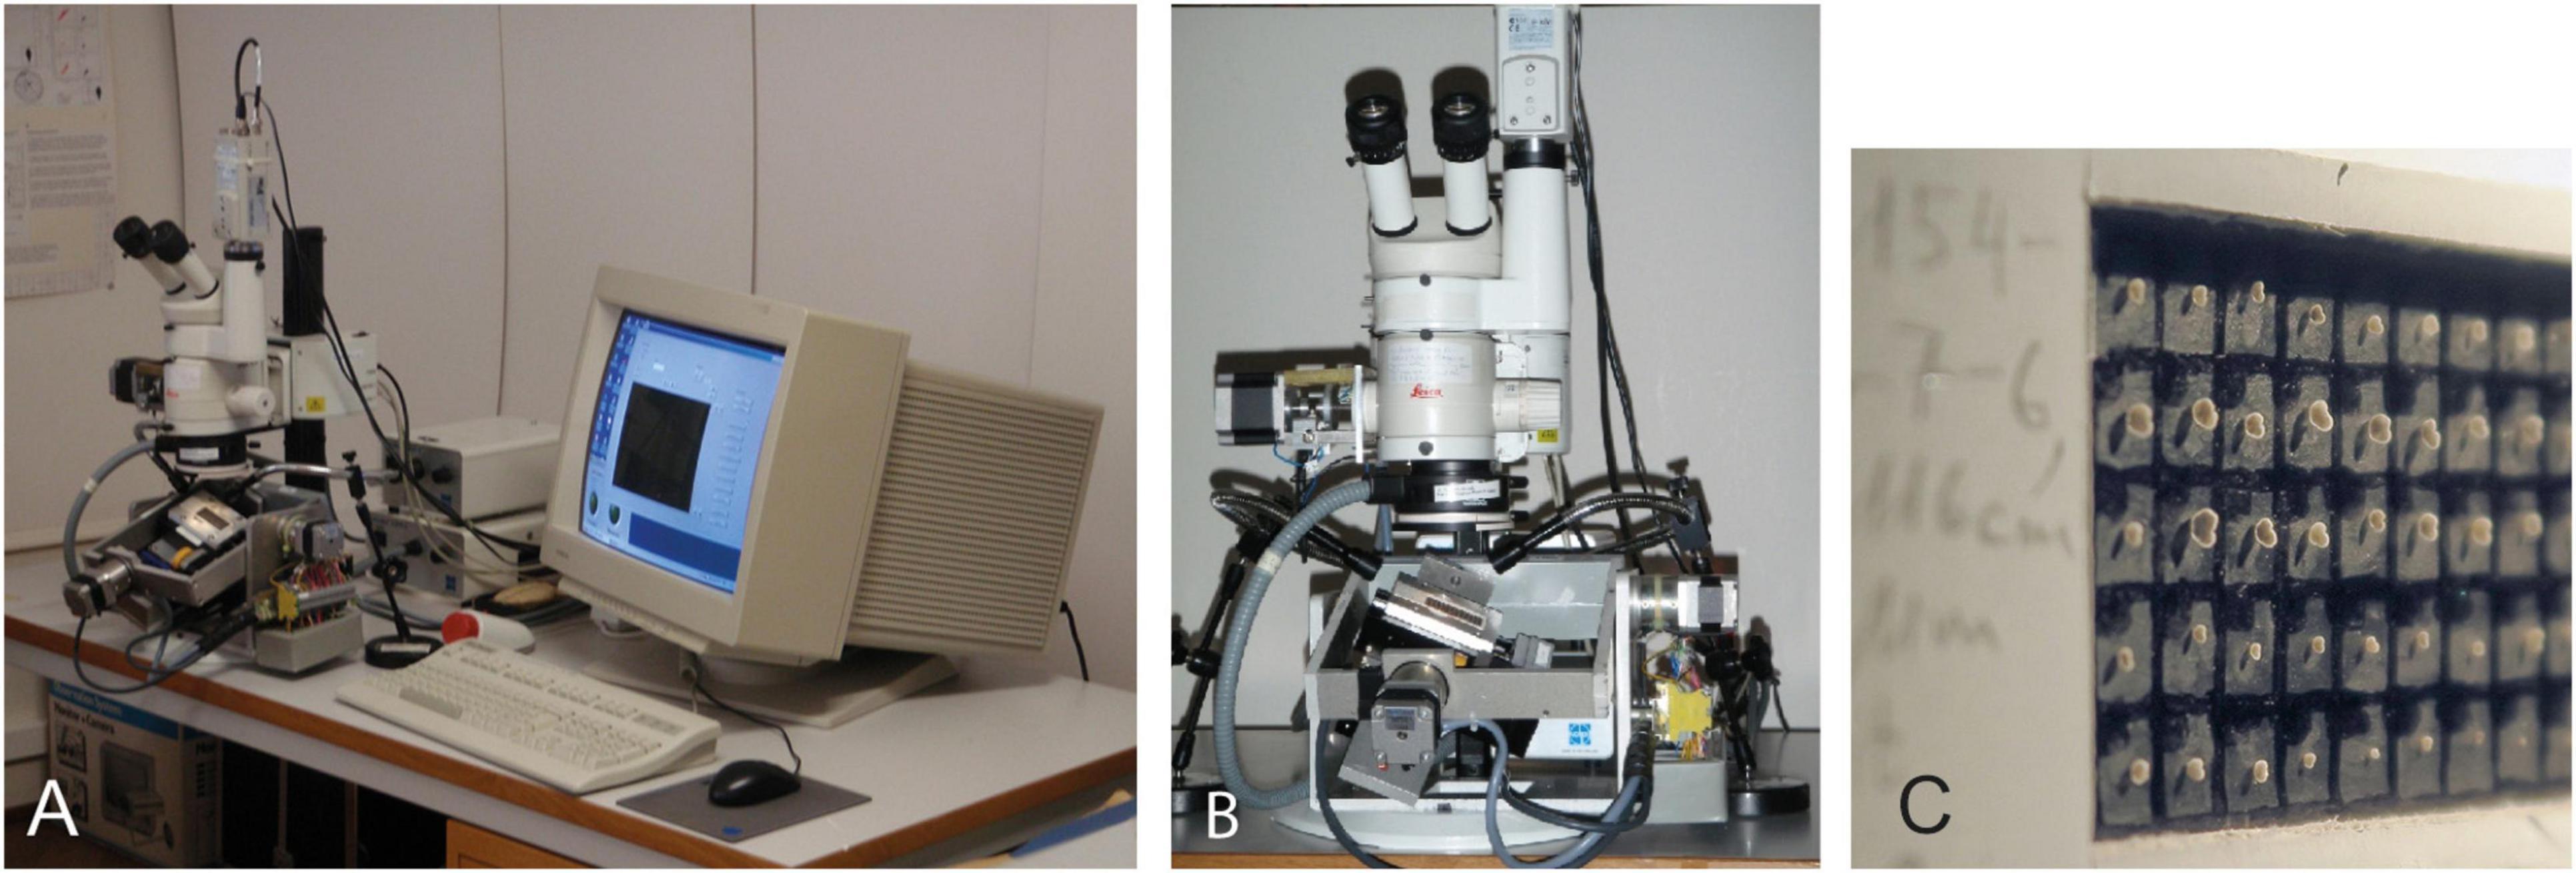
Figure 2. First Automated Measurement system for shell mORphology (AMOR). (A) System in 2009 (an image from Knappertsbusch, 2016). (B) A motorized binocular microscope equipped with additional motor zoom and four-axis tilting stage with sample slide (an image from Knappertsbusch et al., 2009). (C) Details of a multicellular Plummer cell showing menardiforms mounted in keel position.
Our automated Measurement system for shell mORphology was especially tuned to study the morphological evolution of the Neogene tropical planktonic foraminifer Globorotalia menardii and related forms in keel position. These forms have a typically disk-shaped, low trochospiral shell that can be easily oriented in a side view. AMOR is equipped with a universal stage for routine positioning of specimens in a multicellular slide under the microscope. The prize for the orientation of specimens in 3D is that specimens need to be premounted in a position that is close to the desired standard position for imaging. This is time-consuming and reduces the rate of sample throughput: For an experienced person, manual mounting of 60 specimens requires about 3–4 h. This effort is, however, compensated, when fine orientation and imaging of specimens in multicellular slides are automated. In addition, machine-aided orientation enhances repeatability and precision. In the following sections, a brief review of the development of AMOR is given first, and then the development of a follow-up twin called System AMOR 2 is described.
History of the Development and Applications of Automated Measurement System for Shell mORphology
Ideas for AMOR emerged during a morphometric study of G. menardii and related forms through the time from the Caribbean Sea and eastern equatorial Pacific (Knappertsbusch, 2007). In that study, thousands of menardiform specimens were oriented into the keel position by hand using a hemispherical stage under a binocular.
For increasing precision in positioning, tools and a simple motorized X–Y tilting stage for positioning a single specimen under a binocular microscope (Knappertsbusch, 2002; Knappertsbusch et al., 2006) were built. The need to routinely image specimens in multicellular Plummer cells has led to the first AMOR (Knappertsbusch et al., 2009). In the forthcoming years, AMOR was improved and applied in a number of morphometric studies on G. menardii (Mary, 2013; Mary and Knappertsbusch, 2013; Knappertsbusch, 2015; Knappertsbusch, 2016, 2022; Friesenhagen, 2022) and on the planktonic foraminiferal genus Truncorotalia (Bicknell et al., 2018). Experiencing the advantages of AMOR, the desire emerged of multiplying it to a fleet of AMORs for parallel processing of samples, and the effort for duplicating it was evaluated (Scheffelmeier et al., 2014). Realization of the follow-up System AMOR 2 took another 5 years, and SYSTEM AMOR 2 was presented for the first time to the scientific community in 2019 at EGU Meeting in Vienna, Austria, and at the 17th Swiss Geoscience Meeting, 2019, in Fribourg, Switzerland.
Methods
A Portrait of the First Automated Measurement System for Shell mORphology
The hardware of AMOR consists of a universal stage with four motorized axes that are connected to a PC running under Windows NT (see Figure 2A). The stage allows the translation and tilting of specimens in a multicellular slide in X and Y directions in a near-eucentric manner under a binocular microscope. The slide is placed in a sample holder plate that is fixed on two perpendiculars, motorized gliding stages. The two stages are mechanically suspended inside the two cardanic frames for Pitch (forward–backward) and Roll (left–right) movements (Figure 2B). Nanotec stepping motors allow precise positioning and tilting. Controllers for these motors are housed in an external “stepping box” connected to a digital counter card PCI-6601 from National Instruments (NI). To prevent a collision of the stage with the microscope, tilting is limited to ±22.5° by sending a signal to the motors as soon as the end position of tilting is detected. The binocular microscope is the model MZ6 from Leica with a zoom body, allowing for continuous zooming from 0.63× to 4×. The microscope is equipped with the motorfocus system MST-39, also connected to the PC. A 1× achromatic objective lens allows for a large working distance of 6.5 cm at the highest magnification position (4.0×). Once the specimen is in focus, zooming can be done without any further focusing (except at the magnifications above 3.2×, when a narrowing depth of focus comes into play). This property is fortunate when the observed specimen tilts continuously into the desired orientation. The zoom of the microscope was motorized by connecting it to a fifth stepping motor (Figure 2B). The electronics for the motor zoom is wired to a PCI-7334 card from NI. The limitation of magnification between 0.63× and 4× positions of the microscope is realized using electrical push buttons. For imaging, a color video camera, DXC-390P from Sony is connected to an NI PCI-1405 framegrabber card. The camera is mounted on the phototube of the microscope via a lens-free standard 1× C-mount. To obtain coaxial and orthoscopic light at the camera, the microscope is mounted onto an AX-Stand from Leica. Without this accessory, vertical movements during focusing would cause lateral shifts of the object on the computer monitor.
The calcareous shells of fossil menardiforms are often white to slightly translucent in reflected light, depending on incrustation. To optimize contrast and brightness, cardboard slides with a black, smooth background are used. For the reduction of reflections from the bottom of the slide, polarized light is installed using a fiber optic ring light from Volpi with a rotating, ring-shaped polarizing plate. Cross-polarized light is obtained by the insertion of a second polarizing filter disc inside an objective of the microscope. To enhance illumination, double swan-neck fiber optics with focusing lenses and rotating polarizing filter caps were installed. Both (ring-light and swan-neck) illuminations can be finely adjusted for the complete extinction of reflecting spots from the background, while the birefringent calcite shell still remains bright enough for focusing and imaging.
The software to drive this first AMOR is called the program AMOR v. 2.8. It was implemented in LabView 8.5 from NI. Lab View is a sophisticated commercial graphical programming environment that is widely used in the industry for the development of prototypes with vision and motion components. AMOR offers three options for operation: the “manual mode,” “automatic mode,” and “calibration mode.” In the manual mode, functions can be mouse clicked for moving and centering the specimen of a particular field under the objective, tilting it into the keel position, soft rotating it into the “north–south orientation” on the monitor, focusing, magnification, and writing a Tiff file of the oriented specimen to a disk (these functions are subsequently termed as core functions). In the automatic mode, these functions are executed for each field in the abovementioned fix sequence, beginning with the first and ending with the last field. The calibration mode serves to calibrate the size of the slide to motor steps so that the different types of Plummer slides can be used (for example, slides with 36 or 60 fields).
In the automatic mode, AMOR generates a directory containing a series of Tiff images of the oriented specimens in a slide and a text file listing the names and final magnification for each image. Images and a text file are then fed to external programs for the extraction of outline coordinates and further morphometric analysis. The time to automatically orient and image a specimen is about 2–3 min or about 2.5 h for a filled slide with 60 fields.
Results
Duplication of Automated Measurement System for Shell mORphology: System Automated Measurement for Shell mORphology 2
To increase efficiency and sample throughput, the multiplication of AMOR was considered. However, after 12 years of first AMOR, one-to-one duplication was no longer possible because several hardware and software components were no longer available. Instead, a similar successor called “System AMOR 2” was realized (Figure 3), which is presented in the following section.
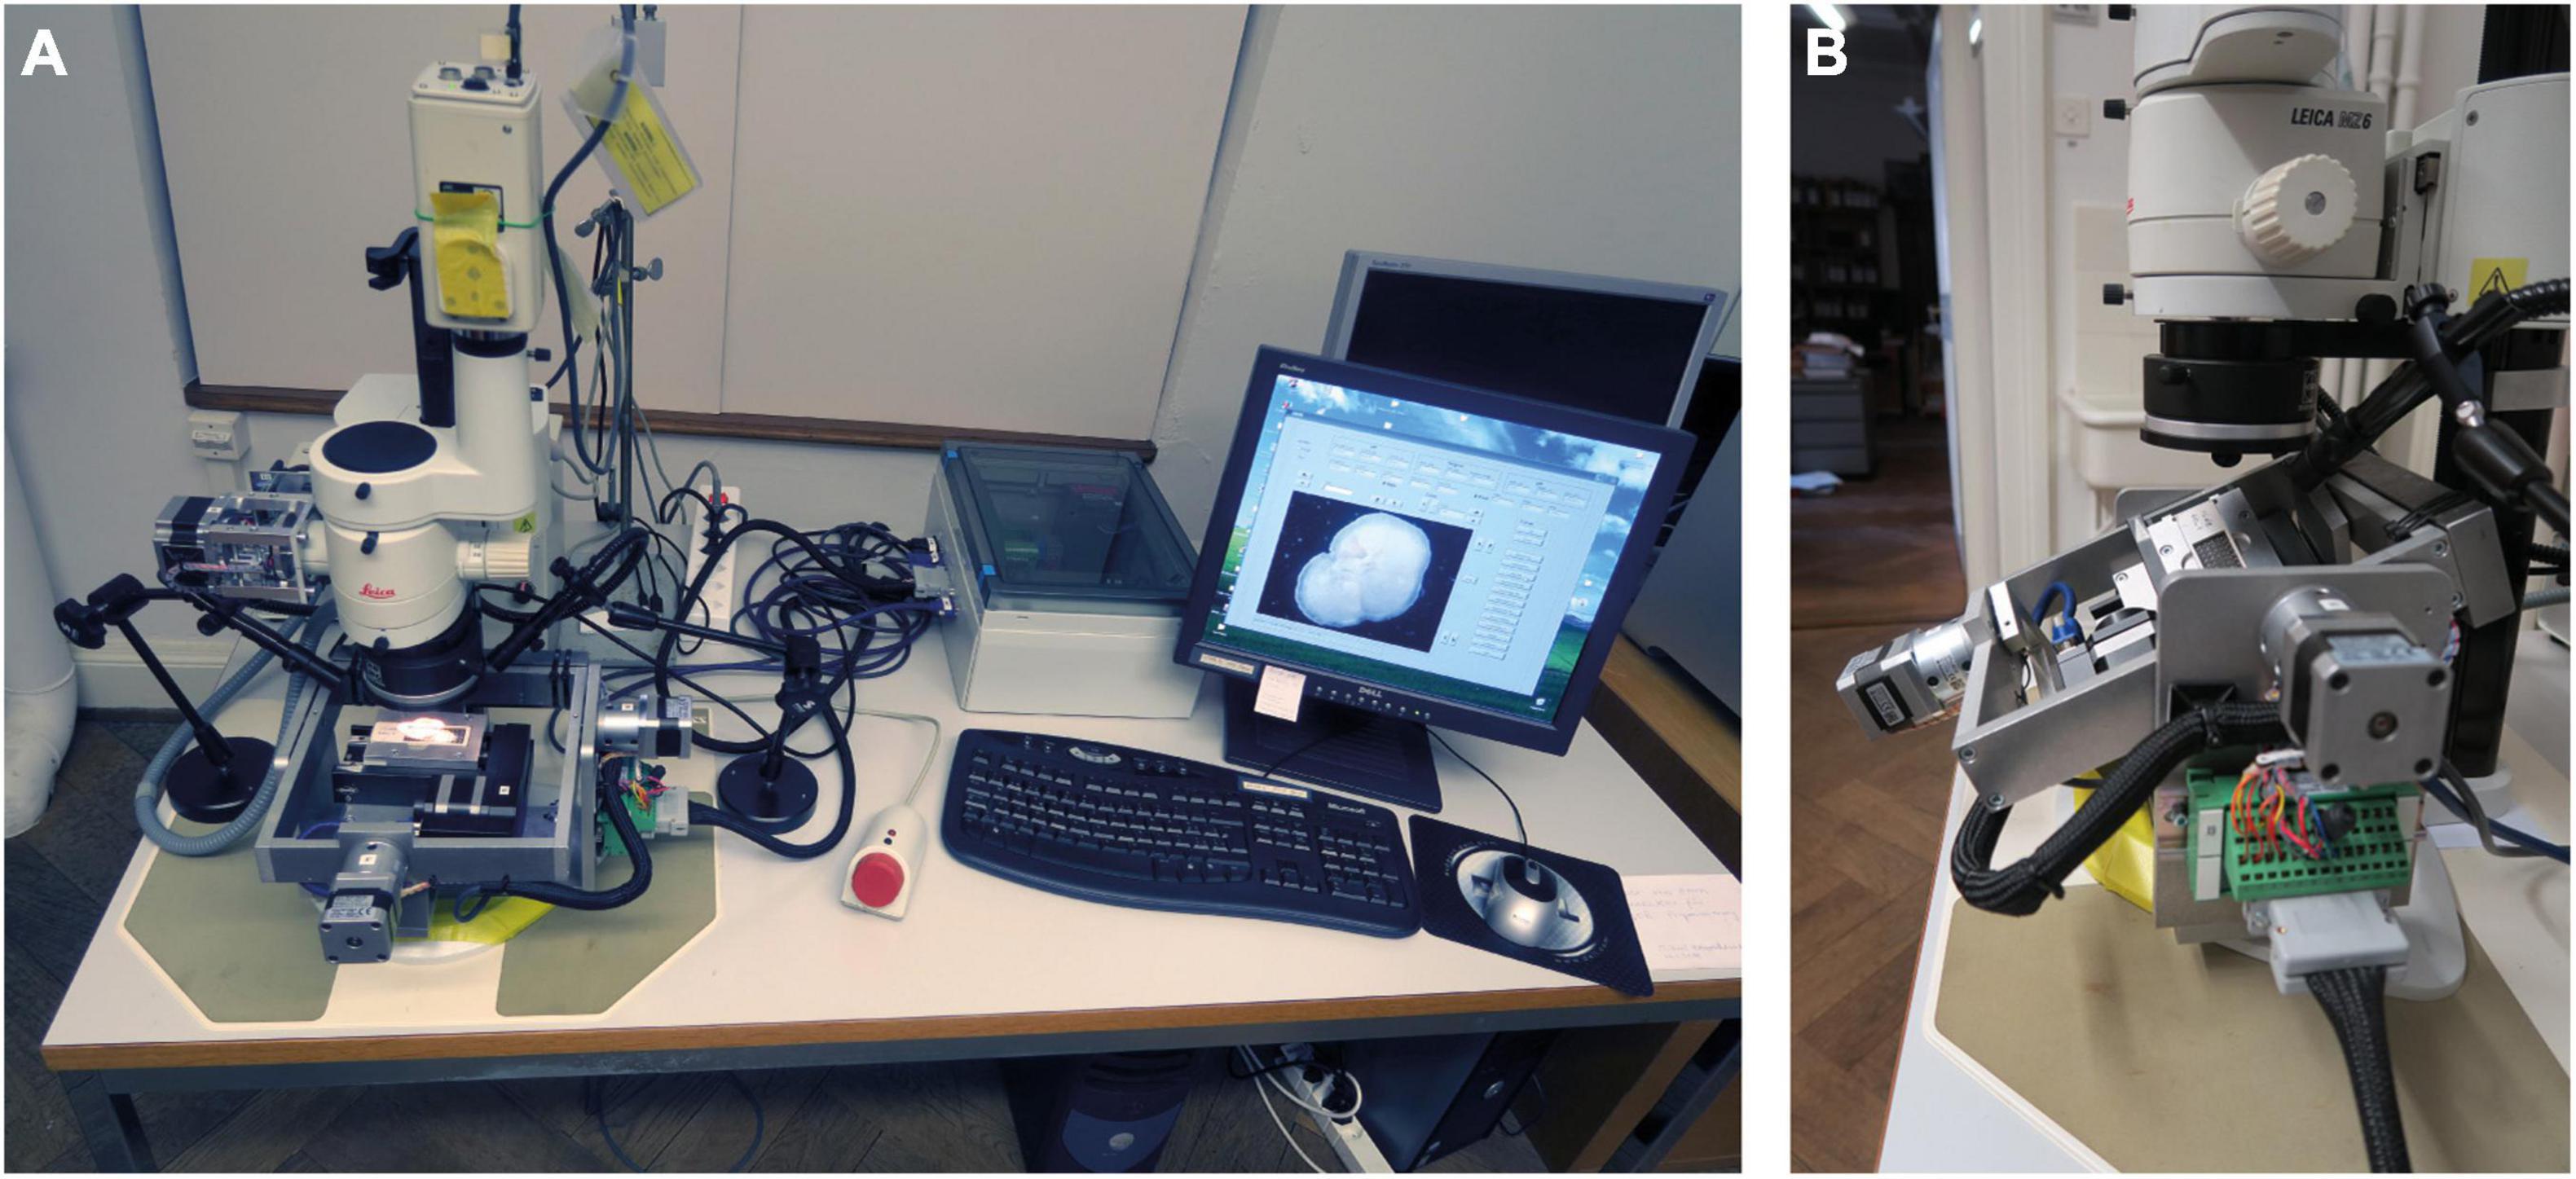
Figure 3. The new System AMOR 2. (A) Motorized microscope and stage, stepping box (white) with the electronics, and human interface devices. The PC stands under the table. (B) Close up of the motorized stage in forward Roll position (outer frame) and Pitch position to the right (inner frame). The stage can be unplugged from the stepping box.
System AMOR 2 is integrated on a Dell Optiplex gx 270 computer running under Windows NT. The new system was modified in several aspects: the electric push button switches for the motorized zoom were replaced by more precise magnetic Hall effect sensors (Figure 4).
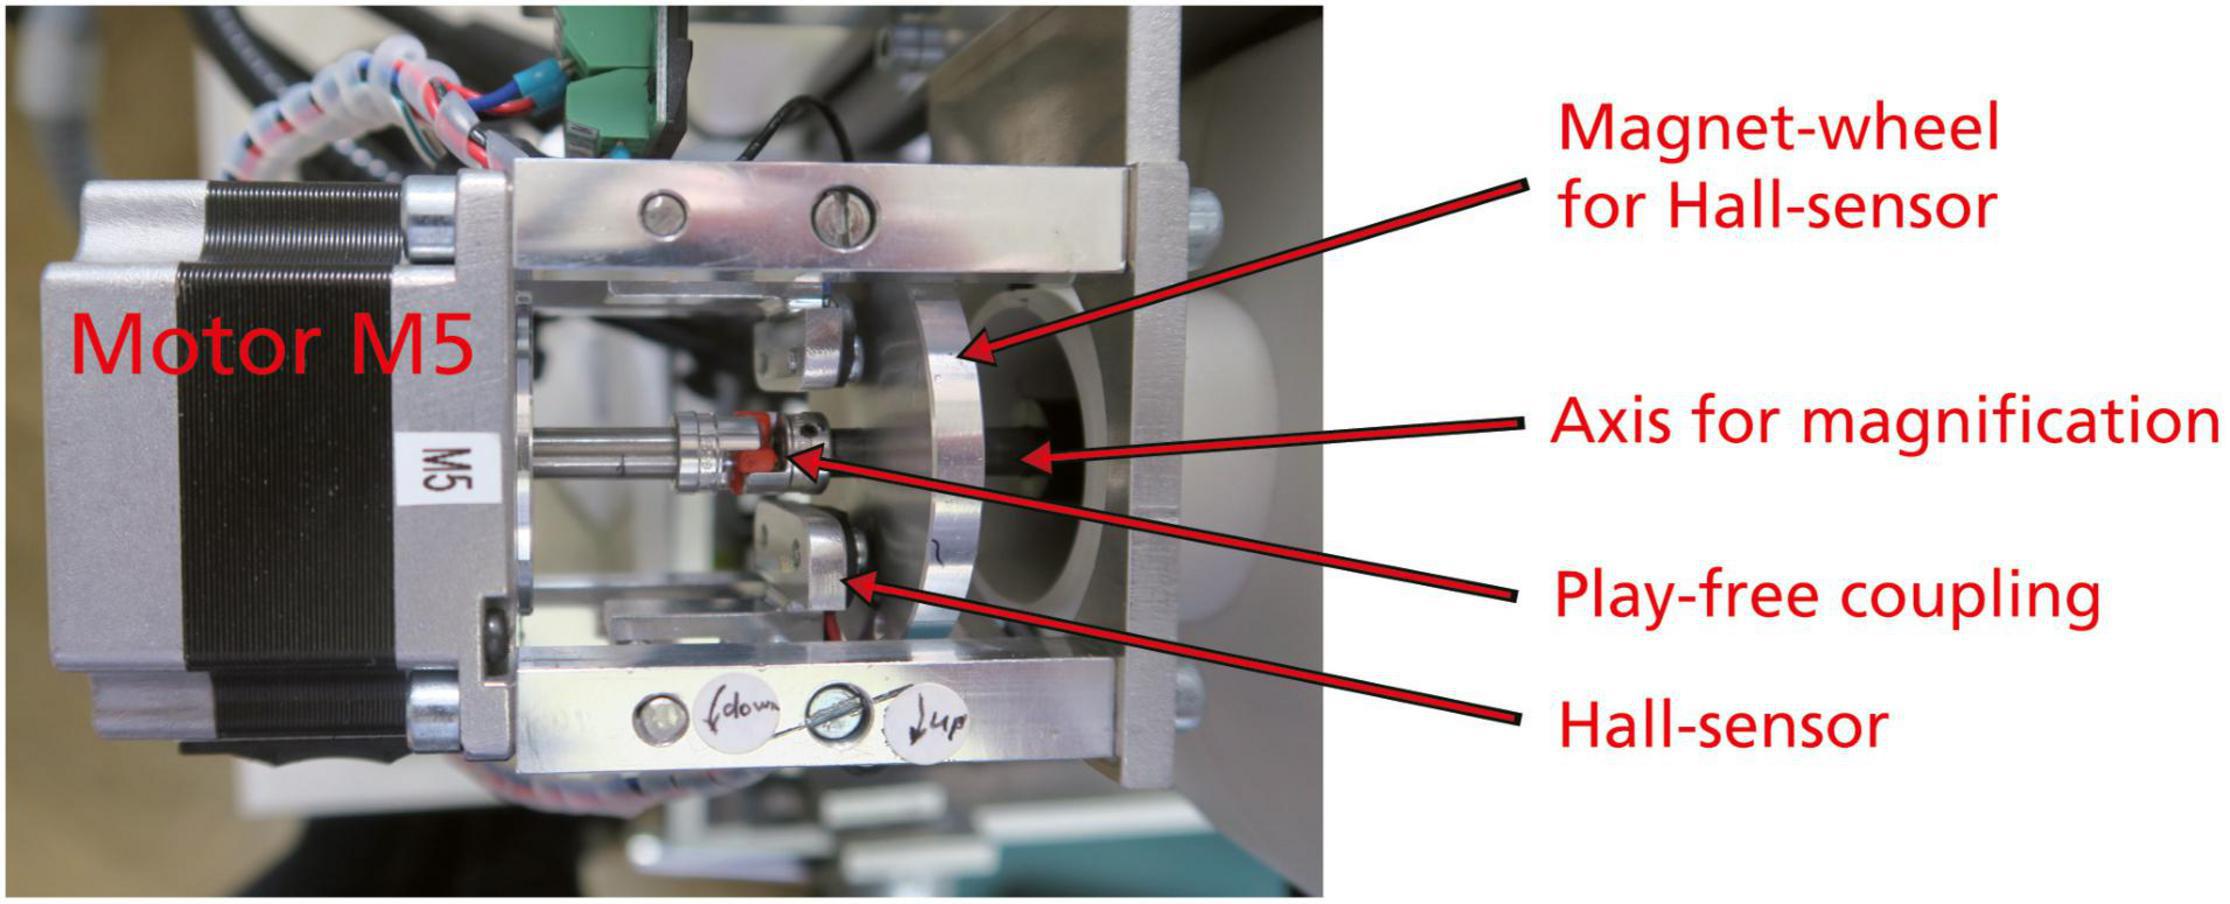
Figure 4. Motor zoom, top view. The coupling between the motor and the axis for magnification is a special backlash-free metal bellow type coupling. The magnet wheel contains a small permanent magnet striving over the Hall effect sensor to produce an electrical signal for the interruption of rotation at the lowest (0.63×) and highest (4×) zoom positions of the microscope.
All motor controllers were replaced by more modern Nanotec C5 bus motor controllers that can be softly adjusted via the configuration of files. They are combined in a single stepping box instead of two separate boxes in old AMOR, which makes a new system better portable (Figure 5).
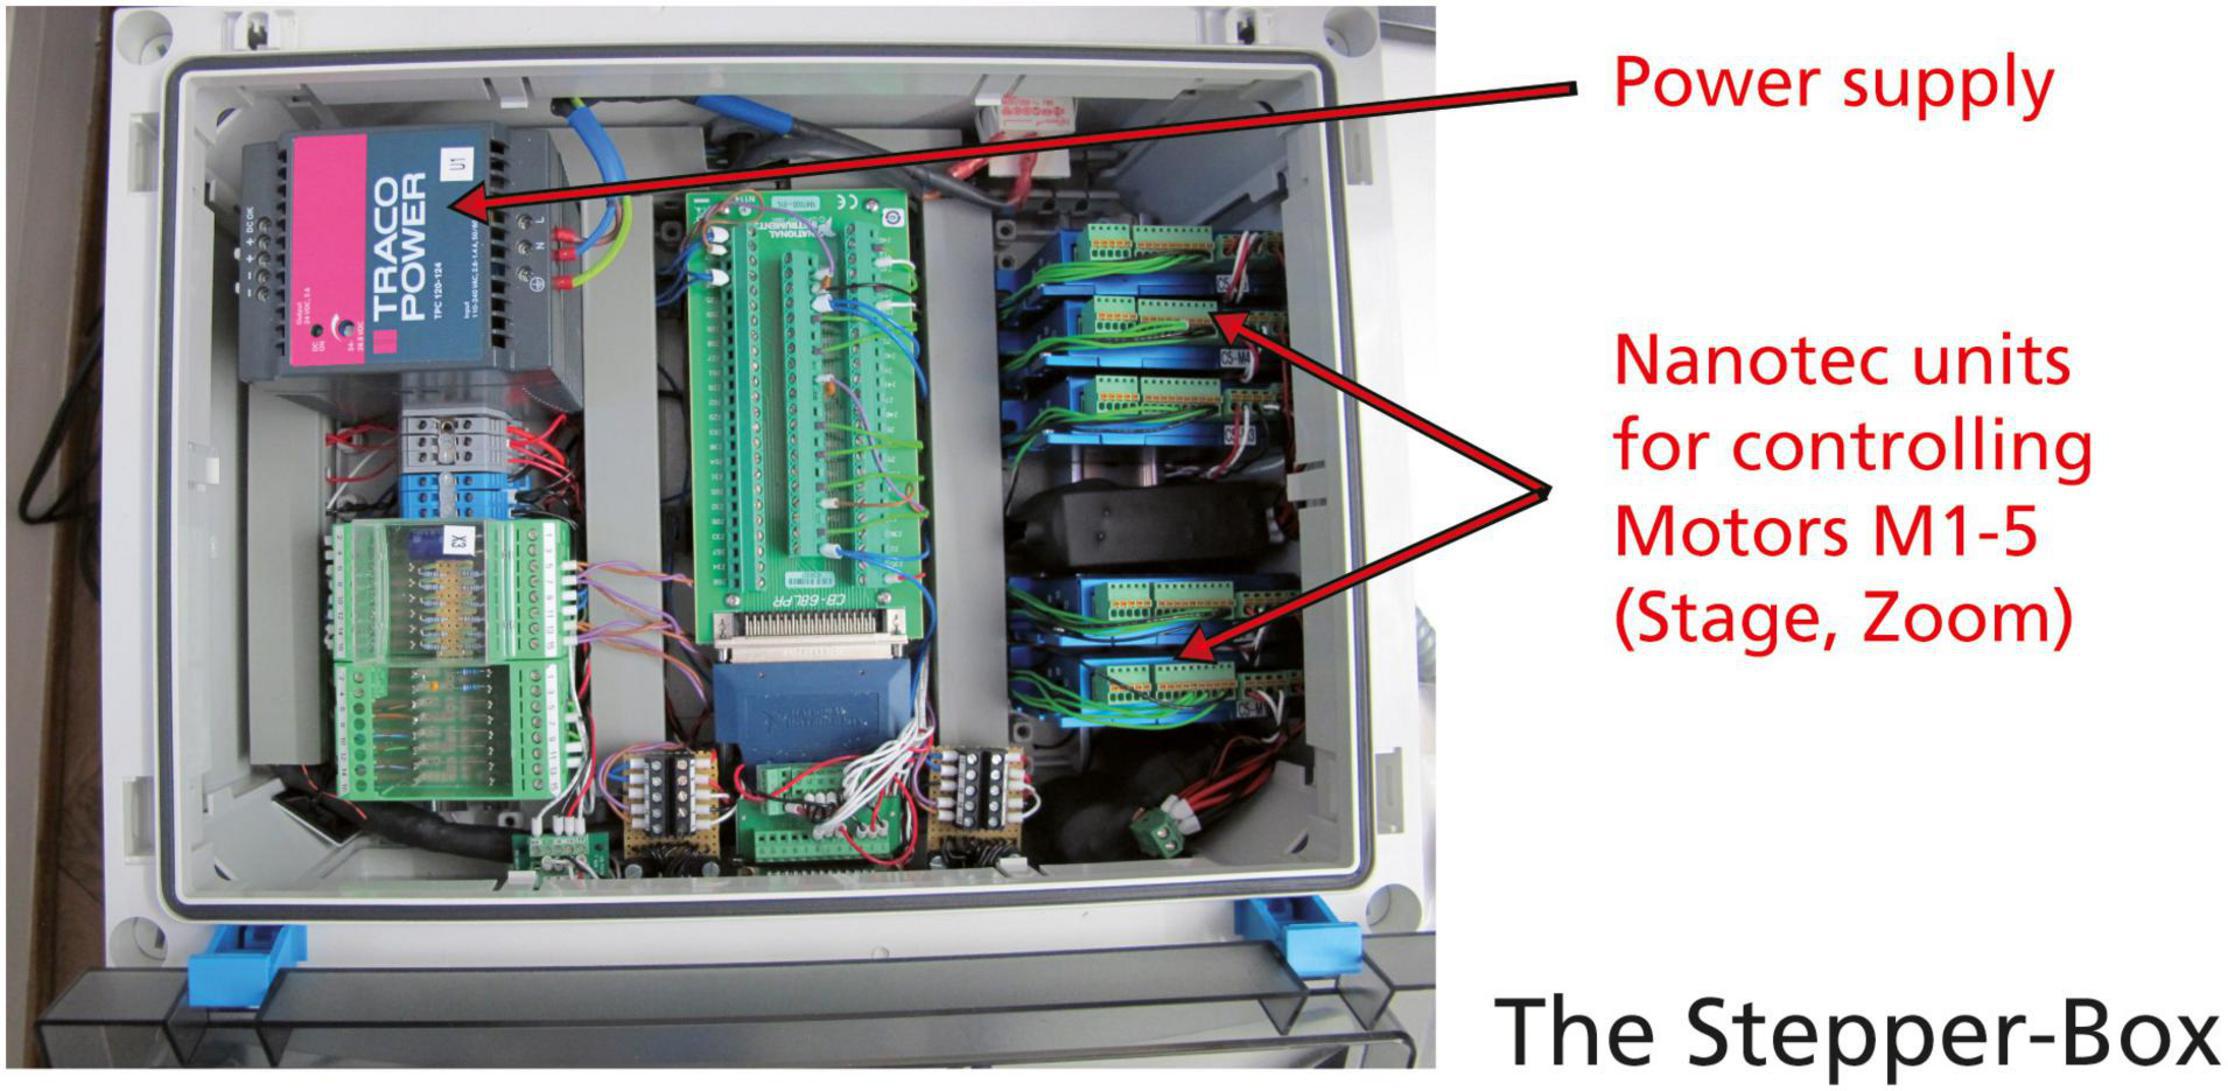
Figure 5. The new stepping box for System AMOR 2. Power supply, and five C5 motor controllers from Nanotec.
The Sony camera was replaced by the digital video camera KY-F75 from JVC. This entailed software adaptation in the LabView code but had the advantage that no extra framegrabber was necessary anymore. The JVC camera has a resolution of 1,024 × 768 pixels but image processing was implemented at a resolution of 640 × 480 pixels. This approach is a reasonable compromise between precision and processing speed and simultaneously maintains compatibility with the external programs that are used for outline extraction and particle analysis (Knappertsbusch, 2015).
The software for System AMOR 2 was upgraded from the program AMOR v. 2.8 (programmed in LabView 8.5) to AMOR v. 4.2 (programmed in LabView 14). LabView codes for both programs are provided as electronic supplements to this study. The subdivision in a manual mode, in an automatic mode, and in the calibration mode remains the same in both versions. In AMOR 4.2, the graphical user interface (GUI) in the manual mode was extended for scripting, and several core functions were modified. Descriptions of these functions and software codes are given in the diploma and master studies of Herzig and Schmutz (2007), Stapfer (2007), Widmer (2008), Oegerli (2015a,b), and technical reports of Schorpp (2010, 2013), and Eisenecker (2020). All these documents are unpublished but were archived and accessible from the NMB upon request. It is worth remembering in this context that reading the LabView code requires access to commercial LabView software and vision and motion modules from NI.1 A brief survey of the functions of the program AMOR 4.2 is provided in the following section.
Manual Mode: Core Functions of System Automated Measurement System for Shell mORphology 2
Routine works in the manual mode of System AMOR 2 are directed via the “Settings singlemode” panel and the “AMOR” panel (Figure 6). In the settings panel, coarse (100 motor steps per mouse click) or fine (10 motor steps per mouse click) can be set for all moving (translation, tilting, focusing, and zooming) components (Figure 6A). The user can select the size of the slide (e.g., standard slides with 36 or 60 fields or a custom slide), and it is possible to choose between algorithms for orienting a symmetrical or asymmetrical profile. In the AMOR panel (Figure 6B), a live video image of the specimen is displayed. In the AMOR panel, all functions for particle positioning, orientation, magnification, focusing, and imaging are arranged as clickable buttons. At the top of the AMOR panel, there are output elements, which indicate the current state of the system (focus position and stage positions), and also other output elements that return actual measurements of particle size (see captions in Figure 6B).
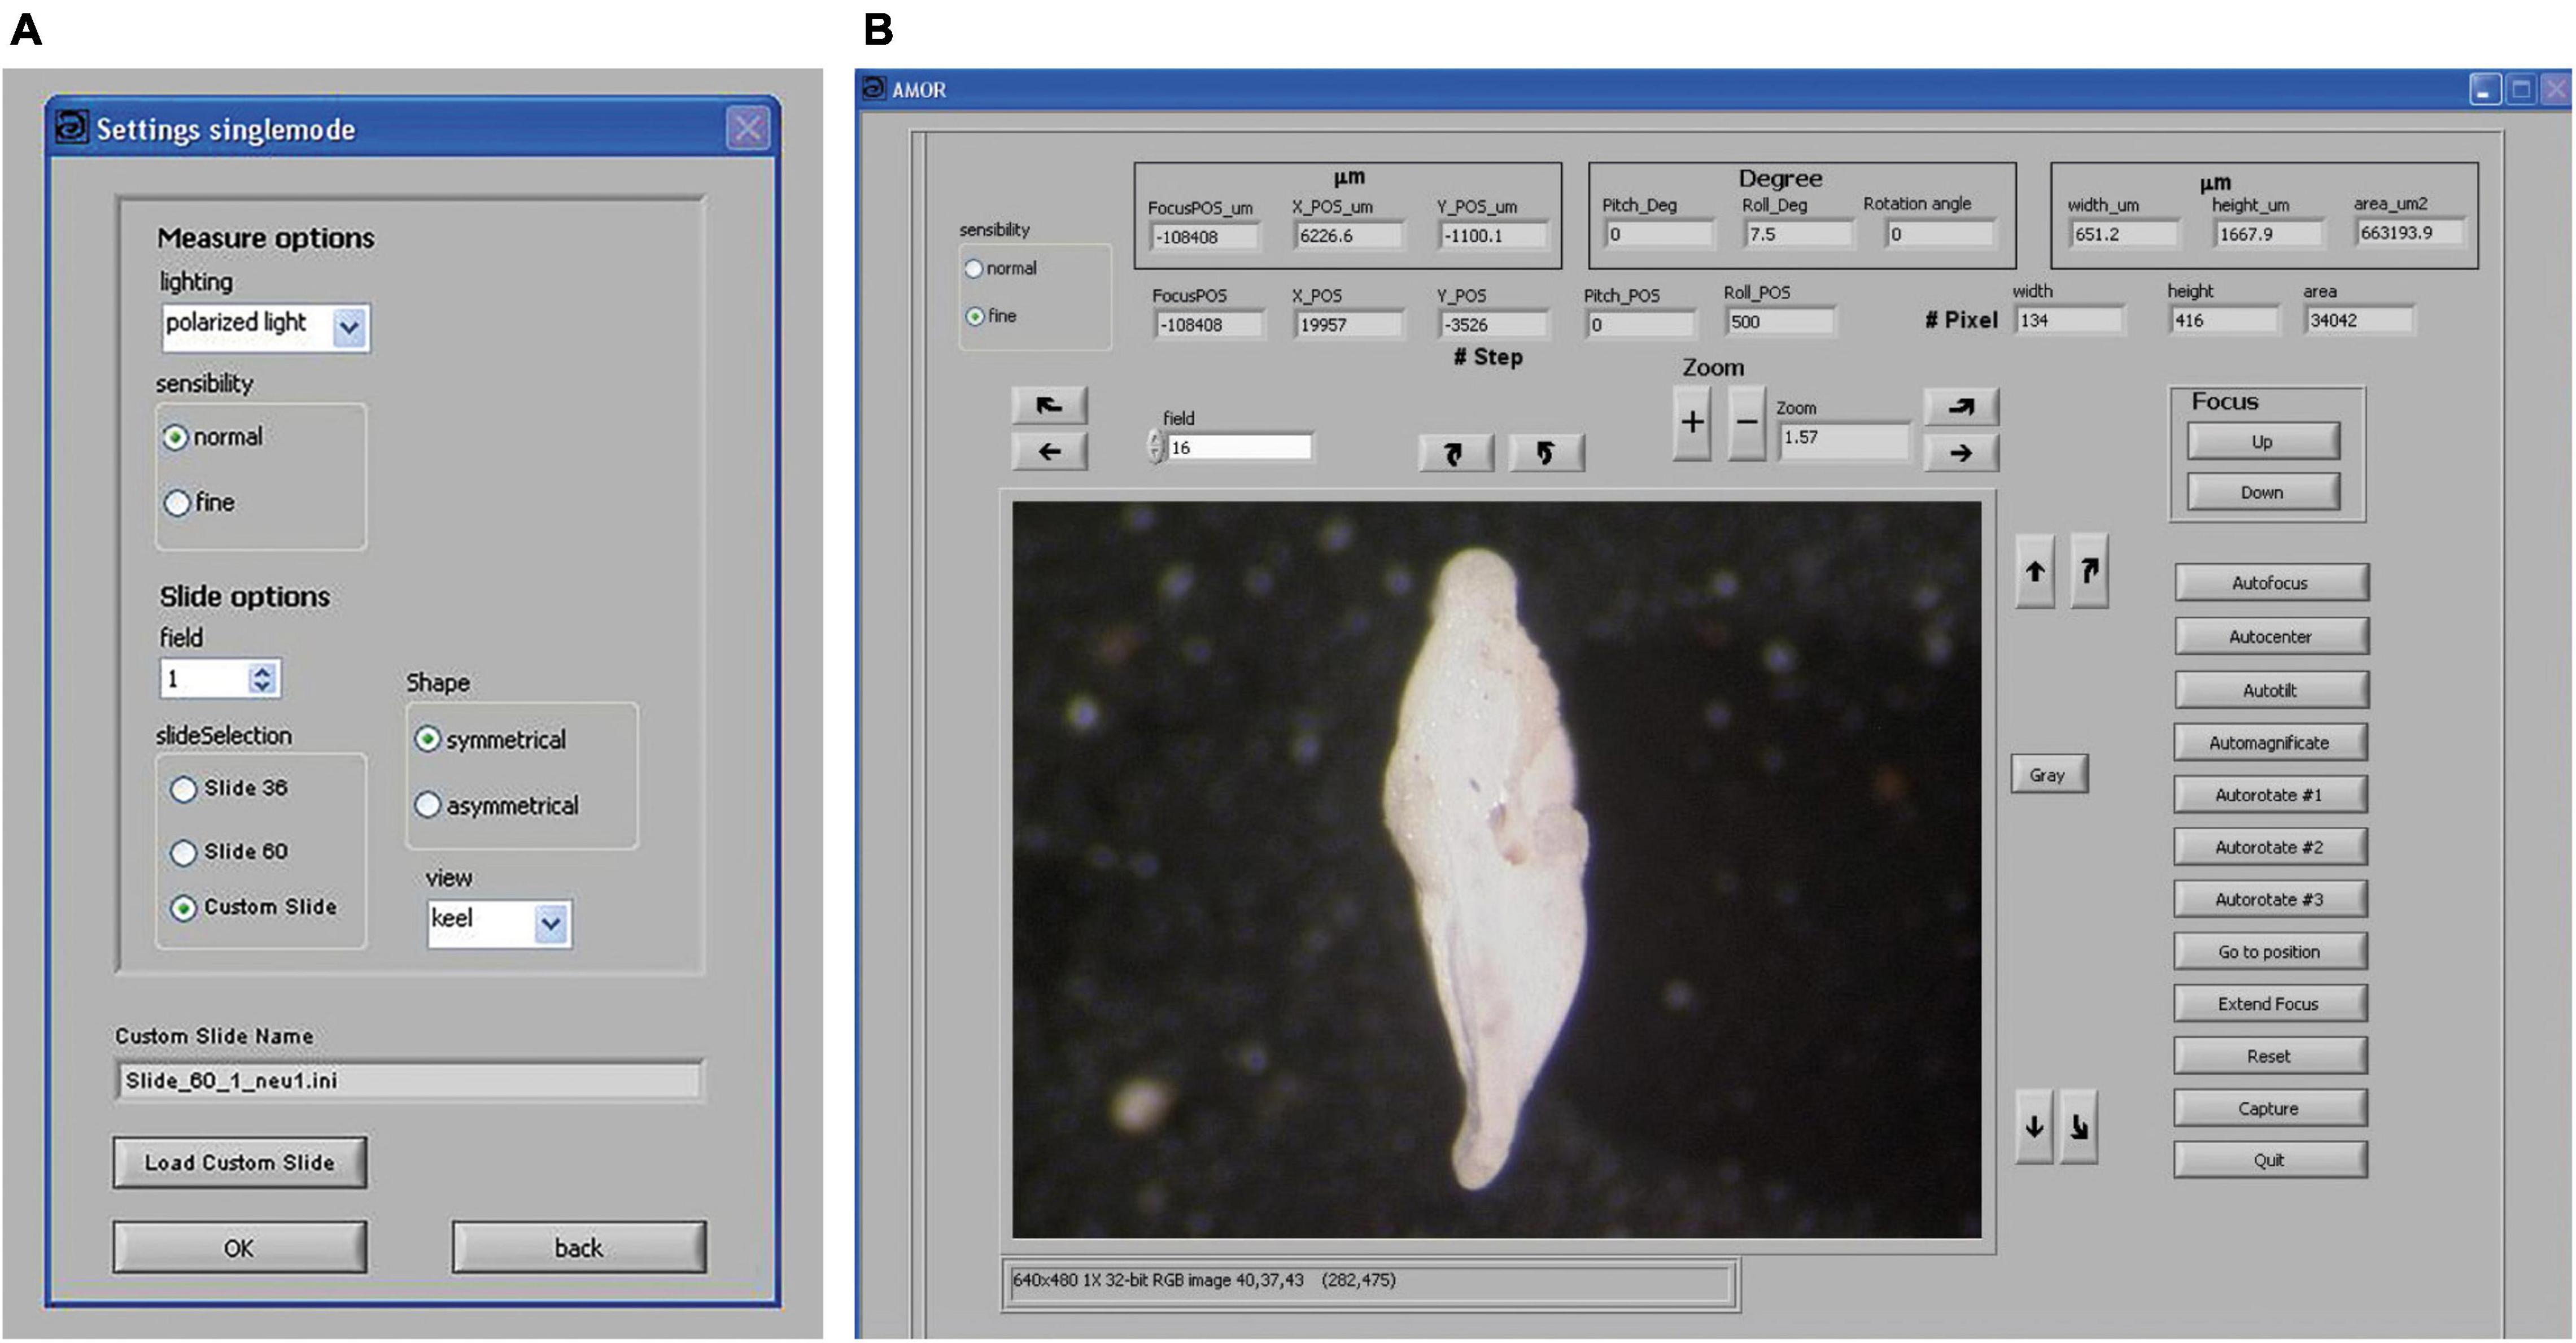
Figure 6. Graphical user interface (GUI) in System AMOR 2. (A) Settings for the manual mode. (B) GUI for working in manual mode. Right above the video image, there are buttons for horizontal translation of the stage in the X direction (straight arrows), tilting left/right (Roll) (curved arrows), zooming in and out (“+” and “–” buttons), and soft rotation of the specimen (a pair of curved arrows on the left side of the zoom button). Next to the video image on the right-hand side, there are buttons for translation of the stage in the Y-direction (straight arrows), tilting forward/backward (Pitch), and for toggling between a color image and a black/white image (“Gray”). On the outer right side of the AMOR panel, buttons are for focusing up and down, and more complex functions like Autofocus, AutoCenter, AutoTilt, Automagnificate, three options for AutoRotate, Go to Position, Extend Focus, Reset, and commands for image capturing and Quit. The top row of the AMOR panel (three boxes from left to right): The left box returns the focus position and X and Y coordinates of the centroid of the particle, all in μm or motor steps. The middle box returns inclinations (Pitch, Roll) of the stage and the soft rotation angle of the particle. The right box returns spiral height (width), axial length, and the area of the particle. Note that the illustrated specimen is shown in the “North–South” orientation (see text).
Selected Core Functions
Horizontal Translation in X and Y Directions
A horizontal translation moves the stage in stepwise X and Y directions using the mouse clicks. Step intervals can be chosen between normal (100 motor steps per mouse click) or fine resolution (10 motor steps per mouse click). Alternatively, a position in the slide can be addressed by entering a number in the “field” on the AMOR panel. These functions are also implemented in the “calibration mode,” which allows their customization to the different types of slides (36, 60, or other fields).
Pitch, Roll
The Pitch function tilts the stage in a forward or backward direction using mouse clicks, while Roll allows for left-right tilting. The resolution is 0.015° per motor step for both tilting axes. Both functions can be operated at normal sensibility (100 steps per mouse-click, 1.5° per click) or fine resolution (10 steps per mouse-click, 0.15° per click). Due to the limited working distance of 6.5 cm between an objective and the specimen in focus, a maximum tilt angle of ±22.5° is possible.
Zoom
The magnification of the MZ6 microscope can be reproduced using the exponential function
MAG is the magnification (between 0.63× and 4×) and STEPS denotes the number of motor steps. The constants a and b were experimentally determined: traveling from the MAG = 0.63× mark to the highest mark (4×) at the zoom unit, 206 ± 1 motor steps are required. This translates into a value for a = 0.63 (STEPS = 0, start position) and a value for b = 0.003975 (STEPS = 206, end position). With these constants, the standard positions for magnifications at 0.63×, 0.8×, 1×, 1.25×, 1.6×, 2×, 2.5×, 3.2×, and 4× of the microscope can be reproduced in intervals of 26 motor steps from one mark to the next (Int (206/8) = 26 steps). The uncertainty of ± 1 steps (e.g., an uncertainty of two motor steps) leads to a maximum deviation in the magnification of 0.07476 at the position 4× or 1.9%.
Focus and Autofocus
Focusing is implemented in two different ways. Manual focusing can be done by mouse clicks, which move the microscope stepwise up or down (z-direction). The resolution of the motorfocus is 1 step per μm. Focusing can be toggled between 10 μm vertical displacement per mouse click (sensibility = fine) or 100 μm vertical displacement per mouse click (sensibility = normal). Automatic focusing can be realized with the function AutoFocus. By clicking on the respective button, the microscope moves from a fixed vertical z-level slightly above the bottom of the slide in the + z or –z-direction and compares the increase in gray-level variance. This is iterated at decreasing z intervals until the variance is maximized (sharp condition).
Automatic orientation requires that the specimen remains to be in a eucentric position during tilting, e.g., the specimen may not vertically leave the focal range (depth of focus) during this process. For specimens smaller than ca. 100 μm, a starting level closer to the specimen can be set to avoid overfocusing.
When re-focusing in an orientation loop, the magnification may not be too high, so that the specimen remains inside the video frame. Simultaneously, the depth of focus needs to embrace the specimen. If the depth of focus is too narrow, only a slice stays in focus, and the rest of the particle is out of focus; therefore, keeping in mind the depth of focus is approximately an inverse function of magnification (Knappertsbusch et al., 2006). Overall, single steps in z result only in a small enhancement of local sharpness, but focusing is getting better soon, as long as the particle lies within the range of depth of focus. To support an automatic orientation, the size ranges of specimens should not be too different in a slide. If a large size disparity is observed in a sample, it is recommended to redistribute the specimens to two or more slides, each having particles with comparable size (for example, the distribution of specimens <100 μm in one slide and specimens >100 μm in another slide).
AutoCenter
The AutoCenter function moves the centroid of the microfossil into the center of the image. The microfossil is detected as the largest bright area in the video image (smaller bright spots may occur from reflections of light from the background or from dust particles). AutoCenter is essential during the orientation of the specimen and avoids the specimen moving outside the image during tilting.
AutoTilt
AutoTilt orientates the specimen into a standard keel position. It is a combination of the abovementioned core functions for horizontal X and Y translation, Pitch and Roll, AutoCenter, AutoFocus, and AutoMagnification. The condition for the keel position is met as soon as tilting of the specimen left–right (Roll) the surface area is minimized and after tilting of the specimen forward–backward (Pitch) the longest diameter is maximized (see Figure 7).
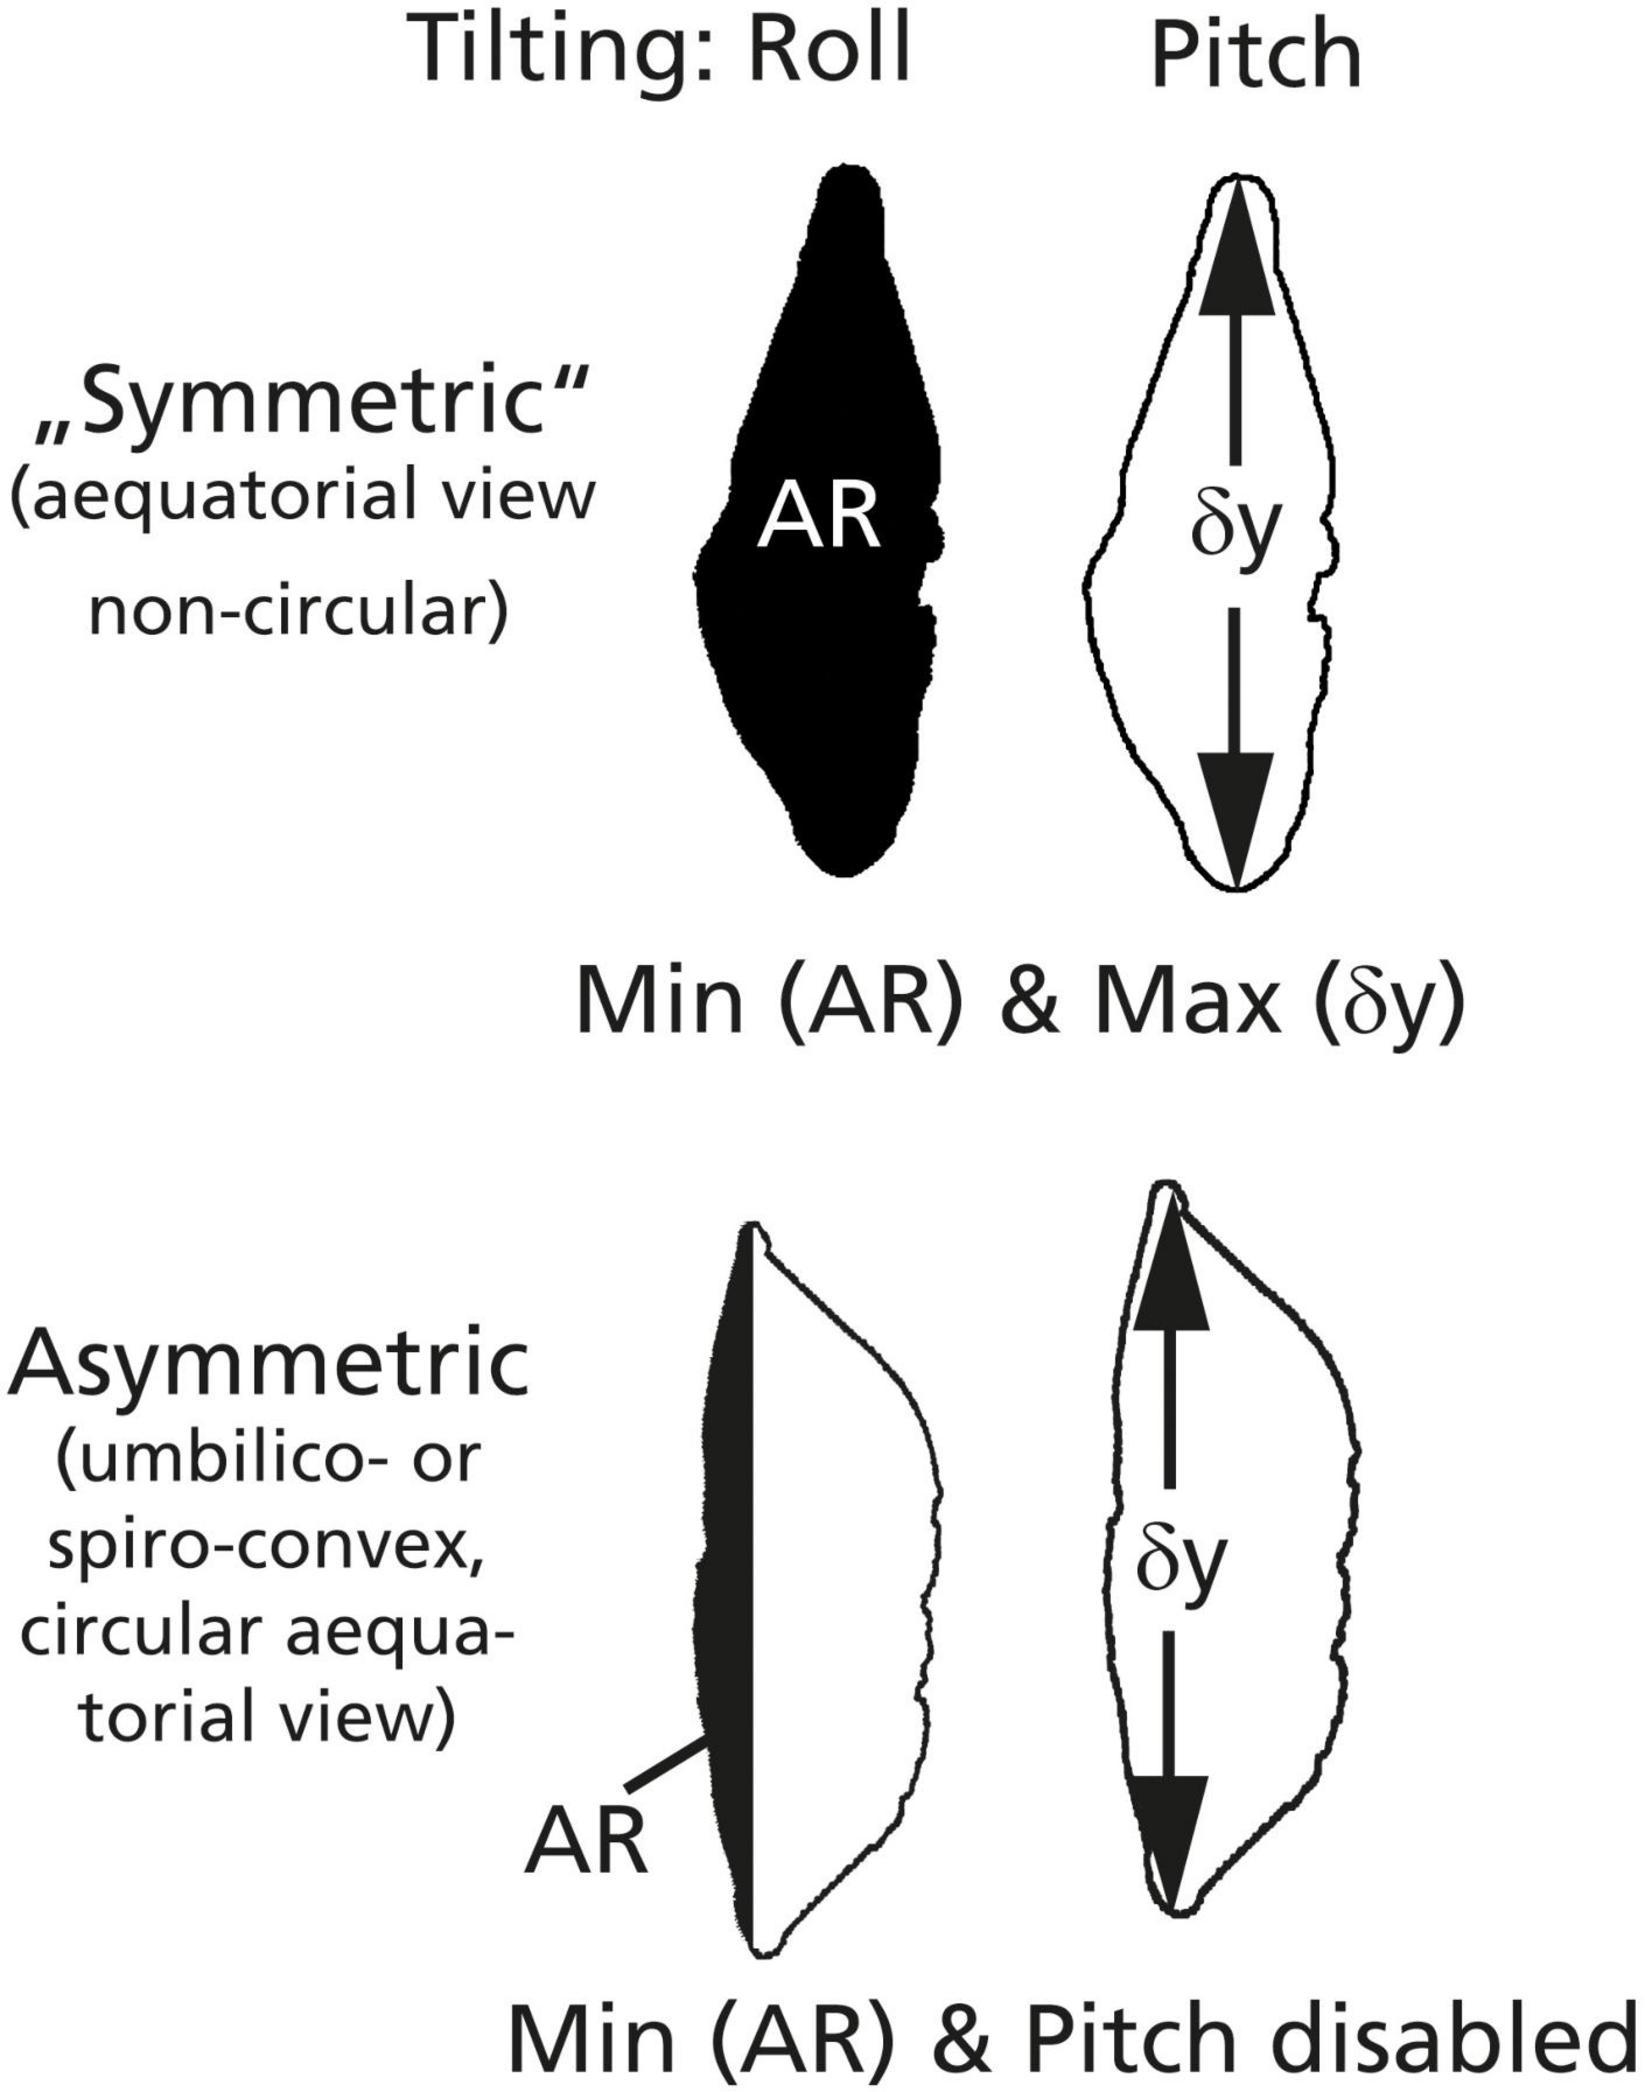
Figure 7. Scheme for the orientation of particles into keel positions. In a symmetric case (above), the particle profile is biconvex and quasi-symmetric and has a non-circular periphery in an equatorial view (as in G. menardii). The keel position is found if the profile area (AR) is minimized AND if the longest diameter (δy) is maximized. In an asymmetric case (Globorotalia miocenica, below), the spiral side is very flat and the shell has an almost circular periphery in an equatorial view. The keel position is found by minimizing the partial area (AR) on the spiral side, while the Pitch is disabled because δY is invariant.
The method works the best if the specimens in the profile view are biconvex and quasi-symmetric, and in the absence of a circular periphery in an equatorial view. These conditions are met in G. menardii (symmetric case, Figure 7). It also works with Globorotalia limbata and Globorotalia multicamerata as long as the outline in an equatorial view remains oval. AutoTilt works also to satisfaction with G. tumida if there are no flexed final chambers. If G. tumida develops a flexed final chamber, orientation is not possible anymore. If profiles get asymmetric, the alternate asymmetric mode of AutoTilt can be selected. This is the case in G. miocenica (plane spiral side and circular outlines in an equatorial view), where maximizing the longest diameter will fail, but the shell can be oriented in a side view by minimizing the partial area on the spiral side (see Figure 7). For practical work, it is advised to prepare slides with either symmetric species or asymmetric species.
Automagnificate
The Automagnificate function increases the zoom in intervals to the maximum possible magnification, so that the specimen fills the video image without touching the border. It is standardly applied after AutoTilt has oriented the specimen.
Autorotate
Autorotate soft rotates the specimen on the computer monitor in clockwise or anticlockwise directions into the “north–south” orientation, which is useful for later outline analysis. In old AMOR, only a single function for rotation exists, which applies the image momentum as the rotation method (Figure 8). With this method, perfect north–south orientation is only possible if the profile of the specimen exhibits true lateral symmetry. In reality, this seldomly occurs, even not with typical G. menardii. The consequence is that after rotation the specimens still appear to be slightly oblique on the monitor while the ferret diameter (the line connecting the tips of the upper and lower keel region) is perfectly vertical. This behavior is due to the curvature of the tips of the final chamber and a slight twistedness of the trochospiral shell of G. menardii in a side view, leading to unequal profiles of opposite keel regions (see Figure 8B).
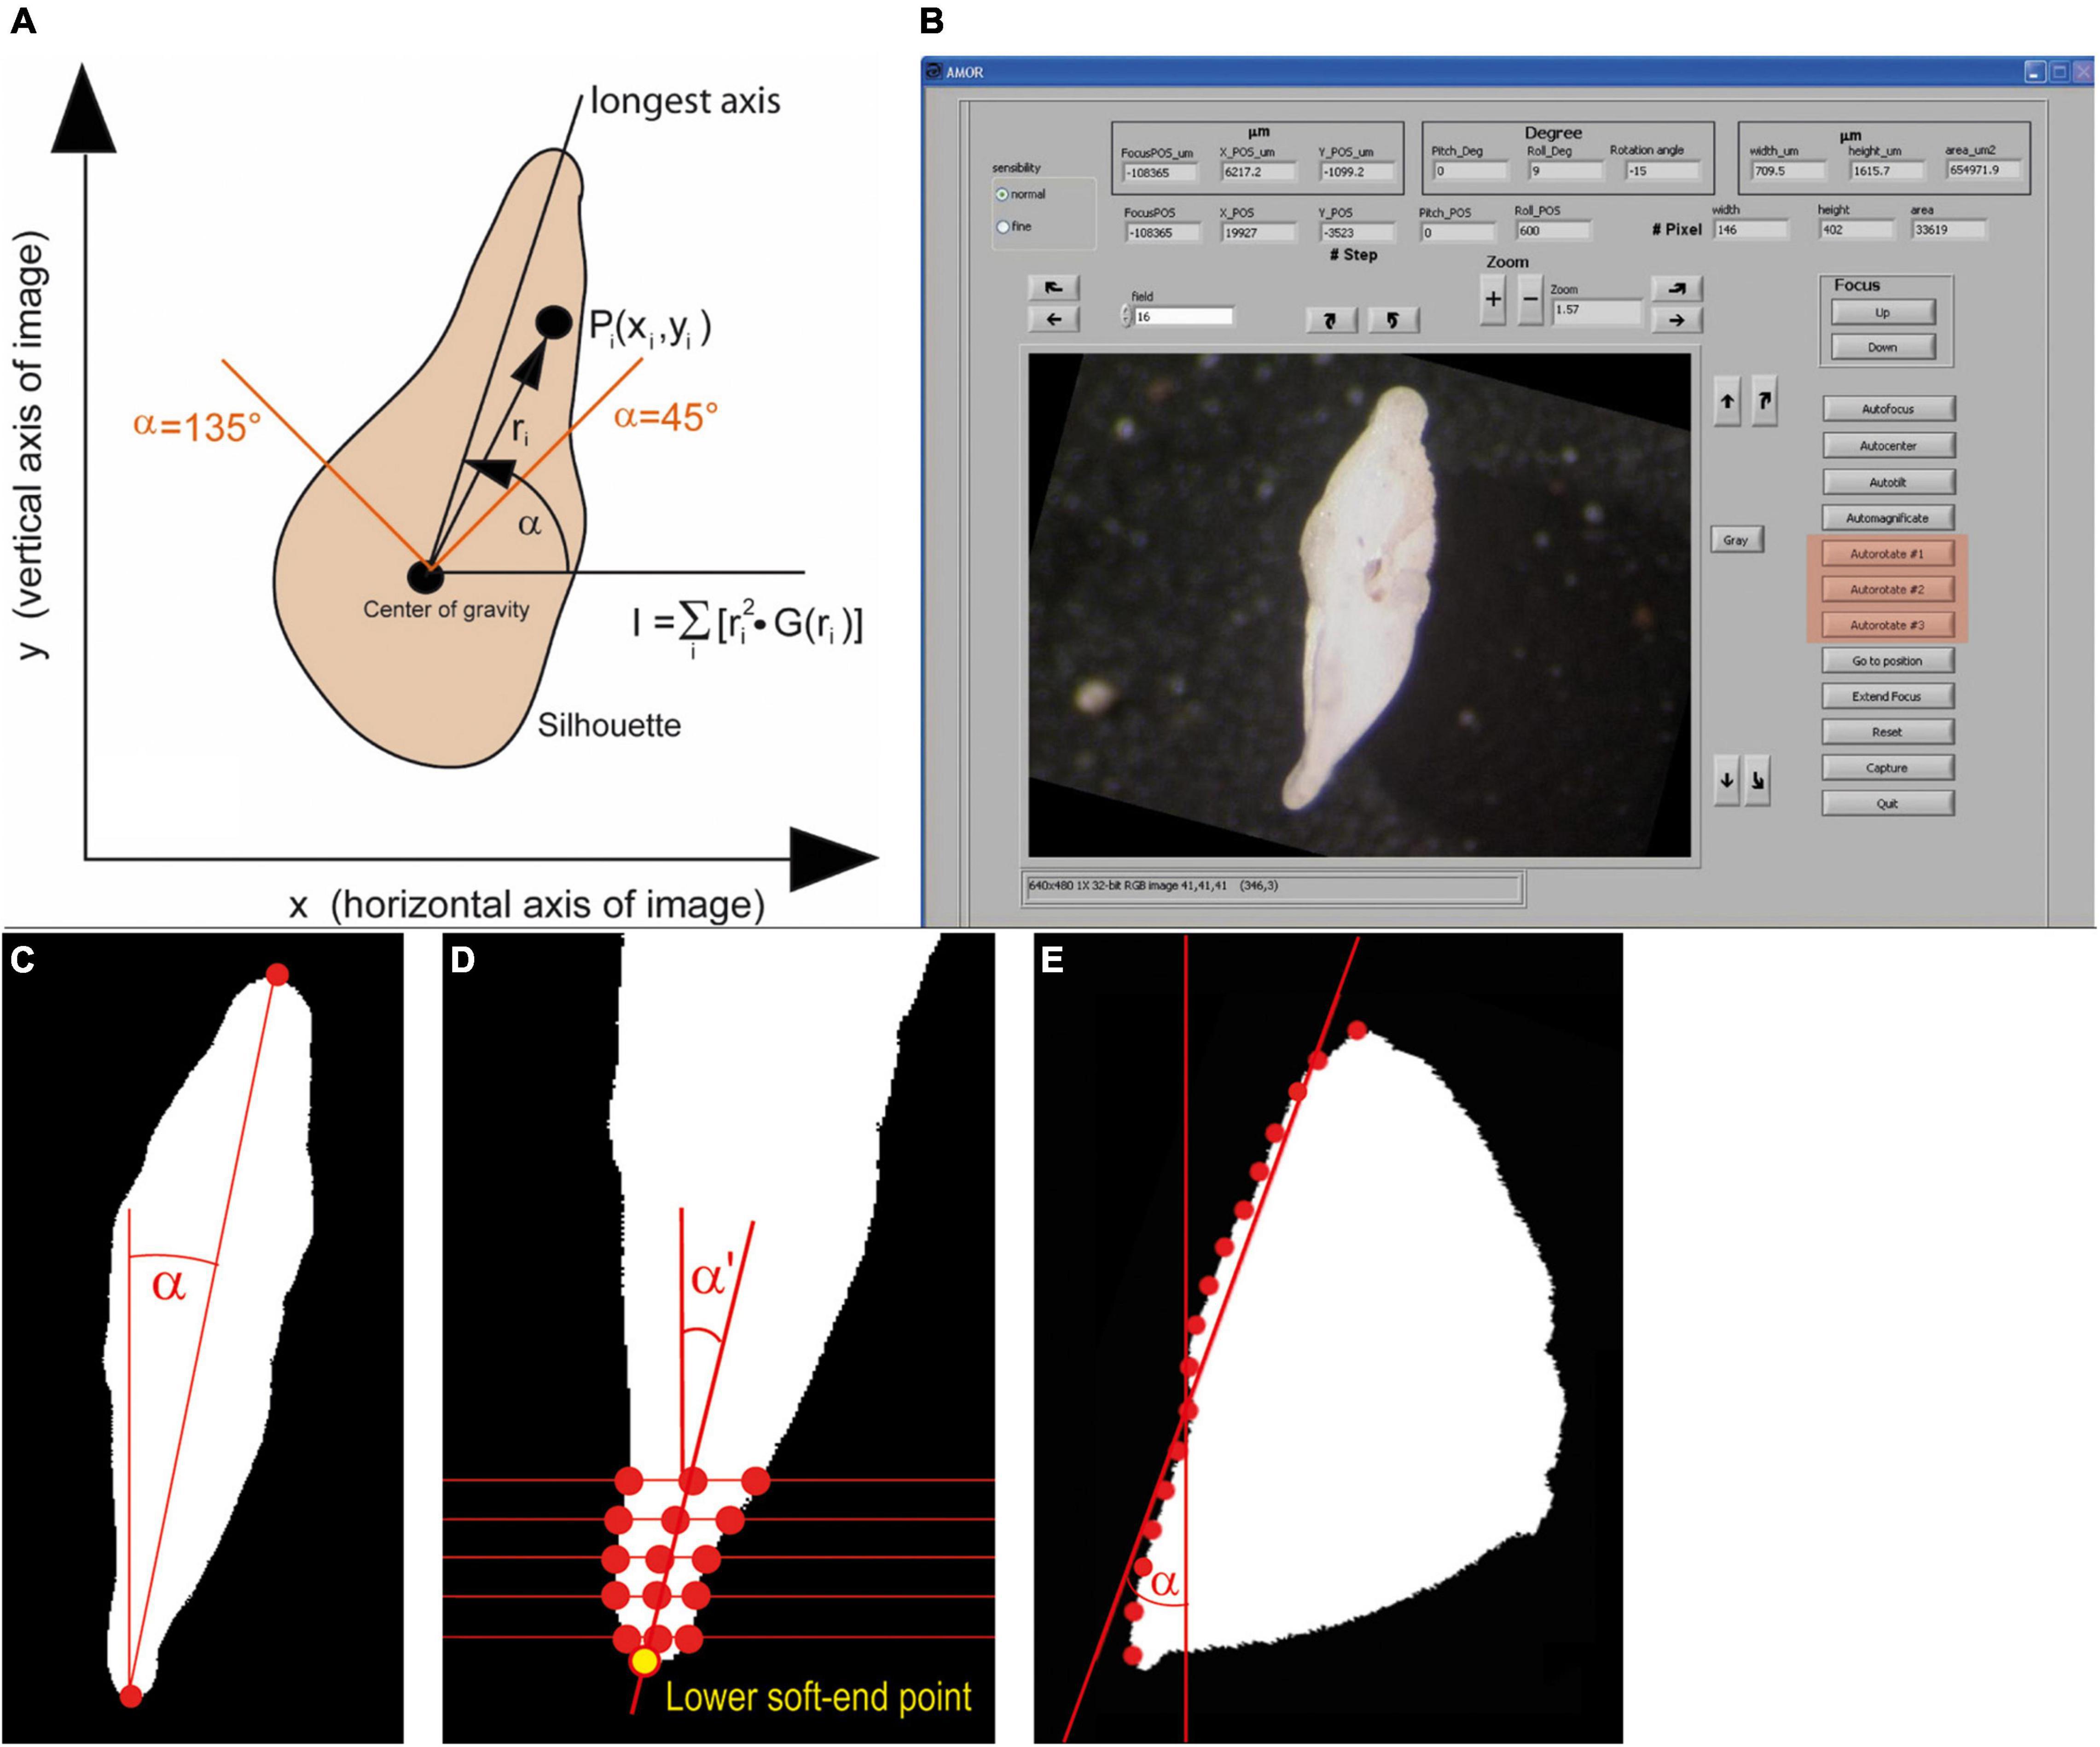
Figure 8. Autorotate function. (A) A diagram illustrating the image momentum method for rotation (an image from Knappertsbusch et al., 2009). (B) GUI of System AMOR 2 in the manual mode, with buttons for soft rotations highlighted in red (see also Figure 10). The illustrated specimen is in an oblique position (compared with the “north–south” orientation in Figure 6B). (C) Top–Down method. (D) Soft end point method, shown for the lower keel region. (E) Regression method. See text for further explanations. Panels (C–E) were redrawn after Oegerli (2015b).
In System AMOR 2, the image momentum method is implemented as Autorotate#1, but the two alternative rotation methods (Autorotate#2 and Autorotate#3) were added to overcome the abovementioned limitations (Oegerli, 2015a,b). In Autorotate#2, the tips of the upper and lower keel region in a side view are connected by a line (ferret diameter), and the rotation angle α is determined from the slope of that line (Top–Down method, Figure 8C). To compensate for the curvature in the peripheral chamber tips in a side view, the two extreme points in the upper and lower keel region are determined as soft end points (soft end method, Figure 8D). This method first calculates the midpoints between intersections of several horizontal lines through each keel region with the shell outline. Two regression lines are laid through upper and lower midpoints. Their intersection with the respective upper and lower periphery defines the upper and lower soft end point.
Autorotate#3 includes an adaptive rotation method depending on the general shape of the particle in a keel view (Oegerli, 2015b): First, the particle is grouped into three categories using a classification method, where categories are distinguished by linear regression and trained on 3,500 specimens. The three classes belong to a biconvex, quasi-symmetric outline (G. menardii in a side view), a tumid shape (G. tumida in a side view), or a highly umbilico-convex profile (G. truncatulinoides in a side view). The categories are characterized by the normalized distance between the centroid of the profile area and the center of the particle’s bounding box, also in a keel view. If a G. menardii profile is recognized, Autorotate#2 is applied. If the G. tumida profile is recognized, the slopes α and α′ determined by upper and lower soft end points, respectively, are calculated first. Thereafter, the slope β of the line connecting the lower soft end point and the point of the upper ferret diameter is calculated. The rotation angle is then determined as Min(α,β). If the G. truncatulinoides profile matches best, the intersection points of eight horizontal lines with the spiral side are determined (regression method, Figure 8E). The slope of the regression line through these eight intersections defines the rotation angle α for orienting the particle “north–south.”
However, for specimens such as G. menardii flexuosa or G. tumida flexuosa with strongly bended final chambers, none of the abovementioned rotation methods work and lead to an oblique representation of the particle on the video image.
Capture
By clicking the capture button, an 8-bit gray-level 640 × 480 pixel image in the Tiff format is saved to a disk. In the manual mode, the file name must be entered manually and the final magnification must be read from the zoom field. In the automatic mode, images are written to a disk together with a text file called list_of_files. The latter records the field (XX), specimen number per field (01), and the final magnification returned by the program (MAG) in the format XX01,MAG. During morphometric studies on G. menardii, imaging was carried out mostly at magnifications from 2.5× to 4×. Using old AMOR, the resolution was then between 3.1 μm × 2.5 μm per pixel to 1.9 μm × 1.6 μm per pixel. With a new System AMOR 2, the resolution at those magnifications ranges from 1.9 μm × 1.9 μm per pixel to 1.2 μm × 1.2 μm per pixel.
Automatic Mode
When the automatic mode is chosen, core functions are executed in a fixed sequence allowing the orientation of a series of specimens. To process a slide in the automatic mode, a first mask opens, where several parameters (for example, slide type, error handling, the selection of symmetric or asymmetric shapes, the path and name for the imaged files, the application of soft rotation, extended focus, and some formatting of images) can be set (Figure 9A).
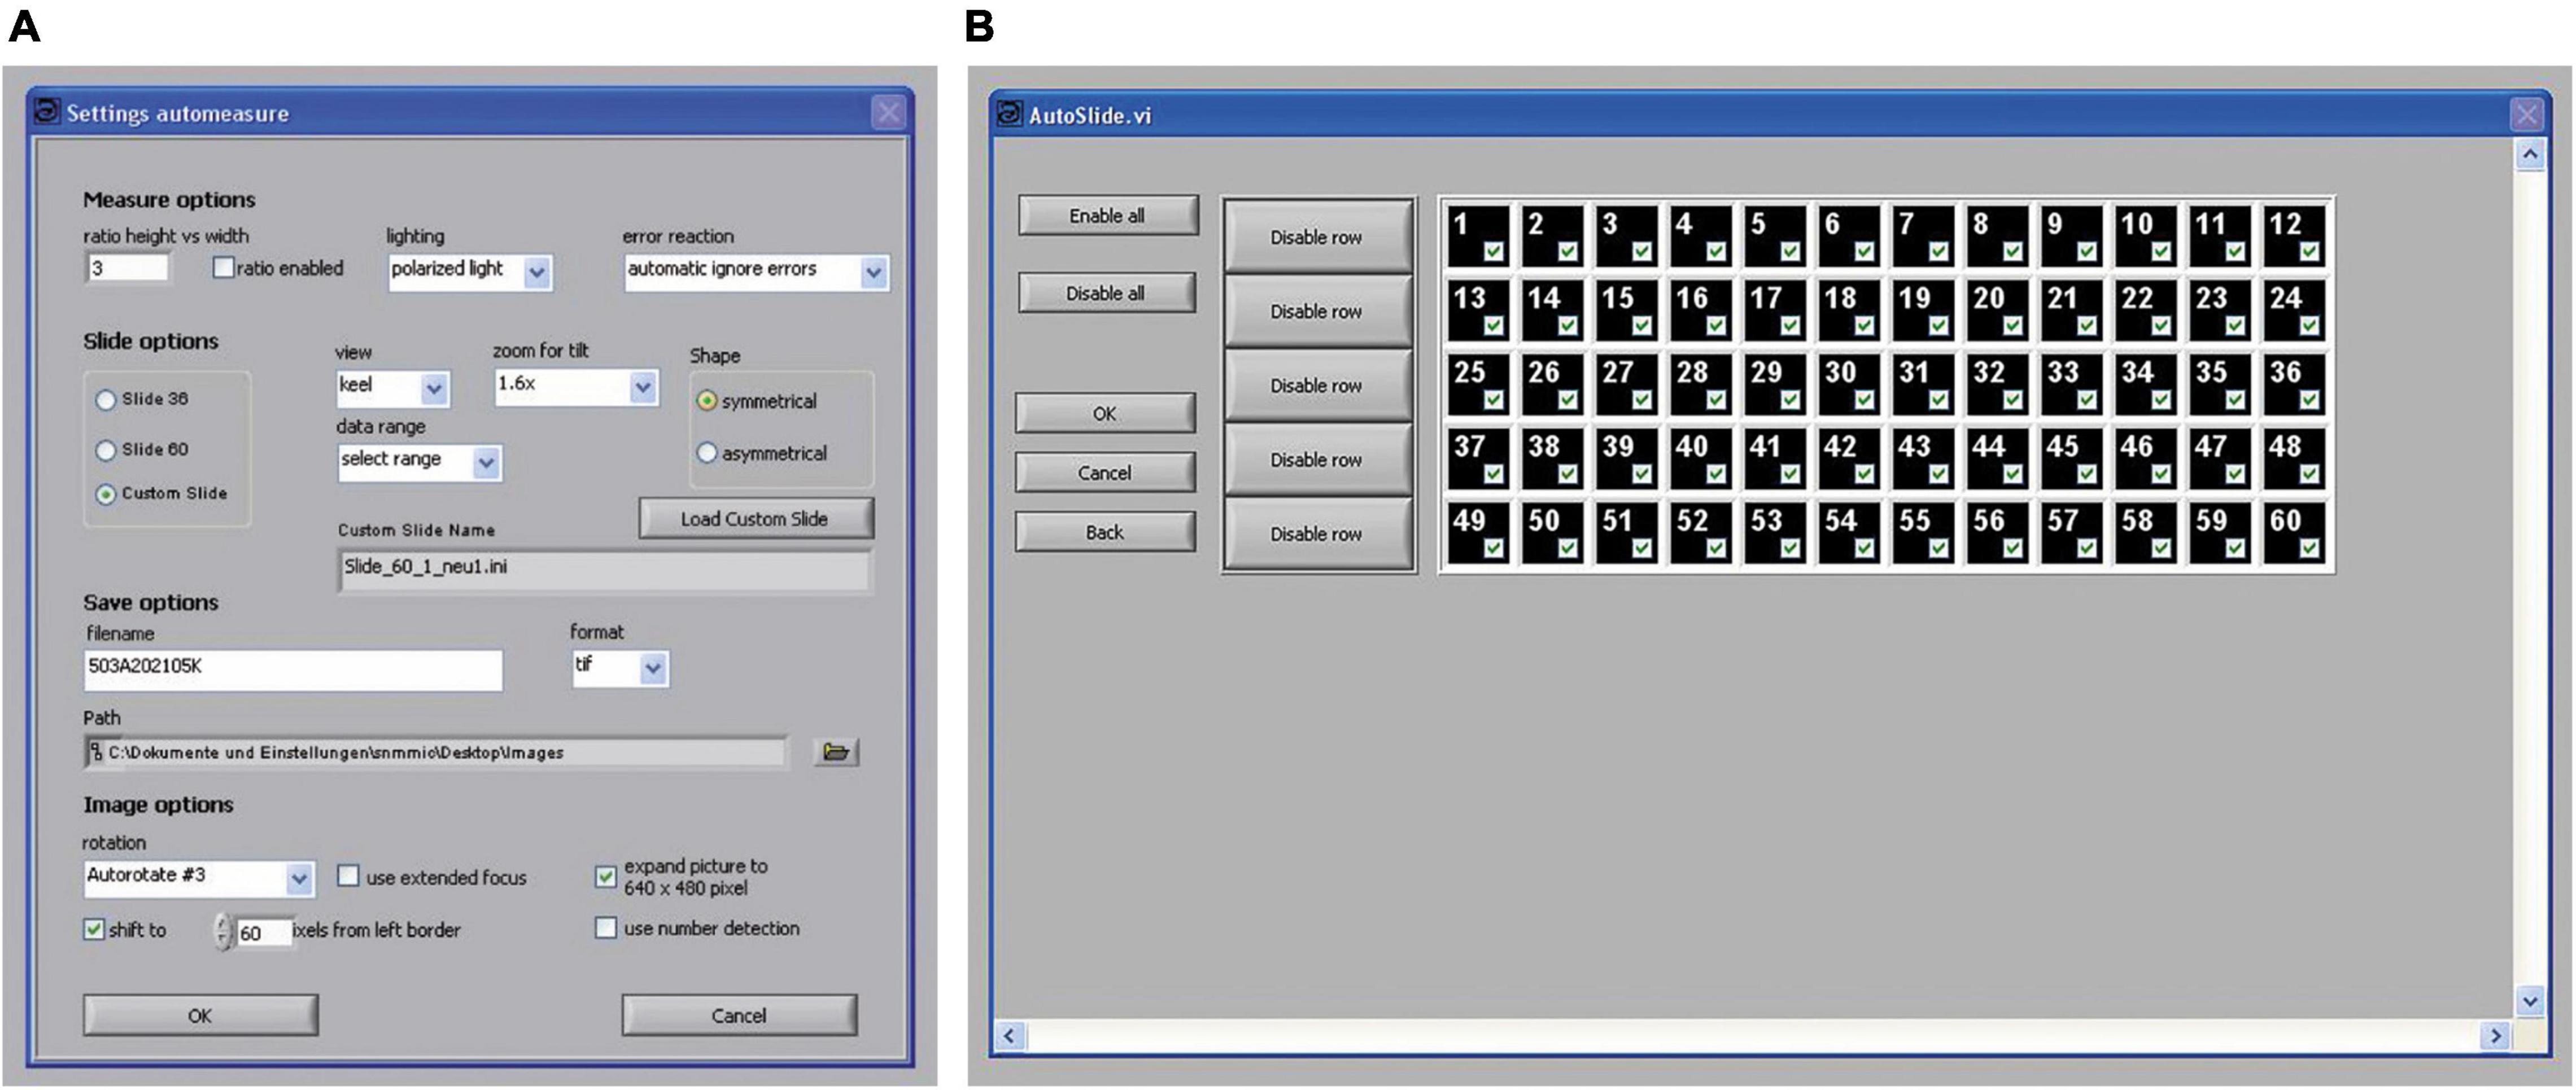
Figure 9. Control panels of the program AMOR 4.2 in the automatic mode. (A) A panel for setting parameters in the automatic mode. (B) A panel for the selection of fields of the slide shall be processed. Each of the numbered fields can be selected separately by mouse clicks.
In the pull-down menu “data range,” the option “select range” can be chosen, where particular fields of a slide can be checked for treatment (Figure 9B). This enables the user to process fields selectively giving flexibility for batch processing of slides. For example, one may occupy some rows in a slide with rather large specimens, so that they can be serially treated at low magnification, while the remaining fields with small specimens can be processed at a higher magnification. Such a specimen arrangement facilitates automatic processing. After all specimens are imaged, a text file called list_of_files is written to the disk containing the image file names and respective final magnifications.
In the program AMOR v. 2.8 and its older versions, Pitch and Roll in function AutoTilt are coupled and the orientation of a specimen in X and Y directions occurs in a fixed sequence. In the new System AMOR 2, tilting functions are uncoupled, which allow to either Pitch or Roll the stage, or to use both directions combined. This opens new possibilities for System AMOR 2 to be used as an imaging bot without tilting, for example, when recording microfossils in Plummer cells from museum collections.
Imaging Resolution and Derivation of Measurements
After image collection, the enhancement of images is done using ImageJ or Adobe Photoshop. For a rapid derivation of morphometric parameters, a suite of self-written external Fortran programs (MorphCol—see Knappertsbusch, 2015) is used. Examples and workflow are described in Knappertsbusch (1998, 2007, 2015, 2016, 2021a, 2022), Knappertsbusch and Mary (2012), Mary and Knappertsbusch (2013), and Mary (2013). For outline extraction, the batch program Trace_AMOR2_batch.out was applied when using the old AMOR with the Sony camera. For System AMOR 2 with the JVC camera, the version Trace_AMOR3_batch.out was applied (see Table 1). The conversion of pixels into micrometers and corrections of magnifications with these programs are described in Supplementary Appendix 1.
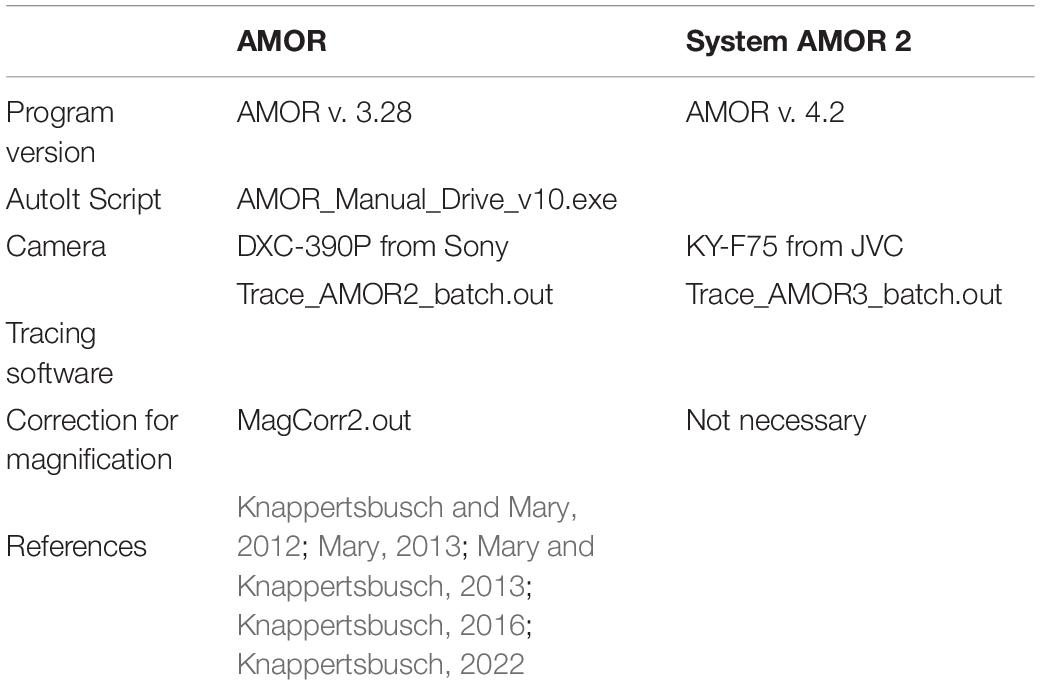
Table 1. Versions of outline extraction programs in combination with different imaging systems during morphometric studies of Globorotalia menardii at NMB.
Scripting Automated Measurement System for Shell mORphology
When working in the manual mode, the functions of the program AMOR v. 3.28 can be scripted using AutoIt v. 3. An elegant way was found to increase flexibility instead of following the fixed sequence of functions that are implemented in the automatic mode. AuotoIt v.3 is a freeware language for automating the Windows GUI (Bennett and AutoIt Team, 1999–2018). It uses simulated mouse movement or key strokes for window controlled manipulations such as the entry field or core function buttons that are embedded in the user interface of AMOR (see Figure 10). Such a script was for the first time created for an earlier version of AMOR by Mary (2013) and was adapted to run with the current program AMOR v. 3.28 (executable script called AMOR_Manual_Drive_v10.exe, see the section about documentation site for the development of AMOR and System AMOR 2). Core functions can be combined in any sequence, which enables creating specific scripts for the orientation of foraminifers and making AMOR a true robot. It relieves the user from reprogramming the sophisticated LabView code. Similar to the automatic mode, the abovementioned script includes a matrix of check boxes for selecting fields in a slide.
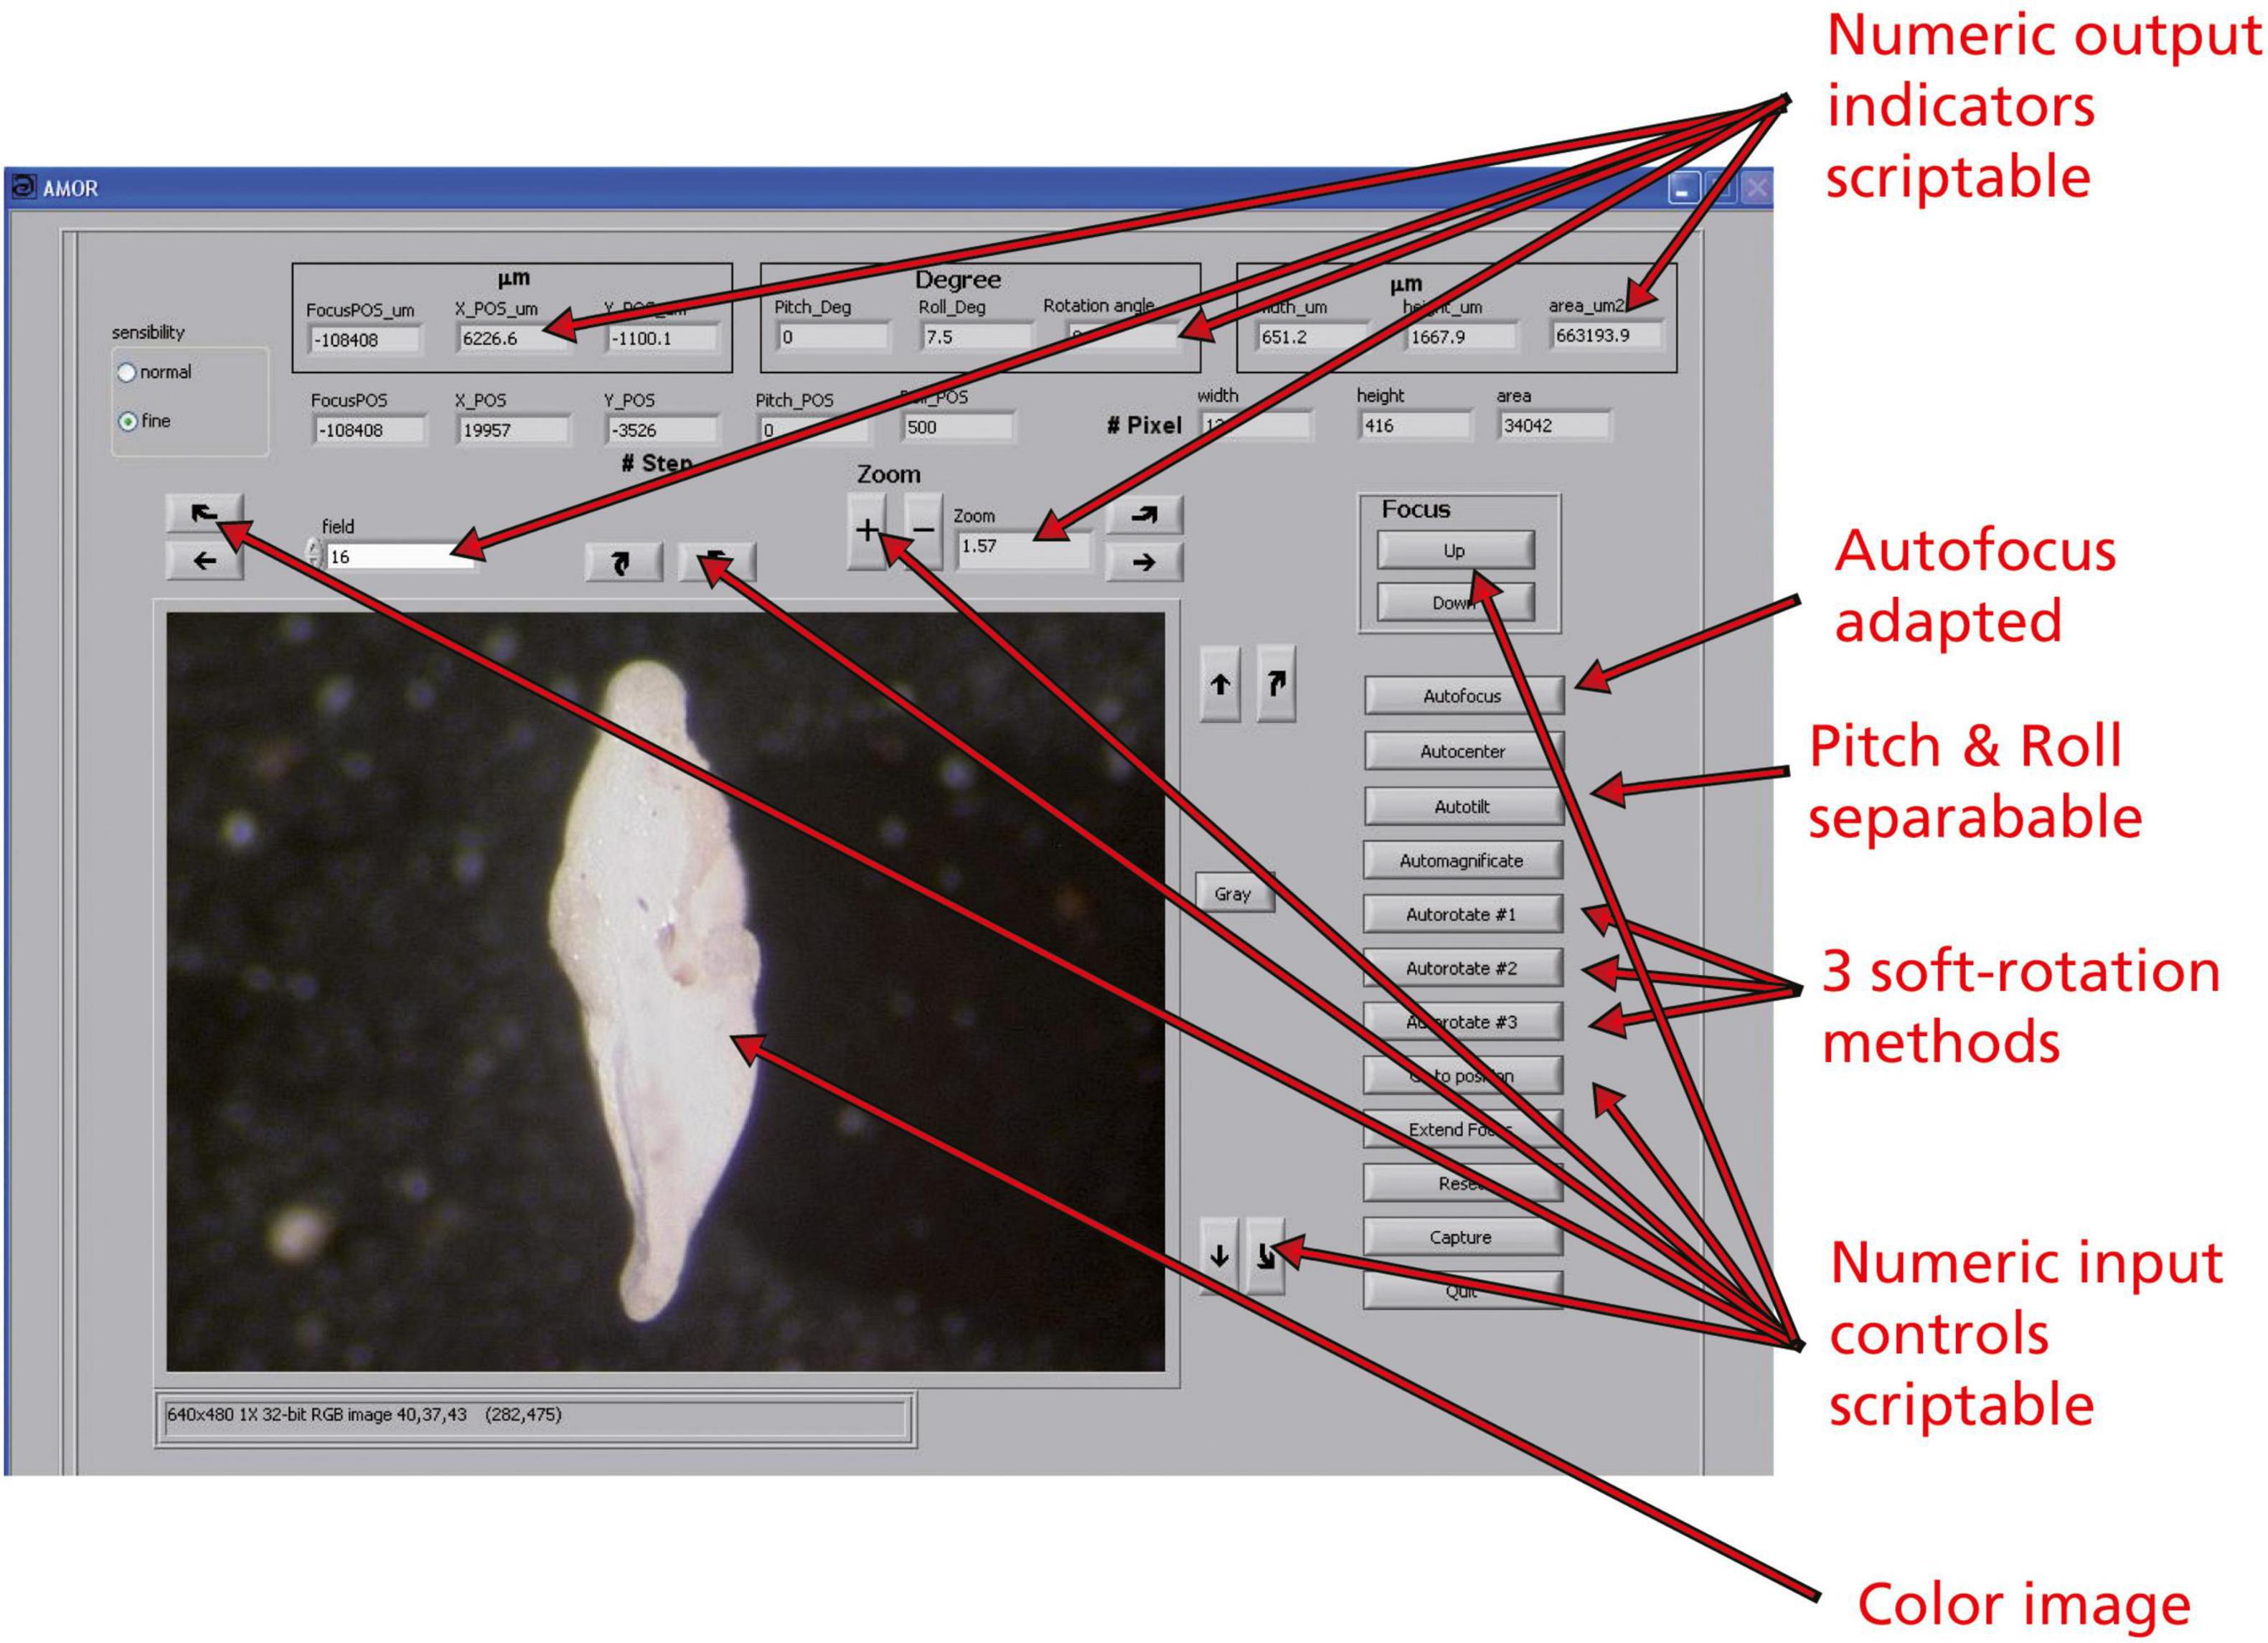
Figure 10. The user interface of the program AMOR v. 4.2 in manual mode. Boxes showing a number are numeric input controls or output indicators and are scriptable. Buttons are functions and are also scriptable.
Scripting requires that graphical output elements of AMOR are declared as numerical or character variables, or as an active image, which must be programmed in the LabView code. With scripting, complex and iterative tasks can be designed, even allowing the inclusion of continuously changing parameters during the process of orientation. Examples of changing output indicators are the current focus position (Z), X, and Y positions of the stage, angles of Pitch and Roll, or the rotational angle of the specimen. Also, morphometric parameters, such as spiral height (δX), axial length (δY), or the area of the particle in a keel view, are the output elements (see the upper two rows of numerical output elements in the user interface of program AMOR 4.2 in Figure 10). Numeric input controls are “field,” where the target field number in the slide can be entered, or “Zoom,” where the magnification can be controlled by pressing the “+” and “−” buttons next to it. The two radio buttons (“normal” and “fine” in Figure 10) are also input elements and allow choosing between fine resolution (10 steps per mouse click) or normal resolution (100 steps per mouse click) of motor movements. The remaining buttons are the core functions that all can be activated in the AutoIt script.
Intercalibration Experiment: Old Automated Measurement System for Shell mORphology vs. System Automated Measurement System for Shell mORphology 2
To evaluate the performance of old AMOR and System AMOR 2, an intercalibration experiment was carried out (Knappertsbusch, 2021b). The influence of changing magnification and the repeatability were explicitly tested. An inter-machine variation showed an excellent match of outlines from the same specimen: when the magnification was changed, the average deviation of outlines between old AMOR and System AMOR 2 was ± 2.44 μm (0.69% of the mean radius R of the specimen). Repeatability between old AMOR and System AMOR 2 (n = 15, constant magnification) is even better with ± 2.76 μm or an average deviation of 0.79% from the mean radius of the test specimen.
Discussion
Recommendations for Slide Preparation
Our automated Measurement system for shell mORphology needs optimum conditions, including perfect preparation of slides and ideal illumination for best functioning. If slide preparation was sloppy, the device would be unable to orientate specimens into a keel view. Supplementary Appendix 2 gives some recommendations in this respect for working with AMOR or System AMOR 2. It may be useful in other automated imaging systems for isolated microfossils in reflected light. Illumination is also very important because during orientation the angle of incident light and the magnification change affect the ratio of brightness and contrast continuously, and also influence particle segmentation from the background. At the end of imaging a series of slides, all collected images need to be quality checked for the recognition of failure in imaging, autofocusing, an uneven illumination, or a poor polarization.
Illumination
Illumination is a critical factor in automatic positioning, orientation, and imaging. If magnification is increased, light intensity becomes more attenuated, making imaging more difficult. If the specimens are very small (<100 μm, or above the zoom level of 3.2×), the manual mode of AMOR in combination with the AutoIt script AMOR_Manual_Drive_v10.exe works better than the automatic mode of AMOR because focusing cycles, the magnification, and the insertion of waiting periods can be optimized in the script if necessary (see the recommendations in Supplementary Appendix 2). In such a case, only slides containing exclusively small specimens should be used.
When tilting angles become too steep, reflections of incident light on the black slide background may appear regardless of polarization. This can disturb automatic orientation because bright pixels are combined to larger oversaturated areas/blending in the video image. In such a case, the angle of illumination needs to be manually changed. To overcome oversaturated areas, a special frame with fixed LEDs that moves and tilts with the sample was constructed [“Lagrangian illumination” of Schneider and Chalençon (2012) and Knappertsbusch (2012)], see Figure 11. With this arrangement, the angle of light rays remains constant during tilting relative to the specimens.
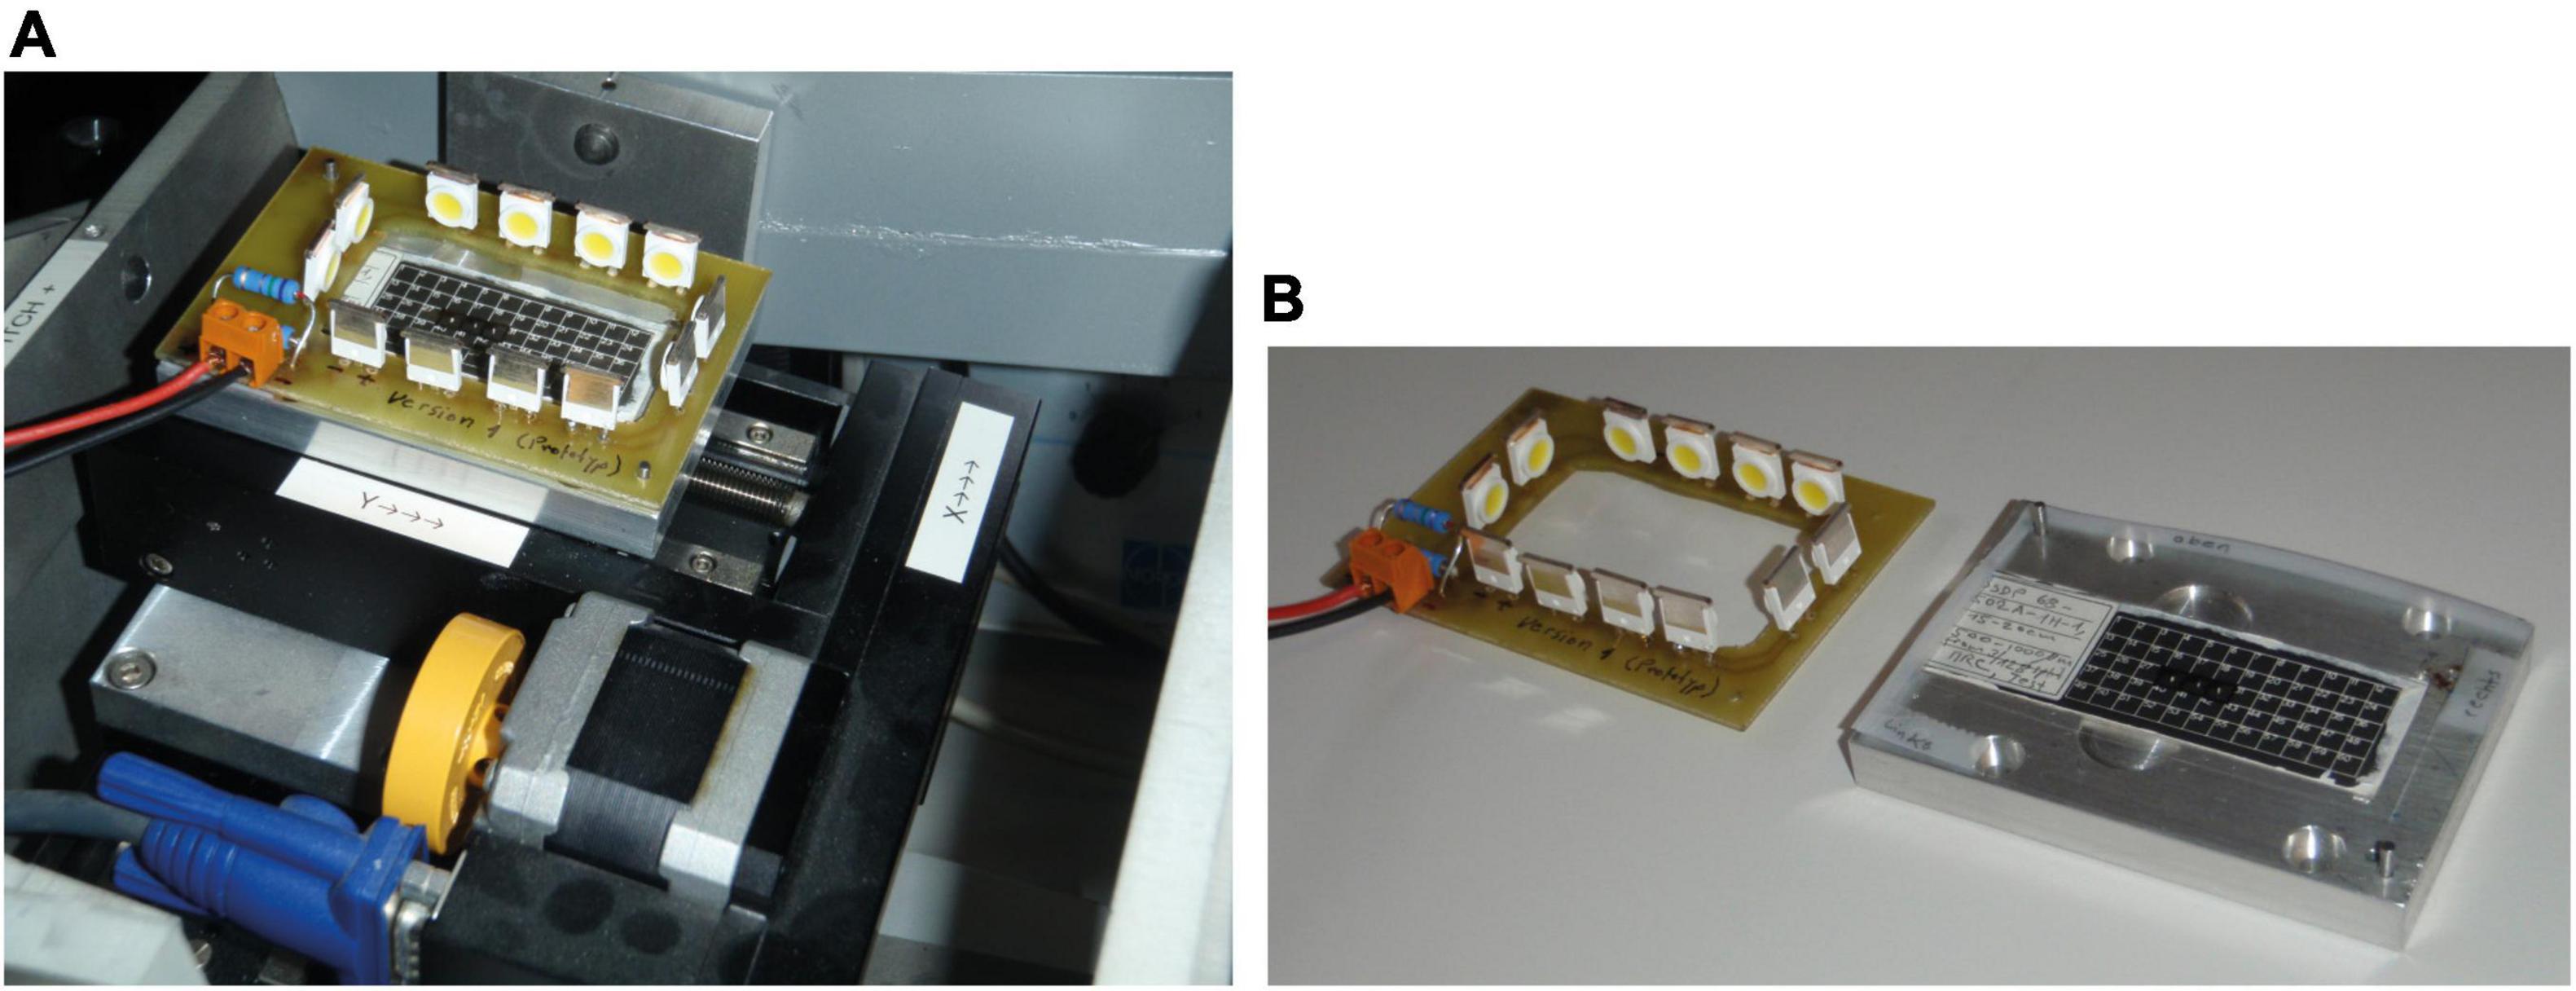
Figure 11. “Lagrangian illumination.” (A) Lagrangian Illumination mounted on the stage of AMOR. (B) Langrangian Illumination disassembled, showing LEDs on a circuit board and the sample holder plate with an inserted multicellular slide. When mounted, an insulating foil is placed in between the sample holder and circuit board to avoid a short circuit.
Potential for Improvements in Automated Measurement System for Shell mORphology: Complexity vs. Speed
During automatic orientation, autofocusing on the same specimen is often called several times, which slows down the processing of an entire slide. An increase in efficiency was attempted by the implementation of adaptive autofocus in the LabView code. To realize this, autofocusing begins with a few, coarse vertical steps, and then iteratively reduces vertical steps as local sharpness is approached (as opposed to focusing on the object in narrow, but constant vertical intervals, which is slow). Minimization of iterations was done experimentally so that focusing does not get exceedingly long.
An unexpected difficulty was vibrations after acceleration pulses during focusing. These vibrations were eliminated by implementing a few milliseconds of waiting periods so that the optomechanical system can dampen out. Repeated waiting periods, however, inevitably slow down an automatic orientation.
Automagnificate function can be accelerated too if the size of the particle is measured before the final maximum magnification factor is estimated (currently, Automagnificate increases magnification in intervals, until the particle touches the image border, which is slow).
If one prefers scripting AMOR instead of using the automatic mode of the AMOR program, sequences of scripted functions must be carefully evaluated, so that unnecessary repetition of focusing loops during automatic orientation of specimens is avoided across a full 60-specimen slide.
Limitations of Automatic Specimen Orientation
Our work with AMOR on thousands of foraminifers has revealed that orientation algorithms are to some extent species-dependent. This finding is no surprise though, thereby possessing implications for the analysis of morphological transitions between closely related species. In this context, consider Orbulina universa, a planktonic foraminifer developing a spherical (or nearly spherical) final chamber covering all previous growth stages:. In this case, any orientation by tilting the specimen will obviously fail. As soon as bisphericity or trisphericity is developed (such as in the phyletic series of Globigerinoides trilobus–Biorbulina bisphericus–Praeorbulina glomerosa–Orbulina suturalis–O. universa), orientation becomes more feasible because the shell outline gets elongated. Experimentation with G. truncatulinoides, an extremely umbilico-convex form with a flat spiral side showed that simply minimizing the general profile area is not sufficient for orientation into a keel view, which is different from G. menardii. In Globorotalia miocenica, another umbilico-convex form, a way for orientation into a keel view was found by using only one of the two partial areas of the profile instead of using the entire area (see the section AutoTilt). Machine orientation of morphological end members, therefore, requires specifically tuned algorithms. This situation may pose a conundrum for the investigation of evolutionary transitions at an end member of a phyletic lineage, and required algorithms may differ from ancestral to descendent morphotypes. It juxtaposes us with a methodological break during the analysis of a morphological continuum of transitional forms. It remains the task of the investigating taxonomist to identify the suitable parameters that can be reliably applied during automatic orientation. However, AMOR and System AMOR 2 proved to be advantageous to explore such difficulties and find solutions for individual species.
Conclusion
Automatic orientation and mass imaging of foraminifers are feasible. Devices like AMOR and System AMOR 2 facilitate monotonous labor and help to identify the species-dependent morphological parameters for automatic particle orientation under a microscope. Because the analysis of size or shape changes is two-dimensional, the classification of transitional morphotypes remains limited. When building automats like AMOR, the development time may not be underestimated as it may slow down the progress on solving scientific questions up to years. Nevertheless, the duplication or multiplication of automatic devices for parallel microfossil orientation and imaging remains a desire and is necessary. Without a fleet of robotic systems, an understanding of the global morphological evolution of foraminiferal species will always stay out of reach.
Documentation Site for the Development of Automated Measurement System for Shell mORphology and System Automated Measurement System for Shell mORphology 2
The LabView source codes of the programs AMOR v. 3.28 (old AMOR) and AMOR 4.2 (for System AMOR 2) are stored in form of electronic archives AMOR_3.28.7z and AMOR_4.2.7z, respectively. The code for AutoIt script AMOR_Manual_Drive_v10.exe is in the electronic archive EISENECKER_2014_AutoIt.7z. These archives are deposited on the internal media server of the Natural History Museum Basel and are available upon request.
All descriptions of AMOR and System AMOR 2 and parts of them are permanently deposited either in a printed form in the geological archive or in an electronic form on the internal media server of the Natural History Museum Basel. They comprise student, bachelor, and diploma studies from Northwestern University of Applied Sciences (FHNW, NW Brugg/Windisch, Switzerland), reports and notes, technical drawings, correspondence, software codes in a printed and electronic form, wiring diagrams, test results, and supplements later than those given in MorphCol of Knappertsbusch (2015). These documents are unpublished but are cited in the text. They include the following references (labeled with an asterisk [*]): Binggeli (2006), Herzig and Schmutz (2007), Stapfer (2007), Widmer (2008), Schorpp et al., 2009, Schorpp (2010, 2013), Knappertsbusch (2012, 2021b), Schneider and Chalençon (2012), Scheffelmeier et al. (2014), Oegerli (2015a,b), and Eisenecker (2020). These documents can be consulted in the Natural History Museum Basel.
Data Availability Statement
Electronic archives AMOR_V3.28.7z, AMOR_V4.2.7z, and EISENECKER_2014_AutoIt.7z are available from the Natural History Museum Basel upon request.
Author Contributions
MK and JE performed the combined effort of development of System AMOR 2, contributed to the mechanical and electrical improvement of all components, and prepared the images and drafted this manuscript. JE realized programming of the System AMOR 2 software with LabView and AutoIt including tests of the software. MK carried out the intercalibration tests with AMOR and System AMOR 2. Both authors contributed to the article and approved the submitted version.
Funding
This work was funded by the Swiss National Foundation for Scientific Research (Grant Nos. 200021_169048/1 and 200021_169048/2) and also by contributions from the Natural History Museum in Basel.
Conflict of Interest
The authors declare that the research was conducted in the absence of any commercial or financial relationships that could be construed as a potential conflict of interest.
Publisher’s Note
All claims expressed in this article are solely those of the authors and do not necessarily represent those of their affiliated organizations, or those of the publisher, the editors and the reviewers. Any product that may be evaluated in this article, or claim that may be made by its manufacturer, is not guaranteed or endorsed by the publisher.
Acknowledgments
We thank Daniel Binggeli (FHNW Brugg/Windisch) for building the stage for System AMOR 2. Sebastian Gaulocher (FHNW Brugg/Windisch) provided us with Dell PC for the System AMOR 2. Christian Meyer (NMB) and Sergio Kühni (NMB) helped in additional mechanical and electrical improvements of System AMOR 2.
Supplementary Material
The Supplementary Material for this article can be found online at: https://www.frontiersin.org/articles/10.3389/fmars.2022.798002/full#supplementary-material
Footnotes
References
Aze, T. L. (2011). Cope’s Rule and Macroevolution of Cenozoic Macroperforate Planktonic Foraminifera. PhD thesis. Cardiff: Cardiff University, Earth and Ocean Sciences.
Aze, T., Ezard, T. H. G., Purvis, A., Coxall, H. K., Stewart, D. R. M., Wade, B. S., et al. (2011). A phylogeny of Cenozoic macroperforate planktonic foraminifera from fossil data. Biol. Rev. 86, 900–927. doi: 10.1111/j.1469-185X.2011.00178.x
Bennett, J., and AutoIt Team (1999–2018). AutoIt Scripting Language. https://www.autoitscript.com/site/autoit/
Bicknell, R. D. C., Collins, K. S., Crundwell, M., Hannah, M., Crampton, J. S., and Campione, N. E. (2018). Evolutionary transition in the Late Neogene planktonic foraminiferal genus Truncorotalia. iScience 8, 213–221. doi: 10.1016/j.isci.2018.09.013
Binggeli, D. (2006). 4-Achs Mikroskoptisch für Mikrofossilien. Germany: Technical documentation, Fachhochschule Nordwestschweiz, Hochschule für Technik.
Bollmann, J., Quinn, P. S., Vela, M., Brabec, B., Brechner, S., Cortes, M. Y., et al. (2004). “Automated particle analysis: calcareous microfossils,” in Image analysis, sediments and Paleoenvironments, ed. P. Francus (Dordrecht: Kluwer Academic Publishers), 229–252. doi: 10.1007/1-4020-2122-4_12
Bollmann, J., Schmidt, D. N., Brabec, B., Gerber, U., and Mettler, M. (2002). “Fully automated granulometry of deep-sea sediments using an incident light microscope,” in Size Variability in Planktic Foraminifers, ed. D. N. Schmidt (Zürich: ETH), 17–26. doi: 10.3929/ethz-a-004353260.
Brown, K. R. (2007). Biogeographic and Morphological Variation in Late Pleistocene to Holocene Globorotalid Foraminifera. PhD Dissertation. Switzerland: University of Basel.
de Garidel-Thoron, T. (2002). Dynamique Climatique de l’océan Pacifique Ouest Équatorial au Cours de Pléistocène Récent. Dissertation. France: Université de Droit, d’Economie et des Sciences d’Aix-Marseille.
de Garidel-Thoron, T., Marchant, R., Beaufort, L., Tetard, M., Bourrel, B., Gally, Y., et al. (2019). “Automatic imaging, classification and morphometrics of calcareous plankton and ongoing developments,” in Book of Abstracts of the ARTIFACTZ Workshop Artificial Intelligence for Characterizing Plankton Traits from Images. Artificial Intelligence for Characterizing Plankton Traits from Images, eds M. Frédéric, I. Jean-Olivier, and A. Sakina-Dorothée (Villefranche-sur-Mer: HAL).
Eisenecker, J. (2020). AMOR 4. Anpassungen Hard- und Software. Switzerland: Natural History Museum Basel. Technical report.
Ezard, T. H. G., Pearson, P. N., Aze, T., and Purvis, A. (2012). The meaning of birth and death (in macroevolutionary birth-death models). Biol. Lett. 8, 139–142. doi: 10.1098/rsbl.2011.0699
Friesenhagen, T. (2022). Test-size evolution of the planktonic foraminifera Globorotalia menardii in the eastern tropical atlantic since the Late Miocene. Biogeosciences 19, 777–805. doi: 10.5194/bg-19-777-2022
Harrison, A. P., Wong, C., and Joseph, D. (2011). Virtual reflected-light microscopy. J. Microsc. 244, 293–304. doi: 10.1111/j.1365-2818.2011.03536.x
Herzig, A., and Schmutz, L. (2007). Ansteuerung eines Mikroskops zur Untersuchung von Mikrofossilien. Diploma thesis. Brugg-Windisch: Fachhochschule Nordwestschweiz.
Hsiang, A. Y., Brombacher, A., Rillo, M. C., Mleneck-Vautravers, M. J., Conn, S., Lordsmith, S., et al. (2019). Endless forams: >34,000 modern planktonic foraminiferal images for taxonomic training and automated species recognition using convolutional neural networks. Paleoceanography Paleoclimatol. 34, 1157–1177. doi: 10.1029/2019PA003612
Itaki, T., Taira, Y., Kuwamori, N., Maebayashi, T., Takeshima, S., and Toya, K. (2020). Automated collection of single species of microfossils using a deep learning-micromanipulator system. Prog. Earth Planetary Sci. 7:19. doi: 10.1186/s40645-020-00332-4
Kennett, J. P., and Srinivasan, M. S. (1983). Neogene Planktonic Foraminifera. A Phylogenetic Atlas. Stroudsburg, PA: Hutchinson Ross Publishing Company, 265.
Knappertsbusch, M. (1998). A simple Fortran 77 program for outline detection. Comput. Geosci. 24, 897–900. doi: 10.1016/S0098-3004(98)00085-5
Knappertsbusch, M. (2002). Stereo VR representations of microfossils in light microscopy. Palaeontol. Electron. 5. Available online at: https://palaeo-electronica.org/2002_1/light/issue1_02.htm
Knappertsbusch, M. (2007). Morphological variability of Globorotalia menardii (planktonic foraminifera) in two DSDP cores from the Caribbean Sea and the eastern equatorial Pacific. Carnets Géol. 4, 1–34. doi: 10.4267/2042/8455
Knappertsbusch, M. (2011). Evolution im marinen Plankton. Mitteilungen Naturforschenden Gesellschaften Beider Basel 13, 3–14.
Knappertsbusch, M. (2015). MorphCol 2004-2013. A Collection of Fortran 77 Programs for Geometric Morphometry. Basel: Naturhistorisches Museum.
Knappertsbusch, M. (2016). Evolutionary prospection in the Neogene planktic foraminifer Globorotalia menardii and related forms from ODP Hole 925B (Ceara Rise, western tropical Atlantic): evidence for gradual evolution superimposed by long distance dispersal ? Swiss J. Palaeontol. 135, 205–248. doi: 10.1007/s13358-016-0113-6
Knappertsbusch, M. (2021a). Commented Archive to Studies about the Morphological Evolution of Menardiform Globorotalids at Western Pacific Warm Pool ODP Hole 806C (Ontong-Java Plateau). Los Angeles, CA: PANGAEA. doi: 10.5194/egusphere-egu2020-2396
Knappertsbusch, M. (2021b). AMOR - System AMOR 2 Intercalibration Experiment. Available online at: https://micropal-basel.unibas.ch/Research/MORPHCOL/SUPPL_29_IntCalExp.pdf. Unpublished
Knappertsbusch, M. (2022). Morphological evolution of menardiform globorotalids at Western Pacific Warm Pool ODP Hole 806C (Ontong-Java Plateau). [Accepted manuscript] Revue de Micropaléontol.
Knappertsbusch, M., and Mary, Y. (2012). Mining morphological evolution in microfossils using volume density diagrams. Palaeontol. Electron. 15:7T. doi: 10.26879/278
Knappertsbusch, M., Binggeli, D., Herzig, A., Schmutz, L., Stapfer, S., Schneider, C., et al. (2009). AMOR - a new system for automated imaging of microfossils for morphometric analyses. Palaeontol. Electron. 12:2T.
Knappertsbusch, M., Brown, K. R., and Rüegg, H. R. (2006). Positioning and enhanced stereographic imaging of microfossils in reflected light. Palaeontol. Electron. 9:8A.
Lazarus, D. B. (2011). “The deep-sea microfossil record of macroevolutionary change in plankton and its study,” in Comparing the Geological and Fossil Records: Implications for Biodiversity Studies ed. A. J. McGowran and A. B. Smith, (London: Geological Society, Special Publications). doi: 10.1144/SP358.10
Le Villain, L. (2011). Planktic Foraminifer Abundance and Morphometry Changes During late Holocene in the Southeastern Bay of Biscay. BIAF: University of Angers: France. Report M1 project, summer 2011.
Marchant, R., Tetard, M., Pratiwi, A., Adebayo, M., and de Garidel-Thoron, T. (2020). Automated analysis of foraminifera using a convolutional neural network. J. Micropalaeontol. 39, 183–202. doi: 10.5194/jm-39-183-2020
Mary, Y. (2013). Morphologic, Biogeographic and Ontogenetic Investigation of Mid-Pliocene Menardellids (planktonic foraminifera). Dissertation. Basel.
Mary, Y., and Knappertsbusch, M. (2013). Morphological variability of menardiform globorotalids in the Atlantic Ocean during Mid-Pliocene. Mar. Micropaleontol. 101, 180–193. doi: 10.1016/j.marmicro.2012.12.001
Mary, Y., and Knappertsbusch, M. (2015). Worldwide morphological variability in Mid-Pliocene menardellid globorotalids. Mar. Micropaleontol. 121, 1–15. doi: 10.1016/j.marmicro.2015.09.001
Mitra, R., Marchitto, T. M., Ge, Q., Zhong, B., Kanakiya, B., Cook, M. S., et al. (2019). Automated species-level identification of planktic foraminifera using convolutional neural networks, with comparison to human performance. Mar. Micropaleontol. 147, 16–24. doi: 10.1016/j.marmicro.2019.01.005
Oegerli, K. (2015a). Software-Anpassung für den Mikrofossilien-Abbildungsautomaten AMOR. Karnataka: Studiengang Systemtechnik, FHNW. Dokumentation P5.
Oegerli, K. (2015b). Software-Migration für Neubau Mikrofossilien-Abbildungsautomat AMOR. Karnataka: Bachelor-Thesis (Studiengang Systemtechnik, FHNW.
Rillo, M. C. (2019). Unravelling Macroecological Patterns in Extant Planktonic Foraminifera. PhD Thesis. England: University of Southampton, Ocean and Earth Science.
Rillo, M. C., Miller, C. G., Kucera, M., and Ezard, T. H. G. (2020). Intraspecific size variation in planktonic foraminifera cannot be consistently predicted by the environment. Ecol. Evol. 10, 11579–11590. doi: 10.1002/ece3.6792
Scheffelmeier, J., Lescoeur, A., and Kaeser, M. (2014). AMOR Projekt (Automatisiertes Mess-System zur Untersuchung von Schalen MORphologien). Unpublished.
Schneider, E., and Chalençon, M. (2012). Machbarkeitsstudie für Eine Intelligente Beleuchtung für den Abbildungsautomaten AMOR. Student project. University of Applied Sciences. (Fachhochschule Nordwestschweiz, FHNW). Unpublished.
Schorpp, R., Binggeli, D., and Eisenecker, J. (2009). Automatisches Messsystem für AMOR. Karnataka: Institut für Automation, FHNW Brugg/Windisch.
Schulze, K., Tillich, U. M., Dandekar, T., and Frohme, M. (2013). PlanktoVision – an automated analysis system for the identification of phytoplankton. BMC Bioinform. 14:115. doi: 10.1186/1471-2105-14-115
Stapfer, S. (2007). Automatischer Vergrösserungswechsler (Auto-Zoom) und Erweiterte Fokussierung für AMOR. Diplomarbeit. Dokumentation Diplomarbeit 2830. Unpublished. Available online at: https://docplayer.org/11363706-Dokumentation-diplomarbeit-2830.html.
Tetard, M., Marchant, R., Cortese, G., Gally, Y., de Garidel-Thoron, T., and Beaufort, L. (2020). A new automated radiolarian image acquisition, stacking, processing, segmentation, and identification workflow. Climate Past 16, 2415–2429. doi: 10.5194/cp-16-2415-2020
Keywords: AMOR, automation, orientation, imaging, foraminifera, morphometry, Globorotalia menardii, methods
Citation: Knappertsbusch M and Eisenecker J (2022) Towards a Fleet of Robots for Orientation, Imaging, and Morphometric Analyses of Planktonic Foraminifera. Front. Mar. Sci. 9:798002. doi: 10.3389/fmars.2022.798002
Received: 19 October 2021; Accepted: 17 January 2022;
Published: 08 March 2022.
Edited by:
Isabel Fenton, University of Oxford, United KingdomReviewed by:
Allison Hsiang, Stockholm University, SwedenJules S. Jaffe, University of California, San Diego, United States
Weimin Si, Brown University, United States
Copyright © 2022 Knappertsbusch and Eisenecker. This is an open-access article distributed under the terms of the Creative Commons Attribution License (CC BY). The use, distribution or reproduction in other forums is permitted, provided the original author(s) and the copyright owner(s) are credited and that the original publication in this journal is cited, in accordance with accepted academic practice. No use, distribution or reproduction is permitted which does not comply with these terms.
*Correspondence: Michael Knappertsbusch, michael.knappertsbusch@unibas.ch