Reduced salinity exacerbates the viral infection on the coccolithophorid Emiliania huxleyi at elevated pCO2
 Qianqian Fu1
  Kunshan Gao1,2*
- 1State Key Laboratory of Marine Environmental Science, College of Ocean and Earth Sciences, Xiamen University, Xiamen, China
- 2Co-Innovation Center of Jiangsu Marine Bio-industry Technology, Jiangsu Ocean University, Lianyungang, China
The blooms of coccolithophores are usually terminated by their viruses. However, little has been documented on the interplay between the host with virus under different environmental conditions. We investigated the relationship of Emiliania huxleyi (BOF92) and its virus (EhV99B1) after the coccolithophorid had acclimated to different levels of salinity (S35: 35‰; S25: 25‰) and CO2 (AC: 400 μatm; HC: 1000 μatm) for about 15 generations. Our results showed that the virus infection decreased the growth of E. huxleyi along with decreased photochemical efficiency and photosynthetic carbon fixation under all the combinations of the treatments. Lowered salinity exacerbated the impacts of the viral infection on the growth and photosynthetic performance of E. huxley. The elevated pCO2 appeared to have alleviated the impacts of the viral infection on its photosynthetic performance with enhanced levels of Fv/Fm, by about 49% under S35 and by about 16% under S25, respectively. Nevertheless, the elevated pCO2 enhanced the virus burst size by about 18% under the high and by about 46% under the low levels of salinity, respectively. It is concluded that reduced salinity under the elevated pCO2 exacerbates the impact of the virus on E. huxleyi, leading to the highest burst sizes and the lowest photosynthetic carbon fixation, and the enhanced photochemical efficiency and increased levels of Chl a under the elevated pCO2 could have facilitated the energy supply for the virus multiplication in the infected cells of E. huxleyi.
Introduction
Microorganisms make up more than 90% of the ocean’s biomass and are the main driving force for biogeochemical cycles (Suttle, 2007). Both eukaryotic and procaryotic phytoplankton species can form large-scale blooms that may stretch for thousands of kilometers in the oceans (Holligan et al., 1993b). These blooms are periodically representative of intensive primary productivity, regulating the air-sea CO2 fluxes. They disappear with increased abundance of viruses, which species-specifically terminate phytoplanktonic blooms (Bratbak et al., 1993; Massana et al., 2007). Viruses are abundant in seawater and comprise of ×1030 particles in the global oceans (Suttle, 2005), infecting microbes and causing the lysis of their hosts (Short et al., 2020; Correa et al., 2021), bringing about 20% of marine microorganisms to death per day (Suttle, 2007; Danovaro et al., 2011; Mansour, 2013). Consequently, they affect the structure of microbial communities as well as biogeochemical cycles of nutrients and the oceanic carbon sequestration capacity (Suttle, 2007; Danovaro et al., 2011; Short, 2012; Yang et al., 2017).
It is generally believed that the amounts of microalgae-specific viruses are positively related to the abundance of their hosts (Bratbak et al., 1990; Short, 2012; Mojica and Brussaard, 2014). The viruses are known to alter the metabolisms of marine phytoplankton and their physiological responses to environmental changes (Thompson et al., 2011a; Chen et al., 2015). Some viruses contain specific genes involved in sphingolipid biosynthesis, which could produce ceramide that restrains cell growth and induces apoptosis (Wilson et al., 2005; Liu et al., 2018). Viral infection could remodel the host’s lipid metabolism and induce highly saturated triacylglycerols (Malitsky et al., 2016; Zhang et al., 2022). Meanwhile, viral infection to phytoplankton cells inevitably leads to declined rates of photosynthetic carbon fixation (Suttle et al., 1990; Chen et al., 2015). However, different species or strains of micro-algae show different levels of susceptibility to viruses, since their infections to phytoplankton are species-specific and regulated by environment (Short, 2012). Therefore, it is of general concern to look into the effects of viruses on the physiology of individual phytoplankton groups under different environmental conditions.
Coccolithophores, a main group of marine phytoplankton, play a key role in global carbon cycles through calcification and photosynthesis, accounting for about 10% of primary production in the oceans (Poulton et al., 2007). Emiliania huxleyi, the most widely distributed coccolithophorid (Bach et al., 2013), is known to be tolerant of salinity changes (Brand, 1984; Xu et al., 2020) and is reasonably distributed in coastal seawaters and even estuaries in addition to pelagic oceans (Holligan et al., 1993a; Bonomo et al., 2014; Godrijan et al., 2018). Nevertheless, lowered salinity is known to suppress the calcification of coccolithophores, with their coccoliths malformed (Saruwatari et al., 2016). Therefore, decreasing salinity levels due to sea ice melting along with ocean warming (Rabatel et al., 2013; Soruco et al., 2015) can also affect coccolithophores and other phytoplankton in the context of ocean global changes (Xu et al., 2020). Since decreased salinity usually couples with increased pCO2 (Salisbury and Jönsson, 2018) and increased dissolution of anthropogenic CO2 into seawater alter carbonate chemistry, phytoplankton cells including coccolithophores in the waters of lower salinity are exposed to elevated pCO2 and acidic stress (Doney et al., 2009). Recently, it has been shown that E. huxleyi responded to hyposalinity by increasing its photosynthetic performance even under future ocean acidification condition (Xu et al., 2020).
Salinity changes may directly or indirectly affect the virus-phytoplankton interactions (Parada et al., 2006; Danovaro et al., 2011). While previous studies mainly focused on the bacteriophages, little has been documented on the effects of salinity on Phycodnaviridae, the double-stranded DNA viruses that infect eukaryotic algae (Bertzbach et al., 2021). Levels of pCO2 are the most influential environmental factor, since it alters the stability of aquatic carbonate chemistry. Elevated levels of pCO2 projected for future ocean acidification by 2100 decreased burst size and slightly prolonged the virus-infected latent period of E. huxleyi (Larsen et al., 2008; Carreira et al., 2013). In contrast, the ocean acidification treatment exacerbated the viral attacks to the red tide alga Phaeocystis globose, suggesting that the impacts of elevated pCO2 on marine primary producers may be indirectly altered by their relationship with viruses (Chen et al., 2015). Since lowered salinity leads to osmotic stress along with increased levels of pCO2 and hydrogen ions (acidic stress), it is likely to affect virus infections to microalgae. Hence, we hypothesized that changed levels of salinity and pCO2 may regulate the infection of the virus EhV to its host E. huxleyi. Our experimental results showed that lowered salinity exacerbated the impacts of the viral infection on the photosynthetic performance of E. huxleyi with its photochemical yield decreased even at elevated pCO2.
Materials and methods
The host and its virus
The coccolithophorid Emiliania huxleyi (BOF92) and its virus (EhV99B1) used in this study were originally isolated from the west coast of Norway (60°24′N, 5°19′E), and obtained from Jimei University (Xiamen, China). The E. huxleyi was able to calcify originally, but lost the capacity of calcification after having been maintained in the laboratory for years (Nanninga and Tyrrell, 1996), which was confirmed in this work (Figure S1). The virus EhV99B1 is of large double-stranded DNA with a diameter of 160-180 nm, belonging to the family Phycodnaviridae (Castberg et al., 2002; Schroeder et al., 2002). The fresh EhV99B1 lysate was harvested after adding appropriate volumes of the virus to the exponentially growing E. huxleyi cultures (Castberg et al., 2002; Knowles et al., 2020). After 5-7 days of incubation, the microalgal cells were lysed and the lysate was filtrated by 0.22 µm PC membrane (Millipore, America) to separate the virus and its host.
Pre-incubation and infected experiment
The E. huxleyi cells were cultured in 500 mL PC bottles with the filtered (0.22 µm) and sterilized natural seawater enriched with IMR/5 medium (NO3- = 49.4 µM and PO4- = 5 µM) (Eppley et al., 1967). Experiment equipment used in the experiment were sterilized with an autoclave to sterilize all the vessels. All cultures were grown at 17°C and 200 µmol photons m-2 s-1 of PAR (light: dark circle = 12:12 h) illuminated with the cool white fluorescent light. The light intensities were measured with a spherical micro quantum sensor (US-SQS/WB, Walz, Germany).
We set two levels of salinity: 35‰ (S35), close to the strain’s original environment (upper water of Eastern North Atlantic), and 25‰ (S25), the extreme salinity occurring in the coastal and estuarine waters (Brand, 1984; Xu et al., 2020). The lower salinity seawater was obtained by diluting the filtered seawater with Milli-Q water. Ambient (410 μatm, outdoor air) and elevated (1000 μatm, level predicted for the end of 2100) pCO2 concentrations were achieved from outdoor air and by using a CO2 enricher (HP1000G-D, Ruihua, China), respectively. Before inoculation, the culture medium was prepared with sterilized and aerated to achieve the pCO2 levels. To maintain carbonate system stability of the cultures, the initial cell concentration was set at 100 cells mL-1, and the maximum cell concentration was controlled less than 3-4×10⁴ cells mL-1 by diluting the cultures every 7 days (Figure S2). The cultures were carried out in triplicates for each treatment, and the exponentially growing cells had been pre-acclimated to each treatment for about 15 generations before adding the virus for the experiments (Figure S2).
After pre-acclimation, when the E. huxleyi cells were grown up to 5-6×10⁵ cells mL-1, appropriate volumes of filtrate containing free-living EhVs were added to the cultures to approximate the proportion of virus to host as 20. The virus was added at the end of dark period (Thamatrakoln et al., 2019), and non-infected cultures received the same volumes of sterilized medium. Triplicate independent cultures were carried out for the different treatments. All cultures were sampled every 4-8 h before 60 h and every 12 h later till 84 h, and we took samples in the benchtop to avoid any contaminations during the whole incubation period.
Determinations of the host and virus concentrations
The E. huxleyi cell numbers and diameters were measured using a Particle Counter and Size Analyzer (Z2, Beckman Coulter, America). The specific growth rate (μ day-1) was calculated by the following equation: μ (d-1) = (lnNt – lnNt-1)/Δt, where Nt and Nt-1 are the cell numbers (cells mL-1) over the time interval of Δt (t and t-1) respectively.
Samples for the virus (2 mL) were fixed with 40 µL 25% glutaraldehyde (0.5%, v/v, final concentration) for 15 min in dark before freezing in liquid nitrogen, and then stored at -80°C till analysis (Castberg et al., 2002; Brussaard et al., 2004). Before the virus counting, the samples were thawed at room temperature and diluted in Tris-EDTA buffer (pH 8) at a final concentration of 105-106 particles mL-1. After being stained with SYBR Green I nucleic acid gel stain (Invitrogen, America) for 10 min at 80°C, the samples were enumerated by using a Flow Cytometer (Epics Altra II, Beckman Coulter, America) (Brussaard et al., 2004). FCS Express 7 software was used to analyze the virus flow profile.
Measurement of burst size
To evaluate the burst size, the number of viruses produced during host cell lysis (Parada et al., 2006), the abundances of the EhV at 24 h and 84 h after the infection were employed. It was determined as follows: Burst size = (maximum - minimum viral abundance)/number of lysed cells. The number of lysed host cells was estimated as the difference of the maximum and minimum numbers of the host cells at 24 h and 84 h after the infection. In this work, the host cell numbers were up to maximum at end of the latent period (24 h), and then were decreased to a minimum when the EhVs numbers were up to maximum (84 h) due to the viral lysis.
Measurement of chlorophyll a fluorescence
The photochemical performances of E. huxleyi, as reflected with chlorophyll fluorescence parameters, were assessed by using a pulse-amplitude-modulated fluorometer with actinic light of 200 µmol photons m-2 s-1 at 440 nm (Multi-color PAM, Walz, Germany). The maximum photochemical quantum yields (Fv/Fm) were determined after 15 min dark adaptation according to the equations of Kitajima and Butler (1975): (Fv/Fm) = (Fm - F0)/Fm, where the F0 and Fm indicate minimum before and maximum chlorophyll fluorescence after the saturating light pulse (4000 µmol photons m-2 s-1 of PAR, 0.8 s), respectively.
Measurement of chlorophyll a concentration
At the end (84 h after the infection) of the cultures, samples were collected onto GF/F filters (25 mm, Whatman, America) and extracted with 5 mL pure methanol at 4°C overnight in darkness. After centrifuging at 6000 g for 10 min (Universal 320 R, Hettich, Germany), the optical absorptions of the supernatants were measured at 632 nm, 665 nm and 750 nm by an ultraviolet spectrophotometer (Tu-1810, Persee, China), and the concentrations of Chl a were estimated by the following equation according to Ritchie (2006): Chl a (µg mL-1) = 13.2654 × (A665 - A750) - 2.6839 × (A632 - A750).
Measurement of photosynthetic carbon fixation
The samples were collected at the later phase (72 h after the infection) of the cultures and were poured into borosilicate bottles (50 mL) before 100 µL of 5 µCi (0.185 MBq) labeled NaH14CO3 solution (Amersham) was added for the incubation (2 h). At the end of the incubation, cells were collected on Whatman GF/F filters and stored at -20°C for later analysis. Prior to analysis, the filters were placed in a 20 mL scintillation vial and fumed with HCl for 12 h, after drying at 60°C, 5 mL scintillation cocktail (Perkin Elmer) was added to each of the vials before counting with a liquid scintillation counter (Tri-Carb 2800 TR, Perkin-Elmer, America), and photosynthetic carbon fixation rates were calculated as previously reported by using the DIC values measured under different treatments (Table S2) (Gao et al., 2007).
Analysis of particulate organic carbon and particulate inorganic carbon
Duplicated samples (collected at 84 h after the viral infection) of each treatment were filtered onto pre-combusted Whatman GF/F filters (450°C, 4 h) and stored at -20°C. For analysis, one of the filters for POC analysis was fumed with HCl for 12 h and dried at 60°C overnight to remove all inorganic carbon; the other filters for total particulate carbon (TPC) were not treated with HCl. The dried samples were analyzed by Elementar Vario EL cube (Langenselbold, Germany). The PIC was estimated as the difference between TPC and POC. The POC production rate was calculated as follows (Tong et al., 2019): P = cellular POC content (pg cell-1) × specific rate μ (d-1).
Seawater carbonate chemistry parameters
The seawater pHnbs values were measured using a pH meter (Orion STAR A211, Thermo Scientific, America), which was calibrated with standard National Bureau of Standards (NBS) buffers. Total alkalinity (TA) was determined using the acid-base titration method (Lewis and Wallace, 1998). The other parameters were derived using a CO2SYS software based on the values of pH and TA (Pelletier et al., 2005), using the equilibrium constants of K1 and K2 for carbonic acid dissociation (Roy et al., 1993). The carbonate chemistry parameters are shown in Tables S1, S2.
Statistical analysis
All statistical analyses were carried out with Origin 9.0. One-way ANOVA with post hoc investigation of LSD test was applied to assess the significance among the treatments. Statistical significance level was set at p < 0.05. All values are represented as the means ± SD of triplicate cultures.
Results
Growth of the alga and abundance of its virus
The changed concentrations of E. huxleyi cells over time prior to the addition of the virus showed that reduced salinity decreased its specific growth rate under the ambient pCO2 but resulted insignificant change of it under the elevated pCO2 (Figure S2). When the cultures were maintained in batch mode for the viruses to infect, the algal biomass density increased with time to reach plateaus in about 48 h in the cultures without the virus, with the highest values observed at the high levels of pCO2 and salinity (Figures 1A, B). In the cultures with the virus, the biomass density increased initially within about 20 h, indicating that the growth rate of E. huxleyi was higher than the of rate virus lysis, then declined in the period of 24-36 h, and the low salinity treatment led to earlier and faster decline of the algal cells regardless of the pCO2 treatments (Figure 1). After the cells had acclimated to the combination treatment of S25, S35, AC and HC for about 15 generations, from the time point of virus addition (0 h) to the end of exponential growth stage (48 h), the lowered salinity had a significantly impact on the alga’s specific growth rate, reducing it by about 9% (p = 0.030) and 9% (p = 0.015) under AC and HC, respectively (Figures 1C, D). The cell density of E. huxleyi infected with the virus EhV decreased significantly compared with non-infected treatment from 12 h after the infection (Figures 1A, B), indicating that the virus was causing the algal cells to die off. During the phase 1 (0-24 h), the set on progeny virus developed to the phase 2, where the algal biomass density reached the lowered values (Figures 1A, B) and its growth rate became negative (Figures 1C, D). The highest biomass density of the alga without the virus was about 4 times at AC and S35 and about 5 times at HC and S25 that of the algal cells infected with the virus (Figure 1). In general, the patterns of E. huxleyi in response to the lowered salinity were similar under AC and HC (Figures 1C, D). Nevertheless, the HC treatment appeared to exacerbated the infection in the phase 1, leading to much lowered (p = 0.014) growth rate of the alga at S35, which was reversed in the phase 2, where the HC treatment increased it by about 20% (p = 0.010) at S35. Lower salinity significantly reduced the specific growth rate of E. huxleyi infected with the virus, by about 52% under AC (p < 0.001) and by about 47% under HC (p < 0.001) in phase 1, and by about 2% under AC (p = 0.790) and 16% under HC (p = 0.118) in phase 2, respectively (Figures 1C, D).
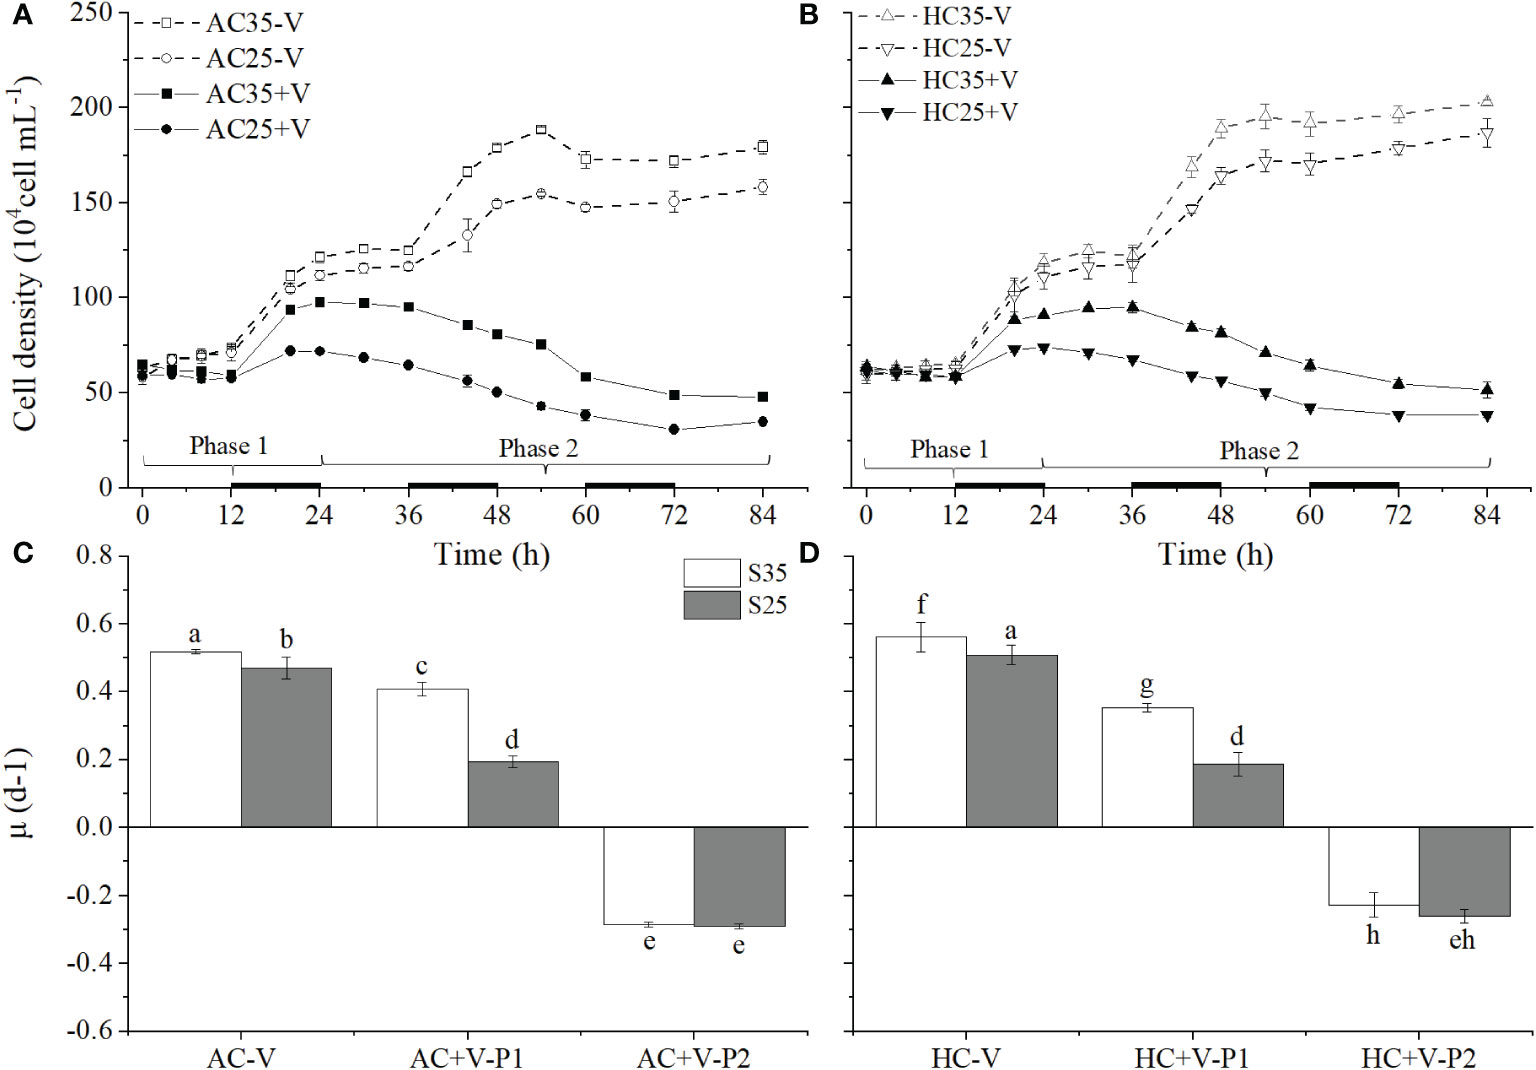
Figure 1 Impacts of virus-infection on the growth of Emiliania huxleyi under different levels of salinity (S35, 35‰ and S25, 25‰) and CO2 (AC, 400 μatm and HC, 1000 μatm). (A, B), changes in the cell density of E. huxleyi with (+V) and without (-V) the virus EhV grown under S35 or S25 conditions at AC or HC. (C, D), the specific growth rates of E. huxleyi cell grown at S35 or S25 under AC or HC. Phase 1 refers to the incubation time of E. huxleyi infected with virus from 0 h to 24 h and Phase 2 refers to 24-84 h. Different letters above the bars represent significant differences between the treatments. The values are represented as the means ± SD of triplicate cultures.
As for the virus, concentrations of EhV were very similar in all treatments with no obvious changes during the latent period (phase 1), then rapidly increased by lysing the algal cells in phase 2 time (Figures 2A, B). Lowered salinity seemed increased the concentrations of the virus under either AC or HC treatments during the period of 24-48 h. However, the concentrations of EhV appeared to increase under the combination of HC and S25 (Figure 2). While the lower salinity did not affect the burst size of EhV in AC treatment (p = 0.812), it acted synergistically with elevated pCO2 to increase the burst size of EhV by about 22% (p = 0.003) compared with higher salinity (Figure 2C). The HC-grown cells infected with the virus lead to greater burst size by about 18% (p = 0.019) and 46% (p <0.001) at S35 and S25, respectively.
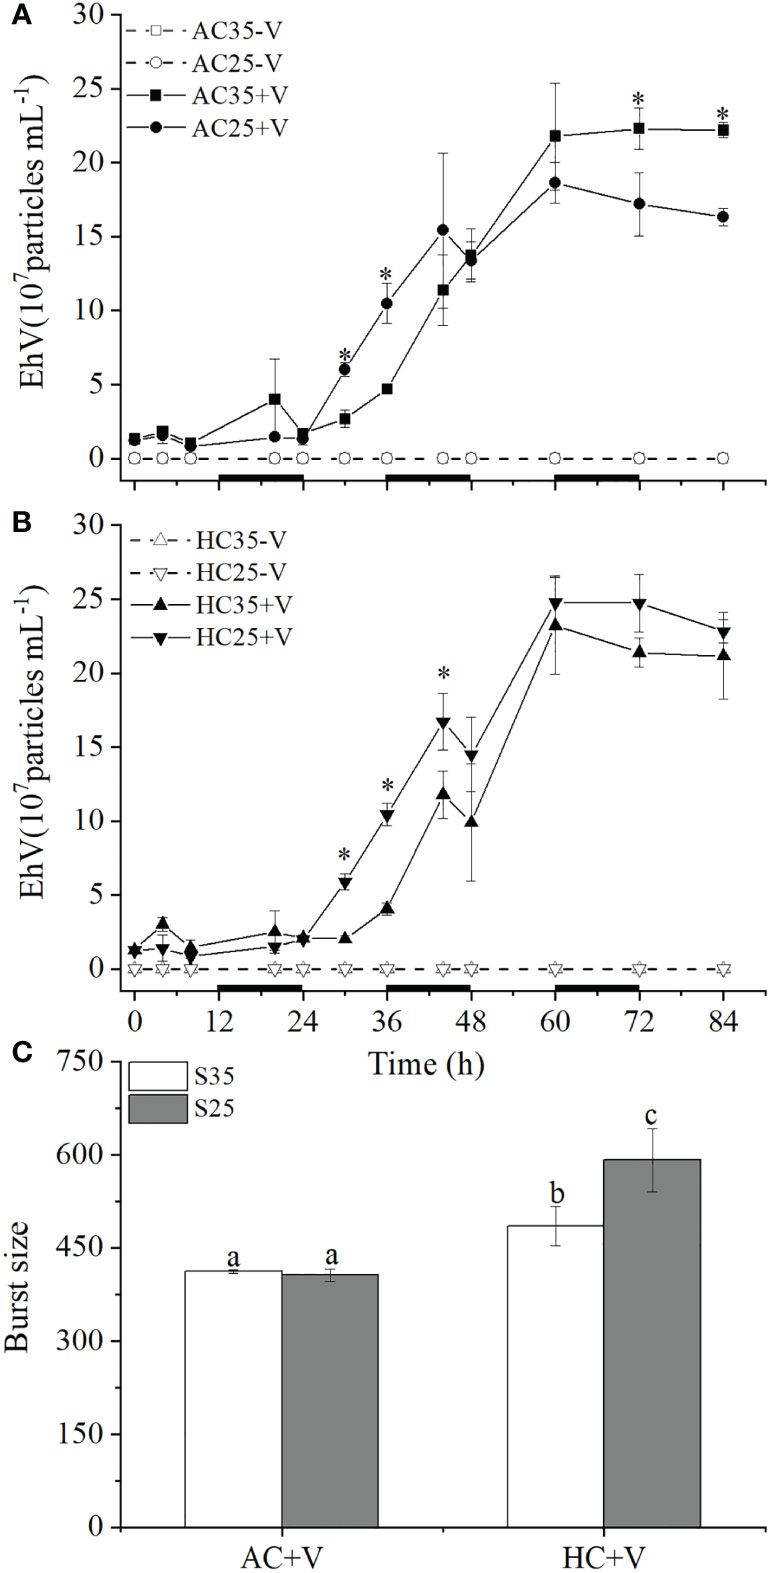
Figure 2 Concentration changes of the virus EhV released from its host E). huxleyi grown at S35 or S25 under AC (A) or HC (B) during the infected periods. The burst size values were based on the virus abundances at 24 and 84 h (C). Different letters above the bars represent significant differences between the treatments. The values are represented as the means ± SD of triplicate cultures. Asterisks represent significant differences (p < 0.05) between the different treatments.
Photochemical activity and the content of chl a
Viral infection lowered the maximum quantum yield of (Fv/Fm) of E. huxleyi. The Fv/Fm of E. huxleyi cells infected with EhV decreased significantly compared with the control under both AC (p < 0.001 for S35 and p < 0.001 for S25) and HC conditions (p < 0.001 for S35 and p < 0.001 for S25) (Figure 3). At 60h, lower salinity decreased the Fv/Fm significantly by about 25% (p < 0.001) under AC and by about 42% (p < 0.001) under HC in the algal cells infected with the virus, respectively (Figures 3A, B). Nevertheless, the cells grown at the elevated pCO2 and infected with the virus showed significantly (p < 0.001) higher values of Fv/Fm. At S35, the elevated pCO2 increased Fv/Fmby about 0.3% (p = 0.786) in the non-infected and by about 49% (p < 0.001) in the infected cells, respectively (Figures 3A, B). In contrast, at S25, elevated pCO2 increased Fv/Fm by about 5% in the non-infected (p < 0.001) and by about 16% (p = 0.010) in the infected cells, respectively (Figures 3A, B).
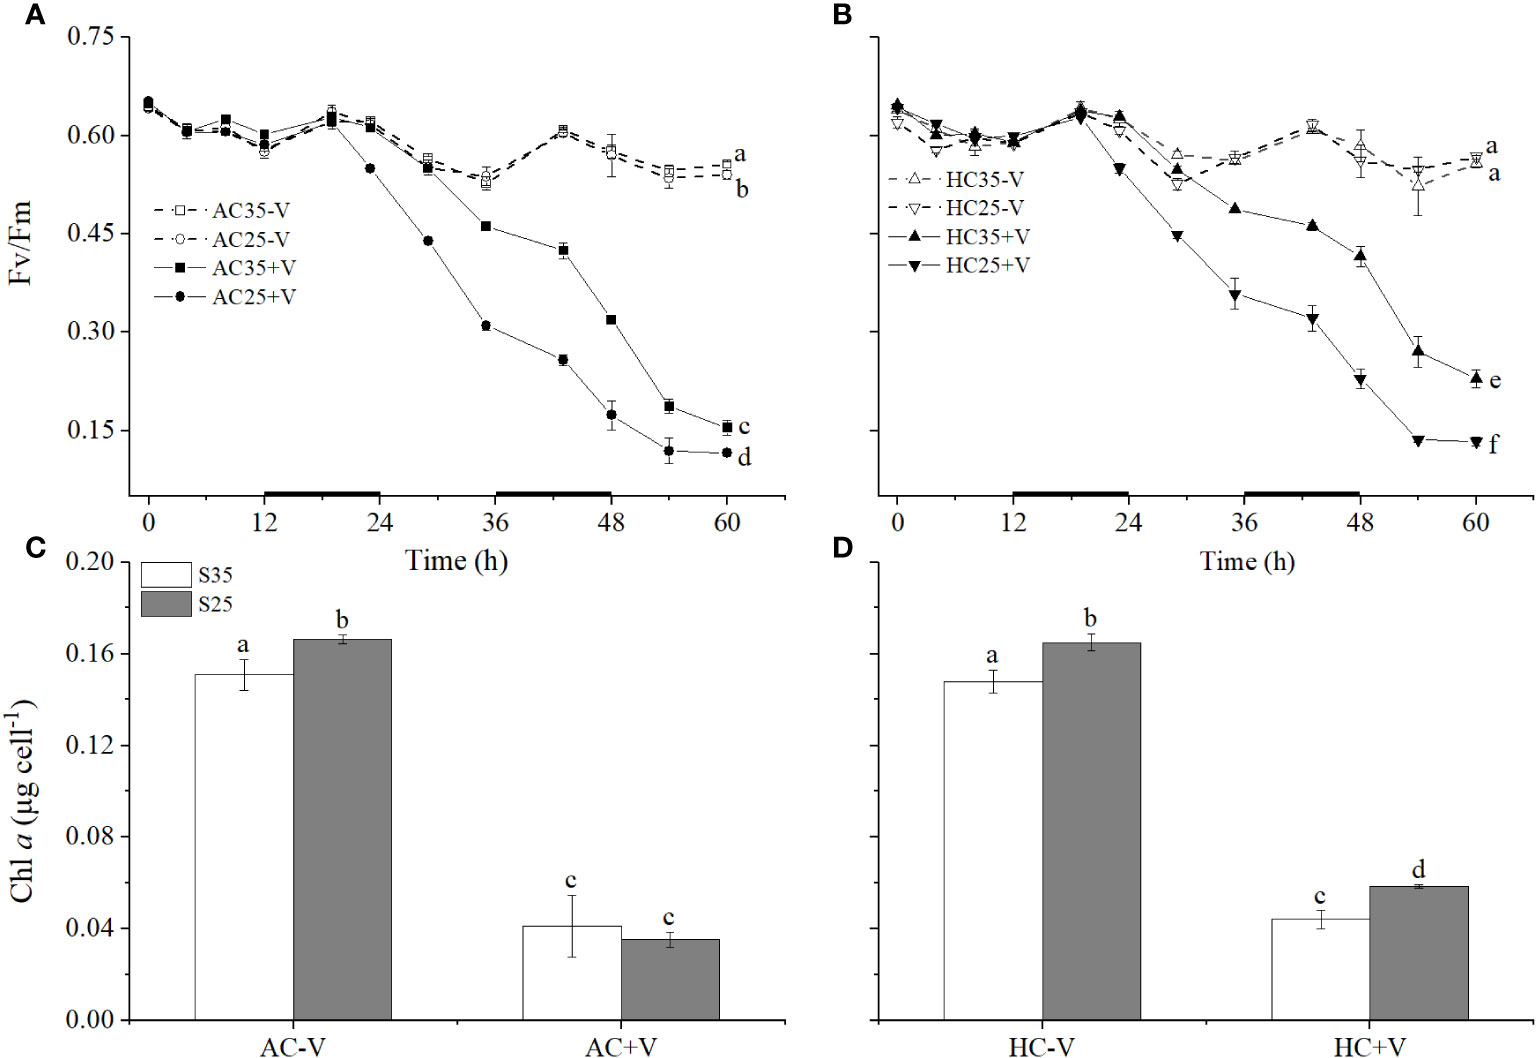
Figure 3 The maximal quantum yield (Fv/Fm) and Chl a contents of E. huxleyi cells infected with and without the virus under different levels of salinity (S35 and S25) and CO2 (AC and HC). (A, B), changes in Fv/Fm of E. huxleyi grown at S35 or S25 under AC or HC. (C, D), the Chl a of the end (84 h) of the cultures. Different letters above the bars represent significant differences between the treatments. The values are represented as the means ± SD of triplicate cultures.
The Chl a contents of E. huxleyi cells infected with EhV decreased significantly compared with the non-infected ones under S35 (p < 0.001 for AC and p < 0.001 for HC) and S25 treatments (p < 0.001 for AC and p < 0.001 for HC) (Figures 3C, D). The lower salinity treatment significantly increased the Chl a content by about 10% (p = 0.007) under AC and by about 12% (p = 0.003) under HC in the cells without the viral infection (Figures 3C, D), and also increased it in the cells infected with EhV by about 33% (p = 0.011) under HC (Figures 3C, D). Elevated pCO2 had no significant influence on the treatment without the virus, but it acted synergistically with lower salinity to increase the Chl a contents of E. huxleyi cells by about 63% (p < 0.001) compared with higher salinity in the cultures with the virus (Figures 3C, D).
Photosynthetic carbon fixation
Lowered salinity decreased the photosynthetic carbon fixation rate (per cell) of E. huxleyi cells infected with the virus by about 72% compared with the high salinity under HC (p = 0.003). The elevated pCO2 improved the carbon fixation rate per cell by about 145% (p = 0.004) at S35, and decreased it by about 35% (p = 0.266) at S25 (Figure 4A) compared to AC cultures. When the photosynthetic rate of the cells infected with the virus was normalized to Chl a, the low salinity treatment decreased the rate by about 79% compared with high salinity under HC (p < 0.001). The HC treatment increased it by about 109% (p = 0.001) at S35 but decreased it by about 61% (p = 0.003) at S25 (Figure 4B) compared to AC treatment, respectively.
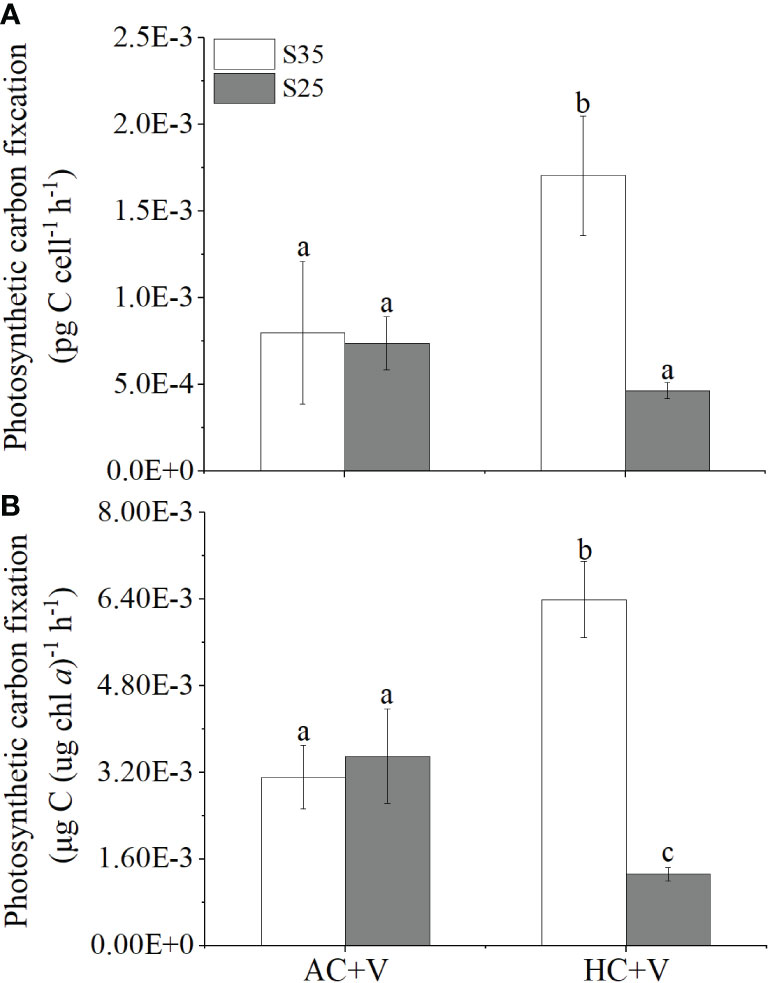
Figure 4 The photosynthetic carbon fixation rates of E. huxleyi infected with the virus under different levels of CO2 (AC or HC) and salinity (S35 or S25). (A), the carbon fixation rate per cell. (B), the Chl a-specific carbon fixation rate. The rates were measured in later period of the cultures (72 h) after the addition of the virus. Different letters above the bars represent significant differences between the treatments. The values are represented as the means ± SD of triplicate cultures.
Cellular POC and its production rate
The cellular POC of E. huxleyi infected with EhV were significantly higher than that of the non-infected cells, being increased by about 52% (p < 0.001 for S35) and 46% (p < 0.001 for S25) under AC, and by about 37% (p < 0.001 for S35) and 68% (p < 0.001 for S25) under HC treatments (Figure 5A). The lowered salinity increased the cellular POC by about 22% (p = 0.007) under AC and by 11% (p = 0.138) under HC compared to that at S35 in the cells without the viral infection, and increased it by about 18% (p = 0.002) under AC and 36% (p < 0.001) under HC in the cells infected with EhV, respectively. The viral infection decreased the POC production rates by about 246-400% compared to the non-infected cells, and lower salinity decreased it by about 57% compared to that at S35 under HC in the cells infected with the virus (Figure 5B).
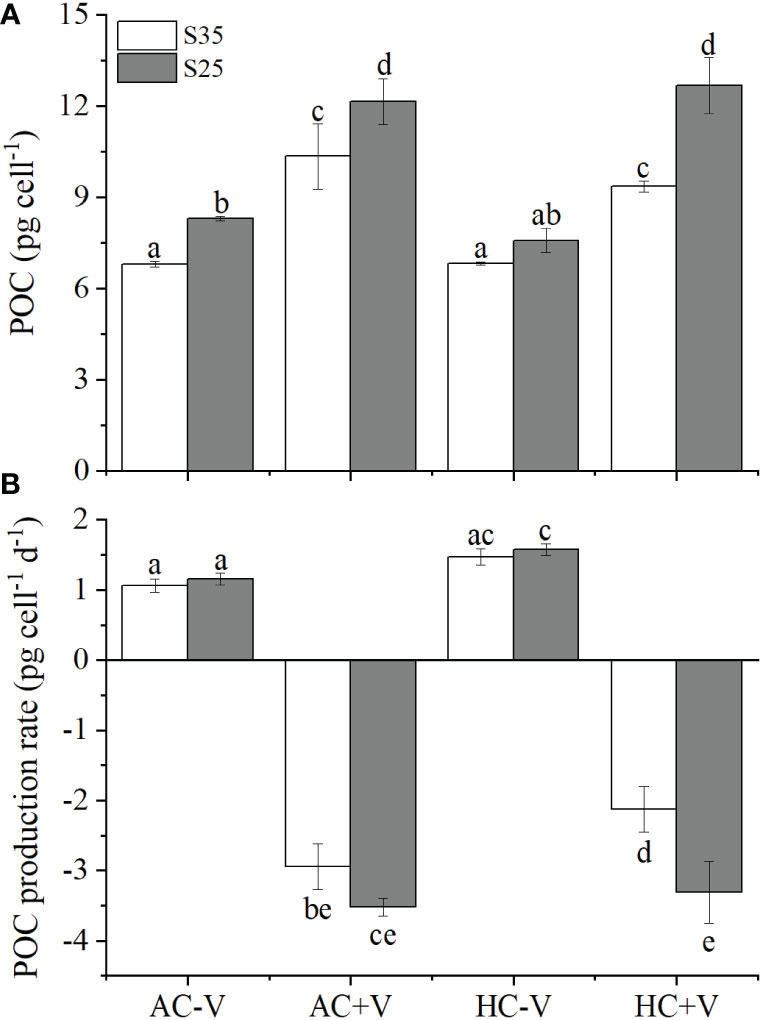
Figure 5 The cellular POC of E. huxleyi infected with or without the virus under different salinity (S35 or S25) and CO2 concentrations (AC or HC). (A), the cellular POC concentrations. (B), the POC production rate, based on the specific growth rates during the phase 2 (24-84 h). The POC samples were measured at 84 h. Different letters above the bars represent significant differences between the treatments. The values are represented as the means ± SD of triplicate cultures (n=3).
Discussion
Our results demonstrated that viral infection lowered the growth of E. huxleyi by impacting its photosynthetic performance, with decreased levels of photochemical efficiency and photosynthetic carbon fixation. The lowered salinity and elevated pCO2 synergistically exacerbated the viral infection, leading to the highest levels of burst size, though the elevated pCO2 appeared to enhance Fv/Fm and increase rates of photosynthetic carbon at the high salinity level.
It is known that microalgae and cyanobacteria are susceptible to their viruses and that the viral infection can cause directly or indirectly the disruption of photosynthesis, therefore altering other metabolisms (Thompson et al., 2011b). The interaction of E. huxleyi with its virus can be regulated by light (Thamatrakoln et al., 2019). In the present work, the virus EhV appeared to reduce the growth of E. huxleyi (BOF92) by damaging its photosynthesis systems, since its photochemical quantum yield started to decline in 24 h after the infection regardless of the CO2 and salinity levels (Figures 1, 3). The virus EhV has been suggested to decrease light use efficiency of the PSII reaction center and induce suppression of electron transport between photosystems in E. huxleyi (Bidle et al., 2007; Kimmance et al., 2014). In parallel, the virus may induce a decline in antioxidants, thus accelerating the damage of PSII complexes (Gilg et al., 2016). Our data on the photosynthetic carbon fixation also pointed to the possibility that the virus EhV can impact dark reactions of photosynthesis, then leading to less electron drains from the photosystems and decreasing the quantum yield (Figures 3, 4). Additionally, the pH in the cultures with the virus was lower than that without it, indicating that less removal of DIC by photosynthesis due to the viral infection (Table S2). In the red tide microalga, Phaeocystis globose, viral infections decreased its photosynthesis but increased its mitochondrial respiration (Chen et al., 2015). Thus, less removal of DIC in the cultures with the virus could be partially attributed to enhanced respiratory CO2 release. Consequently, the inevitably physiological consequences of the host with viral infection alter its growth and lifecycle (Figure 1).
Changes in salinity could affect periplasmic redox activity of microalgal cells since it alters ratios and concentrations of different ions and electrochemical gradients. Reduced salinity can lead to osmotic stress, thereby regulating the passive and active transport processes of CO2 and nutrients (Xu et al., 2020). In the present study, lower salinity exacerbated the negative effects of the viral infection on the physiological performance of E. huxleyi, with decreased levels of specific growth rate (phase1), Fv/Fm, and carbon fixation even under the elevated pCO2 (Figures 1, 3 and 4), indicating that changed periplasmic redox activity along with the reduced salinity facilitated the viral attack to its host E. huxleyi. It is also likely that extra energy to deal with the osmotic stress caused by lower salinity decrease the alga’s resistance to the virus (Paasche et al., 1996; Gebühr et al., 2021). On the other hand, E. huxleyi could be carbon-limited due to the unsaturated photosynthesis in E. huxleyi at lower salinity (Bach et al., 2013), where DIC was reduced significantly compared with the control (S35) (Tables S1, S2) (Paasche et al., 1996; Herfort et al., 2002). Therefore, it is reasonable to attribute the enhanced viral attack to E. huxleyi under lower salinity to changed redox activity as well as to reduced photosynthetic energy supply because of the osmotic stress.
Elevated pCO2 projected for future ocean acidification has been shown to exacerbate viral attack to the red tide microalga Phaeocystis globose (Chen et al., 2015). In the present study, we also observed that the elevated pCO2 led to significant increase of the burst size of the virus for E. huxleyi, especially under the low salinity (Figure 2),along with remarkable decline of the photosynthetic carbon fixation rates per Chl a under the low salinity (Figure 4), though the elevated pCO2 appeared to have mitigated the decrease of Chl a in the E. huxleyi cells infected with EhV (Figure 3D). It is likely that the elevated pCO2 enhanced the chlorophyl synthesis, which, however, did not directly lead to increased photosynthetic carbon fixation due to the viral disruption of photosynthetic electron transport as well as carboxylation of Ribulose-1,5-bisphosphate carboxylase oxygenase (RubisCO). The photosynthetic carbon fixation rates of E. huxleyi normalized to Chl a in the high-pCO2 grown cells with the virus infection were significantly higher than that in AC-grown ones under S35, and the rates were reduced by about 88% compared with the cells non-infected with the virus (Figures 4, S3). Increased CO2 availability can enhance the carboxylation of RubisCO, which then accelerates the electron transport between PS II to PS I and consequently increases the Fv/Fm (McCarthy et al., 2012). In the present work, the DIC levels in the cultures would be increased due to bacterial degradation of organic carbon derived from the viral lysis of the algal cells (Murray, 1995; Brussaard, 2004), since the bacteria can hardly interact with the alga-specific virus to influence the DIC levels DIC levels were mainly modulated by the salinity and pCO2 treatments (Tables S1, S2). Irrespective of the pCO2 levels, the viral infection decreased the cell density of E. huxleyi decreased rapidly along with decreased photosynthetic performances (Figures 1A, B). In contrast, in the cultures without the virus, the cell density sustained at high levels, indicating that photosynthetic energy supply in the cells non-infected with the virus played the key role to maintain the maximal cell density even when it reached the plateau. On the other hand, increased photosynthetic energy supply could have resulted in a higher viral propagation, consequently leading to a higher burst size, which was enhanced by up to 18% under S35 (Figure 2C). This is consistent with that the burst size of EhV99B1 was higher in the cultures of E. huxleyi under the elevated (700 ppmv) compared with the reduced pCO2 (280 ppmv) (Carreira et al., 2013). Together with the results of this work, it is recognized that lowered levels of pH associated with elevated pCO2 enhance lysis of algal cells by the virus and consequently result in larger burst size.
The lyses of phytoplankton cells by viruses directly affect the standing stock of particulate organic carbon (POC) and dissolved organic carbon (DOC) (Danovaro et al., 2011). Viral infection could enhance the production of particulate inorganic carbon (PIC) (Vincent et al., 2021), and facilitate the downward vertical flux of POC in the North Atlantic (Laber et al., 2018). In this study, the E. huxleyi strain did not calcify (Figure S1), and we were unable to look into this aspect. However, we found that the viral infection enhanced the cellular POC of E. huxleyi by up to 1.5-fold, and that lower salinity increased the cellular POC of in the E. huxleyi cells either infected or non-infected with the virus (Figure 5A). Since the POC quota were measured with the non-lysed cells, such increased POC values could be attributed to that the cells resistant to the virus survived and accumulated organic compounds produced during photosynthesis. When the lysis was considered, the POC production rates of E. huxleyi infected with EhV was much lower than the control because of the remarkable reduction of the specific growth rate (Figures 1C, D and 5B). Viral infection and lyses of microbial cells may accelerate carbon export to deep oceans (Zhang et al., 2021). The liberation of products from lysed cells by viruses could also increase amounts of DOC (Suttle, 2005; Danovaro et al., 2011; Zhang et al., 2021), implying that viruses could accelerate nutrients cycles via the microbial food web. The interplay of lower salinity and elevated pCO2 on the virus infection to E. huxleyi, reported here implies that ocean acidification and lower salinity would synergistically affect the biogeochemical processes in the waters where its blooms frequently occur, which may influence carbon export to the deep ocean and/or increase DOC accumulation in seawater. It should be noted that ocean climate changes not only directly affect physiology of marine phytoplankton but may also alter their relationship with viruses, thus ultimately affecting marine productivity and carbon cycling.
Data availability statement
The raw data supporting the conclusions of this article will be made available by the authors, without undue reservation.
Author contributions
KG designed the experiments. FQ carried out the experiments. Both contributed to data analysis and manuscript writing. All authors contributed to the article and approved the submitted version.
Funding
This study was supported by the national key R&D program (2022YFC3105303) and National Natural Science Foundation of China (41721005, 41720104005, 41890803).
Acknowledgments
The authors are grateful to Prof. Jingwen Liu for provision of the virus and its host, to the Ph.D. student He Li and the former Ph.D. student Di Zhang for their technical assistance and to the laboratory engineers Xianglan Zeng and Wenyan Zhao for their logistical and technical support.
Conflict of interest
The authors declare that the research was conducted in the absence of any commercial or financial relationships that could be construed as a potential conflict of interest.
Publisher’s note
All claims expressed in this article are solely those of the authors and do not necessarily represent those of their affiliated organizations, or those of the publisher, the editors and the reviewers. Any product that may be evaluated in this article, or claim that may be made by its manufacturer, is not guaranteed or endorsed by the publisher.
Supplementary material
The Supplementary Material for this article can be found online at: https://www.frontiersin.org/articles/10.3389/fmars.2022.1091476/full#supplementary-material
References
Bach L. T., Mackinder L. C., Schulz K. G., Wheeler G., Schroeder D. C., Brownlee C., et al. (2013). Dissecting the impact of CO2 and pH on the mechanisms of photosynthesis and calcification in the coccolithophore Emiliania huxleyi. New Phytol. 199, 121–134. doi: 10.1111/nph.12225
Bertzbach L. D., Kaufer B. B., Karger A. (2021). Applications of mass spectrometry imaging in virus research. Adv. Virus Res. 109, 31–62. doi: 10.1016/bs.aivir.2020.10.002
Bidle K. D., Haramaty L., Barcelos e Ramos J., Falkowski P. (2007). Viral activation and recruitment of metacaspases in the unicellular coccolithophore, Emiliania huxleyi. Proc. Natl. Acad. Sci. U.S.A. 104, 6049–6054. doi: 10.1073/pnas.0701240104
Bonomo S., Cascella A., Alberico I., Ferraro L., Giordano L., Lirer F., et al. (2014). Coccolithophores from near the volturno estuary (central tyrrhenian Sea). Mar. Micropaleontol 111, 26–37. doi: 10.1016/j.marmicro.2014.06.001
Brand L. E. (1984). The salinity tolerance of forty-six marine phytoplankton isolates. Estuar. Coast. Shelf S 18, 543–556. doi: 10.1016/0272-7714(84)90089-1
Bratbak G., Egge J. K., Heldal M. (1993). Viral mortality of the marine alga Emiliania huxleyi (Haptophyceae) and termination of algal blooms. Mar. Ecol-Prog Ser. 93, 39–48. Available at: http://www.jstor.org/stable/24832806.
Bratbak G., Heldal M., Norland S., Thingstad T. F. (1990). Viruses as partners in spring bloom microbial trophodynamics. Appl. Environ. Microb. 56, 1400–1405. doi: 10.1128/aem.56.5.1400-1405.1990
Brussaard C. P. (2004). Viral control of phytoplankton populations-a review1. J. Eukaryotic Microbiol. 51, 125–138. doi: 10.1111/j.1550-7408.2004.tb00537.x
Brussaard C., Short S., Frederickson C., Suttle C. (2004). Isolation and phylogenetic analysis of novel viruses infecting the phytoplankton Phaeocystis globosa (Prymnesiophyceae). Appl. Environ. Microb. 70, 3700–3705. doi: 10.1128/AEM.70.6.3700-3705.2004
Carreira C., Heldal M., Bratbak G. (2013). Effect of increased pCO2 on phytoplankton-virus interactions. Biogeochemistry 114, 391–397. doi: 10.1007/s10533-011-9692-x
Castberg T., Thyrhaug R., Larsen A., Sandaa R. A., Heldal M., Van Etten J. L., et al. (2002). Isolation and characterization of a virus that infects Emiliania huxleyi (Haptophyta). J. Phycol 38, 767–774. doi: 10.1046/j.1529-8817.2002.02015.x
Chen S., Gao K., Beardall J. (2015). Viral attack exacerbates the susceptibility of a bloom-forming alga to ocean acidification. Global Change Biol. 21, 629–636. doi: 10.1111/gcb.12753
Correa A., Howard-Varona C., Coy S. R., Buchan A., Sullivan M. B., Weitz J. S. (2021). Revisiting the rules of life for viruses of microorganisms. Nat. Rev. Microbiol. 19, 501–513. doi: 10.1038/s41579-021-00530-x
Danovaro R., Corinaldesi C., Dell’Anno A., Fuhrman J. A., Middelburg J. J., Noble R. T., et al. (2011). Marine viruses and global climate change. FEMS Microbiol. Rev. 35, 993–1034. doi: 10.1111/j.1574-6976.2010.00258.x
Doney S. C., Fabry V. J., Feely R. A., Kleypas J. A. (2009). Ocean acidification: the other CO2 problem. Annu. Rev. Mar. Sci. 1, 169–192. doi: 10.1146/annurev.marine.010908.163834
Eppley R. W., Holmes R. W., Strickland J. D. (1967). Sinking rates of marine phytoplankton measured with a fluorometer. J. Exp. Mar. Biol. Ecol. 1, 191–208. doi: 10.1016/0022-0981(67)90014-7
Gao K., Wu Y., Li G., Wu H., Villafane V. E., Helbling E. W. (2007). Solar UV radiation drives CO2 fixation in marine phytoplankton: A double-edged sword. Plant Physiol. 144, 54–59. doi: 10.1104/pp.107.098491
Gebühr C., Sheward R. M., Herrle J. O., Bollmann J. (2021). Strain-specific morphological response of the dominant calcifying phytoplankton species Emiliania huxleyi to salinity change. PloS One 16, e0246745. doi: 10.1371/journal.pone.0246745
Gilg I. C., Archer S. D., Floge S. A., Fields D. M., Vermont A. I., Leavitt A. H., et al. (2016). Differential gene expression is tied to photochemical efficiency reduction in virally infected Emiliania huxleyi. Mar. Ecol-Prog Ser. 555, 13–27. doi: 10.3354/meps11805
Godrijan J., Young J. R., Marić Pfannkuchen D., Precali R., Pfannkuchen M. (2018). Coastal zones as important habitats of coccolithophores: A study of species diversity, succession, and life-cycle phases. Limnol Oceanogr 63, 1692–1710. doi: 10.1002/lno.10801
Herfort L., Thake B., Roberts J. (2002). Acquisition and use of bicarbonate by Emiliania huxleyi. New Phytol. 156, 427–436. doi: 10.1046/j.1469-8137.2002.00523.x
Holligan P. M., Fernández E., Aiken J., Balch W. M., Boyd P., Burkill P. H., et al. (1993a). A biogeochemical study of the coccolithophore, Emiliania huxleyi, in the north Atlantic. Global Biogeochem Cy 7, 879–900. doi: 10.1029/93GB01731
Holligan P. M., Groom S. B., Harbour D. S. (1993b). What controls the distribution of the coccolithophore, Emiliania huxleyi, in the north Sea? Fish Oceanogr 2, 175–183. doi: 10.1111/j.1365-2419.1993.tb00133.x
Kimmance S. A., Allen M. J., Pagarete A., Martínez J. M., Wilson W. H. (2014). Reduction in photosystem II efficiency during a virus-controlled Emiliania huxleyi bloom. Mar. Ecol-Prog Ser. 495, 65–76. doi: 10.3354/meps10527
Kitajima M., Butler W. (1975). Quenching of chlorophyll fluorescence and primary photochemistry in chloroplasts by dibromothymoquinone. BBA-Bioenergetics 376, 105–115. doi: 10.1016/0005-2728(75)90209-1
Knowles B., Bonachela J. A., Behrenfeld M. J., Bondoc K. G., Cael B., Carlson C. A., et al. (2020). Temperate infection in a virus-host system previously known for virulent dynamics. Nat. Commun. 11, 1–13. doi: 10.1038/s41467-020-18078-4
Laber C. P., Hunter J. E., Carvalho F., Collins J. R., Hunter E. J., Schieler B. M., et al. (2018). Coccolithovirus facilitation of carbon export in the north Atlantic. Nat. Microbiol. 3, 537–547. doi: 10.1038/s41564-018-0128-4
Larsen J., Larsen A., Thyrhaug R., Bratbak G., Sandaa R.-A. (2008). Response of marine viral populations to a nutrient induced phytoplankton bloom at different pCO2 levels. Biogeosciences 5, 523–533. doi: 10.5194/bg-5-523-2008
Lewis E., Wallace D. (1998). R: Program developed for CO2 system calculations ORNL/CDIAC-105 (Oak Ridge, Tennessee: Carbon Dioxide Information Analysis CentreOak Ridge National Laboratory, US Department of Energy).
Liu J., Cai W., Fang X., Wang X., Li G. (2018). Virus-induced apoptosis and phosphorylation form of metacaspase in the marine coccolithophorid Emiliania huxleyi. Arch. Microbiol. 200, 413–422. doi: 10.1007/s00203-017-1460-4
Malitsky S., Ziv C., Rosenwasser S., Zheng S., Schatz D., Porat Z., et al. (2016). Viral infection of the marine alga Emiliania huxleyi triggers lipidome remodeling and induces the production of highly saturated triacylglycerol. New Phytol. 210, 88–96. doi: 10.1111/nph.13852
Mansour M. M. F. (2013). Plasma membrane permeability as an indicator of salt tolerance in plants. Biol. Plantarum 57, 1–10. doi: 10.1007/s10535-012-0144-9
Massana R., Del Campo J., Dinter C., Sommaruga R. (2007). Crash of a population of the marine heterotrophic flagellate Cafeteria roenbergensis by viral infection. Environ. Microbiol. 9, 2660–2669. doi: 10.1111/j.1462-2920.2007.01378.x
McCarthy A., Rogers S. P., Duffy S. J., Campbell D. A. (2012). Elevated carbon dioxide differentially alters the photophysiology of Thalassiosira pseudonana (bacillariophyceae) and Emiliania huxleyi (haptophyta). J. Phycol 48, 635–646. doi: 10.1111/j.1529-8817.2012.01171.x
Mojica K. D., Brussaard C. P. (2014). Factors affecting virus dynamics and microbial host-virus interactions in marine environments. FEMS Microbiol. Ecol. 89, 495–515. doi: 10.1111/1574-6941.12343
Murray A. G. (1995). Phytoplankton exudation: exploitation of the microbial loop as a defence against algal viruses. J. Plankton Res. 17, 1079–1094. doi: 10.1093/plankt/17.5.1079
Nanninga H., Tyrrell T. (1996). Importance of light for the formation of algal blooms by Emiliania huxleyi. Mar. Ecol-Prog Ser. 136, 195–203. doi: 10.3354/meps136195
Paasche E., Brubak S., Skattebøl S., Young J., Green J. (1996). Growth and calcification in the coccolithophorid Emiliania huxleyi (Haptophyceae) at low salinities. Phycologia 35, 394–403. doi: 10.2216/i0031-8884-35-5-394.1
Parada V., Herndl G. J., Weinbauer M. G. (2006). Viral burst size of heterotrophic prokaryotes in aquatic systems. J. Mar. Biol. Assoc. UK 86, 613–621. doi: 10.1017/S002531540601352X
Pelletier G., Lewis E., Wallace D. (2005). A calculator for the CO2 system in seawater for Microsoft Excel/VBA. Washington state department of ecology. Olympia WA Brookhaven Natl. Laboratory Upton NY.
Poulton A. J., Adey T. R., Balch W. M., Holligan P. M. (2007). Relating coccolithophore calcification rates to phytoplankton community dynamics: Regional differences and implications for carbon export. Deep-Sea Res. PT II 54, 538–557. doi: 10.1016/j.dsr2.2006.12.003
Rabatel A., Francou B., Soruco A., Gomez J., Cáceres B., Ceballos J. L., et al. (2013). Current state of glaciers in the tropical Andes: a multi-century perspective on glacier evolution and climate change. Cryosphere 7, 81–102. doi: 10.5194/tc-7-81-2013
Ritchie R. J. (2006). Consistent sets of spectrophotometric chlorophyll equations for acetone, methanol and ethanol solvents. Photosynth Res. 89, 27–41. doi: 10.1007/s11120-006-9065-9
Roy R. N., Roy L. N., Vogel K. M., Porter-Moore C., Pearson T., Good C. E., et al. (1993). The dissociation constants of carbonic acid in seawater at salinities 5 to 45 and temperatures 0 to 45°C;. Mar. Chem. 44, 249–267. doi: 10.1016/0304-4203(93)90207-5
Salisbury J. E., Jönsson B. F. (2018). Rapid warming and salinity changes in the gulf of Maine alter surface ocean carbonate parameters and hide ocean acidification. Biogeochemistry 141, 401–418. doi: 10.1007/s10533-018-0505-3
Saruwatari K., Satoh M., Harada N., Suzuki I., Shiraiwa Y. (2016). Change in coccolith size and morphology due to response to temperature and salinity in coccolithophore Emiliania huxleyi (Haptophyta) isolated from the Bering and chukchi seas. Biogeosciences 13, 2743–2755. doi: 10.5194/bg-13-2743-2016
Schroeder D., Oke J., Malin G., Wilson W. (2002). Coccolithovirus (Phycodnaviridae): Characterisation of a new large dsDNA algal virus that infects Emiliana huxleyi. Arch. Virol. 147, 1685–1698. doi: 10.1007/s00705-002-0841-3
Short S. M. (2012). The ecology of viruses that infect eukaryotic algae. Environ. Microbiol. 14, 2253–2271. doi: 10.1111/j.1462-2920.2012.02706.x
Short S. M., Staniewski M. A., Chaban Y. V., Long A. M., Wang D. (2020). Diversity of viruses infecting eukaryotic algae. Curr. Issues Mol. Biol. 39, 29–62. doi: 10.21775/cimb.039.029
Soruco A., Vincent C., Rabatel A., Francou B., Thibert E., Sicart J. E., et al. (2015). Contribution of glacier runoff to water resources of la paz city, Bolivia (16 s). Ann. Glaciology 56, 147–154. doi: 10.3189/2015AoG70A001
Suttle C. A. (2007). Marine viruses-major players in the global ecosystem. Nat. Rev. Microbiol. 5, 801–812. doi: 10.1038/nrmicro1750
Suttle C. A., Chan A. M., Cottrell M. (1990). Infection of phytoplankton by viruses and reduction of primary productivity. Nature 347, 467–469. doi: 10.1038/347467a0
Thamatrakoln K., Talmy D., Haramaty L., Maniscalco C., Latham J. R., Knowles B., et al. (2019). Light regulation of coccolithophore host-virus interactions. New Phytol. 221, 1289–1302. doi: 10.1111/nph.15459
Thompson L. G., Mosley-Thompson E., Davis M. E., Brecher H. H. (2011a). Tropical glaciers, recorders and indicators of climate change, are disappearing globally. Ann. Glaciol 52, 23–34. doi: 10.3189/172756411799096231
Thompson L. R., Zeng Q., Kelly L., Huang K. H., Singer A. U., Stubbe J., et al. (2011b). Phage auxiliary metabolic genes and the redirection of cyanobacterial host carbon metabolism. Proc. Natl. Acad. Sci. U.S.A. 108, E757–E764. doi: 10.1073/pnas.1102164108
Tong S., Hutchins D. A., Gao K. (2019). Physiological and biochemical responses of Emiliania huxleyi to ocean acidification and warming are modulated by UV radiation. Biogeosciences 16, 561–572. doi: 10.5194/bg-16-561-2019
Vincent F., Gralka M., Schleyer G., Schatz D., Cabrera-Brufau M., Kuhlisch C., et al. (2021). Viral infection switches the balance between bacterial and eukaryotic recyclers of organic matter during algal blooms. bioRxiv. doi: 10.1101/2021.10.25.465659
Wilson W. H., Schroeder D. C., Allen M. J., Holden M. T., Parkhill J., Barrell B. G., et al. (2005). Complete genome sequence and lytic phase transcription profile of a Coccolithovirus. Science 309, 1090–1092. doi: 10.1126/science.1113109
Xu J., Sun J., Beardall J., Gao K. (2020). Lower salinity leads to improved physiological performance in the coccolithophorid Emiliania huxleyi, which partly ameliorates the effects of ocean acidification. Front. Mar. Sci. 7. doi: 10.3389/fmars.2020.00704
Yang Y., Cai L., Ma R., Xu Y., Tong Y., Huang Y., et al. (2017). A novel roseosiphophage isolated from the oligotrophic south China Sea. Viruses 9, 109. doi: 10.3390/v9050109
Zhang E., Gao J., Wei Z., Zeng J., Li J., Li G., et al. (2022). MicroRNA-mediated regulation of lipid metabolism in virus-infected Emiliania huxleyi. ISME J. 16, 1–10. doi: 10.1038/s41396-022-01291-y
Keywords: elevated pCO2, Emiliania huxleyi, growth, photosynthesis, salinity, virus
Citation: Fu Q and Gao K (2022) Reduced salinity exacerbates the viral infection on the coccolithophorid Emiliania huxleyi at elevated pCO2. Front. Mar. Sci. 9:1091476. doi: 10.3389/fmars.2022.1091476
Received: 08 November 2022; Accepted: 08 December 2022;
Published: 21 December 2022.
Edited by:
Anne Michelle Wood, University of Oregon, United StatesReviewed by:
Hualong Wang, Ocean University of China, ChinaWanchun Guan, Wenzhou Medical University, China
Copyright © 2022 Fu and Gao. This is an open-access article distributed under the terms of the Creative Commons Attribution License (CC BY). The use, distribution or reproduction in other forums is permitted, provided the original author(s) and the copyright owner(s) are credited and that the original publication in this journal is cited, in accordance with accepted academic practice. No use, distribution or reproduction is permitted which does not comply with these terms.
*Correspondence: Kunshan Gao, ksgao@xmu.edu.cn