The onset process of the 2018/2019 Indonesian–Australian summer monsoon: The importance of the air–sea interaction
 Yongliang Duan1,2,3*
  Hongwei Liu4
  Ming Feng5,6
  Xiangzhou Song7 Kuiping Li1,2,3
  Lin Liu1,2,3 Baochao Liu1,2,3
  Guang Yang1,2,3
  Weidong Yu2,8,9,10*
- 1Key Laboratory of Marine Science and Numerical Modeling, First Institute of Oceanography, Ministry of Natural Resources, Qingdao, China
- 2Laboratory for Regional Oceanography and Numerical Modeling, Qingdao National Laboratory for Marine Science and Technology, Qingdao, China
- 3Shandong Key Laboratory of Marine Science and Numerical Modeling, Qingdao, China
- 4CAS Key Laboratory of Ocean Circulation and Waves, Institute of Oceanology, Chinese Academy of Sciences, and Qingdao National Laboratory for Marine Science and Technology, Qingdao, China
- 5CSIRO Oceans and Atmosphere, Crawley, WA, Australia
- 6Centre for Southern Hemisphere Oceans Research, Hobart, TAS, Australia
- 7Key Laboratory of Marine Hazards Forecasting, Ministry of Natural Resources, Hohai University, Nanjing, China
- 8School of Atmospheric Sciences, Sun Yat-Sen University, Zhuhai, China
- 9Key Laboratory of Tropical Atmosphere-Ocean System (Sun Yat-Sen University), Ministry of Education, Zhuhai, China
- 10Southern Marine Science and Engineering Guangdong Laboratory (Zhuhai), Zhuhai, China
The Madden–Julian oscillation (MJO) and its associated air–sea interactions during the onset process of the 2018/2019 Indonesian–Australian summer monsoon (IASM) are investigated based on the in situ data from a moored buoy off the coast of northwest Australia, along with ERA5 reanalysis and satellite data. The results verify that the IASM onset in mid-December 2018 was triggered by the first-branch eastward-propagating MJO (FEMJO) originating from the tropical Indian Ocean. However, the strong negative SST anomaly (SSTA) was evident off northwest Australia, which weakens FEMJO over northern Australia and shifts the convective center further northward. The mixed layer heat budget analysis based on the buoy observations reveals that the increased latent heat loss that occurred before the arrival of the FEMJO convection was primarily attributed to the large air–sea temperature difference and strong winds, resulting in the pronounced SSTA.
1. Introduction
The Indonesian–Australian monsoon (IAM) in the Southern Hemisphere, as an important component of the Asian–Australian monsoon system, covers a wide region of the southern maritime continent and northern Australia. The seasonal transition of the Indonesian–Australian summer monsoon (IASM), which normally occurs in late December, is typically characterized by abrupt dry–wet changes and prevailing winds shifting from southeasterly to northwesterly (Hendon and Liebmann, 1990a; Chang et al., 2004; see also Figure 1). The timing of the IASM onset has a substantial impact on the regional climate and marine ecosystem, which makes it one of the most crucial foci of monsoon research, prediction, and application. The significantly delayed IASM onset in 2019/2020 is such an example, which directly induced extreme warm-dry weather and heatwave conditions from December 2019 to January 2020 and caused severe coral bleaching and increased wildfire activity in the IASM region (Wang and Cai, 2020). Therefore, it is crucial to explore the detailed process of the IASM onset and its underlined mechanisms in order to improve regional monsoon forecasting.
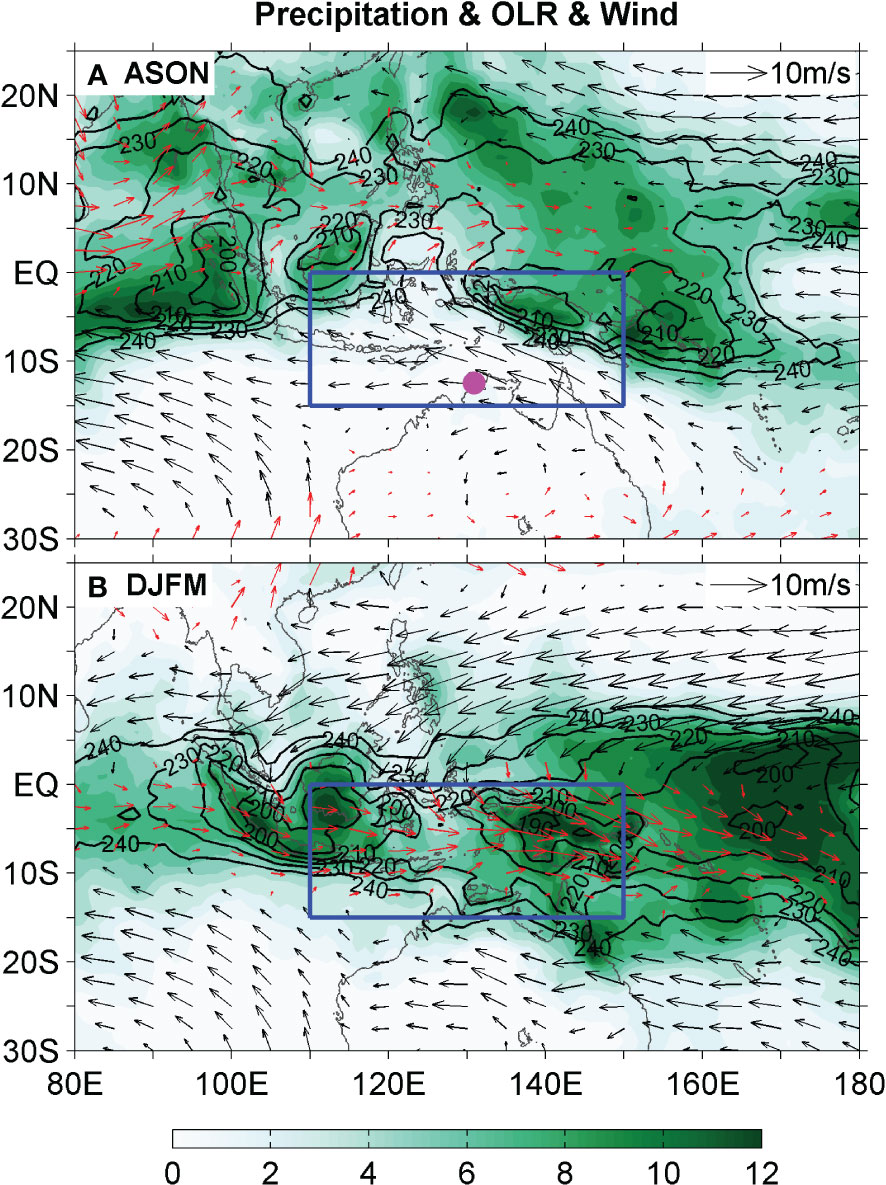
Figure 1 The seasonal patterns of the IAM system for (A) August–November 2018 and (B) December 2018–March 2019: GPCP precipitation (shaded; mm day−1), NOAA OLR (black contours; only values lower than 240 W m−2 are shown), and ERA5 wind field (vectors; m s−1). The red (black) vectors indicate that the zonal component of the wind is westerly (easterly). The blue box (0°–15°S, 110°–150°E) superimposed on the plot indicates the region of the IAM system in the present study. The magenta dot in (A) indicates the Darwin airport station (station number: 14015), Australian Bureau of Meteorology.
With the longer station records available from Darwin and reanalysis datasets, the large-scale circulation changes, associated mechanisms, and multi-time-scale variations of the IASM onset have been much discussed in previous literatures (e.g., Holland, 1986; Hendon and Liebmann, 1990a; Hendon and Liebmann, 1990b; Suppiah, 1993; Drosdowsky, 1996; Hung and Yanai, 2004; Wheeler and McBride, 2005; Kullgren and Kim, 2006; Kim et al., 2006; Kajikawa et al., 2010). It is well noted that the remarkable sea-surface temperature (SST) warming occurs off the coast of northern Australia during the premonsoon period, and the subsequent IASM onset always coincides with the arrival of the active Madden–Julian oscillation (MJO; Hendon and Liebmann, 1990a; Kawamura et al., 2002; Wheeler and McBride, 2005). It was recently further revealed that a robust phase-locking relationship exists among the regional SST maximum north of Australia, the first-branch eastward-propagating MJO (FEMJO) originating from the tropical southwestern Indian Ocean, and the IASM onset (Duan et al., 2019).
The MJO is one of the major systems affecting the IASM, typically causing large-scale heavy rainfall across northern Australia and the maritime continent (Hendon and Liebmann, 1990b; Berry and Reeder, 2016). The 2018/2019 IASM experienced three pulses of the MJO, as shown in Figures 2A, B. From December 2018, MJO originating from the tropical Indian Ocean began to veer southeastward from its previous northeastward propagation route in the eastern Indian Ocean and passed through the IASM region. In its active phases, the prevailing northwesterly winds strengthen and widespread rainfall moves across the monsoon region. In contrast, the suppressed phases of the MJO are generally associated with weakened northwesterlies and even transient reversals and reduced rainfall conditions. The IASM finally retreated in early April 2019, with the southeasterly once again dominating the monsoon region (Figure 2B).
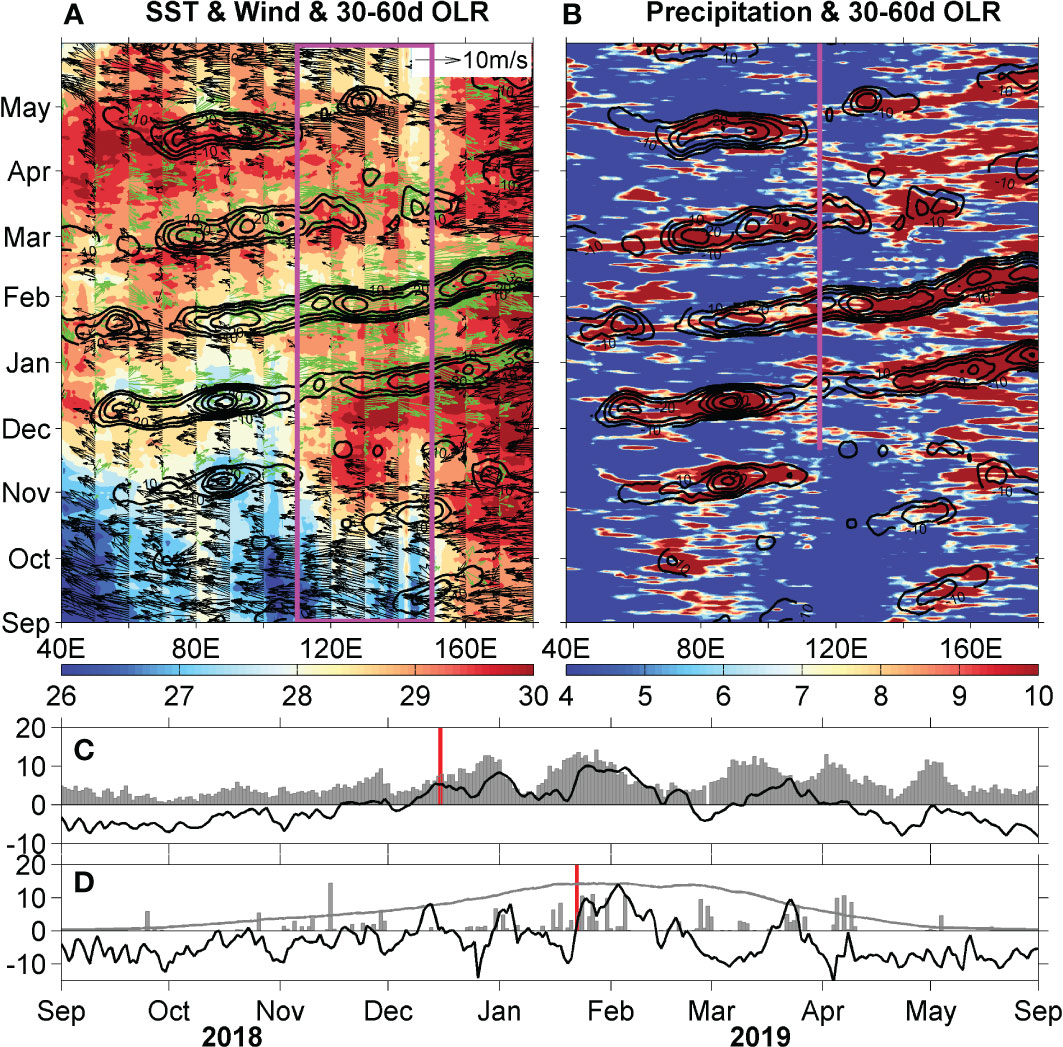
Figure 2 Longitude-time diagram of the meridionally averaged (A) SST (shaded; °C), wind field (vectors; m s−1), 30–60-day bandpass-filtered OLR anomaly (contours; W m−2; only values lower than −10 W m−2 are plotted), and (B) precipitation (shaded; mm day−1) and repeated 30–60-day OLR anomaly (contours) from September 2018 to May 2019, all averaged between 15°S and 0°. The magenta box in (A) indicates the IASM region. The green (black) vectors in (A) mean that the zonal winds are westward (eastward). The thin magenta line in (B) denotes the position and available observation period of the moored buoy. Time series of (C) the daily area-averaged zonal wind (black line; m s−1) and precipitation (gray bars; mm day−1) over the IASM region and (D) the zonal wind (black line; m s−1), precipitation (gray bars; mm day−1, reduced by a factor of 5), and climatological daily mean precipitation (gray line) at Darwin airport station. The thick red bar indicates the onset date of the 2018/2019 IASM defined in the present study (C) and that officially declared by the Australian Bureau of Meteorology (D).
The IASM onset is traditionally defined as the arrival of northwesterly winds accompanied by widespread rainfall (Lisonbee et al., 2020). Following this criterion, the time series of area-averaged zonal wind and rainfall shows that the dry regime of low-level easterlies persisted until early December (Figure 2C). Subsequently, the zonal wind became westerly, and rainfall increased dramatically. Thus, the onset of the 2018/2019 IASM occurred in mid-December and was concurrent with the arrival of the FEMJO, which is well consistent with our previous theory (Duan et al., 2019). However, based on the station observations at Darwin (Figure 2D), the Australian Bureau of Meteorology has declared that the official onset data for the 2018/2019 IASM is 23 January 2019, which is the third latest monsoon onset on record at Darwin (see the analysis in the weekly Tropical Climate Note archive, www.bom.gov.au/climate/tropical-note/archive.shtml). It is very confusing to have different onset dates for the 2018/2019 IASM following the different onset definitions.
How to understand such significantly conflicting onset data of the 2018/2019 IASM? And what processes are responsible for it? We attempt to address these questions and reveal their associated mechanisms in the present study. Recently, a field campaign under the umbrella of the Years of the Maritime Continent (YMC; Yoneyama and Zhang, 2020) was conducted off northwest Australia to capture the air–sea interactions during the 2018/2019 IASM (Feng et al., 2020; Song et al., 2021). This gave us the valuable chance to decipher the mystery of the 2018/2019 IASM onset. The focus of the present study is (1) to describe the detailed evolution of the 2018/2019 IASM from the pre- to postmonsoon period and (2) to quantitatively examine the air–sea interactions that modulate the IASM onset.
2. Data and methods
One Bailong buoy was deployed on 21 November 2018 at 16°51.432′S, 115°13.314′E and retrieved on 4 January 2020. It measured the surface meteorological parameters including air temperature, pressure, wind speed and direction, relative humidity, downward shortwave, longwave radiation, and rainfall (see Supplementary Tables ES1, ES2 of Feng et al. (2020) for the sensors’ configuration and technical specifications). The buoy also measured the upper ocean temperature at 1 (nominally designated SST), 10, 20, 40, 60, 80, 100, 120, 140, 200, 300, and 500 m depth levels. The oceanic conductivity was measured at 1, 10, 20, 40, 60, 80, 100, 140, and 300 m. The surface meteorological and subsurface oceanographic measurements were all observed at 10-min intervals. Hourly ocean currents were measured at depths of 10 and 100 m.
In this study, the air–sea heat fluxes are calculated from the buoy data with COARE 3.0 bulk formula (Fairall et al., 2003). The observed upper ocean temperature, salinity, and current data at discrete depths are used to examine the daily mixed layer heat budget. The mixed layer heat budget equation is written as:
The individual terms of the equation above represent, from left to right, the mixed layer temperature (MLT) tendency, net surface heat flux (NSHF), horizontal advection (ADV), vertical processes (VER; the combination of entrainment and vertical advection), and residual term (Res). T is the average MLT, ρ is the density of seawater, Cp is the specific heat capacity of seawater, and h is the mixed layer depth (MLD). The net surface heat flux Qnet is the sum of the latent heat flux, sensible heat flux, and longwave and shortwave radiation, and Qpen is the penetrative component of the shortwave radiation through the base of the mixed layer. u and v , representing the mixed layer currents, are obtained by interpolating the buoy observations at depths of approximately 10 and 100 m. The ocean current in the upper 10 m is simply using the current measured at 10 m from the mooring. Since the MLT well represents the SST as displayed later in the next section, the horizontal temperature gradients, and , are estimated using the upstream difference of OISST around the buoy location by following the methods of Bond and McPhaden (1995) and McPhaden and Foltz (2013). Wh is inferred from the change rate at the depth of the 25°C isotherms below the mixed layer, and Th is the temperature at 5 m below the MLD that is entrained into the mixed layer. H is the Heaviside step function. In the present study, MLD is estimated as the depth where the density is 0.15 kg m−3 denser than the sea-surface density (Girishkumar et al., 2017). The isothermal layer depth (ILD) is defined as the depth at which the temperature is 0.3°C lower than the SST. The barrier layer thickness (BLT) is thus obtained as the difference between ILD and MLD. To compare the governing mechanisms for the SST evolution during the premonsoon period with the buoy observation, the 5-day SODA 3.4.2 output (Carton et al., 2018) is also used to conduct the mixed layer heat budget.
For the atmospheric variables, 850-hPa wind data from the ERA5 reanalysis dataset (Hersbach et al., 2018), with a spatial resolution of 0.25° × 0.25°, are employed to display the 2018/2019 IASM evolution. In addition, daily outgoing longwave radiation (OLR; Lee et al., 2011), precipitation from the Global Precipitation Climatology Project (GPCP; Robert et al., 2017), and NOAA Optimum Interpolation SST (OISST; Reynolds et al., 2008) data are also used to illustrate the MJO patterns.
3. Results
First, we need to examine detailed evolutions of the FEMJO and wind field in December 2018. In early December 2018, as shown in Figures 3A, B, the FEMJO was first initiated in the southwestern Indian Ocean and then strengthened and moved eastward across the central and eastern parts of the Indian Ocean. During this period, the suppressed cloudiness and dry conditions dominated the IASM region. The low-level wind was also weak there. The concurrent low cloudiness and weak wind prior to the arrival of FEMJO induced more shortwave radiation into the ocean and less latent heat loss from the ocean, thus leading to the pronounced warming of the SST north of Australia. This clearly shows that the meridionally averaged SST north of Australia reached its annual maximum in early December, just before the monsoon onset (Figure 2A), which is consistent with the composite results of Duan et al. (2019). At this time of the year, this high SST over the IASM region usually preconditions the monsoon onset by providing the atmospheric convective instability that favors the convection system to pass through the maritime continent (Duan et al., 2019). The FEMJO for 2018/2019, however, weakened markedly as it started to cross the maritime continent on 16–20 December (Figure 3D). Meanwhile, the main route of the FEMJO for 2018/2019 shifted much further northward compared to its climatological position, as shown in Figure 8 by Duan et al. (2019). This then resulted in little rainfall over northern Australia (Feng et al., 2020; see also Figure 3D). So, the rainfall criterion for monsoon onset was not technically met at Darwin, and the monsoonal westerly did not last long enough for monsoon criteria to be met until late January, as analyzed in the weekly Tropical Climate Note archive (www.bom.gov.au/climate/tropical-note/archive.shtml ; see also Figure 2D). When the FEMJO convection was over the region, however, the concurrent westerly winds and heavy rainfall indicated that the IASM was officially established (Figure 3D). Following the IASM onset definition in Duan et al. (2019), the first day when the maximum FEMJO convection arrived at 120°E, the 2018/2019 IASM onset date was 16 December. This FEMJO afterward passed over the MC, and it veered southward and strengthened in the eastern part of the maritime continent during late December with enhanced rainfall and northwesterly winds (Figures 3E, F). It did bring rainfall and westerly wind to Darwin. However, the Bureau of Meteorology did not announce the monsoon onset due to its limited, persistent period of rainfall and westerly wind over Darwin not meeting the criteria (Figure 2D). This divergence of monsoon onset conclusions comes from the specific choice of the regional criteria or the local one. It is evident that confusion is sometimes inevitable.

Figure 3 Evolution of the pentad-averaged precipitation (shaded; mm day−1), wind field (vectors; m s−1), and 30–60-day OLR anomaly (contours; only values lower than −10 W m−2 are plotted) for December 2018.
It is worth mentioning that the FEMJO’s apparent northward shift over the western part of the IASM region and its later on southward veering and intensification over the eastern part of the IASM region happen to coincide with the strong negative/positive SST anomalies (SSTAs) over the western/eastern IASM region (Figure 4A), which could be attributed to the extended positive Indian Ocean dipole (IOD) event in the tropical Indian Ocean and the El Niño-like conditions in the tropical Pacific Ocean (Saji et al., 1999; Shinoda et al., 2004; Meyers et al., 2007; Zhang et al., 2017; see also Figures 4B, C). It is then necessary to explore the relationship between the SSTA and MJO routes, which will help compromise the conflicting conclusions on IASM onset. Existing studies suggest that the high SST warming between Indonesia and Australia helps shape the atmospheric convection instability conditions that favor MJO’s eastward propagation and southward veering as it crosses the maritime continent (Kawamura et al., 2002; Zhang, 2005; Hsu and Li, 2012; Wang et al., 2017; Wang et al., 2018; Duan et al., 2019; Wang and Li, 2020a; Wang and Li, 2020b; Zhou and Murtugudde, 2020). A natural question is what kind of air–sea interaction processes are responsible for this strong negative SSTA prior to the 2018/2019 IASM onset. To address this question, the mixed layer heat budget is conducted with the buoy observations, which are coincidently located in the center of the negative SSTA region (see Figure 4A).

Figure 4 (A) Distribution of the tropical SST (shaded; °C) and wind (vectors; m s−1) anomalies in December 2018. The magenta diamond denotes the position of the moored buoy. Time series of 3-month running mean (B) DMI (bars; °C) and (C) NINO3.4 SST anomalies (bars; °C) from May 2018 to May 2019. The dotted lines indicate the threshold of ±0.4°C (B) and 0.5°C (C) for the warm and cold periods, respectively.
The detailed evolution of the 2018/2019 IASM has been well recorded by buoy observations. The active phases of the MJOs (see black horizontal bars in Figure 5B) are defined using the meridionally averaged OLR anomalies at the buoy longitude as described in Feng et al. (2020). Because of the far north path of the FEMJO (also denoted as MJO1 in Figure 5B), its associated shortwave radiation, SLP, and rainfall were not as significant as those of the later second MJO (MJO2) event (Figures 5B–D). However, a remarkable increase in the relative humidity in early December was well observed (Figure 5A), which is quite consistent with the composite results of Duan et al. (2019). The relative humidity is a good indicator of the dry–wet transition in the IAM region. Based on the buoy-observed humidity, we can easily distinguish the different stages of the 2018/2019 IASM. The near-surface relative humidity was low (below 70%) during the premonsoon period and was significantly high (over 80%) during the summer monsoon. The high humidity was interrupted during 16–20 December, which was influenced by the very northern-shifted FEMJO position and the hence transient dry-cold southwesterly winds from northwestern Australia (Feng et al., 2020; see also Figures 3C, D). The wet state was quickly restored in late December.

Figure 5 Daily time series of the buoy-measured (A) relative humidity (%); (B) sea-level pressure (black line; mb) and rainfall (red line, mm day−1); (C) wind speed (black line, m s−1) and wind direction (red line); (D) shortwave radiation (thin black line; W m−2), longwave radiation (magenta line; W m−2), latent heat flux (blue line; W m−2), sensible heat flux (green line; W m−2), and net air–sea heat flux (thick black line; W m−2); (E) air temperature (blue line; °C), SST (black line; °C), and MLT (red line; °C); (F) upper ocean temperature (°C); (G) salinity (psu); and (H) the 5-day running averaged MLT budget components (°C day−1) from November 2018 to February 2019. Dry and wet stages of the 2018/2019 IASM are shaded and labeled based on the humidity evolution in (A), with the thick magenta bar indicating the IASM onset date in the present study. Black horizontal bars in (B) denote the active periods of the MJO events as in Figure 2A. Positive heat flux in (B) represents a gain to the ocean. The green and black lines in (F, G) represent the MLD and ILD, respectively.
In contrast to MJO1, the buoy-observed variables associated with MJO2 exhibit more pronounced fluctuations (Figure 5). During the active phases of the MJOs, low sea-level pressures, enhanced rainfall, high wind speeds, and reduced air–sea net heat fluxes typically occurred at the buoy site. The corresponding air temperature and SST both experienced a sharp drop of 2°C–3°C in a few days. The observed upper ocean temperature from the moored buoy also exhibits considerable intraseasonal fluctuations, which are especially noticeable in the upper 40 m, with persistent warming during the suppressed phases of the MJOs and abrupt cooling as the active MJOs pass the buoy site (Figure 5F).
From the MLT budget as displayed in Figure 5H, we observe a sustained warming tendency (0.066°C day−1) prior to the IASM onset until the convectively active MJO1 induced a remarkable cooling. During the MLT warming period, the NSHF heating (0.046°C day−1) of the mixed layer is always positive. The VER (−0.032°C day−1), on the other hand, always cools the MLT. Though the NSHF plays an important role, it cannot completely explain the observed evolution of MLT warming tendency. It is worth pointing out that there are substantial ADV (0.023°C day−1) and Res (0.029°C day−1) terms in the MLT budget. Note that there were no direct current observations in the upper 10 m from the buoy, which would considerably underestimate the ADV and overestimate the Res in our analysis. In addition, the formation of a mean 10-m BLT limited the turbulent vertical transfer between the mixed layer and the thermocline (McPhaden and Foltz, 2013; see also Figures 5F, G). In contrast, the result based on the SODA climatological data shows that the MLT warming tendency in November–December is almost entirely determined by the NSHF, with VER and ADV having only a minor effect (see Figure 6).
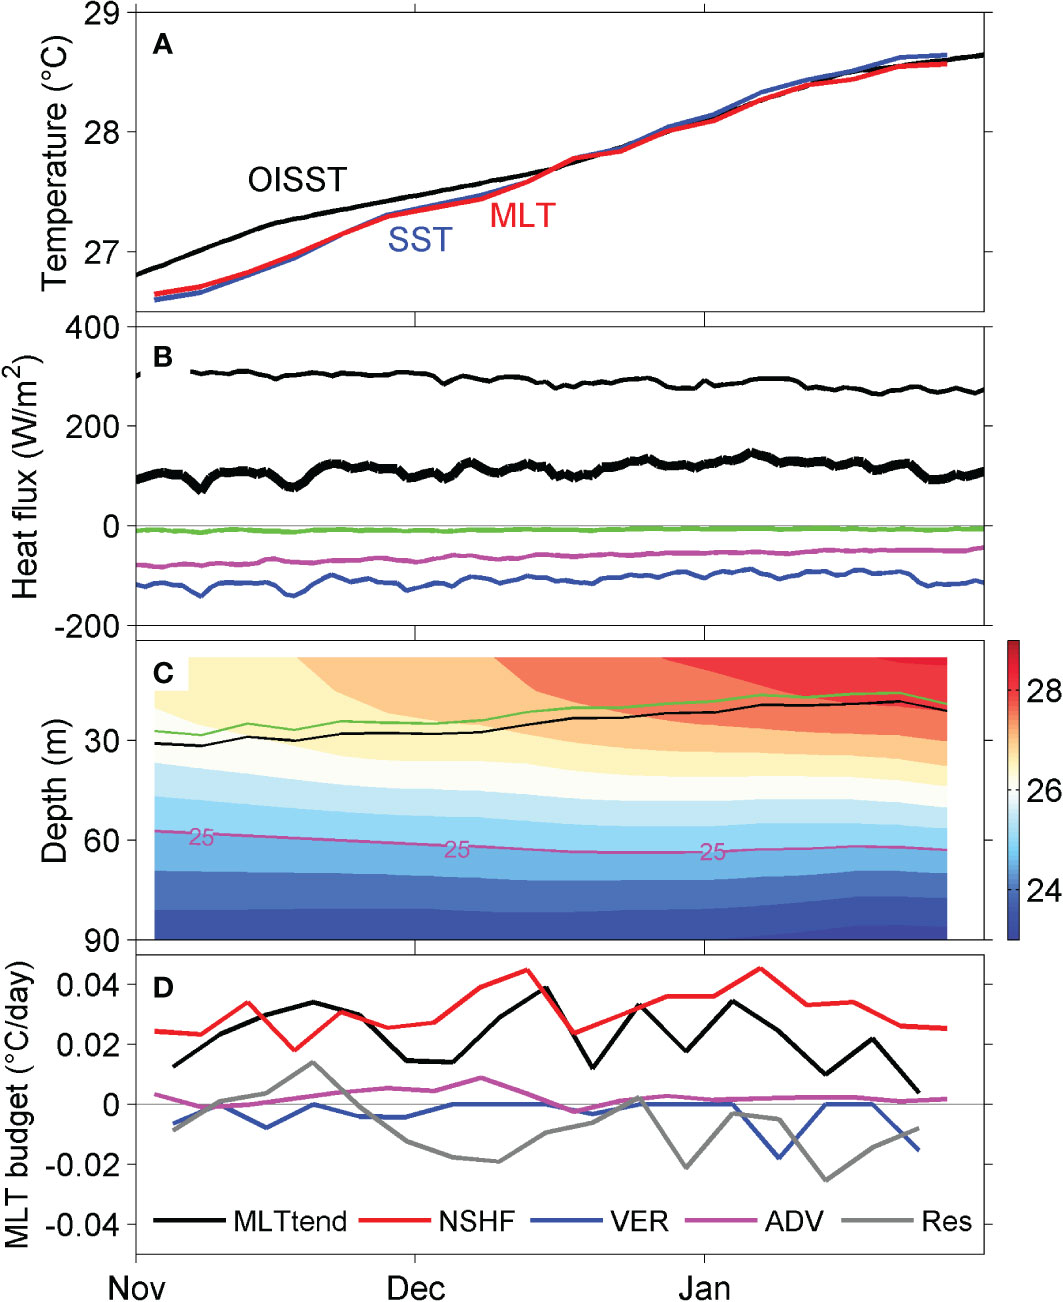
Figure 6 Time series of the (A) daily OISST (black line; °C), pentad-averaged SST (blue line; °C), and MLT (red line; °C) from SODA climatology; (B) daily shortwave radiation (thin black line; W m-2), longwave radiation (magenta line; W m−2), latent heat flux (blue line; W m−2), sensitive heat flux (green line; W m−2), and net air–sea heat flux (thick black line; W m−2) from TropFlux; (C) upper ocean temperature (°C) and (D) MLT budget components (°C day−1) from November to January. Positive heat flux in (B) represents a gain to the ocean. The green and black lines in (C) represent the MLD and ILD, respectively.
In general, the comparison between the MLT heat budget for 2018 and climatology indicates that the reduced NHSF is the primary reason for the negative SSTA off northwest Australia. This is consistent with the previous studies, which noted that the MLT variation off northwest Australia is dominated by the air–sea heat flux (Qu et al., 1994; Du et al., 2005), especially latent heat flux (Kawamura et al., 2002; Santoso et al., 2010). Considering the four heat flux components separately, as shown in Figure 5D, since the values of the daily shortwave radiation from pre- to postmonsoon periods are almost the same (~310 W m−2), more shortwave radiation is absorbed by the ocean mixed layer because of the existence of a deeper MLD before the monsoon onset. Additionally, both the variations of longwave radiation and sensible heat flux are near zero and can be neglected. Therefore, the large variations in the NHSF are primarily due to the enhanced latent heat loss of approximately 75 W m−2 from the ocean to the atmosphere in response to the stronger wind speed (5.7 m s−1) and larger air–sea temperature difference (1.60°C), as displayed in Figures 5C, E.
4. Summary and conclusions
In this study, we examined the onset process of the 2018/2019 IASM associated with the air–sea interactions using upper oceanographic and surface meteorological observations from the Bailong buoy off northwest Australia, in conjunction with ERA5 reanalysis and various satellite data. The extensive observations provide an excellent opportunity to study the onset process of the IASM and to quantify the MLT budget and air–sea interactions associated with the MJOs. The results show that the IASM onset in mid-December 2018 appears to be triggered by the FEMJO originating from the tropical Indian Ocean. However, in response to the sustained El Niño-like conditions in the Pacific Ocean and weak positive IOD event in the Indian Ocean, a strong negative SSTA presents off northwest Australia, which acts to modulate the FEMJO characteristics by reducing its activity over Australian longitudes and shifting the convective center further northward. Two subsequent MJO pulses contribute to enhanced monsoon westerlies and rainfall over the monsoon region and thus result in strong intraseasonal IASM variability.
The mixed layer heat budget analysis based on buoy observations is conducted to evaluate the air–sea interaction processes responsible for the strong negative SSTA off northwest Australia. The MLT displays a relatively weak warming tendency prior to the monsoon onset. Also, this is primarily attributed to the positive surface heat flux into the ocean. However, the variability of net surface heat flux is largely controlled by the modulation of latent heat flux. Our analysis reveals that the large air–sea temperature difference and strong winds before the arrival of the FEMJO convection both contribute to the enhanced latent heat loss and then result in the pronounced negative SSTA off northwest Australia.
In summary, the present study demonstrates the critical value of unique observations of simultaneous air–sea exchanges and upper-ocean variability in the Indonesian–Australian Basin for the first time to study the IASM onset process during the 2018/2019 austral summer. More importantly, the present results provide a reasonable explanation for the divergence on the 2018/2019 IASM onset and emphasize the importance of the air–sea interactions associated with the MJO. In addition, the collected high-frequency data will be used to explore the diurnal cycle of the air–sea exchanges and its role in modulating the MJO and to evaluate the quality of the reanalysis products in reproducing the MJO process.
Data availability statement
The original contributions presented in the study are included in the article/supplementary material. Further inquiries can be directed to the corresponding authors.
Author contributions
YD and HL performed the data analysis and wrote the draft of the manuscript. WY designed the study. MF, XS, KL, LL, BL, GY, and WY contributed to the interpretation of results, discussion of the associated dynamics, and improvement of this paper. All authors contributed to the article and approved the submitted version.
Funding
This research was jointly supported by the Marine S&T Fund of Shandong Province for Qingdao National Laboratory for Marine Science and Technology (LSKJ202201703), the Basic Scientific Fund for National Public Research Institutes of China (2019Q03), Taishan Scholar Programs of Shandong Province (tsqn201909165, ts20190963), and the National Natural Science Foundation of China (41876028).
Conflict of interest
The authors declare that the research was conducted in the absence of any commercial or financial relationships that could be construed as a potential conflict of interest.
Publisher’s note
All claims expressed in this article are solely those of the authors and do not necessarily represent those of their affiliated organizations, or those of the publisher, the editors and the reviewers. Any product that may be evaluated in this article, or claim that may be made by its manufacturer, is not guaranteed or endorsed by the publisher.
References
Berry G. J., Reeder M. J. (2016). The dynamics of Australian monsoon bursts. J. Atmospheric Sci. 73, 55–69. doi: 10.1175/JAS-D-15-0071.1
Bond N. A., McPhaden M. J. (1995). An indirect estimate of the diurnal cycle in upper ocean turbulent heat fluxes at the equator, 140°W. J. Geophysical Res. Oceans 100, 18369–18378. doi: 10.1029/95JC01592
Carton J. A., Chepurin G. A., Chen L. (2018). SODA3: A new ocean climate reanalysis. J. Climate 31, 6967–6983. doi: 10.1175/JCLI-D-18-0149.1
Chang C. P., Harr P. A., McBride J., Hsu H.-H. (2004). Maritime continent monsoon: Annual cycle and boreal winter variability. East Asian monsoon. World Sci., 107–152. doi: 10.1142/9789812701411_0003
Drosdowsky W. (1996). Variability of the Australian summer monsoon at Darwin: 1957–1992. J. Climate 9, 85–96. doi: 10.1175/1520-0442(1996)009,0085:VOTASM.2.0.CO;2
Duan Y., Liu H., Yu W., Liu L., Yang G., Liu B. (2019). The onset of the Indonesian-Australian summer monsoon triggered by the first-branch eastward-propagating madden–Julian oscillation. J. Climate 32, 5453–5470. doi: 10.1175/JCLI-D-18-0513.1
Du Y., Qu T., Meyers G., Masumoto Y., Sasaki H. (2005). Seasonal heat budget in the mixed layer of the southeastern tropical Indian ocean in a high-resolution ocean general circulation model. J. Geophysical Res. 110, C04012. doi: 10.1029/2004JC002845
Fairall C. W., Bradley E. F., Hare J. E., Grachev A. A., Edson J. B. (2003). Bulk parameterization of air-Sea fluxes: Updates and verification for the COARE algorithm. J. Climate 16, 571–591. doi: 10.1175/1520-0442(2003)016<0571:BPOASF>2.0.CO;2
Feng M., Duan Y., Wijffels S., Hsu J., Li C., Wang H., et al. (2020). Tracking air-sea exchange and upper ocean variability in the Indonesian-Australian basin during the onset of the 2018/19 Australian summer monsoon. Bull. Am. Meteorological Soc. 101, E1397–E1412. doi: 10.1175/BAMS-D-19-0278.1
Girishkumar M. S., Joseph J., Thangaprakash V. P., Pottapinjara V., McPhaden M. J.. (2017). Mixed layer temperature budget for the northward propagating Summer Monsoon Intraseasonal Oscillation (MISO) in the Central Bay of Bengal. J. Geophysical Res 122, 8841–8854. doi: 10.1002/2017JC013073
Holland G. J.. (1986). Interannual variability of the Australian summer monsoon at Darwin: 1952 -82. Mon. Wea. Rev. 114, 594–604. doi: 10.1175/1520-0493(1986)114,0594:IVOTAS.2.0.CO;2
Hendon H. H., Liebmann B. (1990a). A composite study of onset of the Australian summer monsoon. J. Atmospheric Sci. 47, 2227–2240. doi: 10.1175/1520-0469(1990)047,2227:ACSOOO.2.0.CO;2
Hendon H. H., Liebmann B. (1990b). The intraseasonal (30-50 day) oscillation of the Australian summer monsoon. J. Atmospheric Sci. 47, 2909–2924. doi: 10.1175/1520-0469(1990)047,2909:TIDOOT.2.0.CO;2
Hersbach H., Bell B., Berrisford P., Biavati G., Horányi A., Muñoz Sabater J., et al. (2018). ERA5 hourly data on pressure levels from 1979 to present. Copernicus Climate Change Service Climate Data Store. doi: 10.24381/cds.bd0915c6
Hsu P. C., Li T. (2012). Role of the boundary layer moisture asymmetry in causing the eastward propagation of the madden-Julian oscillation. J. Climate 25, 4914–4931. doi: 10.1175/JCLI-D-11-00310.1
Hung C. W., Yanai M. (2004). Factors contributing to the onset of the Australian summer monsoon. Q. J. R. Meteorological Soc. 130, 739–758. doi: 10.1256/qj.02.191
Kajikawa Y., Wang B., Jing Y. (2010). A multi-time scale Australian monsoon index. Int. J. Climatology 30, 1114–1120. doi: 10.1002/joc.1955
Kawamura R., Fukuta Y., Ueda H., Matsuura T., Iizuka S. (2002). A mechanism of the onset of the Australian summer monsoon. J. Geophysical Res. 107, 4204. doi: 10.1029/2001jd001070
Kim K.-Y., Kullgren K., Lim G.-H., Boo K.-O., Kim B.-M. (2006). Physical mechanisms of the Australian summer monsoon: 2. variability of strength and onset and termination times. J. Geophysical Res. 111, D20105. doi: 10.1029/2005JD006808
Kullgren K., Kim K.-Y. (2006). Physical mechanisms of the Australian summer monsoon: 1. seasonal cycle. J. Geophysical Res. 111, D20104. doi: 10.1029/2005JD006807
Lee H., NOAA Climate Data Record Program (2011). NOAA Climate data record of daily outgoing longwave radiation, version 1.2 L. NOAA National Climatic Data Center. doi: 10.7289/V5SJ1HH2
Lisonbee J., Ribbe J., Wheeler M. (2020). Defining the north Australian monsoon onset: A systematic review. Prog. Phys. Geography: Earth Environ. 244 (3), 398–418. doi: 10.1177/0309133319881107
McPhaden M. J., Foltz G. R. (2013). Intraseasonal variations in the surface layer heat balance of the central equatorial Indian ocean: The importance of zonal advection and vertical mixing. Geophysical Res. Lett. 40. doi: 10.1002/grl.50536
Meyers G., Mcintosh P., Pigot L., Pook M. (2007). The years of El niño, la niña, and interactions with the tropical Indian ocean. J. Climate 20, 2872–2880. doi: 10.1175/JCLI4152.1
Qu T., Meyers G., Godfrey J. S., Hu D. X. (1994). Ocean dynamics in the region between Australia and Indonesia and its influence on the variation of sea surface temperature in a global general circulation model. J. Geophysical Res. 99, ,433–18,445. doi: 10.1029/94JC00858
Reynolds R. W., Banzon V. F., NOAA Climate Data Record Program (2008). NOAA Optimum interpolation 1/4 degree daily Sea surface temperature (OISST) analysis, version 2". NOAA Natl. Centers Environ. Inf. doi: 10.7289/V5SQ8XB5
Robert A., Wang J., Mathew S., George H., David B., Eric N., et al. (2017). Global precipitation climatology project (GPCP) climate data record, version 1.3. NOAA Natl. Centers Environ. Inf. doi: 10.7289/V5RX998Z
Saji N. H., Goswami B. N., Vinayachandran P. N., Yamagata T. (1999). A dipole mode in the tropical Indian ocean. Nature 401, 360–363. doi: 10.1038/43854
Santoso A., Gupta A. S., England M. H. (2010). Genesis of Indian ocean mixed layer temperature anomalies: A heat budget analysis. J. Climate 23, 5375–5403doi: 10.1175/2010JCLI3072.1
Shinoda T., Alexander M. A., Hendon H. H. (2004). Remote response of the Indian ocean to interannual SST variations in the tropical pacific. J. Climate 17, 362–372. doi: 10.1175/1520-0442(2004)017<0362:RROTIO>2.0.CO;2
Song X., Ning C., Duan Y., Wang H., Li C., Yang Y., et al. (2021). Observed extreme air-sea heat flux variations during three tropical cyclones in the tropical southeast Indian ocean. Journal of climate 34, 3683–3705. doi: 10.1175/JCLI-D-20-0170.1
Suppiah R. (1993). ENSO phenomenon and 30–50 day variability in the Australian summer monsoon rainfall. Int. J. Climatology 13 (8), 837–851. doi: 10.1002/joc.3370130803
Wang G., Cai W. (2020). Two-year consecutive concurrences of positive Indian ocean dipole and central pacific El niño preconditioned the 2019/2020 Australian “black summer” bushfires. Geosci. Lett. 7. doi: 10.1186/s40562-020-00168-2
Wang L., Li T. (2020a). Reexamining the MJO moisture mode theories with normalized phase evolutions. J. Climate 33, 8523–8536. doi: 10.1175/JCLI-D-20-0202.1
Wang L., Li T. (2020b). Effect of vertical moist static energy advection on MJO eastward propagation: Sensitivity to analysis domain. Climate Dynamics 54, 2029–2039. doi: 10.1007/s00382-019-05101-8
Wang L., Li T., Maloney E., Wang B. (2017). Fundamental causes of propagating and non-propagating MJOs in MJOTF/GASS models. J. Climate 30 (10), 3743–3769. doi: 10.1175/JCLI-D-16-0765.1
Wang L., Li T., Nasuno T. (2018). Impact of rossby and kelvin wave components on MJO Eastward propagation. J. Climate 31 (17), 6913–6931. doi: 10.1175/JCLI-D-17-0749.1
Wheeler M. C., McBride J. L. (2005). Australian-Indonesian Monsoon. intraseasonal variability in the atmosphere–ocean climate system. Eds. Lau W. K. M., Waliser D. E. (Springer), 125–173. doi: 10.1007/3-540-27250-X_5
Yoneyama K., Zhang C. (2020). Years of the maritime continent. Geophysical Res. Lett. 47, e2020GL087182. doi: 10.1029/2020GL087182
Zhang N., Feng M., Hendon H., Hobday A., Zinke J. (2017). Opposite polarities of ENSO drive distinct patterns of coral bleaching potentials in the southeast Indian ocean. Sci. Rep. 7, 2443. doi: 10.1038/s41598-017-02688-y
Keywords: summer monsoon onset, air-sea interaction, Madden-Julian oscillation, heat budget, buoy observation
Citation: Duan Y, Liu H, Feng M, Song X, Li K, Liu L, Liu B, Yang G and Yu W (2023) The onset process of the 2018/2019 Indonesian–Australian summer monsoon: The importance of the air–sea interaction. Front. Mar. Sci. 9:1089493. doi: 10.3389/fmars.2022.1089493
Received: 04 November 2022; Accepted: 13 December 2022;
Published: 09 January 2023.
Edited by:
Raden Dwi Susanto, University of Maryland, College Park, United StatesReviewed by:
Lin Chen, Nanjing University of Information Science and Technology, ChinaLei Zhou, Shanghai Jiao Tong University, China
Copyright © 2023 Duan, Liu, Feng, Song, Li, Liu, Liu, Yang and Yu. This is an open-access article distributed under the terms of the Creative Commons Attribution License (CC BY). The use, distribution or reproduction in other forums is permitted, provided the original author(s) and the copyright owner(s) are credited and that the original publication in this journal is cited, in accordance with accepted academic practice. No use, distribution or reproduction is permitted which does not comply with these terms.
*Correspondence: Yongliang Duan, ylduan@fio.org.cn; Weidong Yu, yuwd@mail.sysu.edu.cn