Reproductive cycle of the female Anisotremus scapularis (Tschudi, 1846) on the marine coast of Callao, basic knowledge to go towards its aquaculture
 Lili J. Carrera Santos1,2
  Jéssica G. Fontes3
  Gustavo R. Cardoso Dos Santos4 Mônica Costa Padilha3
  Rafael Opazo5*
- 1Programa Doctorado en Acuicultura, Facultad de Ciencias del Mar, Universidad Católica del Norte, Coquimbo, Chile
- 2Laboratorio de Cultivo de Peces, Instituto del Mar del Perú(IMARPE), Lima, Perú
- 3Laboratório de Pesquisaem Agentes Anabólicos -Laboratório de Apoio ao Desenvolvimento Tecnológico (LAPAA-LADETEC), Rio de Janeiro, Brazil
- 4Laboratório de Pesquisa, Desenvolvimento e Inovação (LPDI-LADETEC), Instituto de Química Universidade Federal do Rio de Janeiro (UFRJ), Rio de Janeiro, Brazil
- 5Laboratorio de Biotecnología Instituto de Nutrición y Tecnología de los Alimentos (INTA), Universidad de Chile, Santiago, Chile
Anisotremus scapularis is an important commercial species in Perú, being a prioritized species for the development of its aquaculture. The aim of the study was to establish the A. scapularis female reproductive cycle and reproductive strategy on the marine coast of Callao, through a seasonal sampling of wild specimens. The specimen collection was carried out between January 2019 to December 2020. Eighty-one female specimens were collected, and biometric indices were calculated such as condition factor (K) or gonadosomatic index (GSI), among others. The phases of the reproductive cycle were established by ovary histology in association with a steroid profile analysis performed by GC-EI-MS/MS. The reproductive strategy of A. scapularis was classified as asynchronous spawning with indeterminate fecundity. The average size at first maturity calculated as L100 was 25.3 cm. The GSI distribution was significantly higher in the specimens collected in summer than in the specimens collected in other seasons. The plasma concentration of 17β-estradiol, androstenedione-4, and testosterone per reproductive cycle phase was statistically significant. The distribution of 17β-estradiol plasma concentration in the specimens classified as spawning capable was higher than the specimens classified in other reproductive phases. The spawning capable phase was significantly and positively associated with the summer and autumn seasons. Thus, was possible to propose that the spawning season begins in late spring and until the middle of autumn in the Callao coast area. The recorded superficial temperature and daylight hours per day performed in the specimen’s collection area, allowed us to propose a thermo-photoperiod program for the management of broodstock. This should include the first cycle with temperatures between 12.5 - 13.5°C with an 11/13 light/darkness photoperiod, then the temperature should be increased to 16 - 17°C, with a 13/11 light/darkness photoperiod as a second cycle. Although the results of this study are limited to a specific area of the Callao coast, establishing the reproductive cycle and the spawning dynamics of A. scapularis females associated with environmental parameters, provides basic knowledge to improve the aquaculture of this species.
1. Introduction
Currently, the global fish demand for a large group of fish species is partially or only covered by extractive fishing. Hence, implementing aquaculture with new fish species has an essential role in protecting fish biodiversity (Boyd et al., 2020). However, commercial aquaculture endeavors for new species have failed repeatedly in the last decades (Boyd et al., 2020). One of the factors that could be associated with this issue is the lack of awareness about the importance of establishing the different aspects of the reproductive biology of the target species, such as the reproductive cycle or spawning dynamics, which are terms associated with the reproductive strategy of the fishes. The absence of substantial knowledge of the reproductive biology of a species could imply problems in the consolidation of its domestication, which is a critical step for accomplishing commercial fish farming for new species (Teletchea and Fontaine, 2012; Boyd et al., 2020). In aquaculture, the reproductive management of the reproductive female broodstock is more important due to the importance that the yolk process has, in relation to the egg quality (Reading et al., 2018).
The spawning dynamic in oviparous fishes is associated either with the number of breeding opportunities throughout the species’ lifetime (semelparity or iteroparity) or with the number of spawning events per reproductive season (total spawners, batch spawners) (Murua and Saborido-Rey, 2003; Robert and Carl, 2015b). The number of spawning per season is connected to ovarian development, which could be classified as a synchronous pattern, group synchronous pattern, or asynchronous pattern (Murua and Saborido-Rey, 2003; Robert and Carl, 2015b).
Just like other vertebrates, fish reproduction is primarily regulated by environmental factors such as temperature and photoperiod (Maitra et al., 2006). Seasonal oscillations of these factors impact on hypothalamus-pituitary-gonadal axis and modulate a reproductive hormonal cascade (Zohar et al., 2010). In fish female the hormonal modulation regulated the gametogenesis and final maturation process, in which oocytes develop from the primordial cells’ proliferation until its ovulation and spawning; process that is considered the reproductive cycle (Yousefian and Mousavi, 2011). In fish female the reproductive cycle has been systematized into 5 phases model: immature, developing, spawning capable, regressing, and regenerating (Brown-Peterson et al., 2011). This phases are defined by markers, such as macroscopic ovary morphology, histological markers, and physiological markers (Murua et al., 2003; Brown-Peterson et al., 2011; Lowerre-Barbieri et al., 2011). Mainly the ovary histological markers are associated with the oogenesis. Oogenesis refers to the process where the oogonia develops into a mature oocyte (Selman and Wallace, 1989; Lubzens et al., 2010; Robert and Carl, 2015a).
The reproduction hormonal control is mainly regulated by the gonadotropin-releasing hormone (GnRH), which is a key regulator in the hypothalamus-pituitary-gonadal axis (Lee et al., 2008), which controls the secretion of gonadotropins (GTHs) in the pituitary gland, which controls the synthesis of the steroid hormones into the gonads (Levavi-Sivan et al., 2010; Zohar et al., 2010). The 17β-estradiol is the most important sex steroid in female fish, which controlling the oocyte development stages and the oocyte maturation is controlling by the maturation-inducing steroid (MIS) (Tokarz et al., 2015).
Anisotremus scapularis (Tschudi, 1846) also known as Peruvian grunt or Chita in Perú (Chirichigno Norma, 2001), is a marine species that live on the South-American Pacific coasts distributed from Ecuador (0°57’43.63”S) to Chile (23°39′08″S). The Anisotremus genera belong to the Perciformes Order and Haemulidae family, in which there are 2 subfamilies, 19 genera, and 133 species (Nelson et al., 2016). A. scapulars is a species with high commercial value in Perú (Morales et al., 2021), which also means it is an intensively exploited resource. The extractive pressure of this resource drives the Peruvian government to take conservation measures, aquaculture is one of these.
Currently, there is no scientific documentation regarding the A. scapularis reproductive biology. The objective of this study was to be able to define A. scapularis females reproductive cycle and spawning dynamic, for specimen´s collected from a specific marine area on the coast of Callao, Perú. Since the research strategy focused on a specific marine area, it was possible to incorporate the study of the variation in surface temperature of the water and the hours of light per day associated with the specimens collection area.
2. Material and methods
2.1 Collection of wild fish specimens
The study was carried out with specimens collected during the 2019 and 2020 years, from a specific maritime area located at latitude coordinates 12°07’11’’S, longitude 77°10’36’’W, see Figure 1. This cardinal point is a marine area in the south of “El Frontón” Island, which belongs to the province of Callao, Perú. During the study period, 8 collections of wild individuals were made, 4 for each year of study and 2 for each season of the year. The wild A. scapularis collection was carried out using a net of the “atarraya” type. Once captured, the specimens were kept alive in aerated seawater containers until their processing in the Instituto del Mar del Perú (IMARPE) facilities.
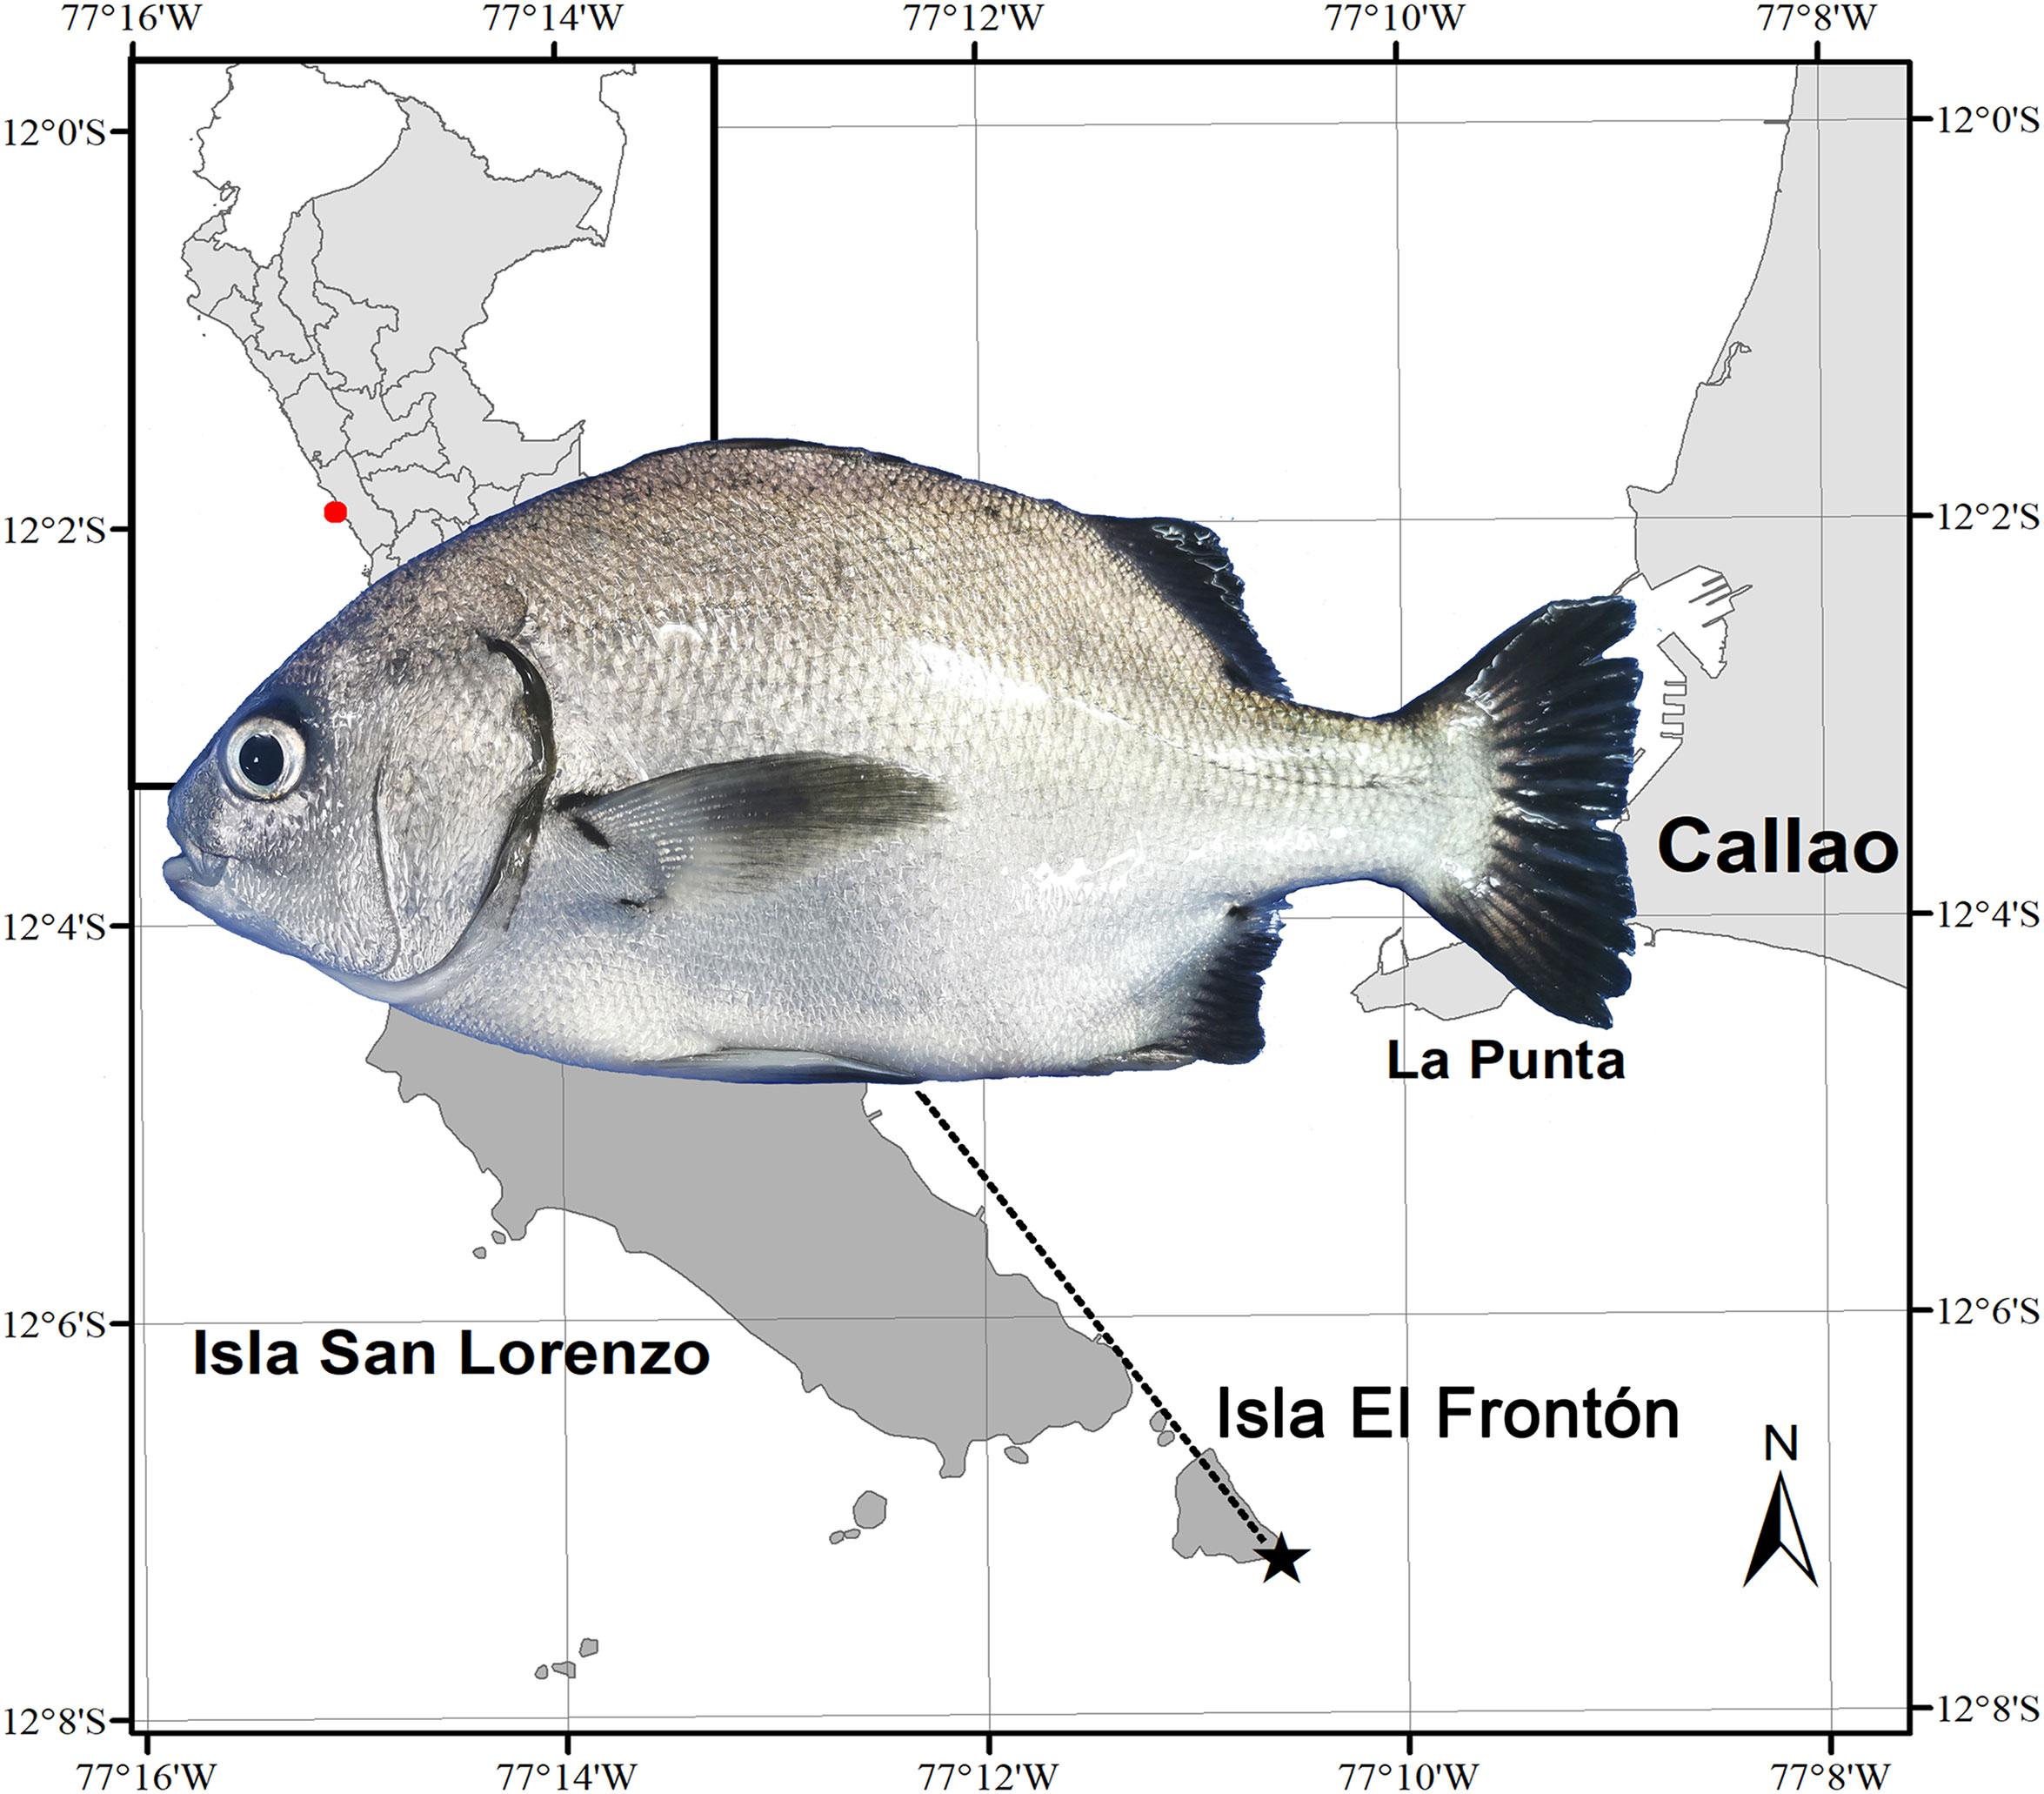
Figure 1 Location of the collection site of wild specimens of A. scapularis, in the south of “El Frontón” Island, province of Callao, Perú.
The collected A. scapularis specimens were sacrificed using tricaine methanesulfonate MS-222™ (C10H15NO5S) (Western Chemical™, USA) (Leary et al., 2020). The fish handling procedures and euthanasia were carried out under the precepts and bioethical aspects associated with the management and care proposed by the Guide for the Care and Use of Laboratory Animals (National Research, 2011). In briefly, tricaine methanesulfonate was incorporated in container with 20 liter of seawater at a concentration of 500 mg L-1 (Carter et al., 2011). Each fish was immersed in this solution until it was possible to observe cues of sedation and unconsciousness, such as: absence of pectoral fin and opercular movement. This handling allows the animals to be sacrificed with a painless procedure and with rapid unconsciousness and under bioethical precepts of animal welfare. Also, the specimens caught were within the legal authorizations imposed by Peruvian law (Ministerial Resolution No. 250-2018 - PRODUCE).
2.2 Data analysis of biometric parameters and indices
The following biometric parameters were determined for each collected specimen: sex, total length, standard length, total weight, gonad weight, liver weight, viscera weight, and gutted fish weight. The sex of each specimen was only defined after the dissection since this species does not present sexual dimorphism. Basic biometric parameters, such as Fulton’s condition factor (K), gonadosomatic index (GSI), viscerosomatic index (VSI), and hepatosomatic index (HSI); were calculated based on the following formulas:
VSI = (Ben Ammar et al., 2020)
To deepen the analysis of biometric indexes, it was created a new ordinal variable called “length categories”; using standard length data recorded. This new variable grouped the specimens into two categories of standard length: The first category included the collected specimens with lengths greater than or equal to 30 cm (≥ 30 cm individuals), and the second category included the collected specimens with lengths smaller than 30 cm (< 30 cm individuals). This variable allows the understanding of variations in the frequency length between the seasons and compares the biometric indexes between specimens of different lengths.
2.3 Size at first maturity estimation (L50 and L100)
The calculation of the size at first maturity (L50 or L100) was developed as follows. Based on histology analysis, the ovary maturity state of each collected female specimen was established. The maturity classification was associated with the total length corresponding to each individual, then a frequency contingency table was created with this data. By this frequency table a binomial logistic regression model was fitted, described by the equation:
(Saborido-Rey and Junquera, 1998)
Where P corresponds to the estimated proportion of mature, a and b to the coefficients of the logistic regression equation, and TL is the total length.
Using the maximum-likelihood method over the logistic regression model the L50 or L100 were estimated. However, the L50 or L100 reported in the study correspond to average distributions performed by bootstrapping process with 2000 iterations of the logistic regression model; jointly reported at the 95% coefficient interval of each distribution (Hoffmann et al., 2017; Sang et al., 2019).
2.4 Macroscopic and histological analysis of the ovaries
The dissection process allowed a macroscopic description of the gonads for each specimen (Murua and Saborido-Rey, 2003; Oliveira et al., 2015). Histology analysis for each A. scapularis specimen tissue ovaries sample was performed. The ovary tissues were fixed using a 10% buffer formalin solution (1.27 mol L-1 – pH 6.92). The buffer formalin solution was prepared in the following way: 100 mL of Formaldehyde 37% (Merck™, Germany), 4 g of monobasic sodium phosphate (Merck™, Germany), 6.5 g of dibasic sodium phosphate (Merck™, Germany), and sufficient quantity of distilled water to complete 1000 mL. After fixation, the samples were dehydrated in increasing alcohol solutions, cleared with xylene (Merck™, Germany), and embedded in paraffin using an automatic tissue processor (Leica™, Germany). Tissue sections (4 µm) were made with a microtome (Leica™, Germany), then stained with hematoxylin and eosin (H&E) (Merck™, Germany) and examined under a microscope (Leica™, Germany). The sample processing was performed according to Humason (1979) and Luna (1968). To classify the phases of the reproductive cycle a Brown-Peterson et al. (2011) model was used. This model included the following phases: Immature, developing, spawning capable, regression, and regenerating.
2.5 Steroidal serum profile
The GC-EI-MS/MS is a is a validated methodology for the determination of steroid profiles in serum, being previously widely described (Toribio-Delgado et al., 2012; Matysik and Schmitz, 2015).
Blood samples were placed in 2 mL microtubes containing 40 µl of heparin (Sang et al., 2019). Subsequently, the blood samples were centrifuged at 3000 g for 15 minutes at 4°C (Guzmán et al., 2008), then the plasma was extracted into another 2 mL microtube and stored at -80°C in an ultra-freezer (Brand Binder™, USA) until its analysis. Eight samples from each reproductive cycle phase for the steroid plasmid profile analysis were randomized selected.
2.5.1 Sample preparation
The plasma sample preparation was based on the enzymatic hydrolysis of the endogenous steroids followed by liquid-liquid extraction in a procedure reported below, which is similar to the one described by Toribio-Delgado et al. (2012). Plasma samples were enzymatic hydrolyzed using β-glucuronidase obtained from E. coli, aiming to release glucuroconjugate steroids to the free form. Therefore, the quantification of steroids considers both the glucuroconjugated fraction and the free fraction. Plasma aliquots of 0.5 mL were spiked with 15 µL of internal standards mix, composed by a deuterated form of each analyte. After pH adjustment with 200 μL of 0.8M phosphate buffer, 100 μL of the β-glucuronidase enzyme were added, and the samples were submitted to incubation at 50°C for 1 hour to promote the enzymatic reaction. After this period, to perform the extraction of the free steroids, the addition of 100 μL of aqueous buffer solution containing K2CO3/KHCO3 20% (w/w) and 1.5 mL of TBME was done. The mixture was stirred for 5 minutes and centrifuged at 3500 rpm for 7 minutes. The organic phase was separated and transferred to another tube, which was submitted to nitrogen flow in a water bath at 40°C until dryness. The samples were still left for 50 minutes in an oven at room temperature to ensure drying. Finally, the residue was derivatized through a silylation reaction performed using 50 μL of MSTFA–NH4I–2-mercaptoethanol (1000:2:6, v/w/v) at 60°C for 20 minutes, and then, samples were taken to injection. For quantification, calibration curves were constructed using a synthetic matrix, to simulate plasma, spiked with the standard analyte solutions in different concentrations, and the same procedure described above was applied. For more information about the synthetic matrix prepared in the laboratory and the concentration range in calibration curves. Aliquots of 2 μL were injected in splitless mode into the triple quadrupole system (GC-QqQ) operated in multiple reaction monitoring mode. The analysis was performed using a GC Trace 1310 (Thermo Scientific™, USA) and interfaced with a mass spectrometer TSQ 8000 (Thermo Scientific™, USA) with a 5%-phenyl-methylpolysiloxane column (30 m x 0.25 mm x 0.10 μm).
2.5.2 GC-EI-MS/MS conditions
The injector temperature was 280°C and the oven temperature program was 140 to 195°C at 40 °C/min, 195 to 235°C at 3 °C min-1, 235 to 310°C at 80°C min-1, and held at 310°C for 3 min. The transfer line was set to 300°C and the ion source was set to 320°C. Electron ionization was performed using electron energy of 70 eV. The collision energies were optimized according to the software Auto SRM.
2.5.3 GC-EI-MS/MS data analysis
The data were evaluated using Thermo Fisher Scientific TraceFinder™ 3.2.512.0 software (Thermo Fisher Scientific™, Waltham, MA, USA).
2.6 Oceanographic parameters data
Records of the sea-surface temperature were obtained from the collection point of the Peruvian Sea Satellite Observation System (https://satelite.imarpe.gob.pe/#/subcategory). The daylight hours per day (photoperiod) data were recorded from the Global Monitoring Laboratory - Earth System Research Laboratories - National Oceanic and Atmospheric Administration (NOAA) https://gml.noaa.gov/grad/solcalc/ calcdetails.html for the Callao area (San Lorenzo Island).
2.7 Statistical analyses
Before the statistical analysis, the normality of the distribution was evaluated for each of the parameters or biometric indices using the Shapiro–Wilk test (Mishra et al., 2019). This analysis showed that not all the distributions of the parameters or indices fit a normal curve. Therefore, the statistical analysis was performed for all with non-parametric tests. For comparison of the two groups, Mann–Whitney U test (W) was used (Hoffman, 2019). For comparisons of more than two groups, the Kruskal–Wallis one-way analysis of variance was used (Hoffman, 2019), and then the post-hoc analysis was performed by the Dunn’s Kruskal-Wallis Multiple Comparisons tests (Z) (Dinno, 2015). All significance tests used a significance level of 0.05 and an adjusted p-value lower than 0.1 for the multiple comparisons analysis (Mangiafico, 2016). All statistical analyses were performed with the statistical program R (R Core Team, 2021). From the obtained data, ordinal variables were created. The seasons variable was performed using the specimen collection months and these were grouped as follows: Autumn (April, May, and June), winter (July, August, and September), spring (October, November, and December), and summer (January, February, and March). Using the standard length, the ordinal variable length categories were created, grouping the length of the specimens into two categories: Specimens with a length ≥ 30 cm and specimens with a length < 30 cm. The associations between ordinal variables were analyzed through contingency tables and the Chi-square test (X2) (Maxwell, 1978). Together, using the residual matrices of the Chi-square association studies, an illustrative figure was made, where the contribution of each ordinal variable category is presented in the Chi-square analysis, and this analysis was performed using the R corrplot package (Wei and Simko, 2017).
3. Results
One hundred thirty-one specimens of Anisotremus scapularis were collected between January 2019 and December 2020 from the previously defined Callao coast marine area, out of which 81 (61.8%) specimens were female and 50 (38.2%) were male. The study analysis only focused on the collected female specimens, and their biometric parameters and indices are present in Table 1.
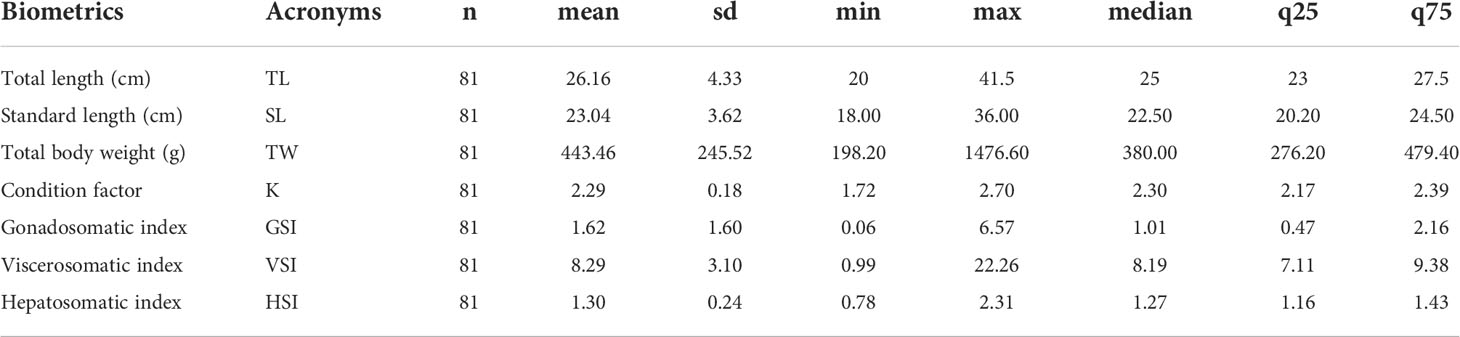
Table 1 Basic statistical analysis of the biometrics and indices parameters from A. scapularis females collected between January 2019 to December 2020 in the study Callao coast marine area.
3.1 Seasonal analysis of biometric parameters and indices
The primary statistical data for the biometric parameters and indices analyzed per season of the A. scapularis females are presented in Table 2. The sample size of the female specimens per season was 21 for summer, 20 for autumn, 21 for winter, and 19 for spring.
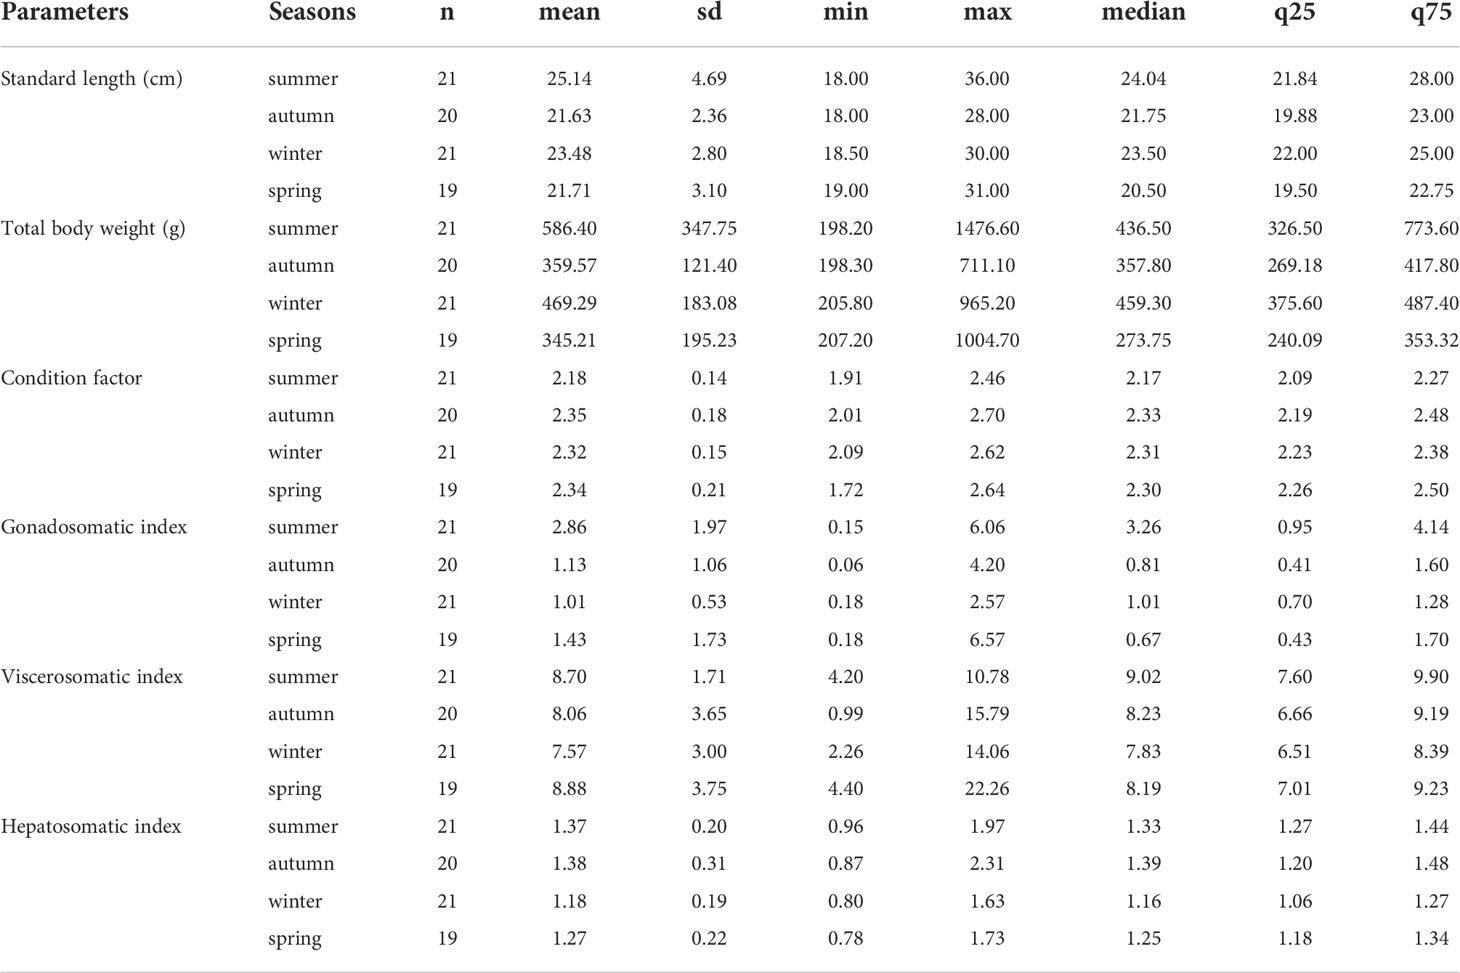
Table 2 Statistics of biometrics parameters and indices per season registered in the A. scapularis females collected on the Callao coast marine area (2019-2020).
The standard length (cm) distribution registered in the specimens collected in summer was significantly greater than the distributions in the specimens collected in autumn (Z=2.75, p=0.006) or spring (Z=2.94, p=0.003); see Figure 2A. Also, the SL distribution in the specimens collected in winter was significantly greater than the distribution in the specimens collected in spring (Z= 2.30, p=0.021). The total weight (g) distribution registered in the specimens captured in summer was significantly greater (Z=3.0, p=0.002) than the distribution in the specimens collected in spring; see Figure 2B.
About the biometrics indices per season, Fulton’s condition factor (K) distribution registered significantly lower in the specimens collected in summer than the distributions in the specimens collected in autumn (Z=-3.0, p=0.002), winter (Z=-2.7, p=0.007), or spring (Z=-3.0, p=0.002); see Figure 2C. Gonadosomatic index (GSI) distribution registered significantly greater in the specimens collected in summer than the distributions in specimens collected in autumn (Z=2.59, p=0.01), winter (Z=2.12, p=0.03), or spring (Z=2.47, p =0.01); see Figure 2D. The summer season presented the greatest average of GSI with 2.86, and the winter season presented the lowest average of GSI with 1.01; the percentage variation of the GSI average between these seasons was 64.69%. No significant differences among seasons were observed for the viscerosomatic index (VSI) by the Kruskal-Wallis test (H=4.0, p=0.25), see Figure 2E. Finally, the distribution of the hepatosomatic index (HSI) registered lower in the specimens collected in winter than the distributions in the specimens collected in summer (Z=-3.17, p=0.002) or autumn (Z=-2.68, p=0.01). The percentage variation in the HSI average between summer and winter was 16%.
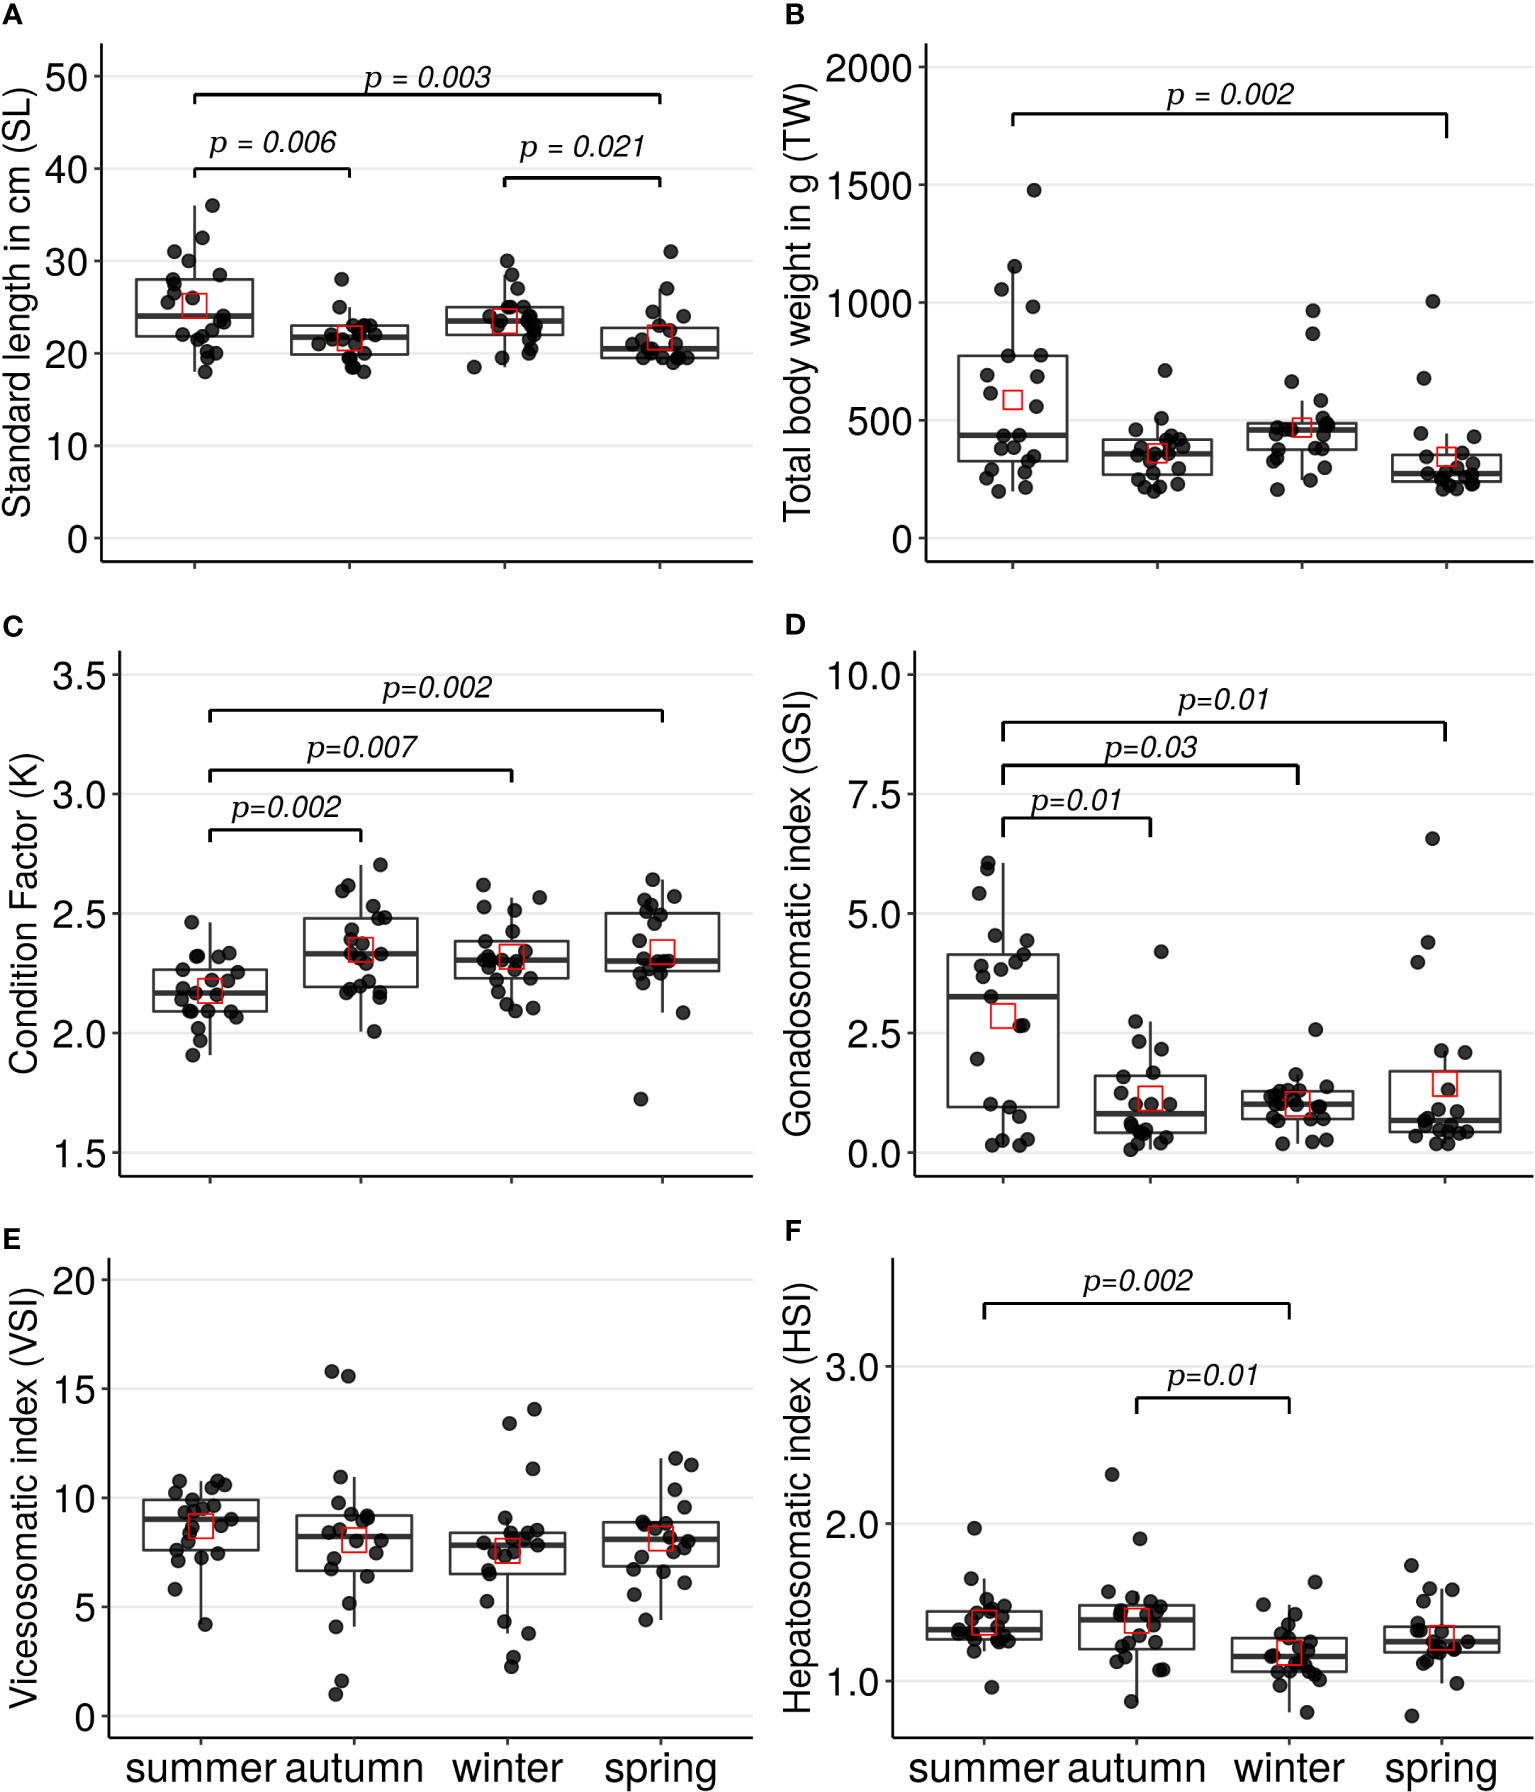
Figure 2 Boxplots and scatterplots of the parameters and indices registered in the A scapularis females per captured season (summer n= 21, autumn n=20, winter n=21, and spring n=19). The specimens were collected on the Callao marine coast. (A) standard length in centimeters, (B) total body weight in grams (C) Fulton’s condition factor, (D) gonadosomatic index, (E) viscerosomatic index and (F) hepatosomatic index. The black points correspond to the value of each specimen captured and the red squares correspond to the mean of each seasonal distribution. The lines show the statistically significant differences among season’s distributions performed by Dunn’s tests; the distribution differences were considered significant with a p-value < 0.05 and a p-adjusted value < 0.1.
Frequency of the ≥ 30 cm standard length category was significantly higher in summer than the other seasons by the Chi-square test (X2 = 16.67, p=0.0008), see Figure 3A. For the summer seasons, the biometrics parameters K and GSI were compared per length categories by the Mann-Whitney-Wilcoxon test. The K did not present statistically significant differences between the length categories (W=70, p=0.72); however, the GSI distribution per length category was significantly different (W=24, p=0.03), see Figures 3B, C, respectively.
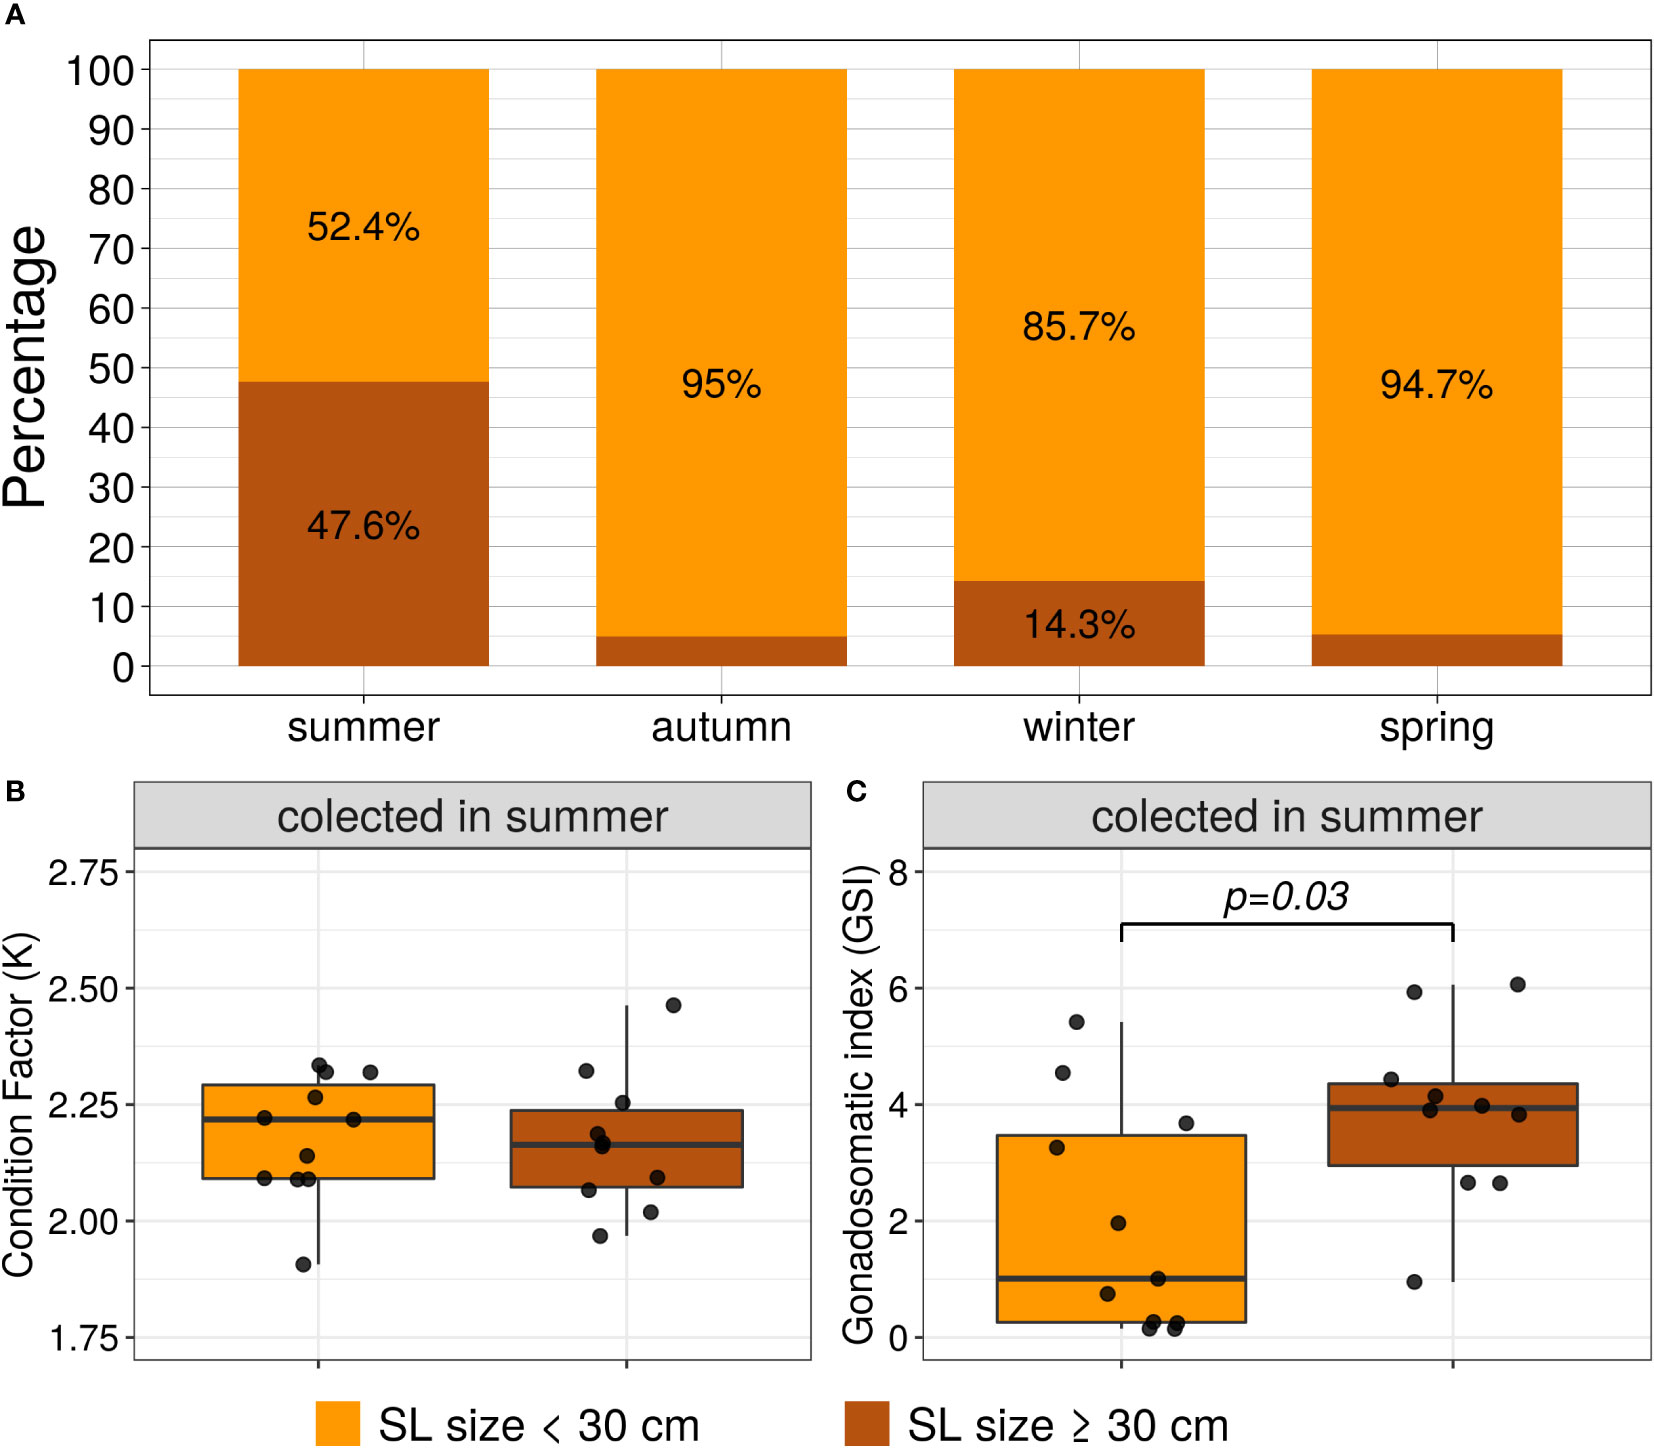
Figure 3 (A) Frequency stacked bar plots of the standard length categories per season (SL size < 30 cm and SL size ≥ 30 cm). (B, C) boxplots and scatterplots of Fulton’s condition factor (K) and GSI per length categories; only for the female specimens collected in summer. The lines show the statistically significant differences between length categories by Mann-Whitney tests; the distribution differences were considered significant with a p-value < 0.05.
3.2 Analysis of ovary macroscopic morphology and histology
The ovaries of A. scapularis showed a fusiform shape, but its color change is associated with the ovary maturation stage. After histology analysis, the captured specimens were classified in the previously defined reproductive cycle phases by the following criteria. The first phase of the reproductive cycle has two possibilities the immature phase or the regenerating phase, depending on whether or not individuals are sexually mature. The immature individuals presented an ovary macroscopic morphology characterized by a small size with a light translucent color and absence of vascularization, see Figure 4A. Histologically the immature ovaries presented a thin ovary wall (OW), and oocytes in primary growth stages, either in the perinucleolar stage (PN) or in the chromatin nucleolus stage (CN), see Figures 4B, C and Supplementary Figure 1A. On the other hand, the macroscopic morphology of the ovary classified as in the regenerating phase is bigger than the immature ovary, with a yellowish color with a subtly visible vascularization, see Figure 4D. Histology cross-section analysis of the regenerating phase ovary presented a thick ovary wall (OW), and oocytes in primary growth stages or in cortical alveolar stage (CA), see Figures 4E, F. The ovarian macroscopic morphology classified as in the immature phase was completely different than the ovary classified as in the regenerating phase, in special associated with its light translucent color and absence of vascularization. From a histology point of view, immature phase classification is defined by ovaries with an absence of oocytes in the cortical alveolar stage (CA), the presence of a thin ovary wall (OW), and an absence of the space between ovary lamellae, all these markers differentiate this phase with regenerating phase. The second phase of the cycle is developing, in which the ovaries’ macroscopic morphology shows a yellow/orange color with clearly defined vascularization, see Figure 4G. The developing phase histology cross-section could be divided into two periods. In the early stage of this phase is characterized mainly by the cortical alveolar stage (AC) oocytes presence, see Figures 4H, I and Supplementary Figure 1B; but in later stages, was possible to observe primary vitellogenic oocytes (Vgt1), see Figure 4J and Supplementary Figure 1C. Jointly, in the developing phase can also observe secondary vitellogenic oocytes (Vgt2). The specimens classified as spawning capable have a macroscopic morphology characterized by high ovaries with an opaque orange color and clearly defined vascularization, see Figure 4K. At the histological cross-section spawning capable ovaries presented cortical alveolar stage oocytes (AC), primary vitellogenic stage (Vgt1) oocytes, secondary vitellogenic stage (Vgt2) oocytes, tertiary vitellogenic stage (Vgt3) oocytes, see Figures 4L, M, and Supplementary Figure 1D. The Vgt3 is characterized by being large with the presence of yolk-lipid droplets throughout the cytoplasm surrounding the nucleus, see Supplementary Figure 3E. In the later stage of this phase was possible to observe the germinal vesicle migration stage (GVM), see Figure 4M and Supplementary Figure 3F. Also, the GVM is the first stage of the maturation process. The oocyte maturation also was associated with the presence of hydrated oocytes stages (HO) and post-ovulatory follicles stages (POF), see Figures 4N. The next phase is the regression phase, which is characterized by atretic oocyte presence in the ovary histology analysis. In the atresia process, the cells associated with the follicle membrane have been degraded.
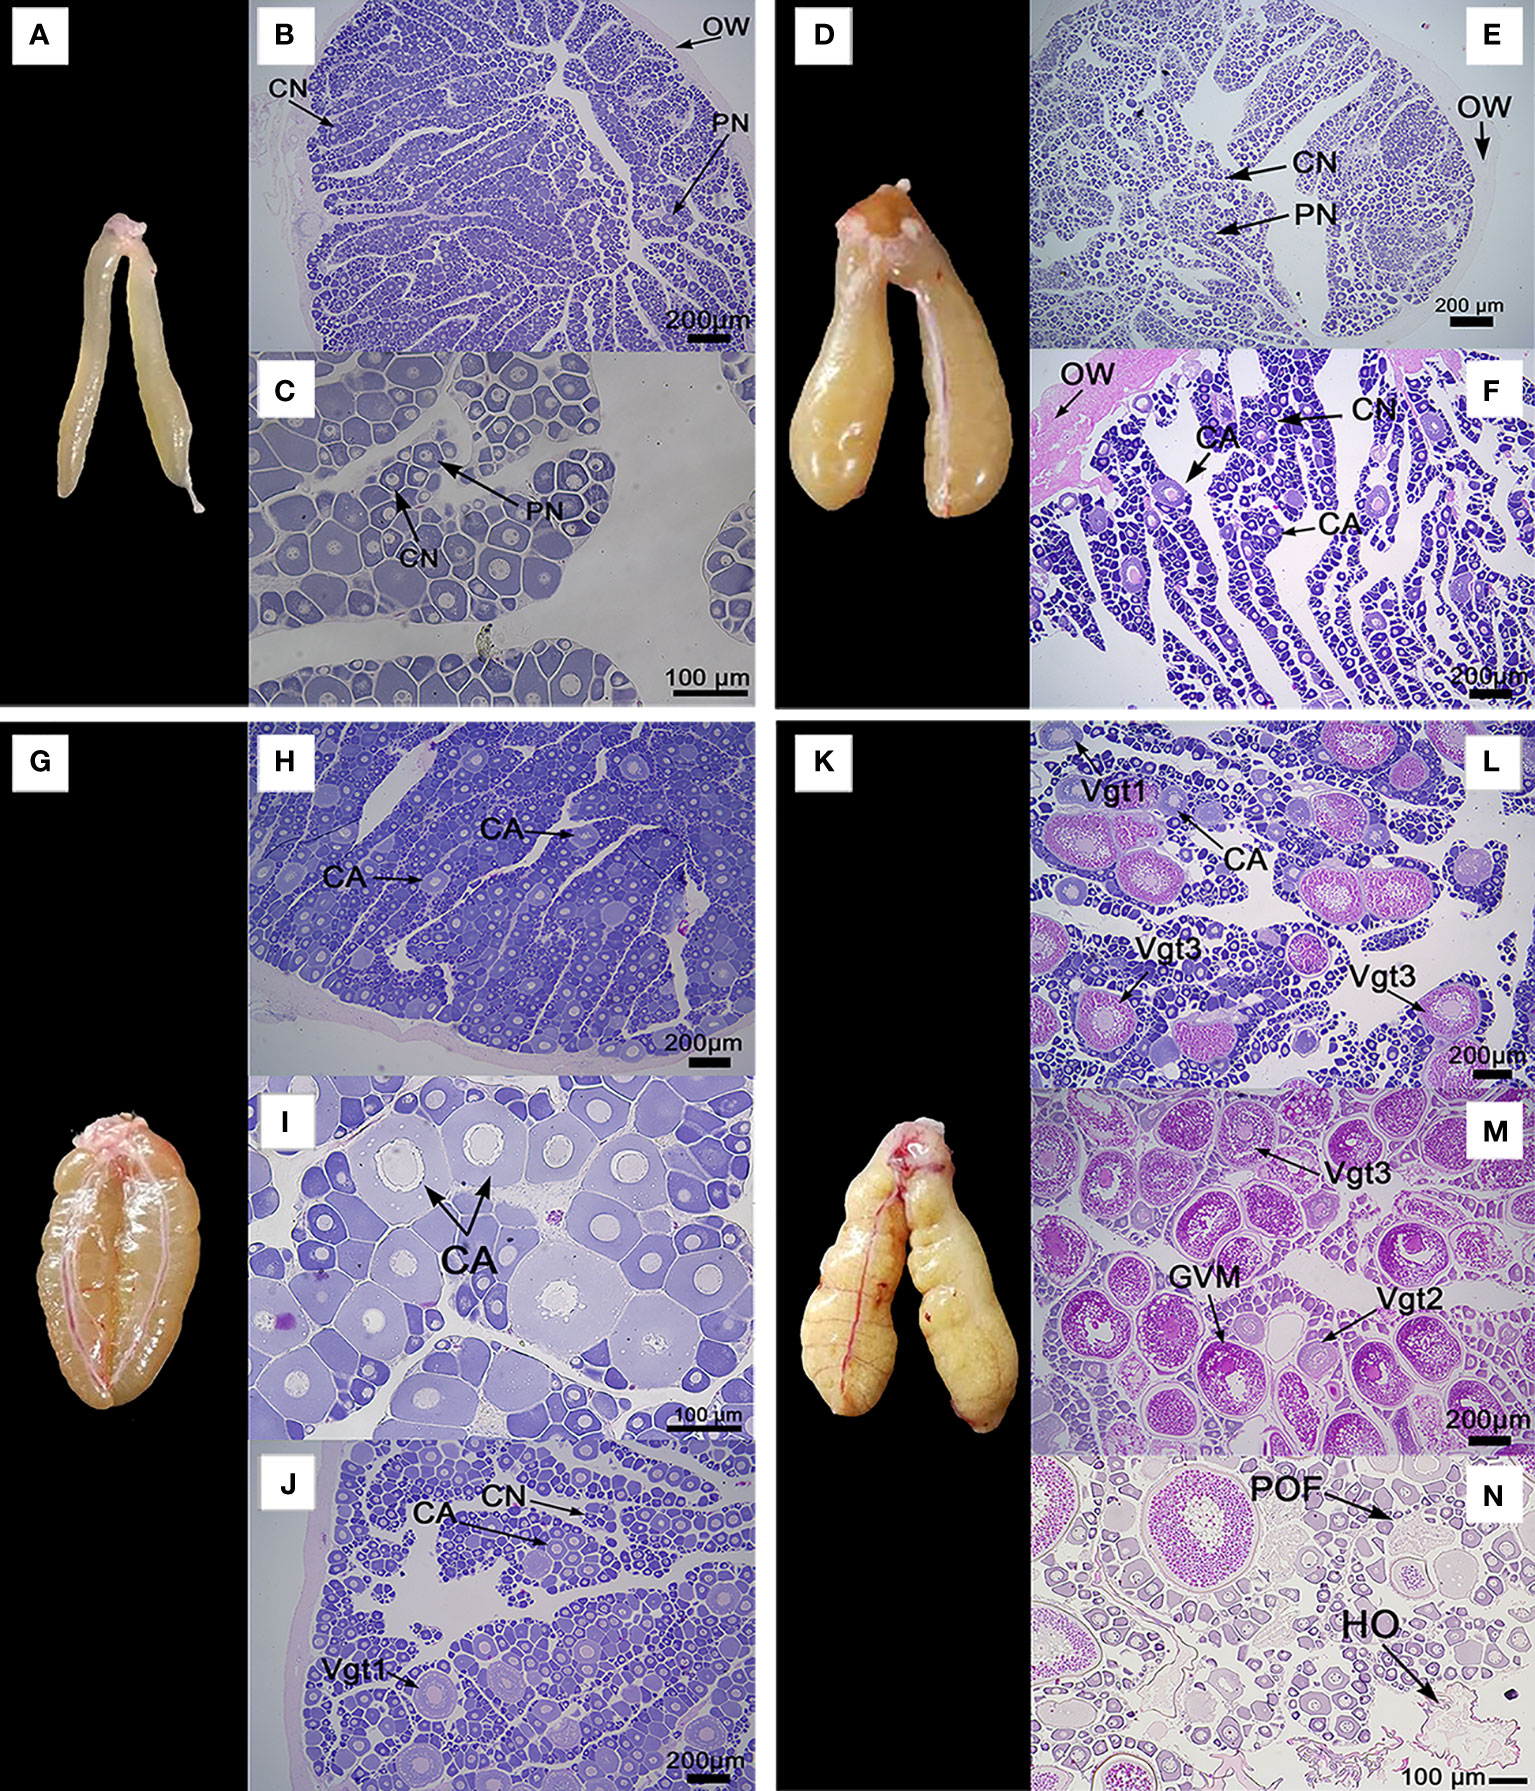
Figure 4 Ovaries macroscopic morphology and their associated histology cross-sections photomicrographs, which illustrate the different phases of the reproductive cycle of A. scapularis. (A) ovary macroscopic morphology in the immature phase, (B, C) ovary histology cross-section classified as an immature phase. (D) ovary macroscopic morphology in regenerating phase, (E, F) ovary histology cross-sections classified as regenerating phase. (G) ovary macroscopic morphology in the developing phase. (H–J) ovary histology cross-sections classified as developing phase. (K) ovary macroscopic morphology in the spawning capable phase, (L–N) ovary histology cross-sections classified as spawning capable phase. For ovary histological cross-sections, are showing: ovary wall (OW), chromatin nucleolar stage oocytes (CN), perinucleolar stage oocytes (PN), cortical alveolar stage oocytes (CA), primary vitellogenic stage oocytes (Vgt1), secondary vitellogenic stage oocytes (Vgt2), tertiary vitellogenic stage oocytes (Vgt3), germinal vesicle migration stage (GVM), hydrated oocytes (HO), and post-ovulatory follicles (POF). H&E stain, 200 or 100 µm bar, 5X - 40X objective.
According to the ovary histology cross-section analysis, it was possible to classify clarity four phases of fish reproductive cycle model in A. scapularis, because it was not possible to collect female specimens in the regression phase.
3.3 Biometric parameters and indices per reproductive cycle phases
Once the specimens of A. scapularis were classified concerning their reproductive cycle phases (immature, developing, spawning capable, regenerating), it was possible to analyze the biometric parameters and indices per phase. The sample size of the female specimens per phase was: Immature n=14, developing n=25, spawning capable n=27, and regenerating n=15. The primary statistical data for some biometric parameters and indices analyzed per phase are presented in Supplementary Table 1, and the proportion of each reproductive cycle phase obtained for each collection process performed is presented in Supplementary Figure 2.
The standard-length distribution registered significantly lower in the specimens classified as immature than the distributions in the specimens classified as developing (Z=-3.89, p=0.0001), spawning capable (Z=-5.92, p=3.28e-09), or regenerating (Z=-4.0, p=6.29e-05), see Figure 5A. Fulton’s condition factor (K) differences per reproductive cycle phase were not statistically significant, see Figure 5B. The GSI distribution observed in the specimens classified as spawning capable was significantly greater than in the specimens classified as immature (Z=7.44, p=9.95e-14), developing (Z=4.55, p=5.33e-06), or regenerating (Z=3.53, p=0.0004), see Figure 5C. Besides, GSI distribution for specimens classified as immature was significantly lower than the distributions in the specimens classified as developing (Z=-3.47, p=0.0007) or regenerating (Z=-3.32, p=0.0009), see Figure 5C.
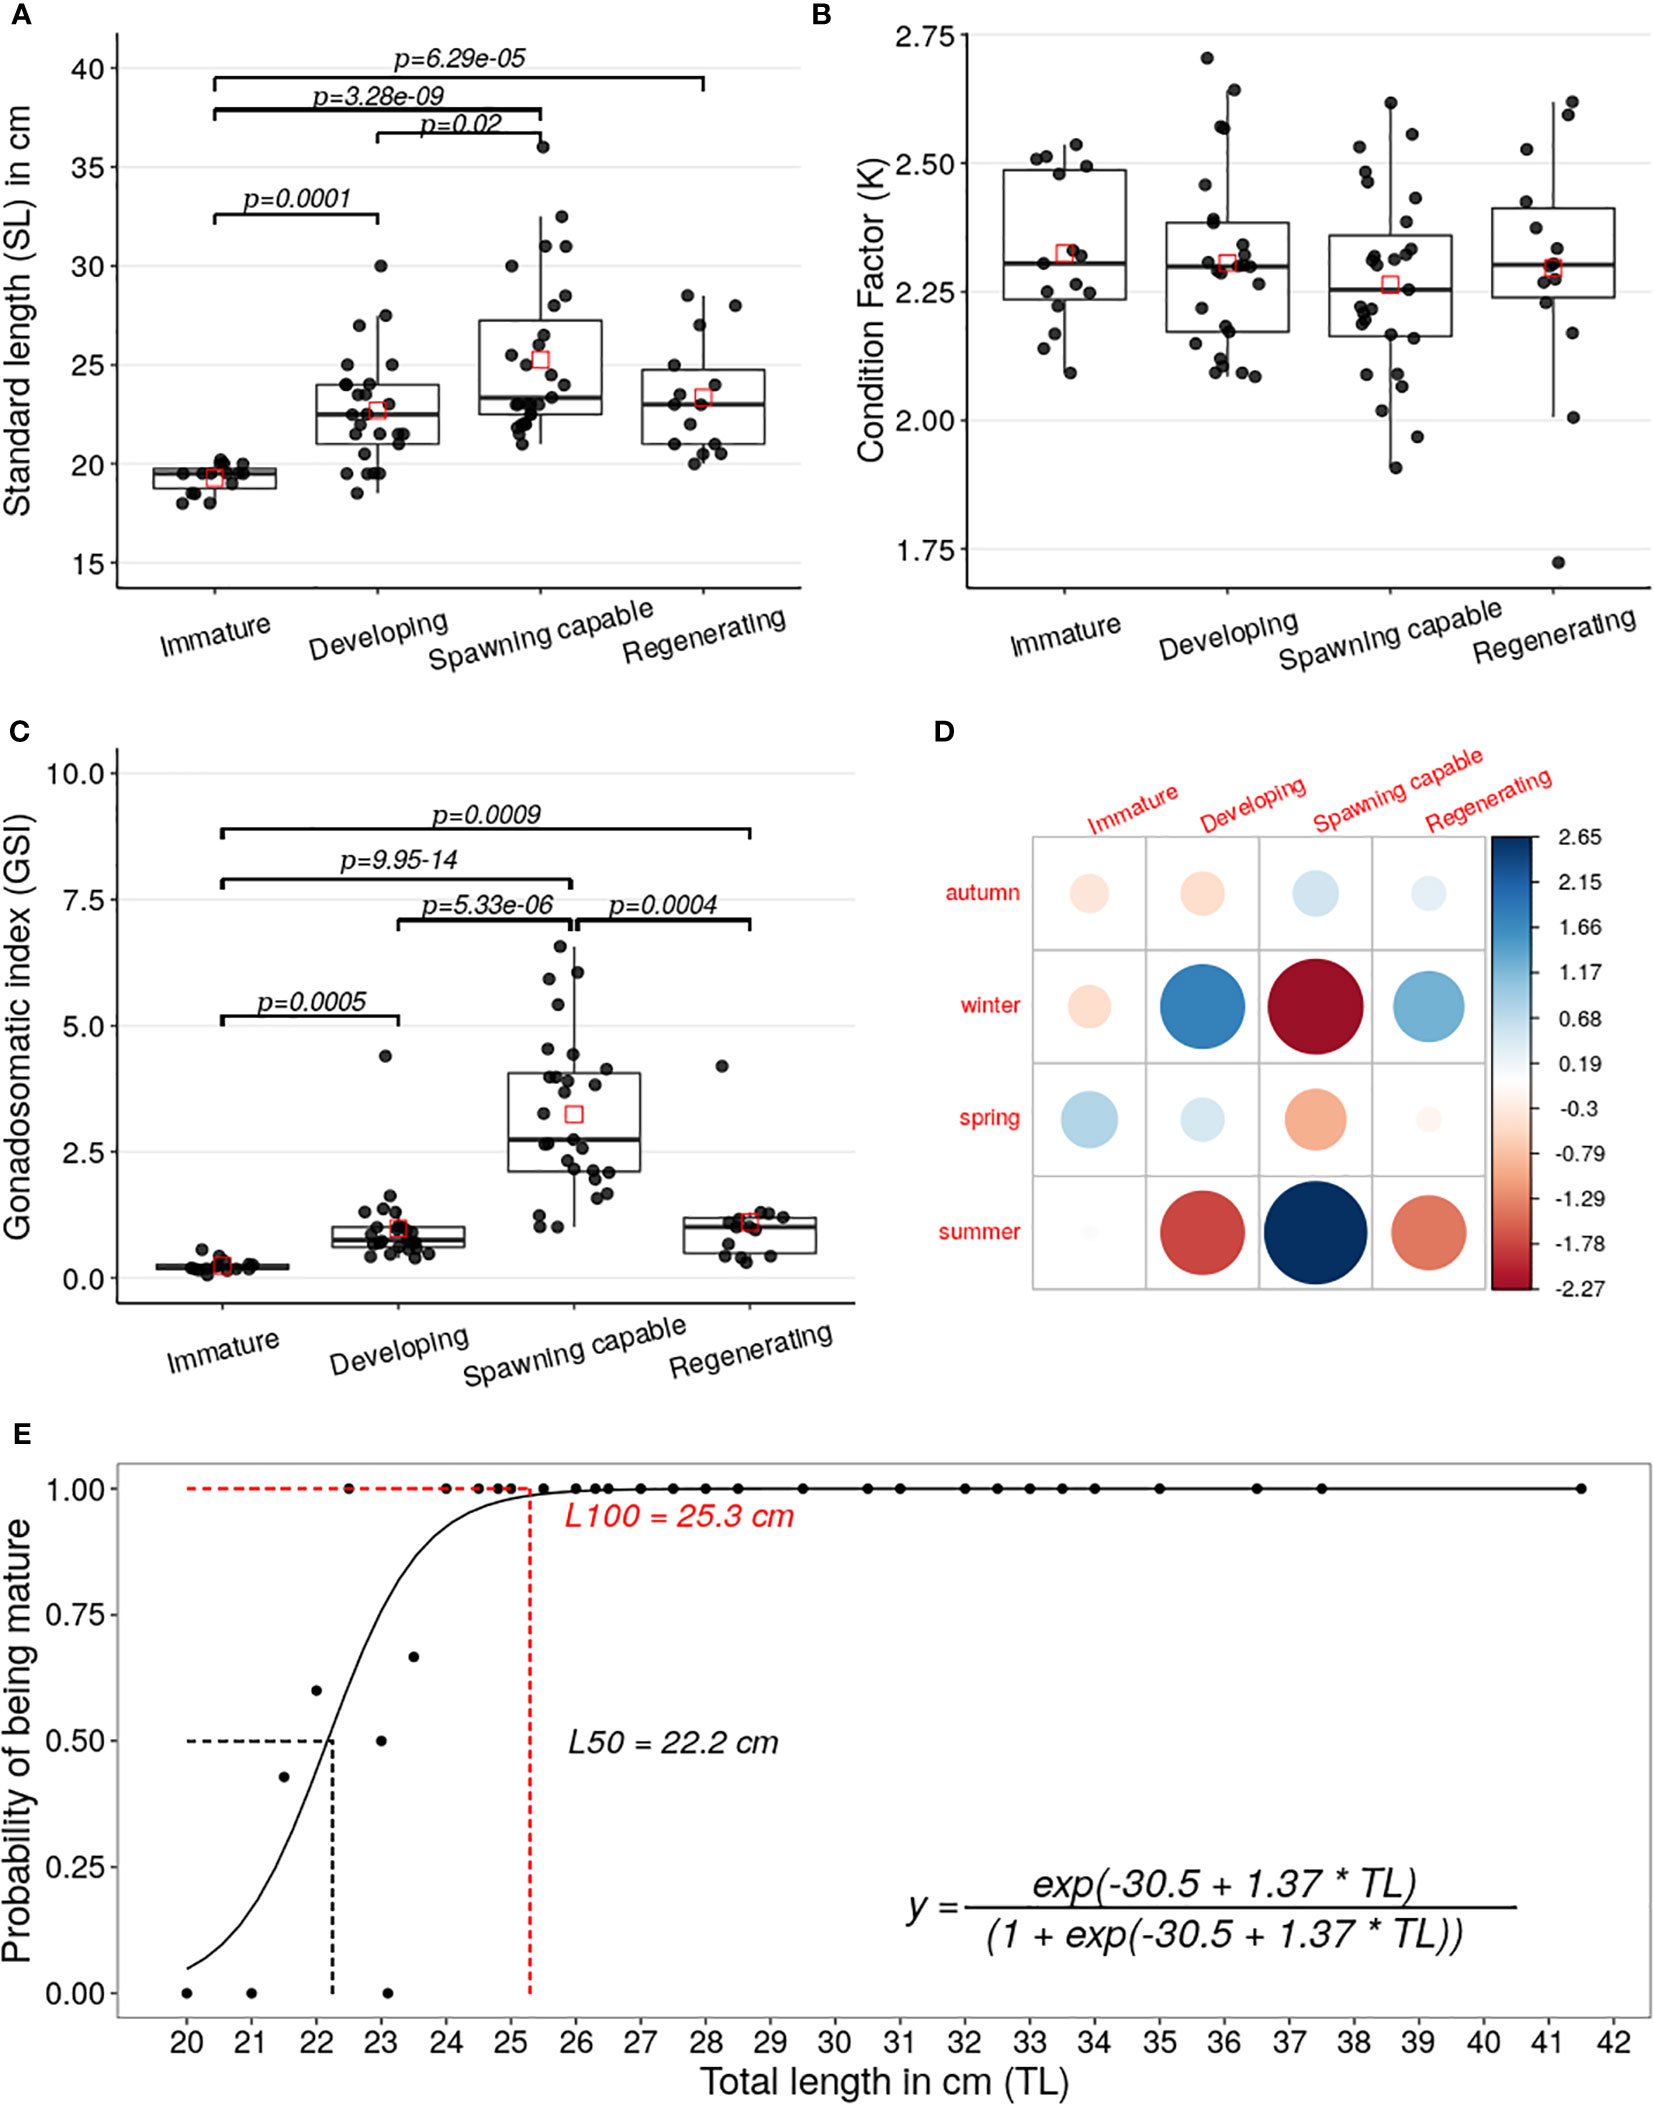
Figure 5 (A–C) Boxplots and scatterplots of the SL, K, and GSI of the A. scapularis females per phase of the reproductive cycle (immature n=14, developing n=25, spawning capable=27, and regenerating n=15). The black points correspond to the value of each specimen captured and the red squares correspond to the mean of each phase distribution. The lines show the statistically significant differences among phases of the reproductive cycle performed by Dunn’s test; the distribution differences were considered significant with a p-value < 0.05 and a p-adjusted value < 0.1. (D) A graphical display that shows the residual matrix of the Pearson’s chi-squared, which shows the main contributions between seasonality and reproductive cycle phases association; this analysis was performed by R with corrplot packages, the legend is the matrix residual scale. (E) Plot of the logit regression analysis for L50 and L100. The maturity was classified by ovary histology using the Brown-Peterson scale (Brown-Peterson, 2011). The black points show the relative frequency between the total length versus maturity of the collected specimens. The smooth line is the fitted logistic binomial model calculated from previous frequencies. The L50 and L100 were calculated from the logistic regression by the maximum-likelihood method. The dashed lines show the average of the estimated L50 (22.2 cm) in black and L100 (25.3 cm) in red, calculated from distributions performed by bootstrapping procedure with 2000 iterations of the logistic model.
The association analysis between the variables the capture seasons versus phases was statistically significant (X2 = 24.48, p=0.003), performed by Chi-square test. The Pearson’s Chi-squared residual analysis test allowed to establish that the main positive contributions to the association observed between both variables were the specimens classified as spawning capable phase with the summer seasons and the specimens classified as in developing phase with the winter season, see Figure 5D.
The size at first maturity (L50) average was 22.2 cm, with a 95% confidence interval between 22 and 23 cm, see Figure 5E. Additionally, the L100 average of 25.3 cm was calculated, with a 95% confidence interval between 24.8 and 26.9 cm.
3.4 Steroid profile analysis per reproductive cycle phases
A steroid profile was performed from previously obtained plasma samples by GC-EI-MS/MS analysis. The following steroidal metabolites were identified from serum samples from female A. scapularis specimens: 17β-estradiol, androstenedione-4, 5a-diol, 5b-diol, androsterone, estrone, etiocholanolone, and testosterone. The results of the basic statistical analysis on the serum steroid concentrations in ng mL-1 per reproductive cycle phase are presented in Supplementary Table 2. The plasma concentrations of the 17β-estradiol, androstenedione-4, and testosterone among the reproductive cycle phases were statistically significant, see Figure 6. The distribution of 17β-estradiol plasma concentrations in the specimens classified as spawning capable was significantly higher than the distributions in the specimens classified as immature (Z=4.19, p=3e-05), developing (Z=3.17, p=0.0015), or regenerating (Z=3.51, p=0.0004). The distribution of the androstenedione-4 plasma concentrations was significantly higher in the specimens classified as immature than the distribution in the specimens classified as spawning capable (Z=2.84, p=0.004). Finally, the distribution of the testosterone plasma concentration was significantly higher in the specimens classified as spawning capable than in specimens classified as immature or developing (Z=2.76, p=0.005, and Z=3.49, p=0.0005 respectively). In the same way, the distribution of testosterone plasma concentration was significantly higher in the specimens classified as regenerating than the distribution in the specimens classified as immature or developing (Z=2.40, p=0.01, and Z=3.13, p=0.0017 respectively).
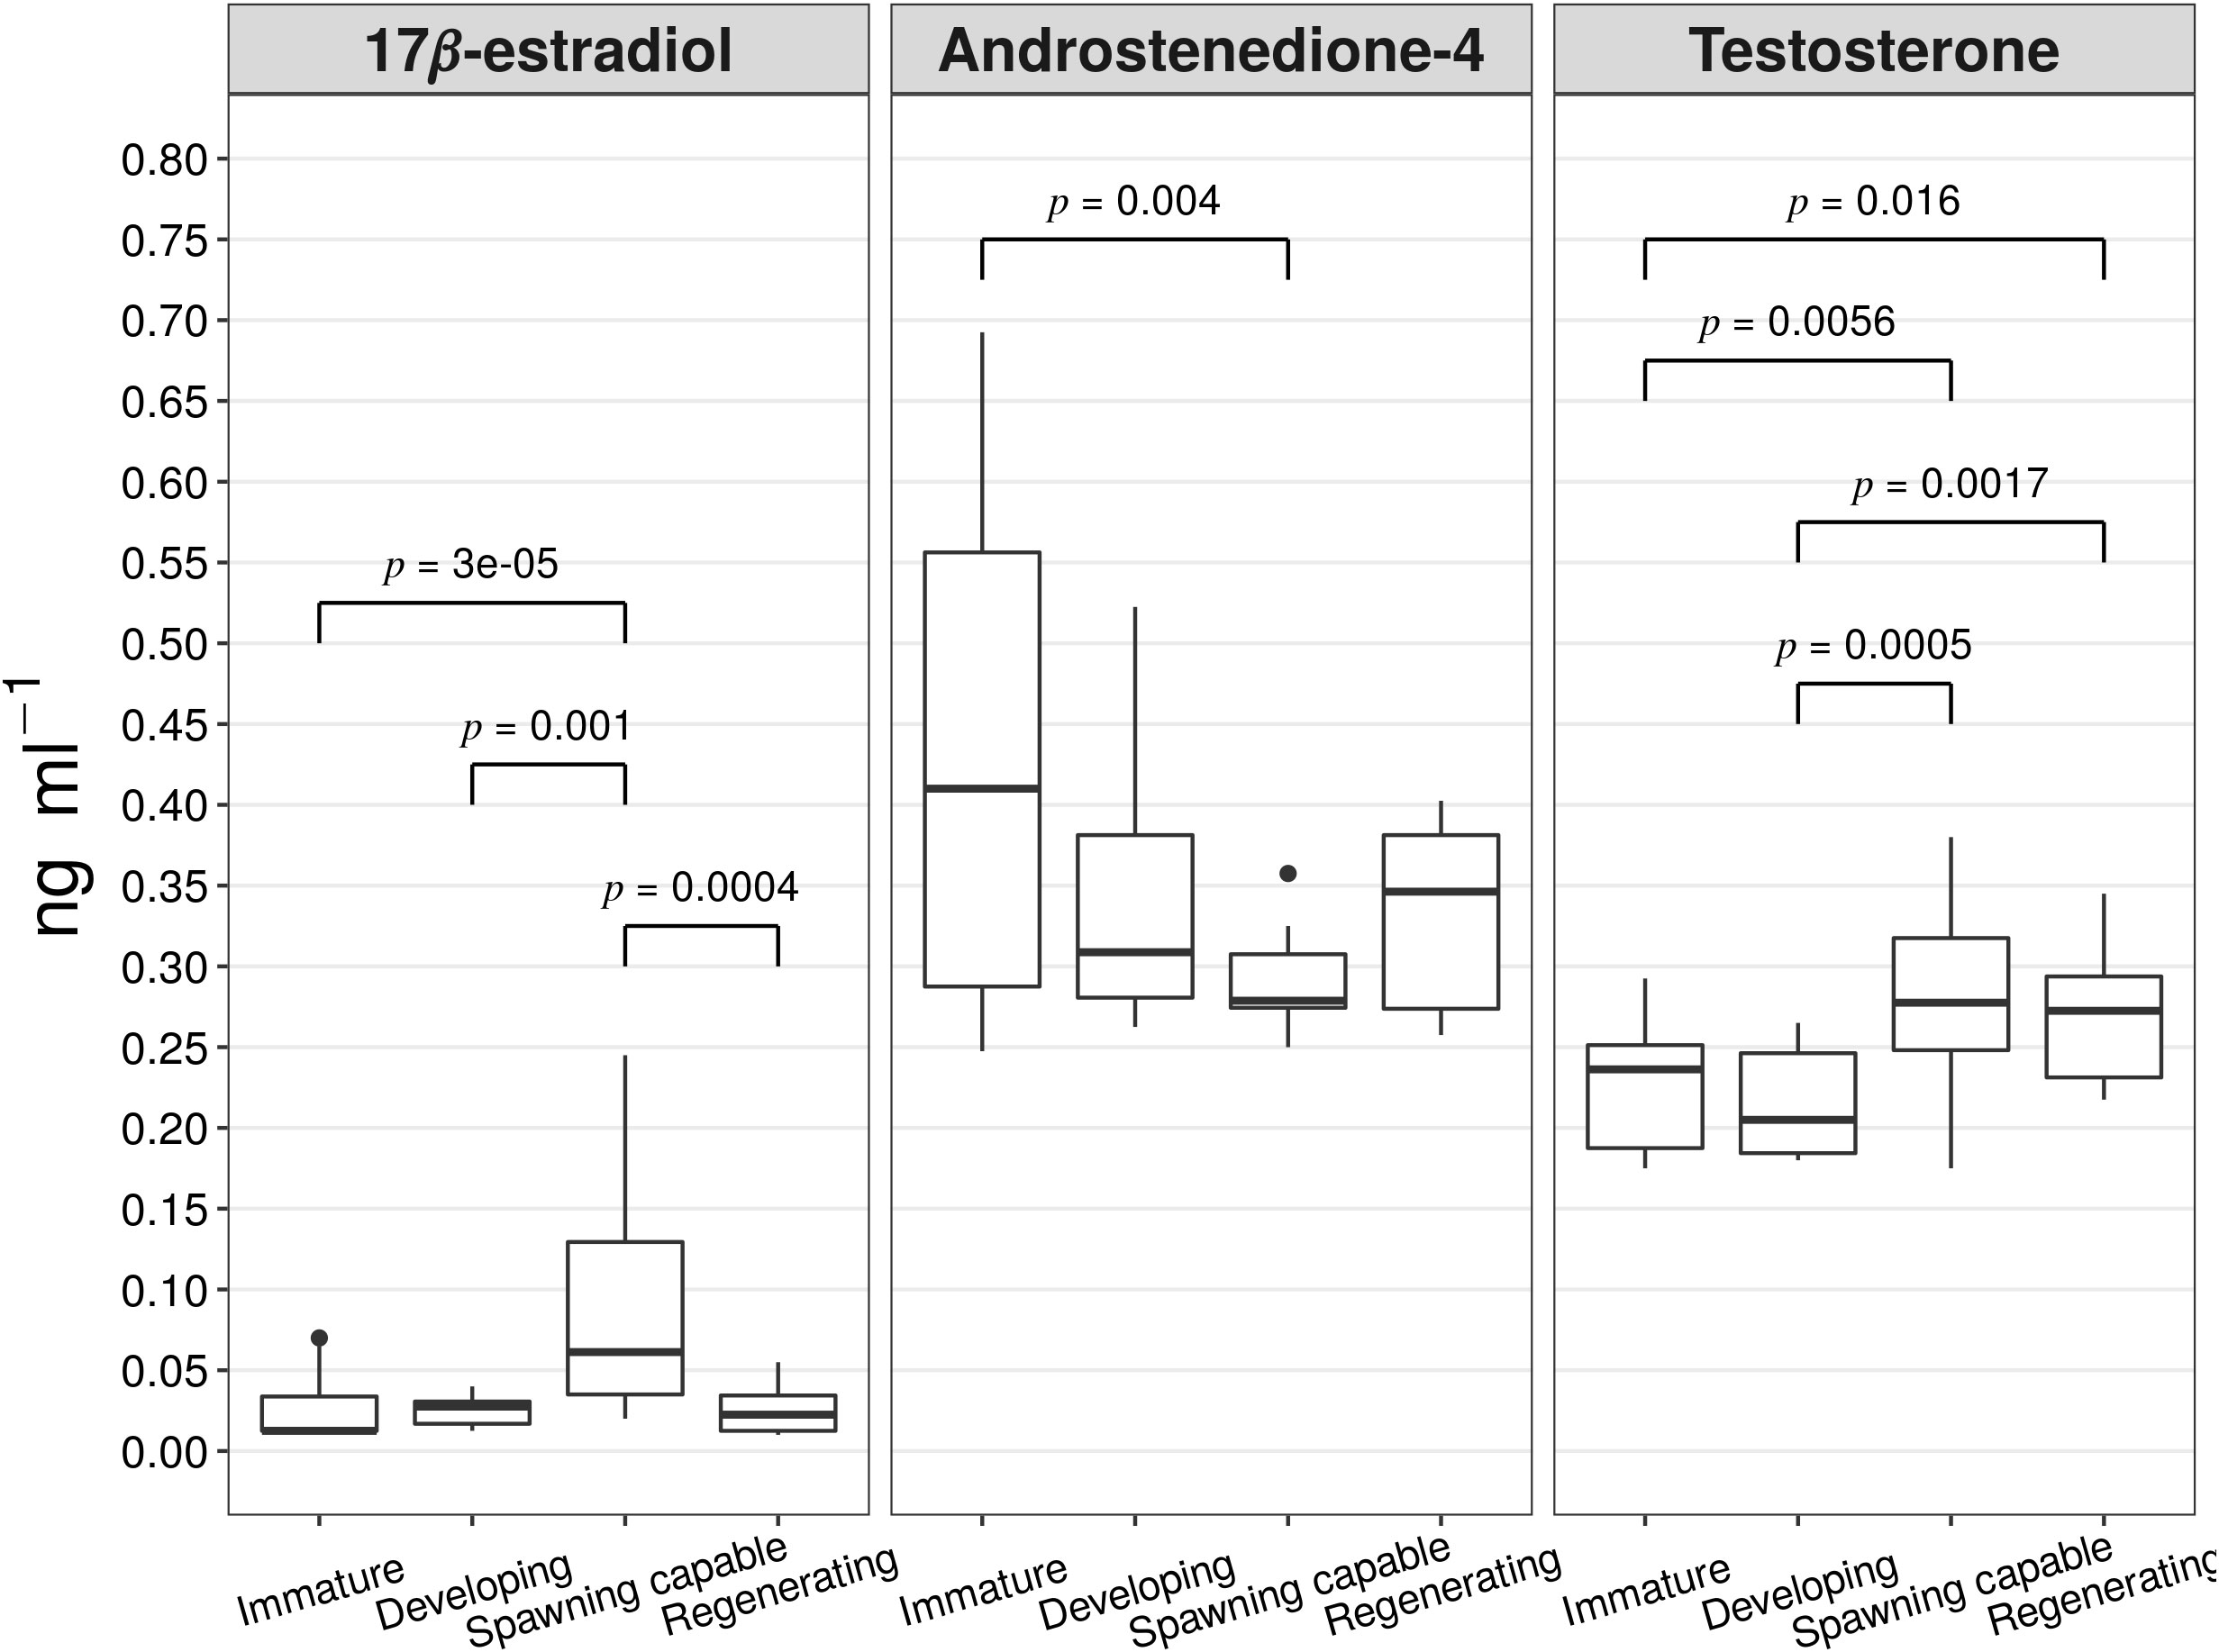
Figure 6 boxplots of the steroids concentrations in ng ml-1 (17β-estradiol, androstenedione-4, and testosterone) by reproductive cycle phase (immature n=8, developing n=8, spawning capable n=8, and regenerating n=8). The lines show the statistically significant differences among phases by Dunn’s Kruskal-Wallis multiple comparisons test; the distribution differences were considered significant with a p-value of < 0.05 and a p-adjusted value of < 0.1.
3.5 Surface temperature and daylight hours per day recorded in the collection marine area.
Through oceanographic registration systems, the ocean-surface temperature and the daylight hours per day associated with the study collection area for the years 2019 and 2020 were obtained. The season-average surface temperature registered for each year and the average for both years are presented in Supplementary Figure 1A. The pondered averages of the surface temperature per season were: 16.3 ± 0.88°C for summer, 16.05 ± 1.21 for autumn, 13.83 ± 0.57°C for winter, and 13.3 ± 0.95°C for spring; see Supplementary Figure 1A. The main changes in the surface temperature were observed between autumn and winter with a seasonal variation of -2.23°C and between spring and summer with a seasonal variation of +3.0°C. The daylight hours per day (photoperiod) are analyzed by month’s average and the data represent the light fluctuations at the latitude (12°07’11’’S) of the study collected marine area, see Figure 6B. The main fluctuation of daylight hours per day was observed between June and December, with an increase of 1.42 hours (85.2 minutes) of light per day.
4. Discussion
The study assessed parameters or indexes directly or indirectly, which allowed understand the female A. scapularis reproductive cycle and strategy, the knowledge that will allow improving the consolidation of aquaculture of this species.
Within the 131 specimens collected (males and females) in this research, was not possible to observe gonads in the transition process by the histological analysis. This result allows us to propose that A. scapularis is a gonochoric fish species without sexual dimorphism.
The reproductive cycle of fish is organized into phases, which are mainly defined by changes in ovary macroscopic morphology or ovary histology, wherein you can see the presence or absence of different oocyte stages (Murua and Saborido-Rey, 2003; Brown-Peterson et al., 2011; Lowerre-Barbieri et al., 2011).
The results of the cross-section histological analysis of the ovarian obtained from female specimens of A. scapularis were adequately fitted to the standardized scale of 5 phases for the fish reproductive cycle proposed by Brown-Peterson et al. (2011). However, it was not possible to collect female specimens in the regression phase. The sparse presence of regression-phase specimens has been previously described in other studies performed on the Anisotremus genera (Ruiz-Ramírez et al., 2012).
The seasonal fluctuations of the environmental signals such as temperature, or daylight hours per day (photoperiod) influence the reproductive cycle of fish (Bromage et al., 2001; Falcón et al., 2007). In the summer, an increase in the number of spawning capable A. scapularis females was observed. Jointly, the specimens showed a significant increase in their gonadosomatic index (GSI) and 17β-estradiol plasma concentrations. All these features suggest that the summer would be the main spawning season for A. scapularis on the marine coast of the Callao. However, due to the association between the autumn season and the spawning capable phase previously commented, the spawning season is likely to be longer than just the summer. It is possible that it begins in the late spring and ends in the middle of autumn; with a spawning season near the 5 months. Extensive spawning seasons in the Anisotremus genera have been previously described for A. interruptus, where the female specimens with ovarian maturity can be captured throughout the year (Ruiz-Ramírez et al., 2012).
As an asynchronous spawning with indeterminate fecundity, the reproductive strategy of A. scapularis was classified based on the ovary cross-section histology analysis. This reproductive strategy is characterized by oocyte recruitment in batches from vitelline oocyte subpopulations for later maturation and spawning (Lubzens et al., 2010). Hence, in the asynchronous spawning ovary, during the spawning season, it is possible to observe oocytes in different stages simultaneously (Murua and Saborido-Rey, 2003; Lubzens et al., 2010; Lowerre-Barbieri et al., 2011). This reproductive strategy allows the species to spawn over a long period (Muchlisin, 2014), which agrees with the 5-month spawning season discussed before. This reproductive strategy has also been previously described in A. interruptus and other species of the Haemulidae family, such as Haemulon plumierii (Palazón-Fernández, 2007; Shinozaki-Mendes et al., 2013). The average value of the GSI obtained in summer for A. scapularis females was 2.82. This is a low GSI value if compared to that described in other fish species. However, asynchronous spawning species with an indeterminate fecundity strategy have lower maximum levels of GSI in the spawning seasons than species with synchronous spawning dynamics (Nunes et al., 2011).
The specimens classified as spawning capable presented a higher level of 17β-estradiol plasma concentration than other reproductive cycle phases. This steroid has a central role in oocyte development, principally associated with vitellogenesis. Though the oocyte maturation process is regulated by maturation-inducing steroids (MIS) (Tokarz et al., 2015). In synchronous fish species, the fluctuations of the steroid plasma concentrations are very clearly defined and associated with the reproductive cycle phase or ovary development stage (Hainfellner et al., 2012). However, in asynchronous species, such as A. scapularis, this regulation is different since batches of oocytes in primary growth must be recruited throughout the spawning season. What has been described for asynchronous species with indeterminate fecundity is that 17β-estradiol and testosterone levels in females remain higher throughout the spawning season (Rinchard et al., 1997). It is worth mentioning that 17β-estradiol is synthesized from testosterone by the aromatase hormone (Tokarz et al., 2015). The Androstenedione-4 is the steroid precursor for the synthesis of testosterone by the enzymes 17beta-hydroxysteroid dehydrogenases (Tripathy et al., 2021). Hence in this sense, it is consistent to expect that the levels are reduced conversely with the synthesis of testosterone and increase in 17β-estradiol as observed in our study.
All the collected female specimens presented Fulton’s condition factor (K) higher than 1, being 1.72 the minimum value recorded. Hence, all specimens showed an overweight in their body conditions (Froese, 2006), independently of their season of collection or their reproductive cycle phase classification. The K values were significantly lower in summer than the values observed in other seasons. This has previously been described in other species, such as Haemulon plumierii (Palazón-Fernández, 2007; Solís-Flores et al., 2021). In addition, loss of the body condition during the spawning seasons has been previously described in many fish species, attributed to energy requirements involved in reproduction (Mouine et al., 2012). Nevertheless, the reproductive cycle phase spawning capability was not significantly associated with K lower values. As an approximation to better understand the decrease in K in summer was explored if the variation of the longitude categories could have influenced the decrease of K during the summer, this approximation was not significant either. Therefore, the reduction in body condition observed in summer affected all specimens equally regardless of their length or phase of the reproductive cycle. Data collected in the study does not allow us to understand the specific cause of this variation.
The residual matrix analysis of the Chi-square test between the reproductive cycle phases versus seasonality showed that the specimens captured in winter presented a positive association with the developing phase. This result indicates that A. scapularis females do not present reproductive latency after the spawning period, since during the winter it is possible to observe early vitellogenesis phases (CA, Vgt1) (Selman and Wallace, 1989; Brown-Peterson et al., 2011).
The hepatosomatic index (HSI) presented higher levels during summer and autumn, seasons which were associated with the spawning period. Subsequently, a significant reduction of this index was observed during the winter season. The reduction in the hepatosomatic indices is observed at the end of the spawning period, has been described in other fish species with an asynchronous spawning strategy (Rinchard et al., 1993; Arellano-Martínez et al., 2001; Murua and Saborido-Rey, 2003; Ruiz-Ramírez et al., 2012; Correa-Herrera and Jiménez-Segura, 2013). In A. scapularis, the HSI presented a seasonal modulation equivalent to the seasonal modulation observed for GSI. Nevertheless, in other species, such as Lutjanus guttatus, a seasonal inverse relationship between GSI and HSI levels has been described (Arellano-Martínez et al., 2001).
The length at first maturity corresponds to the index known as L50 or L100, which are defined as the total length in centimeter, where 50% or 100% of the individuals are mature respectively. For its calculation, it is necessary to establish the state of maturity of the specimens, which can be established through the use of GSI or histological analysis of the gonads (Fontoura et al., 2009). Reproductive classification based on histological techniques is a more precise method than macroscopic parameters such as GSI (Brown-Peterson et al., 2011). An L50 average of 22.2 cm was estimated for female A. scapularis collected specimens. Similar average lengths of L50s have been described in females of other species belonging to the Haemulidae family, such as Plectorhinchus gaterinus, with 23 cm (Amin et al., 2019) or Haemulon plumierii with 21.4 cm (Hoffmann et al., 2017). However, substantially smaller L50s are described in other species of this family, such as Haemulopsis corvinaeformis, H. aurolineatum, and H. squamipinna (Eduardo et al., 2018; Cardoso De Melo et al., 2020). Although the L50 provides substantial information in management the stock of wild populations. It seems that at the aquaculture level it is much more relevant to establish the L100, which average for A. scapularis females at 25.3 cm was calculated.
The development of new species for aquaculture begins with the formation of broodstock originally collected from wild areas. Faced with the need to obtain wild specimens of A. scapularis, it would be appropriate to carry out the capture process during the summer. During this season, the probability of capturing mature individuals increases markedly. The female wild specimens’ length screening criteria for a broodstock confirmation should only include individuals over 25.3 cm. Using temperature and daylight hours per day data recorded at the Callao coast, a thermo-photoperiod program was possible proposed for the management of broodstock, which considers two cycles. The first cycle associated with winter-spring and the stimulation of the early vitellogenesis should carry out with temperatures between 12.5 - 13.5°C with a photoperiod of 11/13 - light/darkness. Then, a second cycle associated with summer-autumn seasons and the later stages of oocyte development, oocyte maturation, and spawning should be increased to 16 - 17°C, with a photoperiod of 13/11 - light/darkness.
5. Conclusions
The results of the present study contribute to increasing knowledge associated with the reproductive biology of A. scapularis females on the coast of Callao, Perú. I can conclude the following:
• The macroscopic morphology and histological study results allow us to consider that the gender system of A. scapularis is gonochoristic, without sexual dimorphism.
• The A. scapularis spawning dynamic was classified as an asynchronous spawner with indeterminate fecundity.
• Summer is the main reproductive season of A. scapularis, observing female spawning activity until autumn.
• The size at first sexual maturity (L50) and (L100) reported in this study for A. scapularis were 22.2 cm and 25.3 cm, respectively.
Data availability statement
The original contributions presented in the study are included in the article/Supplementary Material. Further inquiries can be directed to the corresponding author.
Ethics statement
The animal study was reviewed and approved by IMARPE ethics committee.
Author contributions
LS: Investigation, Resources, Methodology, Formal analysis, Project administration, Writing - Original Draft, Funding acquisition. JF: Investigation, Methodology. GS: Formal analysis, Resources, Writing - Original Draft. MC: Methodology, Resources, Supervision, Writing - Review & Editing. RO: Conceptualization, Formal analysis, Supervision, Writing - Original Draft, Funding acquisition. All authors contributed to the article and approved the submitted version.
Funding
Also, we appreciate the financial support of Conicyt through the Fondecyt iniciación grant N° 11190532 and of the Aquaculture Management and Development Peruvian program, Budget No. 0094 associated with the Conditioning and Reproduction of prioritized species Anisotremus scapularis - Laboratorio de cultivo de peces - Instituto-Mar del Perú.
Acknowledgments
We want to express our gratitude to the Doctoral Program in Aquaculture, Cooperative Program between U. de Chile, UCN, and UCV for supporting this research. In particular, we would like to thank the professors Dr. Eduardo Uribe from the Universidad Católica del Norte (UCN) de Chile, Dr. Neil Duncan from the Instituto de Investigación y Tecnología Agroalimentaria (IRTA) de España, Msc. Maribel Ballido Alemán from the Universidad Nacional Autónoma de México (UNAM). To my friends and colleagues from the Instituto del Mar del Perú (IMARPE), researchers MSc. Noemí Cota, Ing. Angélica Castro, MSc. Marcos Medina, and MSc Leenin Flores.
Conflict of interest
The authors declare that the research was conducted in the absence of any commercial or financial relationships that could be construed as a potential conflict of interest.
Publisher’s note
All claims expressed in this article are solely those of the authors and do not necessarily represent those of their affiliated organizations, or those of the publisher, the editors and the reviewers. Any product that may be evaluated in this article, or claim that may be made by its manufacturer, is not guaranteed or endorsed by the publisher.
Supplementary material
The Supplementary Material for this article can be found online at: https://www.frontiersin.org/articles/10.3389/fmars.2022.1033718/full#supplementary-material
Supplementary Figure 1 | Histology cross-sections photomicrographs of A. scapularis ovaries, illustrating the oocyte development in different stages. (A) oocytes in perinucleolar stage (PN) or in the chromatin nucleolus stage (CN), 40X objective, (B) oocyte in cortical alveolar stage (CA), 20X objective. (C) primary vitellogenic oocytes stage (Vgt1), 20X objective. (D) secondary vitellogenic oocytes stage (Vgt2), 40X objective. (E) tertiary vitellogenic oocytes stage (Vgt3), 20X objective. (F) germinal vesicle migration (GVM) oocyte nucleus event, 20X objective. H&E stain, 100 µm bar.
Supplementary Figure 2 | Frequency plots of the phases of the A. scapularis reproductive cycle for each collection activity carried out for each year (2019-2020) of the research.
Supplementary Figure 3 | (A) Bar plots of the sea surface temperature recorded for the years 2019 and 2020 at the Callao marine area (latitude 12°7′11″ S, longitude 77°10′36″ W). The bars represent the average temperature observed per season and the lines are the standard deviation; the pondered average between 2019 and 2020 is also incorporated. (B) Line plot for the annual daylight hours per day oscillation, shown as a monthly average.
References
Amin A. M., El-Ganainy A. A., Sabrah M. M. (2019). Biological aspects and exploitation of Plectorhinchus gaterinus (Forsskal 1839) (F: Haemulidae) from the northern red Sea, El-tor, Egypt. Egyptian J. Aquat. Biol. Fish. 23, 405–413. doi: 10.21608/ejabf.2019.67371
Arellano-Martínez M., Rojas-Herrera A., García-Domínguez F., C.-V P. ,. B., Villalejo-Fuerte M. (2001). Ciclo reproductivo del pargo lunarejo Lutjanus guttatus (Steindachner 1869 ) en las costas de Guerrero , méxico Guerrero coast , Mexico introducción materiales y métodos. Mar. And Freshw. Res. 36, 1–8. doi: 10.4067/S0718-19572001000100001
Ben Ammar I., Milla S., Ledoré Y., Teletchea F., Fontaine P. (2020). Constant long photoperiod inhibits the onset of the reproductive cycle in roach females and males. Fish Physiol. Biochem. 46, 89–102. doi: 10.1007/s10695-019-00698-3
Boyd C. E., D'abramo L. R., Glencross B. D., Huyben D. C., Juarez L. M., Lockwood G. S., et al. (2020). Achieving sustainable aquaculture: Historical and current perspectives and future needs and challenges. J. World Aquacult. Soc. 51, 578–633. doi: 10.1111/jwas.12714
Bromage N., Porter M., Randall C. (2001). The environmental regulation of maturation in farmed finfish with special reference to the role of photoperiod and melatonin. Aquaculture 197, 63–98. doi: 10.1016/S0044-8486(01)00583-X
Brown-Peterson N. J., Wyanski D. M., Saborido-Rey F., Macewicz B. J., Lowerre-Barbieri S. K. (2011). A standardized terminology for describing reproductive development in fishes. Mar. Coast. Fish. 3, 52–70. doi: 10.1080/19425120.2011.555724
Cardoso De Melo C., Soares A. P. C., Pelage L., Eduardo L. N., Frédou T., Lira A. S., et al. (2020). Haemulidae distribution patterns along the northeastern Brazilian continental shelf and size at first maturity of the most abundant species. Regional Stud. Mar. Sci. 35, 1–11. doi: 10.1016/j.rsma.2020.101226
Carter K. M., Woodley C. M., Brown R. S. (2011). A review of tricaine methanesulfonate for anesthesia of fish. Rev. Fish Biol. Fish. 21, 51–59. doi: 10.1007/s11160-010-9188-0
Chirichigno Norma F. (2001). Catálogo comentado de los peces marinos del perú (Callao, Perú: Instituo del Mar del Perú (Imarpe).
Correa-Herrera T., Jiménez-Segura L. F. (2013). Biología reproductiva de Lutjanus guttatus (Perciformes: Lutjanidae) en el parque nacional natural utría, pacífico colombiano. Rev. Biol. Trop. 61, 829–840. doi: 10.15517/rbt.v61i2.11226
Dinno A. (2015). Nonparametric pairwise multiple comparisons in independent groups using dunn’s test. Stata J. 15, 292–300. doi: 10.1177/1536867X1501500117
Eduardo L. N., Lira A. S., Frédou T., Frédou F. L. (2018). Population structure and reproductive biology of Haemulopsis corvinaeformis (Perciformes, haemulidae) in the south coast of pernambuco, northeastern Brazil. Iheringia - Serie Zoologia 108, 1–8. doi: 10.1590/1678-4766e2018007
Falcón J., Besseau L., Sauzet S., Boeuf G. (2007). Melatonin effects on the hypothalamo–pituitary axis in fish. Trends Endocrinol. Metab. 18, 81–88. doi: 10.1016/j.tem.2007.01.002
Fontoura N. F., Braun A. S., Milani P. C. C. (2009). Estimating size at first maturity (L50) from gonadossomatic index (GSI) data. Neotropical Ichthyology 7, 217–222. doi: 10.1590/S1679-62252009000200013
Froese R. (2006). Cube law, condition factor and weight–length relationships: history, meta-analysis and recommendations. J. Appl. Ichthyology 22, 241–253. doi: 10.1111/j.1439-0426.2006.00805.x
Guzmán J. M., Norberg B., Ramos J., Mylonas C. C., Mañanós E. L. (2008). Vitellogenin, steroid plasma levels and spawning performance of cultured female Senegalese sole (Solea senegalensis). Gen. Comp. Endocrinol. 156, 285–297. doi: 10.1016/j.ygcen.2008.02.002
Hainfellner P., De Souza T. G., Moreira R. G., Nakaghi L. S. O., Batlouni S. R. (2012). Gonadal steroids levels and vitellogenesis in the formation of oocytes in Prochilodus lineatus (Valenciennes) (Teleostei: Characiformes). Neotropical Ichthyology 10, 601–612. doi: 10.1590/S1679-62252012005000021
Hoffman J. I. E. (2019). “Chapter 25 - analysis of variance. i. one-way,” in Basic biostatistics for medical and biomedical practitioners, 2nd ed. (Cambridge, Massachusetts: Academic Press), 391–417.
Hoffmann G. C. S., Freitas M. O., Moura R. L., Previero M., Abilhoa V. (2017). Reproductive biology of haemulon plumierii in the south-western Atlantic ocean's most extensive reefs: implications for fisheries management. J. Fish Biol. 90, 2111–2124. doi: 10.1111/jfb.13293
Humason G. L. (1979). Animal tissue techniques. (San Francisco, California, USA: WH Freeman and Company).
Leary S., Yanong R., Underwood W., Raymond A., Cartner S., Temple G., et al. (2020). “AVMA guidelines for the euthanasia of animals: 2020 edition. American veterinary medical association. "AVMA guidelines for the euthanasia of animals: 2013 edition.",” in Journal of the American veterinary medical association, (2013). (Schaumburg, IL, USA: American Veterinary Medical Association). Available at: https://www.avma.org/KB/Policies/Documents/euthanasia.pdf.
Lee V. H. Y., Lee L. T. O., Chow B. K. C. (2008). Gonadotropin-releasing hormone: regulation of the GnRH gene. FEBS J. 275, 5458–5478. doi: 10.1111/j.1742-4658.2008.06676.x
Levavi-Sivan B., Bogerd J., Mañanós E. L., Gómez A., Lareyre J. J. (2010). Perspectives on fish gonadotropins and their receptors. Gen. Comp. Endocrinol. 165, 412–437. doi: 10.1016/j.ygcen.2009.07.019
Lowerre-Barbieri S. K., Ganias K., Saborido-Rey F., Murua H., Hunter J. R. (2011). Reproductive timing in marine fishes: Variability, temporal scales, and methods. Mar. Coast. Fish. 3, 71–91. doi: 10.1080/19425120.2011.556932
Lubzens E., Young G., Bobe J., Cerdà J. (2010). Oogenesis in teleosts: How fish eggs are formed. Gen. Comp. Endocrinol. 165, 367–389. doi: 10.1016/j.ygcen.2009.05.022
Luna L. G. (1968). Manual histological staining methods of the armed forces institute of patobiology. (McGraw-Hill: Blakiston Division).
Maitra S. K., Seth M., Chattoraj A. (2006). Photoperiod, pineal photoreceptors and melatonin as the signal of photoperiod in the regulation of reproduction in fish. J. Endocrinol. Reprod. 10, 73–87.
Mangiafico S. S. (2016). Summary and analysis of extension program evaluation in r, version 1.13. 4: Least square means for multiple comparisons. (New Brunswick: Rutgers Cooperative Extension).
Matysik S., Schmitz G. (2015). Determination of steroid hormones in human plasma by GC–triple quadrupole MS. Steroids 99, 151–154. doi: 10.1016/j.steroids.2015.01.016
Maxwell A. E. (1978). “Contingency tables and tests of association,” in Basic statistics: For medical and social science students. Ed. Maxwell A. E. (Dordrecht: Springer Netherlands), 73–78.
Mishra P., Pandey C. M., Singh U., Gupta A., Sahu C., Keshri A. (2019). Descriptive statistics and normality tests for statistical data. Ann. Cardiac Anaesthesia 22, 67–72. doi: 10.4103/aca.ACA_157_18
Morales Y., Fernandez A. J. M., Gomez C., Castellacci A.-A., Ferreyros P., Flores F., et al. (2021). Hoja de ruta para el cultivo de peces marinos en el Perú (Lima, Perú: Programa Nacional de Innovación en Pesca y Acuicultura).
Mouine N., Francour P., Ktari M. H., Chakroun-Marzouk N. (2012). Reproductive biology of four diplodus species Diplodus vulgaris, D. annularis, D. sargus sargus and D. puntazzo (Sparidae) in the gulf of Tunis (central Mediterranean). J. Mar. Biol. Assoc. U. K. 92, 623–631. doi: 10.1017/S0025315411000798
Muchlisin Z. A. (2014). A general overview on some aspects of fish reproduction. Aceh Int. J. Sci. Technol. 3, 43–52. doi: 10.13170/AIJST.0301.05
Murua H., Kraus G., Saborido-Rey F., Wittames P. R., Thorsen A., Junquera S. (2003). Procedures to estimate fecundity of wild collected marine fish in relation to fish reproductive strategy. J. Northwest Atlantic Fishery Sci. 33, 33–54. doi: 10.2960/J.v33.a3
Murua H., Saborido-Rey F. (2003). Female reproductive strategies of marine fish species of the north Atlantic. J. Northwest Atlantic Fishery Sci. 33, 23–31. doi: 10.2960/J.v33.a2
National Research Council (2011). Guide for the care and use of laboratory animals (Washington (DC), USA: The National Academies Press). [Google Scholar].
Nunes C., Silva A., Soares E., Ganias K. (2011). The use of hepatic and somatic indices and histological information to characterize the reproductive dynamics of Atlantic sardine Sardina pilchardus from the Portuguese coast. Mar. Coast. Fish. 3, 127–144. doi: 10.1080/19425120.2011.556911
Oliveira M. R., Silva N. B., Yamamoto M. E., Chellappa S. (2015). Gonad development and reproduction of the ballyhoo half beak, Hemiramphus brasiliensis from the coastal waters of Rio grande do norte, Brazil. Braz. J. Biol. 75, 324–330. doi: 10.1590/1519-6984.12113
Palazón-Fernández J. L. (2007). Reproduction of the white grunt, Haemulon plumerii (Lacépede 1802) (Pisces: Haemulidae) from margarita island, Venezuela. Scientia Marina 71, 429–440. doi: 10.3989/scimar.2007.71n3429
R Core Team (2021). R: A language and environment for statistical computing (Vienna, Austria: R Foundation for Statistical Computing).
Reading B. J., Andersen L. K., Ryu Y.-W., Mushirobira Y., Todo T., Hiramatsu N. (2018). Oogenesis and egg quality in finfish: Yolk formation and other factors influencing female fertility. Fishes 3, 1–28. doi: 10.3390/fishes3040045
Ricker W. E. (1975). “Computation and interpretation of biological statistics of fish populations,” in Bulletin of the fisheries research board of Canada (Ottawa, Canada: Department of the Environment, Fisheries and Marine Service), 1–382.
Rinchard J., Kestemont P., Heine R. (1997). Comparative study of reproductive biology in single and multiple-spawner cyprinid fish. II. sex steroid and plasma protein phosphorus concentrations. J. Fish Biol. 50, 169–180. doi: 10.1111/j.1095-8649.1997.tb01349.x
Rinchard J., Kestemont P., Kühn E. R., Fostier A. (1993). Seasonal changes in plasma levels of steroid hormones in an asynchronous fish the gudgeon Gobio gobio l. (Teleostei, cyprinidae). Gen. Comp. Endocrinol. 92, 168–178. doi: 10.1006/gcen.1993.1153
Robert J. W., Carl S. (2015a). “Gametogenesis,” in Reproductive biology of teleost fishes. Eds. Robert E.S. J. W., Carl S. (Oxford, UK: John Wiley & Sons, Ltd), 45–80.
Robert J. W., Carl S. (2015b). “Introduction,” in Reproductive biology of teleost fishes. Eds. Robert E.S. J. W., Carl S. (Oxford, UK: John Wiley & Sons, Ltd), 1–12.
Ruiz-Ramírez S., Lucano-Ramírez G., González-Sansón G., Arellano-Martínez M. (2012). Biología reproductiva de Anisotremus interruptus (Perciformes : Haemulidae) en el pacífico central mexicano. Revista de Biología Tropical 60, 709–720. doi: 10.4067/S0718-19572001000100001
Saborido-Rey F., Junquera S. (1998). Histological assessment of variations in sexual maturity of cod (Gadus morhua l.) at the Flemish cap (north-west Atlantic). ICES J. Mar. Sci. 55, 515–521. doi: 10.1006/jmsc.1997.0344
Sang H. M., Lam H. S., Hy L. H. K., Ky P. X., Minh-Thu P. (2019). Changes in plasma and ovarian steroid hormone level in wild female blue tang fish Paracanthurus hepatus during a reproductive cycle. Animals 9, 1–10. doi: 10.3390/ani9110889
Selman K., Wallace R. A. (1989). Cellular aspects of oocyte growth in teleosts. Zoological science, 331–211.
Shinozaki-Mendes R. A., Santander-Neto J., Silva J. R. F., Hazin F. H. V. (2013). Reproductive biology of Haemulon plumerii (Teleostei: Haemulidae) in ceará state, northeastern Brazil. Braz. J. Biol. 73, 391–396. doi: 10.1590/S1519-69842013000200020
Solís-Flores D., Villegas-Hernández H., Poot-López G., Díaz-Gamboa R., González-Salas C., Guillén-Hernández S., et al. (2021). Reproductive biology of the white grunt, Haemulon plumerii, in the coastal waters of the northern Yucatán Peninsula. Revista mexicana de biodiversidad 92, 1–13.
Teletchea F., Fontaine P. (2012). Levels of domestication in fish: implications for the sustainable future of aquaculture. Fish Fish. 15, 181–195. doi: 10.1111/faf.12006
Tokarz J., Möller G., Hrabě De Angelis M., Adamski J. (2015). Steroids in teleost fishes: A functional point of view. Steroids 103, 123–144. doi: 10.1016/j.steroids.2015.06.011
Toribio-Delgado A. F., Maynar-Mariño M., Caballero-Loscos M. J., Robles-Gil M. C., Olcina-Camacho G. J., Maynar-Mariño J. I. (2012). Qualification and quantification of seventeen natural steroids in plasma by GC–Q-MS and GC-IT–MS/MS. J. Chromatographic Sci. 50, 349–357. doi: 10.1093/chromsci/bms009
Tripathy P. S., Parhi J., Mandal S. C. (2021). “Steroids and its receptors in fish reproduction,” in Recent updates in molecular endocrinology and reproductive physiology of fish: An imperative step in aquaculture. Eds. Sundaray J. K., Rather M. A., Kumar S., Agarwal D. (Singapore: Springer Singapore), 53–61.
Wei T., Simko V. (2017). R package ‘“corrplot”: Visualization of a correlation matrix (version 0.84). Available at: https://github.com/taiyun/corrplot.
Yousefian M., Mousavi S. E. (2011). The mechanism of reproduction and hormonal function in finfish species: A review. Sci. Res. Essays 6, 3561–3570. doi: 10.5897/SRE10.015
Keywords: Anisotremus scapularis, sex steroid profile, fish ovary histology, GC-EI-MS/MS, spawning dynamics
Citation: Carrera Santos LJ, Fontes JG, Santos GRCD, Padilha MC and Opazo R (2022) Reproductive cycle of the female Anisotremus scapularis (Tschudi, 1846) on the marine coast of Callao, basic knowledge to go towards its aquaculture. Front. Mar. Sci. 9:1033718. doi: 10.3389/fmars.2022.1033718
Received: 31 August 2022; Accepted: 19 October 2022;
Published: 09 November 2022.
Edited by:
Alejandro S. Mechaly, Instituto de Investigaciones en Biodiversidad y Biotecnología (INBIOTEC) (CONICET), ArgentinaReviewed by:
Sergio Batlouni, Universidade Estadual Paulista, BrazilMohammad Abdul Momin Siddique, Noakhali Science and Technology University, Bangladesh
Copyright © 2022 Carrera Santos, Fontes, Santos, Padilha and Opazo. This is an open-access article distributed under the terms of the Creative Commons Attribution License (CC BY). The use, distribution or reproduction in other forums is permitted, provided the original author(s) and the copyright owner(s) are credited and that the original publication in this journal is cited, in accordance with accepted academic practice. No use, distribution or reproduction is permitted which does not comply with these terms.
*Correspondence: Rafael Opazo, ropazo@inta.uchile.cl